1
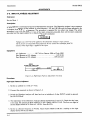
Errata
Title & Document Type: 8903E Operation & Calibration
Manual
Manual Part Number: 08903-90053
Revision Date: July 1985
HP References in this Manual
This manual may contain references to HP or Hewlett-Packard. Please note that HewlettPackard's former test and measurement, semiconductor products and chemical analysis
businesses are now part of Agilent Technologies. We have made no changes to this
manual copy. The HP XXXX referred to in this document is now the Agilent XXXX.
For example, model number HP8648A is now model number Agilent 8648A.
About this Manual
We’ve added this manual to the Agilent website in an effort to help you support your
product. This manual provides the best information we could find. It may be incomplete
or contain dated information, and the scan quality may not be ideal. If we find a better
copy in the future, we will add it to the Agilent website.
Support for Your Product
Agilent no longer sells or supports this product. You will find any other available
product information on the Agilent Test & Measurement website:
www.tm.agilent.com
Search for the model number of this product, and the resulting product page will guide
you to any available information. Our service centers may be able to perform calibration
if no repair parts are needed, but no other support from Agilent is available.
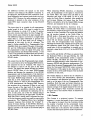
HP 8903E
Distortion Analyzer
Operation and
Calibration Manual
a
a
a
e
e
0
e
e
0
e
e
a
a
a
.....
......
.
:..
...e
e
.
0 0 . .
..
Ag iIent TechnoIogies
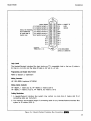
HP 8903E
DISTORTION ANALYZER
(Including Option 001)
SERIAL NUMBERS
This manual applies directly to instruments with
serial numbers prefixed 2507A and 2516A.
For additional important information about serial
numbers, see Instruments Covered by Manual in
Section 1.
First Edition
@HEWLET-PACKARD COMPANY 1985
EAST 24001 MISSION AVENUE, TAF C-34, SPOKANE, WASHINGTON, U S A . , 99220
Operation and Calibration Manual Part No. 08903-90053
Operation and Calibration Manual Microfiche Part No. 90069
Printed: JULY 1985
1 Regulatory Information
(Updated March 1999)
1
Regulatory Information (Updated March 1999)
Safety Considerations
GENERAL
This product and related documentation must be reviewed for familiarization with safety
markings and instructions before operation.
This product has been designed and tested in accordance with IEC Pubhation 1010,
"Safety Requirements for Electronic Measuring Apparatus," and has been supplied in a
safe condition. This instruction documentation contains information and warnings which
must be followed by the user to ensure safe operation and to maintain the product in a safe
condition.
SAFETY EARTH GROUND
A uninterruptible safety earth ground must be provided from the main power source to the
product input wiring terminals, power cord, or supplied power cord set.
A
SAFETY SYMBOLS
Indicates instrument damage can occur if indicated operating limits are exceeded.
Indicates hazardous voltages.
Indicates earth (ground) terminal
WARNING
A WARNING note denotes a hazard. It calls attention to a procedure,
practice, or the like, which, if not correctly performed or adhered to,
could result in personal injury.Do not proceed beyond a WARNING
sign until the indicated conditions are fulls understood and met.
CAUTION
A CAUTION note denotes a hazard. It calls attention to a n operation
procedure, practice, or the like, which, if not correctly performed or adhered
to, could result in damage to or destruction of part or all of the product. Do
not proceed beyond an CAUTION note until the indicated conditions are fully
understood and met.
2
Chapter 1
Regulatory Information (Updated March 1999)
Safety Considerations for this Instrument
WARNING
This product is a Safety Class I instrument (provided with a
protective earthing ground incorporated in the power cord). The
mains plug shall only be inserted in a socket outlet provided with a
protective earth contact. Any interruption of the protective
conductor inside or outside of the product is likely to make the
product dangerous. Intentional interruption is prohibited.
Whenever it is likely that the protection has been impaired, the
instrument must be made inoperative and be secured against any
unintended operation.
If this instrument is to be energized via an auto transformer (for
voltage reduction), make sure the common terminal is connected to
the earth terminal of the power source.
If this product is not used as specified, the protection provided by
the equipment could be impaired. This product must be used in a
normal condition (in which all means for protection are intact) only.
No operator serviceable parts in this product. Refer servicing to
qualified personnel. To prevent electrical shock, do not remove
covers.
Servicing instructions are for use by qualified personnel only. To
avoid electrical shock, do not perform any servicing unless you are
qualified to do so.
The opening of covers or removal of parts is likely to expose
dangerous voltages. Disconnect the product from all voltage sources
while it is being opened.
The power cord is connected to internal capacitors that my remain
live for 5 seconds after disconnecting the plug from its power supply.
For Continued protection against fire hazard, replace the line fuse(s)
only with 250 V fuse(s)or the same current rating and type (for
example, normal blow or time delay). Do not use repaired fuses or
short circuited fuseholders.
Always use the three-prong ac power cord supplied with this
product. Failure to ensure adequate earth grounding by not using
this cord may cause product damage.
This product is designed for use in Installation Category I1 and
Pollution Degree 2 per IEC 1010 and IEC 664 respectively. FOR
INDOOR USE ONLY.
This product has autoranging line voltage input, be sure the supply
voltage is within the specified range.
Chapter 1
3
Regulatory Information (Updated March 1999)
To prevent electrical shock, disconnect instrument from mains (line)
before cleaning, Use a dry cloth or one slightly dampened with water
to clean the external case parts. D o not attempt to clean internally.
Ventilation Requirements: When installing the product in a cabinet,
the convection into and out of the product must not be restricted.
The ambient temperature (outside the cabinet) must be less than the
maximum operating temperature of the product by 4" C for every 100
watts dissipated in the cabinet. If the total power dissipated in the
cabinet is greater than 800 watts, then forced convection must be
used.
Product Markings
CE - the CE mark is a registered trademark of the European Community. A CE mark
accompanied by a year indicated the year the design was proven.
CSA - the CSA mark is a registered trademark of the Canadian Standards Association.
Chapter 1
Model 89033
Safety Considerations
SAFETY CONSIDERATIONS
GENERAL
This product and related documentation must be reviewed for familiarization with safety markings and
instructions before operation.
This product is a Safety Class I instrument (provided
with a protective earth terminal).
BEFORE APPLYING POWER
Verify that the product is set to match the available
line voltage and the correct fuse is installed.
SAFETY EARTH GROUND
An uninterruptible safety earth ground must be provided from the main power source to the product input
wiring terminals, power cord, or supplied power cord
set.
SAFETY SYMBOLS
Instruction manual symbol: the product will
be marked with t h i s symbol when i t
is necessary for the user to refer to the instruction
manual (refer to Table of Contents).
f
Indicates hazardous voltages.
Indicates earth (ground) terminal.
The WARNING sign denotes a
hazard. It calls attention to a
procedure, practice, or the like, which, if not correctly
performed or adhered to, could result in personal injury. Do not proceed beyond a WARNING sign until
the indicated conditions are fully understood and met.
The CAUTION sign denotes a haza r d . I t calls a t t e n t i o n t o an
operating procedure, practice, or the like, which, if not
correctly performed or adhered to, could result in damage to or destruction of part or all of the product. Do
not proceed beyond a CAUTION sign until the indicated conditions are fully understood and met.
A n y interruption of the protective (grounding) conductor (inside or outside the instrument) or disconnecting the protective earth
terminal will cause a potential shock hazard
that could result i n personal injury. (Grounding one conductor of a two conductor outlet
is not sufficient protection).
Whenever it is likely that the protection has
been impaired, the instrument must be made
inoperative and be secured against any unintended operation.
I f this instrument is to be energized via an
autotransformer (for voltage reduction) make
sure the common terminal is connected to the
earth terminal of the power source.
Servicing instructions are for use by servicetrained personnel only. To avoid dangerous
electric shock, do not perform any servicing
unless qualified to do so.
Adjustments described in the manual are performed with power supplied to the instrument
while protective covers are removed. Energy
available at many points may, if contacted, result i n personal injury.
Capacitors inside the instrument may still be
charged even if the instrument has been disconnected from its source of supply.
For continued protection against fire hazard,
replace the line fuse(s) only with 250V fuse(s)
of the same current rating and type (for example, normal blow, time delay, etc.). Do not use
repaired fuses o r short circuited
fuseholders.
...
111
Safety Considerations
Model 89033
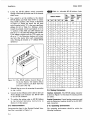
ATTENTION
Static Sensitive
Devices
This instrument was constructed in an E S D (electro-static discharge) protected environment. This is because most of the semiconductor devices used in this instrument are susceptible to damage
by static discharge.
Depending on the magnitude of the charge, device substrates can
be punctured or destroyed by contact or mere proximity of a static
charge. The results can cause degradation of device performance,
early failure, or immediate destruction.
These charges are generated in numerous ways such as simple contact, separation of materials, and normal motions of persons
working with static sensitive devices.
W h e n handling or servicing equipment containing static sensitive
devices, adequate precautions must be taken to prevent device damage or destruction.
Only those who are thoroughly familiar with industry accepted
techniques for handling static sensitive devices should attempt to
service circuitry with these devices.
I n all instances, measures must be taken to prevent static charge
build-up on work surfaces and persons handling the devices.
For further information on E S D precautions, refer to “SPECIAL
HANDLING CONSIDERATIONS FOR STATIC S E N S I T I V E
D E VICES” in Section VIII Service Section.
iv
Model 8903E
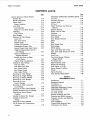
Table of Contents
CONTENTS
VOLUME 1
Section 1
GENERAL INFORMATION
Page
.
Introduction . . . . . . . . . . . . . . . . . . . . .
Specifications . . . . . . . . . . . .
. . . . . . . . . . 1-1
Safety Considerations
.....................
1-1
Instruments Covered by Manual . . . . . . . . . . . . . . . . . . 1-1
Serial Numbers . . . . . . . . . . . . . . . . . . . . . . . . . . . . . 1-1
Options . . . . . . . . . . . . . . . . . . . . . . . . . . . . . .
. . 1-2
Manual Changes Supplement . . . . . .
. . . . . . . . . 1-2
. . . . . . . . . . . . . . . . . 1-2
.............................
1-2
Audio Testing . . . . . . . . . . . . . . . . . . . . . . . . . . . . . . . .
1-2
Balanced Input ..........................
Transceiver Testing
. . . . . . . . . . . . . . . . . 1-3
Systems . . . . . . . . . . . . . . . . . . . . . . . . . . . . . . . . . . . . . .
1-3
Options . . . . . . . . . . . . . . . . . . . . . . . . . . . . . . . . . . . . . . . .
1-3
Electrical Options .............................
1-3
Electrical Option 001 ........................
1-3
Internal Plug-in Filter Options . . . . . . . . . . . . . . . . 1-3
Mechanical Options ...........................
1-4
Front Handle Kit (Option 907) . . . . . . . . . . . . . . . 1-4
Rack Flange Kit (Option 908) . . . . . . . . . . . . . . . . 1-4
Rack Flange and Front Handle
Combination Kit (Option 909) . . . . . . . . . . . . . . 1-4
Hewlett-Packard Interface
BUS (HP-IB) .................................
1-4
Compatibility
. . . . . . . . . . . . 1-4
Selecting the HP-IB Address . . . . . . . . . . . . . . . . . . . 1-4
Accessories Supplied . . . . . . . . . . . . . . . . . . . . . . . . . . . . .
1-4
Electrical Equipment Available . . . . . . . . . . . . . . . . . . . 1-4
HP-IB Controllers . . . . . . . . . . . . . . . . . . . . . . . . . . . . .
1-4
Front-to-Rear-Panel Connectors
Retrofit Kit . . . . . . . . . . . . . . . . . . . . . . . . . . . . . . . .
1-4
Rear-to-Front-Panel Connectors
Retrofit Kit
. . . . . . . . . . . . . . . 1-6
Mechanical Equip
Available . . . . . . . . . . . . . . . . . . . . . . . . . . . . . . . . . . . . . 1-6
Chassis Slide Mount Kit .......................
1-6
Chassis Tilt Slide Mount Kit .
. . . 1-6
Recommended Test Equipment . . . . . . . . . . . . . . . . . . . 1-6
Principles of Operation for
Simplified Block Diagram .
........
Voltmeter and Notch Filter . . . . . . . . .
Counter . . . . . . . . . . . . . . . . . . . . . . . . . . . . . . . . . . . . . . 1-7
Voltage Measurement . . . . . . . . . . . . . . . . . . . . . . . .
1-8
Input Frequency Measurement . . . . . . . . . . . . . . . . 1-8
Controller . .
Basics of Audio
AC Level . . . . . . . . . . . . . . . . . . . . . . .
Frequency . . . . . . . . . . . . . . . . . . . . . . . . . . . . . . . . . . . .
1-9
DC Level . . . . . . . . . . . . . . . . . . . . . . . . . . . . . . . . . . . .
1-9
Signal Impurities
. . . . . . . . . . . . . . . . . . 1-9
Distortion . . . . . . . . . . . . . .
SINAD . . . . . . . .
Section 2
INSTALLATION
Page
.
................................
2-1
. . . . . . . . . . . . . . . . . . . . . . . . . . . . . . . . 2.1
Preparation for Use .............................
2-1
Power Requirements ........................... 2-1
Line Voltage and Fuse Selection . . . . . . . . . . . . . . . . 2-1
Power Cables . . . . . . . . . . . . . . . . . . . . . . . . . . . . . . . . .
HP-IB Address Selection .......................
Interconnections . . . . . . . . . . . . . . . . . . . . . . . . . . . . . .
Mating Connectors . . . . . . . . . . . . . . . . . . . . . . . . . . . .
Interface Connector .........................
Coaxial Connectors ..........................
Operating Environment ........................
Bench Operation . . . . . . . . . . . . . . . . . . . . . . . . . . . . . .
Rack Mounting ...............................
Storage and Shipment ...........................
Environment .................................
Packaging ....................................
Original Packaging . . . . . . . . . . . . .
Other Packaging . . . . . . . . . . . . . . .
2-1
2-2
2-4
2-4
2-4
2-4
2-4
2-5
2-5
2-5
2-5
2-5
Section 3
OPERATION
Introduction .......................
General ...................................... 3-1
Operatingg Characteristics . . . . . . . . .
. . . . . . . . . 3-1
Turn-On Procedure ............................
3 - 1 A
Local Operation ...............................
3-1
Simplified Operation .........................
3-2
Panel Features .......................
Detailed Operating Instructions . . . . . . . .
Supplemental Information .................... 3-2
Remote Operation (HP-IB) . . . . . . . . .
Operator’s Checks .............................
3-2
Basic Functional Checks ..................... 3-2
HP-IB Functional Checks ....................
3-2
Operator’s Maintenance . . . . . . . . . . . . . . . . . . . . . . . .
3-2
Operator’s Checks . . . . . . . . . . . . . . . . . . . . . . . . . . . . . . .
3-8
Basic Functional Checks ........
Preliminary Check . . . . . . . . . . .
Filter Check . . . . . . . . . . . . . . . . . . . . . . . . . . . . . . . .
3-9
Distortion . . . . . . . . . . . . . . . . . . . . . . . . . . . . . . . . .
3-10
SINAD Check ............................. 3-10
DC Level Check . . . . . . . . . . . . . . . . . . . . . . . . . . .
3-10
HP-IB Functional Checks . . . . . . . . . . . . . . . . . . . . . 3-11
Address Recognition . . . . . . . . . . . . . . . . . . . . . . . . 3-11
Remote and Local Messages and the LCL Key 3-12
Sending the Data Message . . . . . . . . . . . . . . . . . . 3-13
Receiving the Data Message . . . . . . . . . . . . . . . . . 3-13
Local Lockout and Clear
Lockout/Set Local M
. . . . . . . . . . . . . . . 3-13
Clear Message . . . . . . .
3-14
Abort Message . . . . . . . . . . . . . . . . . . . . . . . . . . . . .
3-15
Status Byte Message . . . . . . . . . . . . . . . . . . . . . . . 3-16
Require Service Message . . . . . . . . . . . . . . . . . . . . 3-17
Trigger Message and Clear
Key Triggering . . . . . . . . . . . . . . . . . . . . . . . . . . .
3-17
V
Table of Contents
Model 89033
CONTENTS (cont’d)
Page
-
Remote Operation, Hewlett-Packard
Interface Bus . . . . . . . . . . . . . . . . . . . . . . . . . . .
3-19
HP-IB Compatibility . .
. . . . . . . . . . . . 3-19
....................... 3-19
.................... 3-19
Local Mode . . . . . . . . . . . . . . . .
. . . . . . . . 3-19
Local Capability . . . . . . . . . . . . . . . . . . . . . . 3-19
Remote-to-Local Mode Changes . . . . . . . . 3-19
Addressing . . . . . . . . .
. . . . . . . . . . . . . . . 3-19
Local Lockout . . . . . . . . . . . . . . . . . . . . . . . . 3-21
Data Messages ......................
Receiving the Data Message . . . . . . . . . . . . . . 3-21
Listen Only . . . . . . . . . . . . . . . . . . . . . . . . . . 3-21
Data Input Format . . . . . . . . . . . . . . . . . . . .
3-22
Program Codes .......................
3-22
Turning Off Functions . . . . . . . . . . . .
Programming Numeric Data . . .
General Numeric Data Input Format . . . . 3-23
Triggering Measurements with the
Data Message . . . . . . . . . . . . . . . . . . . . . . .
3-23
Special Considerations for
Triggered Operation . . . . . . . . . . . . . .
Reading Data from the Right
or Left Display .....................
3-24
Program Order Considerations .
Sending the Data Message . . . . . . . . . . . . . . .3-24
Talk Only Mode ...................... 3-25
Talk Status Only Mode . . . .
Data Output Format . . . . . . . . . . . . . . . . . . 3-25
Data Output Format . . . . . . . . . . . . . . . . . . 3-25
Error Output Format . . . . . . . . . . . . . .
Receiving the Clear Message . . . . . . . . . . . . . 3-25
Receiving the Trigger Message . . . . . . . . . . . . 3-26
Receiving the Remote Message . . . . . . . . . . . 3-26
Receiving the Local Message .
. . . . . . . . 3-26
Receiving the Local
Lockout Message . . . . . . . . . .
Receiving the Clear Lockout/Set
.....................
3-26
Receiving the Pass Control Message . . . . . . 3-26
Sending the Require Service Message . . . . . 3-26
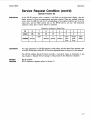
Selecting the Service Request
Condition . . . . . . . . . . . . . . . . . . .
Sending the Status Byte Message
Sending the Status Bit
.......................
Receiving the Abort Message . . . . . . . . . . . . . 3-27
HP-IB Syntax and Characteristics
Summary . . . .
....................
3-29
vi
Page
-
DETAILED OPERATING INSTRUCTIONS 3-33
..........................
3-33
ion . . . . . . . . . . . . . . . . . . . . . . 3-35
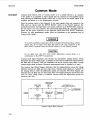
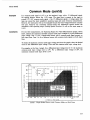
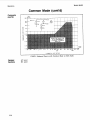
Common Mode . . . . . . . . . .
. . . . . . . . . . . . . 3-36
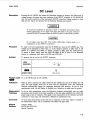
DC Level . . . . . . . . . . . . . . .
. . . . . . . . . . . . . 3-39
Default Conditions and Power-up
Sequence ....................
Detector Selection . . . . . . . . . . . . . .
Display Level in Watts . . . . . . . . . . . . . . .
Distortion . . . . .
. . . . . . . . . . . . . . . . . . . 3-43
. . . . . . . . . . . . . . . . . . . 3-45
Error Disable . . . . . . . . . . . . . .
. . . . . . 3-47
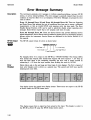
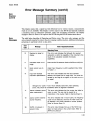
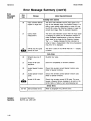
Error Message Summary . . . . . . . . . . . . . . . . . . . 3-48
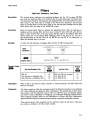
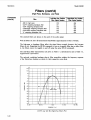
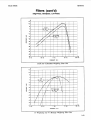
Filters .........................
. . . . . . 3-51
. . . . . . . . . . . . . . . . . . . . . . . . . . 3-55
nt . . . . . . . . . . . . . . . . . . . . . . . 3-57
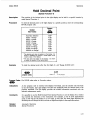
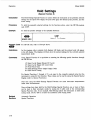
Hold Settings . . . . . . . . . . . . . . . . . . . . . . . . . . . . . 3-58
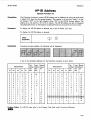
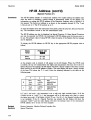
HP-IB Address ...........................
3-59
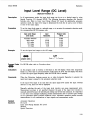
Input Level Range (DC Level) . . . . . . . . . . . . . 3-61
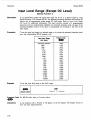
Input Level Range (Except DC Level) . . . . . . . 3-62
Monitor . . . . . . . . . . . . . . . . .
. . . . . . . . . . . 3-64
Notch Tune . . . . . . . . . . . . . .
. . . . . . . . . . . 3-67
Post-Notch Detector Filtering
(Except SINAD) ........................
3-68
Post-Notch Gain . . . . . . . . . . .
. . . . . . . . . 3-69
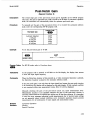
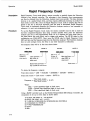
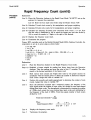
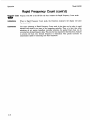
Rapid Frequency Count ....................
3-70
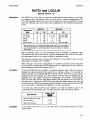
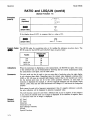
RATIO and LOG/LIN ....................
3-73
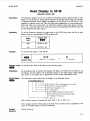
Read Display to HP-IB
. . . . . . . . . . . . . . 3-75
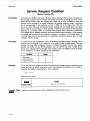
Service Request Condition . . . . . . . . . . . . . . . . . 3-76
SINAD ..................................
3-78
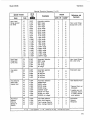
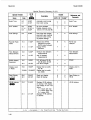
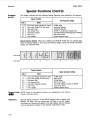
Special Functions . . . . . .
. . . . . . . . . . . . . . . 3-80
Time Between Measurements . . . . . . . . . . . . . . . 3-86
Section 4
PERFORMANCE TESTS
Introduction ....................
Equipment Required . . . . . . . . . . . .
Test Record . . . . . . . . . . . . . . . . . . . . . . . . . . . . . . .
4-1
Calibration Cycle . . . . . . . . . . . . . . . . . . . . . . . . . .
4-1
Abbreviated Performance Testing . . . . . . . . . . . . 4-1
PERFORMANCE TESTS . . . . . . . . . . . . . . . . . . 4-2
AC Level Accuracy ......................... 4-2
DC Level Accuracy . . . . . . . . . . . .
Residual Distortion and Noise . . . . .
Distortion and SINAD Accuracy
Frequency Accuracy and Sensitivity . . . . . . . . . 4-14
Audio Filters . . . . . . . . . . . . . . . . . . . . . . . . . . . . . 4-15
Input Impedance . . . . . . . . . . . . . . . .
. . . . . . 4-22
Common-Mode Rejection Ratio .
. . . . . . 4-24
Performance Test Record . . . . . .
. . . . . . 4-26
Model 89033
Table of Contents
CONTENTS (cont’d)
Section 5
ADJUSTMENTS
Page
-
Introduction . . . . . . . . . . . . . . . . . . . . . . . . . . . . . . . 5-1
Safety Considerations . . . . . . . . . . . . . . . . . . . . . . 5-1
Equipment Required . . . . . . . . . . . . . . . . . . . . . . . 5-1
Factory-Selected Components . . . . . . . . . . . . . . . . 5-1
Post-Repair Tests,
Adjustments, and Checks . . . . . . . . . . . . . . . . . 5-1
Related Adjustments . . . . . . . . . . . . . . . . . . . . . . . 5-2
ADJUSTMENTS . . . . . . . . . . . . . . . . . . . . . . . . . . 5-3
Internal Reference Frequency . . . . . . . . . . . . . . . . 5-3
Input Flatness . . . . . . . . . . . . . . . . . . . . . . . . . . . . . 5-4
Common-Mode Rejection . . . . . . . . . . . . . . . . . . . 5-8
Input DC Offset . . . . . . . . . . . . . . . . . . . . . . . . . . . 5-9
400 Hz High-Pass and Weighting
Bandpass Filters . . . . . . . . . . . . . . . . . . . . . . . . 5-10
Notch Filter Tune and Balance . . . . . . . . . . . . . 5-12
Voltmeter (Using an HP-IB
Controller) . . . . . . . . . . . . . . . . . . . . . . . . . . . . . 5-13
Voltmeter (Not Requiring an HP-IB
Controller) . . . . . . . . . . . . . . . . . . . . . . . . . . . . . 5-16
vii
General Information
Model 89033
Section 1
GENERAL INFORMATION
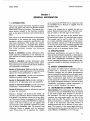
1-1. INTRODUCTION
This manual contains information required to install,
operate, test, adjust, and service the Hewlett-Packard
Model 89033 Distortion Analyzer. This manual documents options installed in the Distortion Analyzer
such as rear-panel connections and internal plug-in
filters.
This section of the manual describes the instruments
documented by the manual and covers instrument
description, options, accessories, specifications, and
other basic information. This section also contains
principles of operation on a simplified block diagram
level and basic information on audio measurements.
T h e o t h e r s e c t i o n s c o n t a i n t h e following
information:
Section 2, Installation: provides information about
initial inspection, preparation for use (including address selection for remote operation), and storage and
shipment.
Section 3, Operation: provides information about
panel features, and includes operating checks, operating instructions for both local and remote operation,
and maintenance information.
Section 4, Performance Tests: provides the information required to check performance of the instrument
against the critical specifications in Table 1- 1.
Section 5, Adjustments: provides the information
required to properly adjust the instrument.
Section 6, Replaceable Parts: provides ordering information for all replaceable parts and assemblies.
Section 7, Instrument Changes: provides instrument
modification, recommendations, and procedures.
Section 8, Service: provides the information required
to repair the instrument.
Sections 1 through 5 are bound in this volume, the
Operation and Calibration Manual. Sections 6 through
8 are bound in two separate volumes, the Service Manual. The Service Manual is comprised of an HP 8903E
Service Supplement, and an HP 8903B Service Manual.
Copies of the Service Manual are not supplied with
the instrument unless specifically requested (as option
915) at time of instrument order. The Operation and
Calibration Manual is supplied with the instrument
order. When option 915 is requested, the complete
service manual (the HP 89033 Service Supplement and
the HP8903B Service Manual) is supplied with the
instrument order.
Copies of all volumes can be ordered through your
nearest Hewlett-Packard sales office. The part numbers are listed on the title page of this manual.
Also listed on the title page of this manual, below
the manual part number, is a microfiche part number.
This number may be used to order 100 X 150 mm
(4X 6 inch) microfilm transparencies of this manual.
Each microfiche contains up to 96 photo-duplicates
of the manual’s pages. The microfiche package also
includes the latest MANUAL CHANGES supplements, as well as all pertinent Service Notes.
1-2. SPECIFICATIONS
Instrument specifications are listed in Table 1-1.
These are the performance standards,or limits against
which the instrument may be tested. Characteristics
listed under Supplemental Information, Table 1-2,
are not warranted specifications but are typical characteristics included as additional information for the
user.
1-3. SAFETY CONSIDERATIONS
This product is a Safety Class I instrument (that is,
provided with a protective earth terminal). The
Distortion Analyzer and all related documentation
must be reviewed for familiarization with safety markings and instructions before operation. Refer to the
Safety Considerations page found a t the beginning
of this manual for a summary of the safety information. Safety information pertinent t o the task at hand
(installation, performance testing, adjustment, or
service) is found throughout the manual.
1-4. INSTRUMENTS COVERED BY MANUAL
Serial Numbers. This instrument has a two-part serial number in the form OOOOAOOOOO which is stamped
on the serial number plate attached to the rear of
the instrument. The first four digits and the letter
constitute the serial number prefix, and the last five
digits form the suffix. The prefix is the same for all
identical instruments. It changes only when a change
is made to the instrument. The suffix, however, is
assigned sequentially and is different for each instrument. The contents of this manual apply directly to
instruments having the same serial prefix(es) as listed
under SERIAL NUMBERS on the title page.
1-1
General Information
Options. Electrical Option 001, internal plug-in filter
options, and various mechanical options are documented in this manual. The differences are noted
under the appropriate paragraph such as Options in
Section 1, the Replaceable Parts List, and the schematic diagrams.
1-5. MANUAL CHANGES SUPPLEMENT
An instrument manufactured after the printing of
this manual may have a serial prefix that is not listed
on the title page. An unlisted serial prefix indicates
that the instrument differs in some way from those
documented in this manual.
A “Manual Changes Supplement” is shipped with this
manual to provide you with the most current change
information available at the time of shipment. In
addition to change information the supplement may
contain information for correcting errors in the
manual.
To keep this manual up to date and as accurate as
possible, Hewlett-Packard recommends that you periodically request the latest Manual Changes Supplement. The supplement is identified with the print
date and part number that appears on the title page.
Complimentary copies of the supplement are available
from Hewlett-Packard.
1-6. DESCRIPTION
1-7. General
The H P Model 89033 Distortion Analyzer is an audio
measurement system covering the frequency range of
20Hz t o 100 kHz. The analyzer can perform
distortion analysis, frequency count, ac level, dc level,
and SINAD measurements. The Distortion Analyzer
reduces the number of instruments required in many
applications involving audio signal characterization.
The Distortion Analyzer is easy to use. All measurements are selected by one or two keystrokes. For
distortion measurements, the Distortion Analyzer
automatically ranges to, and tunes to the input signal.
Measurement and output ranges are automatically
selected for optimum resolution and accuracy.
The combined capabilities of the instrument are enhanced by microprocessor control, resulting in more
capability than would be available from separate
instruments. For example, using the ratio key allows
you to set a O d B or 100% reference for making
frequency response measurements. Microprocessor
control allows flexible and versatile display formats.
1-2
Model 89033
For example, ac level can be displayed in V, mV,
watts, or as a ratio (in % ordB)
dBm into 600Q2,
referenced to an entered or measured value.
Virtually all functions are remotely programmable
through the Hewlett-Packard Interface Bus (HP-IB)‘.
Programming is easy and straightforward. All measurements are made through a single input. This eliminates the need to switch between multiple inputs
u n d e r remote control a n d reduces software
development time and hardware costs. The Distortion
Analyzer measures the true rms level on all ac measurements. True rms measurements assure greater
accuracy when measuring complex waveforms and
noise. For those applications where average detection
is required, the analyzer can be switched to average
responding (rms calibrated) detection via a frontpanel key. Accurate distortion measurements typically
can be made to less than 0.003% (-9OdB) between
20 Hz and 20 kHz.
1-8. Audio Testing
The Distortion Analyzer has numerous features which
make audio testing simple and convenient. For
example, distortion results can be displayed in %
o r a . AC level measurements can be displayed in
volts, dBm into 600Q, or watts. Measurement results
can be displayed in % or dB relative to a measured
or entered value. Finding the 3 d B points of filters
and amplifiers is simplified by using the relative
display feature. The Distortion Analyzer also features
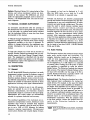
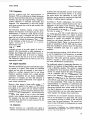
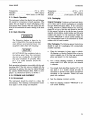
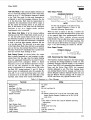
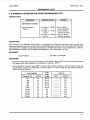
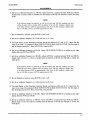
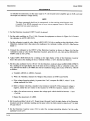
high accuracy. The internal Voltmeter flatness is better than 0.5% (0.05 dB) over the range of 20 Hz to
20 kHz. Residual Distortion is typically 0.003% (-90
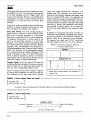
dB) over the same range. See Figure 1-1.
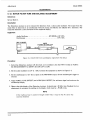
Balanced Input. The Distortion Analyzer has a selectable balanced input configuration for testing balanced devices. For example, in the quest for higher
output power, many audio amplifiers use bridged output stages. Such amplifiers can be difficult to characterize because their outputs cannot be grounded. To
test these devices, the usual approach has been to
use a balanced, calibrated isolation transformer connected to an analyzer with an unbalanced input. The
balanced input on the Distortion Analyzer make
transformers unnecessary. With the analyzer input
in the float position, connect the bridged device directly t o t h e Distortion Analyzer t o make
measurements.
I
HP-IB: Not just IEEE-488. but the hardware, documentation
and support that delivers the shortest path to a measurement
system.
Model 89033
E
w
??
g
6
U
5I-
a:
General Information
-70
tones up to 250 Hz is greater than 40 dl3. Therefore,
audio distortion measurements to 1% residual
distortion can be made without disabling the transmitter squelch tones.
-75
-80
-80
Under remote control, the Distortion Analyzer can
count burst tone sequences. Typically the maximum
count rate is 8 ms/reading.
-a5
-90
1-10. Systems
FREQUENCY
-- .. .
Figure 1-1. Typical Analyzer Residual
Distortion
1-9. Transceiver Testing
The Distortion Analyzer has several measurements
and features specifically designed for transceiver testing. It has SINAD measurements for receiver testing,
optional internal plug-in weighting filters for testing
to international standards, a reciprocal counter for
measuring squelch tones, and an optional internal
plug-in 400 Hz high-pass filter for eliminating squelch
tones when measuring transmitter audio distortion.
SINAD is one of the most basic receiver measurements. It must be made repeatedly when performing
sensitivity or adjacent-channel sensitivity tests. In
the Distortion Analyzer, the SINAD measurement is
more heavily filtered than the distortion measurement
in order to smooth the noisy signals encountered in
receiver testing. The filtering is optimized for excellent repeatability and speed (2 readingslsecond typical). Some automatic distortion analyzers have a
tendency to become untuned when measuring SINAD
on noisy signals. The Distortion Analyzer overcomes
this problem by providing a front panel key which
locks the notch filter at the input frequency. For
SINAD ratios less than 25 cU3, a Special Function
can be used to round the digital display to the nearest
0.5dl3 to reduce digit flicker.
For accurate noise ratio measurements, the Distortion
Analyzer uses true rms detection for SINAD. Most
older instruments employ average detection which
reads low for noise. The discrepancy can be 1.5dT3
or greater and varies with the ratio being measured.
For correlating results with past test data, the
Distortion Analyzer’s detector can be switched via a
f r o n t - p a n e l key t o a n average r e s p o n d i n g
configuration.
For transceivers, the Distortion Analyzer has an optional, internal plug-in seven-pole 400 Hz high-pass
filter for rejecting squelch tones. Rejection of squelch
The Distortion Analyzer features capabilities for general systems applications. The distortion measurements are fully automatic, programmable, and fast.
The typical time to tune and return the first distortion
measurement is 1.5 seconds with a measurement rate
of 2 readingslsecond thereafter. T h e residual
distortion of the analyzer is typically 0.003% (-90 dB)
between 20Hz and 20kHz.
Often, systems applications involve measuring low
level ac signals. The Distortion Analyzer features a
full range ac level display of 0.3000mV with an
accuracy of 4% of reading (2% of reading for levels
>50 mV and from 20 Hz to 20 kHz). The ac detector
is switchable between true rms and average responding detection. The 3 dl3 measurement bandwidth for
both detectors is greater than 500 kHz.
Since many systems have noise problems, the
Distortion Analyzer has both 30 and 80 kHz low-pass
filters to reject high frequency noise. In addition, the
optional internal plug-in 400 Hz high-pass filter attenuates line-related hum and noise by more than 68 dB.
A special binary programming mode is available in
remote operation. The rapid frequency count mode
provides a packed, four-byte output for fast counting
over HP-IB.
1-11. OPTIONS
1-12. Electrical Options
Electrical Option 001. This option provides a rearpanel (instead of front-panel) connection for the
INPUT and MONITOR connectors.
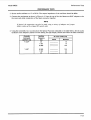
Internal Plug-in Filter Options. The Distortion
Analyzer has two internal plug-in filter positions;
each position can be loaded with any one of six
optional filters. Each filter is referenced to its corresponding filter position by one of two option numbers.
For example, the 400 Hz High-Pass Filter Option can
be ordered as Option 010 which corresponds to the
left-most filter position, or as Option 050 which corresponds to the right-most filter position. These optional plug-in filters can be configured in any
combination desired. If there is no filter ordered for
a position, a jumper wire is loaded and a label marked
1-3
General Information
Model 89033
“No Filter” is placed above the filter key on the front
panel. The following list includes the name and option
numbers for each available filter.
the Distortion Analyzer, refer to Remote Operation,
Hewlett-Packard Interface Bus in Section 3 of this
manual.
400 Hz High-Pass Filter (Option 010, 050).
CCITT Weighting Filter (Option 011, 051).
CCIR Weighting Filter (Option 012, 052).
C-MESSAGE Weighting Filter (Option 013, 053).
CCIR/ARM Weighting Filter (Option 014, 054).
“A” Weighting Filter (Option 015, 055).
1-16. Selecting the HP-IB Address
Specific information on each plug-in filter option can
be found in the Detailed Operating Instructions in
Section 3 under “Filters”.
The HP-IB address switches are located within the
Distortion Analyzer. The switches represent a five-bit
binary number. This number represents the talk and
listen address characters which an HP-IB controller
is capable of generating. In addition, two more
switches allow the Distortion Analyzer to be set to
talk only or listen only. A table in Section 2 shows
all HP-IB talk and listen addresses. Refer to HP-IB
Address Selection in Section 2 of this manual.
1-13. Mechanical Options
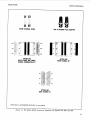
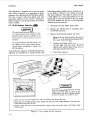
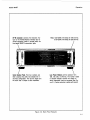
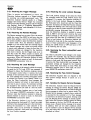
1-17. ACCESSORIES SUPPLIED
The following options may have been ordered and
received with the Distortion Analyzer. If they were
not ordered with the original shipment and are now
desired, they can be ordered from the nearest HewlettPackard office using the part number included in
each of the following paragraphs. The mechanical
options are shown in Figure 1-2.
Front Handle Kit (Option 907). Ease of handling is
increased with the front-panel handles. Order H P
part number 5061-9689.
Rack Flange Kit (Option 908). The Distortion
Analyzer can be solidly mounted to the instrument
rack using the flange kit. Order HP part number
5061-9677.
Rack Flange and Front Handle Combination Kit
(Option 909). This is not a front handle kit and a
rack flange kit packaged together; it is composed of
a unique part which combines both functions. Order
H P part number 5061-9683.
1-14. HEWLETT-PACKARD INTERFACE BUS
(HP-16)
1-15. Compatibility
The Distortion Analyzer is compatible with HP-IB
to the extent indicated by the following code: SH1,
AH1, T5, TEO, L3, LEO, SR1, RL1, PPO, DC1,
DT1, CO, E l . The Distortion Analyzer interfaces
with the bus via open collector TTL circuitry. An
explanation of the compatibility code can be found
in IEEE Standard 488, “IEEE Standard Digital
Interface for Programmable Instrumentation” or the
identical ANSI Standard MC1.l. For more detailed
information relating to programmable control of
1-4
The accessories supplied with the Distortion Analyzer
are shown in Figure 1-2.
Time delay fuses with a 1.5A rating for 100/120 Vac
operation (HP 2110-0059) and a 0.75A rating for
220/240 Vac operation (HP 2110-0018) are supplied.
One fuse is installed in the instrument at the time
of shipment. The rating of the installed fuse is selected
according to the line voltage specified by the customer.
If the voltage is not specified, the rating of the installed fuse will be selected according to the country
of destination.
For Option 001 only, two type BNC-to-banana-plug
adapters (HP 5021-0844) are also supplied for use
when double-ended inputs or outputs are desired. The
conductor of the banana jack is connected to the
center conductor of the BNC adapter connector.
These adapters are used when the front-panel INPUT
or OUTPUT FLOAT switches are set to FLOAT.
1-18. ELECTRICAL EQUIPMENT AVAILABLE
(Also refer to Service Accessories, Table 1-4.)
1-19. HP-I6 Controllers
The Distortion Analyzer has an HP-IB interface and
can be used with any HP-IB compatible computing
controller or computer for automatic systems
applications.
1-20. Front-to-Rear-Panel Connectors
Retrofit Kit
This kit contains all the necessary components and
full instructions for converting instruments with
front-panel connections for INPUT and MONITOR
to rear-panel connections. Order HP part number
08903-60177. After installation and calibration, performance will be identical to the H P 89033 Option 001.
Model 89033
General Information
SPARE INTERNAL FUSES
BNC TO BANANA PLUG ADAPTER
OPTION 909
RACK FLANGE AND FRONT
HANDLE COMBINATION KIT
OPTION 907
FRONT HANDLE KIT
OPTION 908
RACK FLANGE KIT
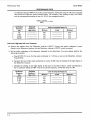
NOTE: Refer to ACCESSORIES SUPPLIED, for more details.
Figure 1-2. HP Model 8903E Accessories Supplied, and Options 907, 908, and 909
1-5
General Information
Model 89033
1-21. Rear-to-Front-Panel Connectors
Retrofit Kit
This kit contains all the necessary components and
full instructions for converting instruments with rearpanel connections for INPUT and MONITOR to
front-panel connections. Order HP part number 0890360178. After installation and calibration, performance
will be identical to the standard HP89033.
1-22. MECHANICAL EQUIPMENT
AVAILABLE
1-23. Chassis Slide Mount Kit
This kit is extremely useful when the Distortion
Analyzer is rack mounted. Access to internal circuits
and components or the rear-panel is possible without
removing the instrument from the rack. Order H P
part number 1494-0060 for 431.8mm (17in.) fixed
slides, and part number 1494-0061 for the correct
adapters for non-HP rack enclosures.
1-24. Chassis Tilt Slide Mount Kit
This kit is the same as the Chassis Slide Mount Kit
above except it also allows the tilting of the instrument up or down 90". Order H P part number 14940062 for 431.8mm (17 in.) tilting slides, and part
number 1494-0061 for the correct adapters for nonH P rack enclosures.
1-25. RECOMMENDED TEST EQUIPMENT
Table 1-3 lists the test equipment recommended for
use in testing, adjusting, and servicing the Distortion
Analyzer. If any of the recommended equipment is
unavailable, instruments with equivalent minimum
specifications may be substituted. Table 1-3 also includes some alternate equipment listings.
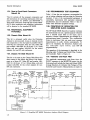
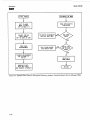
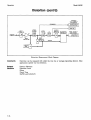
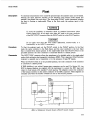
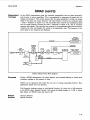
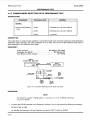
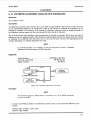
1-26. PRINCIPLES OF OPERATION FOR
SIMPLIFIED BLOCK DIAGRAM
The H P Model 89033 Distortion Analyzer combines
two instruments into one: a general purpose voltmeter
with a tunable notch filter a t the input, and a
frequency counter. Measurements are managed by a
microprocessor-based Controller. This combination
forms an instrument that can make most common
measurements on audio circuits automatically. To
add to its versatility, the Distortion Analyzer also
has selectable input filters, and H P - I B
programmability.
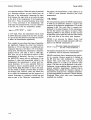
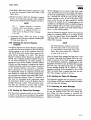
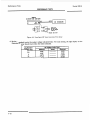
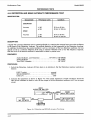
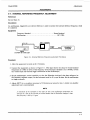
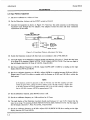
The operation of the instrument is described in the
following order: Voltmeter and Notch Filter, Counter,
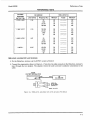
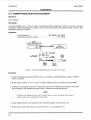
and Controller. Refer to Figure 1-3.
1-27. Voltmeter and Notch Filter
The amplitude measurement path flows from the
INPUT connector to the MONITOR output (on the
front panel) and includes the Input and Output RMS/
Average Detectors, dc voltmeter (the Voltage-to-Time
Converter and Counter). Measurements are made on
If
--
1-
0 oonm
D .
KEYBOARD AND DISPLAY
Figure 1-3. Simplified HP 8903E Distortion Analyzer Block Diagram
1-6
41
Model 89033
General Information
the difference between the signals on the inner
conductor and shield of the INPUT connector or,
for option 001, the HIGH and LOW connectors. Combined differential and common-mode levels can be as
high as 300V. However, for safety purposes only 42V
maximum is allowed on the outer conductor of the
single BNC input connector when in the FLOAT
position.
When measuring SINAD, distortion, or distortion
level, the fundamental of the signal is removed by
the Notch Filter. The output from the filter is the
distortion and noise of the signal. In the ac level
mode, the Notch Filter is bypassed. After amplifying
and low-pass filtering, the output from the Notch
Filter is converted to dc by the Output RMS/Average
Detector, and measured by the dc voltmeter.
The input signal is ac coupled for all measurement
modes except dc level. The signal is scaled by the
Input Attenuator to a level of 3V or less. T o protect
the active circuits that follow, the Over-Voltage Protection circuit opens whenever its input exceeds 15V.
The differential signal is converted to a single-ended
signal (that is, a signal referenced to ground) and
amplified. In the dc level mode, the dc voltage is
measured at this point by the dc voltmeter. The
signal is further amplified by a Programmable Gain
Amplifier which is ac coupled. The gain of this amplifier and the Differential-to-Single-Ended Amplifier
are programmed to keep the signal level going into
the Input Detector and Notch Filter between 1.7 and
3 Vrms. This optimizes the effectiveness and accuracy
of the amplifiers, particularly in the distortion and
SINAD modes.
When measuring distortion, distortion level, or
SINAD, the Notch Filter is automatically tuned to
the frequency counted at the input to the filter. Coarse
tuning is via the Controller. Fine tuning and balance
are via circuitry internal to the Notch Filter. In
SINAD mode, a front-panel key allows you to lock
the notch at a given input frequency, so that the
notch will not become untuned in the presence of
noise. The two Programmable Gain Amplifiers,
following the Notch Filter, amplify the low-level noise
and distortion signals from the Notch Filter. The
overall gain of the two amplifiers is normally set to
maintain a signal level of 0.3 to 3V at the MONTIOR
output.
The output from the first Programmable Gain Amplifier is converted to dc by the Ranging RMS Detector,
and measured by the dc voltmeter. The output of
this detector is used to set the gain of the input
circuits. The signal then passes through the internal
plug-in HP/BP filters to the input RMS/Average
detector and becomes the numerator of the SINAD
measurement, and the denominator of the distortion
measurement (refer to Basics of Audio Measurements).
The Input RMS/Average Detector is not used to
make the ac level measurement; the Output RMS/
Average Detector is used for this measurement. For
dc level measurements, the Ranging RMS Detector
also monitors the ac component (if there is one) and
lowers the gain of the input path if the signal will
overload the input amplifiers; otherwise, the gain of
the input path is determined by measuring the dc
level. At this point, one of the two internal plug-in
filters can be inserted into the signal path. The 400 Hz
High-Pass Filter is usually used to suppress line hum,
or the low frequency squelch tone used on some mobile
transceivers. The Weighting Filters have bandpass
frequency responses that simulate the “average” response of human hearing. In the SINAD, distortion,
and distortion level modes, the frequency of the input
signal is counted at the output of the internal plug-in
HP/BP Filters.
The 30 kHz and 80 kHz L P Filters are selected from
the Keyboard. With no low-pass filtering, the 3 d B
bandwidth of the measurement system is approximately 750 kHz. The filters are most often used to
remove the high-frequency noise components in lowfrequency SINAD and distortion measurements. The
output from the second Programmable Gain Amplifier
drives the front-panel MONITOR output connector.
The frequency of this signal is also measured by the
Counter in the ac level mode because of the increased
sensitivity at this point.
The Output Detector is read by the dc voltmeter in
the ac level, SINAD (the denominator), distortion
(the numerator), and distortion level modes. It is also
used to set the gain of the two Programmable Gain
Amplifiers. Both the input and output detectors can
be configured via front-panel keys to respond to the
absolute average of the signal instead of the true rms
value. The Voltage-to-Time Converter converts the
dc inputs into a time interval which is measured by
the Counter.
1-28. Counter
The Counter is a reciprocal counter. To measure
frequency, it counts the period of one or more cycles
of the signal at its input, then the Controller divides
the number of periods by the accumulated count.
The reference for the Counter is the 2MHz Time
Base which also is the clock for the Controller. The
Counter has three inputs and two modes of operation:
1-7
General Information
Voltage Measurement. The time interval from the
Voltage-to-Time Converter is counted. The accumulated count is proportional to the dc voltage. For
direct measurements (ac level, dc level, and distortion
level), the count is processed directly by the Controller
and displayed on the right display. For ratio measurements (SINAD and distortion), the counts of two
successive measurements are processed and displayed.
For SINAD and distortion, the ratio of the outputs
of the Input and Output RMS/Average Detectors is
computed.
Input Frequency Measurement. The signal from the
last Programmable Gain Amplifier or the internal
plug-in HP/BP Filters is conditioned by the Counter
Input Schmitt Trigger to make it compatible with
the Counter’s input. The period of the signal is then
counted, the count is processed by the Controller,
and the frequency is displayed on the left display.
1-29. Controller
The entire operation of the instrument is under control of a microprocessor-based Controller. The Controller sets up the instrument at turn-on, interprets
Keyboard entries, executes changes in mode of operation, continually monitors instrument operation,
sends measurement results and error messages to the
front-panel displays, and interfaces with HP-IB. In
addition, its computing capability is used to simplify
circuit operation. For example, it forms the last stage
of the Counter, converts measurement results into
ratios (in % o r a ) , etc. It also contains routines
useful for servicing the instrument.
1-30. BASICS OF AUDIO MEASUREMENTS
The “audio” frequency range is usually taken to be
from 20 Hz to 20 kHz. Few people have hearing that
good, but the term is a convenient one to describe
sub-RF frequencies encountered in electronics. The
frequency range of the Distortion Analyzer extends
beyond the audio range to include fundamentals up
to 100 kHz.
Electronic instrumentation provides most of the tools
for quantitative analysis of audio signals. Thus, if
the signal is non-electrical (for example, mechanical
or acoustic), it must be converted to an electrical
signal by a transducer of some kind (for example,
strain gauge or microphone) before it can be analyzed.
Apart from attentive listening to a hi-fi system, the
most intuitive way of analyzing an electrical signal
in the audio range is visually with an oscilloscope.
Here you get a feeling for the signal’s size (loudness),
frequency (pitch), and shape (timbre). You can also
determine if these parameters change with time or
1-8
Model 89033
are stable, and you can even make some quantitative
measurements on it (for example, peak level, dc offset,
period, risetime, etc.) Many times, however, the parameter sought does not lend itself to easy visual
analysis. Thus, the Distortion Analyzer was designed.
It combines into one instrument a series of general
and specialized instruments, under microprocessor
control, that make it easy for you to obtain accurate,
quantitative measurements on audio signals of any
general waveshape.
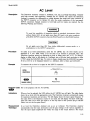
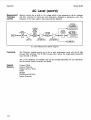
1-31. AC Level
Consider the very common measurement of a signal’s
ac rms level. To make this measurement with an
oscilloscope, you must first decide the nature of the
signal, because from it, the relationship of the peak
level t o the rms level can be mathematically
determined. If the signal is sinusoidal, for example,
the rms value is the peak amplitude divided by
5.
This measurement is greatly simplified with an rms
voltmeter which electronically measures the rms level
and displays the result. However, no other information about the signal is provided. The Distortion
Analyzer contains both an rms and an average responding voltmeter. The rms level of the signal is
displayed whenever the AC Level mode is selected.
The average level can be displayed by pressing the
AVG/RMS key. (When the LED is lit, the analyzer
is in Average mode.) A special function is also provided which converts the measurement result into
watts for a specified (external) load resistance (accessable only through HP-IB).
Another important ac signal characteristic is the variation in level vs. frequency (flatness). Of course you
can easily set a reference level (such as 1V) at a
particular frequency (such as 1kHz) and monitor the
change in level as the input frequency is changed.
(The external source’s level is assumed to be flat;
otherwise, it too must be checked.) The Distortion
Analyzer makes this measurement easier in two ways.
First, the reference can be set to 100% or O d B by
the press of a button (the RATIO key). Second, the
results can be logged into a controller over HP-IB
to be plotted on a printer or plotter.
An additional parameter related to ac level is gain,
and more often, gain vs. frequency. To make a gain
measurement, measure the input to the device, then
the output, and take the ratio. You first set an external
source as desired, then either measure it or set it as
a reference (press RATIO). Then measure the output.
The result can be expressed in either % or&. If
desired, an external source can be swept and the gain
plotted as a function of frequency.
Model 89033
1-32. Frequency
Another common a n d basic measurement is
frequency. With an oscilloscope, you simply determine
the time interval between like points on the repetitive
waveform and take the reciprocal. With a frequency
counter, frequency is measured electronically and
displayed. The measurement is easier and usually
much more accurate than could be made visually with
an oscilloscope.
The Distortion Analyzer contains a counter which
displays the frequency of the input signal for all ac
measurements. It should be noted that the counter
is a reciprocal type; it measures the period of the
signal (as you do with an oscilloscope) and computes
the reciprocal to obtain the frequency. The advantage
of this technique is that for low (audio) frequencies,
higher resolution is o b t a i n e d i n a s h o r t e r
measurement time.
1-33. DC Level
Although not part of an audio signal, dc level is a
quantity often encountered in audio equipment (for
example, bias voltages and outputs from ac-to-dc converters). Sometimes plots of dc level vs. frequency
are desired (as in the case of an ac-to-dc converter).
The Distortion Analyzer has dc level as one of its
measurement modes.
1-34. Signal Impurities
Distortion and SINAD are used to describe the impurity content of a signal. These terms are somewhat
related and can often be confused. A pure signal is
defined as a perfect sinusoid, that is, one whose
frequency spectrum contains only a single spectral
component. Impurities are not always undesirable.
Impurities, for example, are what add character to
the sound of musical instruments. Pure signals in
music sound monotonous.
However, when testing a linear audio system, if a
pure signal is applied to the input, anything but a
pure signal at the output indicates that the system
is degrading the signal. There are several common
classifications of impurities: harmonic distortion (harmonics of the fundamental), intermodulation
distortion (beat signals of two or more non-related
signals), noise (random signals), and spurious signals
(for example, line hum and interference). All but
intermodulation distortion are easily measured by the
Distortion Analyzer.
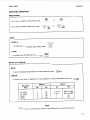
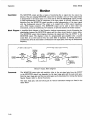
1-35. Distortion
Harmonic distortion on a spectrally pure signal is
created by non-linearities in the circuit through which
General Information
it passes. The non-linearities can arise in the transfer
characteristics of the active devices or by running
the active device into saturation or cutoff. Often,
distortion can be reduced by reducing the signal level,
filtering, or adding negative feedback.
According to Fourier mathematics, the non-linear
terms in the circuit’s transfer function give rise to
harmonics of the signal. Total harmonic distortion
(THD) is usually defined as the ratio of the rms sum
of the harmonics to the rms level of the fundamental.
The ratio is usually converted to % o r a .
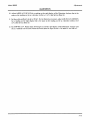
An oscilloscope gives only a rough indication of the
amount of distortion present on a signal. A general
rule of thumb is that if the non-linearity causing the
distortion is “gentle” (for example, not clipped), a
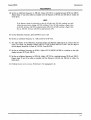
trained eye can discern distortion as low a 5% on
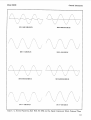
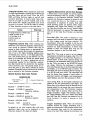
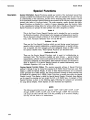
an oscilloscope display. Figure 1-4 shows several examples of waveforms with 5% THD and the components that combined to produce them (5% distortion
would be considered quite high in a quality hi-fi
amplifier).
An audio spectrum analyzer, which allows the user
to see the magnitude of all harmonics, is perhaps
t h e best instrument t o measure harmonic
distortion. The audio spectrum analyzer method,
however, requires a fairly expensive instrument
and some mathematical manipulation.
The traditional method of measuring distortion (accepted by the Institute of High Fidelity2 and others)
is with a distortion analyzer. The method is simple
and adequate for most situations. With a distortion
analyzer, you simply measure the signal level and set
it up as a reference, then you insert a notch filter,
tuned to the frequency of the fundamental, and
measure the output of the filter relative to the input.
This is the method used by the Distortion Analyzer
in the DISTN mode where the tuning and measuring
are done automatically. When using the distortion
analyzer method, it is important to understand that
the measurement result is not “total harmonic
distortion” as defined above except under the condition that the distortion is not too excessive but that
it does predominate over any other signal impurities.
Some examples will illustrate these restrictions.
Consider the case of excessive harmonic distortion.
Let us use the example of a signal with 10% actual
total harmonic distortion in which all the distortion
comes from the second harmonic. The second harmonic is then 20 m below the fundamental as viewed
* T h e Institute of High Fidelity, Inc., Standard Methods Of
Measurement For Audio Amplifiers, The Institute of High Fidelity, Inc., New York (1978), p. 9.
1-9
General Information
Model 89033
on a spectrum analyzer. When this signal is measured
by a distortion analyzer, an error results from the
first part of the measurement (measuring the input
level) because the input level is not quite the same
as the level of the fundamental. If the fundamental
level were 1 Vrms, the second harmonic level would
be 0.1 Vrms (one-tenth of the fundamental). The
total input level (measured with a true rms voltmeter)
is the rms sum of the two components, namely,
Input = v / ( 1 ) 2
+ (0.1)2
=
1.005V
or 0.5% high. Thus, the measurement result would
be 9.95% distortion instead of the true 10%.Actually,
you can see that the distortion must really be excessive
to affect the measurement significantly.
Now consider the case where other types of impurities
are significant. Suppose the actual total harmonic
distortion is 1%but that there is an additional hum
component that has a level that is 1% of the fundamental level. The distortion measured by a distortion
analyzer will be 1.4% (that is, 40% or 3 dB high).
How, then, can you be sure that the result is a valid
measurement of distortion? One way is to observe
the MONITOR output with an oscilloscope. If the
waveform is clean and harmonically related to the
fundamental, the measurement is actual total harmonic distortion. If it is not, selectable filters are
provided to remove unwanted signals. Use the optional 400 Hz High-Pass Filter to remove line hum.
Use the 30 kHz or 80 kHz Low Pass Filter to remove
out-of-band noise. However, select only filters that
do not affect the fundamental and the harmonics of
interest. Sometimes it is desired to include hum and
noise as part of the “distortion” measurement. For
1-10
this reason, the measurement is often referred to as
a THD+N (total harmonic distortion plus noise)
measurement .
1-36. SINAD
For most practical purposes the SINAD measurement,
as made by the Distortion Analyzer, is equal to the
reciprocal of the distortion measurement. It is usually
expressed indB. The notch filter is coarsely programmed to the input frequency by the microprocessor (but fine tuned to the signal at its input). When
measuring SINAD in the presence of large amounts
of impurities, a front-panel key locks the coarse tuning
of the notch filter at the correct input frequency.
SINAD is an acronym for SIgnal, Noise, And
Distortion. The ratio (normally expressed in dF3) computed in the SINAD measurement is
SINAD = 20 log
rms value of signal, noise and distortion
r m s value of noise and distortion
The equation eliminates the two restrictions discussed
in connection with the distortion measurement.
SINAD is used most often in determining the sensitivity of a receiver. Receiver sensitivity is defined as
the RF level that, when modulated in a specified
manner with a pure audio tone, creates a certain
SINAD (usually 10 or 1 2 d B ) at the receiver’s audio
output. (The tone can just be discerned in the noise.)
Sometimes a noise weighting filter is required in the
receiver sensitivity measurement. Optional plug-in
Weighting Filters modify the frequency response of
the Distortion Analyzer with a bandpass characteristic that approximates the response of human hearing.
Weighting Filters which meet most international
standards are available.
Model 89033
General Information
I
SIN X AND 0.05 SIN 2X
SIN X AND 0.05 COS 2X
SIN X + 0.05 SIN 2X
SIN X + 0.05 COS 2X
SIN X AND 0.05 SIN 3X
SIN X AND 0.05 COS 3X
SIN X + 0.05 SIN 3X
SIN X + 0.05 COS 3X
Figure 1-4. Several Waveforms Each With 5% THD and the Signal Components Which Produced T h e m
1-11
Model 89033
General Information
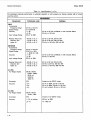
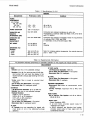
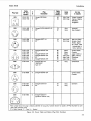
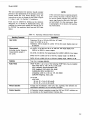
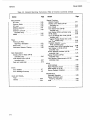
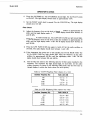
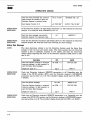
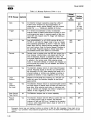
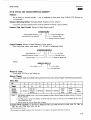
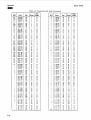
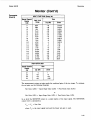
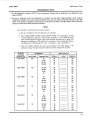
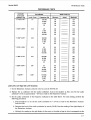
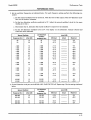
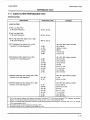
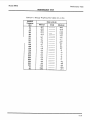
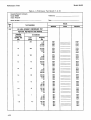
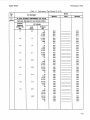
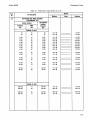
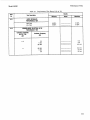
Table 1-1. Specifications (1 of 4)
All parameters describe performance in automatic operation or with properly set manual controls with a 1/2-hour
warrnup period.
MEASUREMENT
Characteristic
SINAD
Fundamental
Frequency Range
Display Range
Accuracy
Performance Limits
Input Voltage Range
20 Hz to 100 kHz
0 to 99.99 dB
21 dB
e 2 dB
50 rnV to 300V
Residual Noise and
Distortion (the
higher of)
-80 dB or 15 pV
-70 dB or 45 pV
-65 dB or 45 pV
DISTORTION
Fundamental
Frequency Range
Display Range
Input Voltage Range
20 Hz to 100 kHz
0.001% to 100%
(-99.99 to 0 dB)
21 dB
e2 dB
50 rnV to 300V
Residual Noise and
Distortion (the
higher of)
-80 dB or 15 pV
-70 dB or 45 pV
-65 dB or 45 UV
Accuracy
AC LEVEL
Full Range Display
Conditions
20 Hz to 20 kHz (unfiltered or with low-pass filters)
20 kHz to 100 kHz
20 Hz to 20 kHz; 80 kHz BW
20 Hz to 50 kHz; 500 kHz BW
50 kHz to 100 kHz; 500 kHz BW
20 Hz to 20 kHz (unfiltered or with low-pass filters)
20 kHz to 100 kHz
20 Hz to 20 kHz; 80 kHz BW
20 kHz to 50 kHz; 500 kHz BW
50 kHz to 100 kHz; 500 kHz BW
300.0V, 30.00V,
3.000V, .3000V,
30.00 rnV,
3.000 rnV,
.3000 mV
Overrange
33%
Except on the 300.0V range
Accuracy
2 2%
50 rnV to 300V; 20 Hz to 20 kHz
50 rnV to 300V; 20 kHz to 100 kHz
0.3 rnV to 50rnV; 20 Hz to 100 kHz
2 4%
e 4%
DC LEVEL
Full Range Display
Overrange
Accuracy
300.0V, 48.00V,
16.00V, 4.00V
33%
e 1.O% of reading
e6 rnV
1-12
Except on the 300.0V range
600 mV to 300V
Vin <600 rnV
Model
89033
General Information
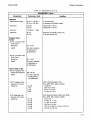
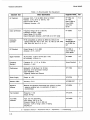
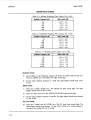
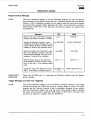
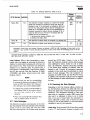
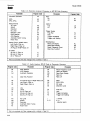
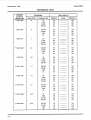
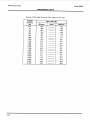
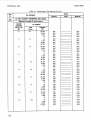
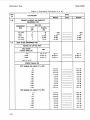
Table 1-1. Specifications (2 of 4)
MEASUREMENT (Cont'd)
Characteristic
FREQUENCY
Measurement Range
Performance Limits
Conditions
20 Hz to 150 kHz
20 Hz to 100 kHz
In ac level mode
In distortion and SINAD modes
Resolution
5 digits
0.01 Hz
Accuracy
~(0.004%+1 digit)
Frequencies >lo0 Hz
Frequencies 4 0 0 Hz
Sensitivity
50 mV
5.0 mV
STANDARD AUDIO
FILTERS
30 kHz Low-pass Filter
3 dB Cutoff
Frequency
Rolloff
80 kHz Low-pass Filter
3 dB Cutoff
Frequency
Rolloff
PLUG-IN AUDIO FILTERS
400 Hz Highpass Filter
3 dB Cutoff Frequency
Rolloff
CCllT Weighting Filter
Deviation from Ideal
Response:
CClR Weighting Filter
Deviation from Ideal
Response:
Distortion and SINAD modes only
In ac level mode only
30 t 2 kHz
3rd order response,
18 dB/octave or
60 dB/decade
80 24 kHz
3rd order response,
18 dB/octave or
60 dB/decade
400 240 Hz
7th order response:
42 dB/octave or
140 dB/decade
20.2 dB
21 dB
+2 dB
23 dB
+0.1 dB
+0.2 dB
20.4 dB
20.5 dB
~ 1 . 0dB
22.0 dB
CCllT Recommendation P53
20 to 55"C, 80% relative humidity
At 800 Hz
300 Hz to 3 kHz
50 Hz to 3.5 kHz
3.5 kHz to 5 kHz
CCIR Recommendation 468-2, DIN 45405
20 to 55OC, 80% relative humidity
At 6.3 kHz
6.3 kHz to 7.1 kHz
7.1 kHz to 10 kHz
200 Hz to 6.3 kHz
31.5 Hz to 200 Hz, 10 kHz to 20 kHz
20 kHz to 31.5 kHz
1-13
Model 89033
General Information
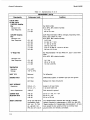
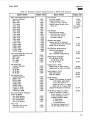
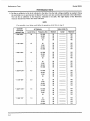
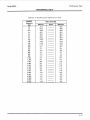
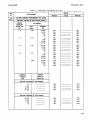
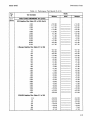
Table 1-1. Specifications (3 of 4)
I
I
MEASUREMENT (Cont'd)
Characteristic
Conditions
Performance Limits
~~
PLUG-IN AUDIO
FILTERS (Cont'd)
C-MESSAGE Weighting
Filter
Deviation from
Ideal Response:
CCIR/ARM Weighting
Filter
Deviation from
Ideal Response:
20.1 dB
21.0 dB
'er BSTM 41004
!O to 55"C, 80% relative humidity
At 1 kHz
60 Hz to 5 kHz
20.1 dB
20.2 dB
20.4 dB
20.5 dB
21.0 dB
22.0 dB
X I R Recommendation 486-2,averaging responding meter,
3olby Labs bulletin No. 19/4.
20 to 55OC, 80% relative humidity
At 6.3 kHz
6.3 kHz to 7.1 kHz
7.1 kHz to 10 kHz
200 H t to 6.3 kHz
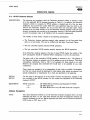
31.5 Hz to 200 Hz, 10 kHz to 20 kHz
20 kHz to 31.5 kHz
IEC Recomendation 179 and ANSI 3.4,type 1 sound level
meter
20 to 55OC, 80% relative humidity
"A"-Weight Filter
Deviation from
Ideal Response:
20.1 dB
20.5 dB
21.0 dB
At 1 kHz
20 Hz to 10 kHz
10 kHz to 20 kHz
TEMPERATURE
Operating
Storage
0" to 55OC
-550 to 75OC
INPUT TYPE
Balanced
Full differential
MAXIMUM INPUT
42V Peak
Differentially applied, or between high input and ground.
42V Peak
Between low input and ground.
100 kSZ 21%
101 kSZ 21%
Except in dc level mode
In dc level mode only
<300 pF
Each terminal to ground
COMMON MODE
REJECTION RATIO
>60 dB
>45 dB
>30 dB
20 Hz to 1 kHz, VIN< 2V
20 Hz to 1 kHz
20 Hz to 20 kHz
REMOTE OPERATION
HP-IB STD 488-1978
Compatibility Code:
SH1, AH1, T5, TEO,
L3, LEO S R I , RL1,
PPO, DC1, DT1, CO, El
The Hewlett-Packard Interface Bus (HP-IB) is HewlettPackard Company's implementation of IEEE Std. 488-1978,
"Digital Interface for Programmable Instrumentation". All functions except the line switch and the low terminal float/
ground switch are remotely controllable.
INPUT IMPEDANCE
Resistance
Shunt Capacitance
1-14
General Information
Model 89033
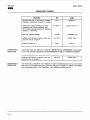
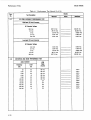
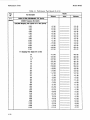
Table 1-1. Specifications (4 of 4)
I
I
I
I
GENERAL
Characteristic
~
~~
POWER
REQUIREMENTS
Line Voltage
100, 120, 220,
240 Vac
100, 120 Vac
Performance Limits
Conditions
+5%, -10%
+5%, -10%
48 to 66 Hz
48 to 440 Hz
POWER DISSIPATION
100 V.A maximum
CONDUCTED AND
RADIATED
INTERFERENCE (EMI)
MIL STD 461B
Conducted and radiated interference is within the
requirements of methods CEO3 and RE02 of MIL STD 461B
and FTZ 526/527.
MIL STD 461B-1980
Conducted and radiated susceptiblity meets the requirements
of methods CSO1, CS02, and RS03
(1 volt/meter) of MIL STD 4618 dated 1980.
11.8 kg (26 Ib)
15.9 kg (35 Ib)
Net
Shipping
146 mm (5.75 in.)
425 mm (16.8 in.)
462 mm (18.2 in.)
Note: For ordering cabinet accessories, the module sizes are
51/4H x 1MW x 17D.
CONDUCTED AND
RADIATED
SUSCEPTIBILITY
NET
DIMENSIONS (Full
Envelope)
Height
Width
Depth
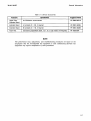
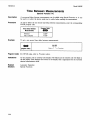
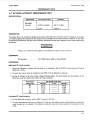
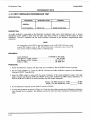
Table 1-2 Supplemental Information
All parameters describe performance in automatic operation or with properly set manual controls.
MEASUREMENT
SINAD
Detection true rms or rms calibrated average.
Resolution: 0.01 dB. For ratios less than 25 dB, Special Function 16.0 will round the display to the
nearest half dB to reduce .digit flickering with noisy
signals.
Tuning: notch filter is tuned to counted input
frequency.
Time to Return First Measurement: 1.5s typical.
Measurement Rate: 2.0 readings/s typical.
DISTORTION
3 dB Measurement Bandwidth: 10 Hz to 500 kHz.
Detection: true rms or rms calibrated average.
Displayed Resolution:
0.0001% (<0.1% distortion)
0.001YO (0.1YO to 3% distortion)
0.01YO (3% to 30% distortion)
0.1'10 (>30°/o distortion)
Time to Return First Measurement: 1.5s typical.
Measurement Rate: 2 reading+ typical.
AC LEVEL
AC Converter: true rms responding for signals with
crest factor of 1 3 or rms calibrated average
detection.
AC LEVEL (cont'd)
3 dB Measurement Bandwidth: >500 kHz.
Time to Return First Measurement: <1.5s typical.
Measurement Rate: 2.5 readings/s.
DC LEVEL
Time to Return First Measurement: 4 . 5 s typical.
Measurement Rate: 3 readingls.
FREQUENCY MEASUREMENT
Measurement Rate: same as measurement mode
selected.
Counting Technique: reciprocal with 2 MHz time
base.
AUDIO FILTERS
400 H t High-Pass Filter Rejection: >40 dB at 240 Hz;
>65dB at 60Hz.
Monitor Output
Output Impedance: 600fl.
In ac level mode, provides scaled output of
measured input signal.
In SINAD, distortion, and distortion level modes,
provides scaled output of input signal with the
fundamental removed.
1-15
Model 89033
General Information
Suggested Model
Critical Specifications
Instrument Type
Accuracy: 0.5%, 7 mV to 300V, 20 Hz to 100 kHz
Flatness: ~ 0 . 1 % ,20 Hr to 100 kHz, <6V
Output Current: 60 mA
Frequency Accuracy: 25%
HP 745A and
HP 746A,
Datron 4200 or
Fluke 5200A
and Fluke
5215A
Audio Synthesizer
Frequency Range: 20 H t to 500 kHz
Frequency Accuracy: 54ppm
Output Range: 3V into 600Q
Output Attenuation Accuracy: 20.075 dB, to 0.3 mV range
HP 3336C
Computing
Controller
HP-16 compatibility as defined by IEEE Std. 488 and the
identical ANSI Std. MC1.l: SHl, AH1, T2, TEO L2, LEO, SRO,
PPO, DCO, DTO, and C1, 2, 3, 4, 5.
HP 9825A/
98034Al98213A
or HP85B Opt.
007
DC Standard
Output Range: 3 mV to 300V
Accuracy: ?0.1% 20.3 mV
HP 7408 or
Datron 4000 or
Fluke 893AR
Digital Voltmeter
AC Accuracy: r0.2% at 6 Vrms and 1 kHz
DC Accuracy: +0.2% at 1V
Frequency
Standard
Frequency: 0.1, 1, 2, 5, or 10 MHz
Accuracy: r l ppm
House Standard
Oscilloscope
Bandwidth: <3 dB down 0 to 10 MHz
Sensitivity: 5 mV per division minimum
Input Impedance: 1 MQ
Triggering: Internal and External
HP 1740A
CAT
Power Supply
output: to 215v
HP 6215A
T
Resistor 100kQ
Accuracy:
Signature
Analyzer
Because the signatures documented are unique to a given
signature analyzer type, no substitution of types is
recommended.
AC Calibrator
Test Oscillator
True RMS
Voltmeter
5 0.1 O/O
Frequency: 1 kHz
Output: 30 Vpp
Type: true rms responding
Level Range: 100 mV to 1OV
Frequency Range: 20 Hz to 500 kHz
Accuracy: 20.2% of range 50.2% of reading
Coupling: ac
I
HP 0698-7497
P
HP 5005A
T
IT
I
I
I
A
I
HP 3310A
I
P
HP 3403C
I
1-16
Model 89033
General Information
Table 1-4. Service Accessories
Accessory
Specifications
Suggested Model
Digital Test/
Extender Board
No substitution recommended
HP 08903-60018
Extender Board
44 contacts (2 X 22), 3 required
HP 08901 -60084
Conductive polyurethane foam, 12 x 12 X 0.25 inches (nonmagnetic)
HP 4208-0094
Extender Board
Foam Pad
30 contacts (2 X 15), 2 required
HP 08901 -60085
NOTE
T h e performance tests, adjustments, and troubleshooting procedures are based o n the
assumption that the recommended test equipment is used. Substituting alternate test
equipment may require modification of some procedures.
1-17
Installation
Model 89033
Section 2
INSTALLATION
2-1. INTRODUCTION
This section provides the information needed to install the Distortion Analyzer. Included is information
pertinent to initial inspection, power requirements,
line voltage and fuse selection, power cables, interconnection, mating connectors, operating environment,
instrument mounting, storage, and shipment. In addition, this section also contains the procedure for setting the internal HP-IB talk and listen address
switches.
2-2. INITIAL INSPECTION
pZiiE-1
T o avoid hazardous electrical shock, do
not perform electrical tests when there are
signs of shipping damage to any portion
of the outer enclosure (covers, panels,
meters).
Inspect the shipping container for damage. If the
shipping container or cushioning material is damaged,
it should be kept until the contents of the shipment
have been checked for completeness and the instrument has been checked mechanically and electrically.
Procedures for checking electrical performance are
given in Section 4. If the contents are incomplete,
if there is mechanical damage or defect, or if the
instrument does not pass the electrical performance
test, notify the nearest Hewlett-Packard office. If the
shipping container is damaged, or the cushioning material shows signs of stress, notify the carrier as well
as the Hewlett-Packard office. Keep the shipping
materials for the carrier’s inspection.
2-3. PREPARATION FOR USE
2-4. Power Requirements
(WARNING
1
T o avoid the possibility of hazardous electrical shock, do not operate this instrument
at line voltages greater than 126.5 Vac
with line frequencies greater than 66 Hz.
Leakage currents at these line settings may
exceed 3.5 mA.
The Distortion Analyzer requires a power source of
100, 120, 220, or 240 Vac, +5% to -lo%, 48 to 66
Hz single phase or 100, 120 Vac, +5% to -lo%, 48
to 440 Hz single phase. Power consumption is 100
VA maximum.
T h i s is a Safety Class I product (that is,
provided with a protective earth terminal).
An uninterruptible safety earth ground
must be provided from the mains power
source to the product input wiring terminals, power cord, or supplied power cord
set. Whenever it is likely that the protection has been impaired, the product must
be made inoperative and be secured against
any unintended operation.
If this instrument is to be energized via
a n external autotransformer, make sure
the autotransformer’s common terminal is
connected to the earthed pole of the power
source.
2-5. Line Voltage and Fuse Selection
B E F O R E PLUGGING T H I S I N S T R U M E N T into the Mains (line) voltage, be
sure the correct voltage and fuse have been
selected.
Verify that the line voltage selection card and the
fuse are matched to the power source. Refer to Figure
2-1, Line Voltage and Fuse Selection.
Fuses may be ordered under HP part numbers 21100059, 1.5A (250V time delay) for 100/120 Vac operation and 2110-0018, 0.75A (250V, time delay) for
220/240 Vac operation.
2-6. Power Cables
I
WARNING
1
BEFORE CONNECTING THIS I N S T R U M E N T , the protective earth terminals of this instrument must be connected
to the protective conductor of the (Mains)
power cord. The Mains plug shall only be
inserted in a socket outlet provided with
a protective earth contact. The protective
action must not be negated by the use of
a n extension cord (power cable) without a
protective conductor (grounding).
2- 1
Installation
Model 89033
This instrument is equipped with a three-wire power
cable. When connected to an appropriate ac power
receptacle, this cable grounds the instrument cabinet.
The type of power cable plug shipped with each
instrument depends on the country of destination.
Refer to Figure 2-2 for the part numbers of the power
cables available.
following procedure explains how the switches are to
be set. Refer to Table 2-1 for a listing of the talk
and listen addresses. The address is factory set for
a Talk address of "\" and a listen address of "<". (In
binary, this is 11100; in decimal it is 28.) To change
the HP-IB address, the top cover of the Distortion
Analyzer must be removed.
2-7. HP-IB Address Selection
a. Disconnect the line (Mains) power cable.
a
This task should be performed only by service trained persons who are aware of the
potential shock hazard of working on an
i n s t r u m e n t w i t h p r o t e c t i v e covers
removed.
To avoid hazardous electrical shock, the
line (Mains) power cable should be disconnected before attempting to change the
HP-IB address.
In the Distortion Analyzer, the HP-IB talk and listen
addresses are selectable by an internal switch. The
b. Remove any HP-IB cables or connectors from
the HP-IB connector.
c.
Remove the Distortion Analyzer top cover.
1. Remove the two plastic feet from the rear of
the top cover by removing the panhead Pozidriv screw within each foot.
2. Unscrew the Pozidriv screw at the center of
the rear edge of the top cover. This is a
captive screw and will cause the top cover to
pull away from the front frame.
3. Lift off the top cover.
Operating voltage IS shown in module window.
To avoid the possibility of hazardous electrical
shock, do not operate this instrument at line
voltages greater than 126.5 Vac with line frequencies greater than 66 Hz (leakage currents
at these line settings may exceed 3.5 mA).
1. Open cover door, pull the FUSE PULL lever and rotate to left. Remove the fuse.
2. Remove t h e Line Voltage Selection Card. Position the card so the line voltage appears at top-left cover.
Push the card firmly into t h e slot.
3. Rotate the Fuse Pull lever to its normal position. Insert a fuse of the correct value in the holder. Close
the cover door.
Figure 2-1. Line Voltage and Fuse Selection
2-2
Model 89033
Installation
Cable
HP Part
Number
Plug
Description
Cable
Length
(inches)
Cable
Color
For Use
In Country
90
90
Mint Gray
Mint Gray
United Kingdom,
Cyprus, Nigeria,
Rhodesia,
Singapore
I
250v
8120-1351
8120-1703
0
6
1
250v
8120-1369
8120-0696
0
4
250v
@
8120-1689
8120-1692
7
2
Straight'CEE7-Y11
90"
79
79
Mint Gray
Mint Gray
East and West
Europe, Saudi
Arabia, Egypt,
So. Africa, India
(unpolarized in
many nations)
125V
8120-1378
8120-1398
8120-1754
8120-1378
8120-1521
8120-1676
5
5
7
1
6
2
Straight*NEMA&15P
90"
Straight'NEMA5-15P
Straight'NEMA5-15P
90"
Straight'NEMA5-15P
80
80
36
80
80
36
Black
Black
Black
Jade Gray
Jade Gray
Jade Gray
United States,
Canada,
Japan (1OOV or
200V), Mexico,
Phillipines,
Taiwan
250V
8120-2104
3
Straight'SEVl 011
1959-24507
Type 12
79
Gray
8120-0698
6
Straight'NEMA6-15P
220v
8120-1957
8120-2956
2
3
250v
8120-1860
6
I
fi
a
250v
I
I
Straight'BS1363A
90"
Gray
Gray
Australia,
New Zealand
Switzerland
United States,
Canada
no
I
I
~
Gray
Gray
Denmark
Straight'CEE22-VI
(Systems Cabinet use)
'Part number shown for plug is industry identifier for plug only. Number shown for cable is HP Part Number for complete cable including plug.
E = Earth Ground: L = Line; N = Neutral
Figure 2-2. Power Cable and Mains Plug Part Numbers
2-3
Model 89033
Installation
d. Locate the HP-IB address switch accessable
through a hole near the center rear of the internal
shield cover.
e. Use a pencil to set the switches to the desired
HP-IB address and Talk Only (TON) or Listen
Only (LON) condition. The switch is illustrated
in Figure 2-3. Facing the board, the left hand
switch (marked with a “5”) is the most significant
address bit (A5 in Table 2-1). Setting a switch
toward the printed circuit board places it in its
“1”position. If the TON and LON switches are
both set to “l”,the Talk Only setting will override.
If the address switches and the TON switch are
all set to “l”,the Distortion Analyzer will output
one byte (the status byte) each measurement
cycle. (Setting all switches to “1” defeats HP-IB
operation.)
-Table
2-1. Allowable HP-IB Address Codes
0
0
0
0
0
0
1
1
0
1
0
0
0
1
1
1
1
1
1
0
0
1
0
1
0
1
1
1
1
1
1
1
0
0
0
0
0
0
0
0
0
0
0
1
1
1
0
0
1
1
0
0
1
0
1
0
1
0
1
0
0
1
1
1
1
0
Figure 2-3. The HP-IB Address Switch Shown as
Set by the Factory. T h e Address Shown
is 11100 i n Binary with Both Talk Only
and Listen Only Off.
f.
Reinstall the top cover by reversing the procedure
in step c above.
g.
Connect the line (Mains) power cable to the Line
Power Module and reconnect the HP-IB cable
to the HP-IB connector.
h. To confirm the setting, refer to HP-IB Address
in the Detailed Operating I n s t r u c t i o n s in
Section3 of this manual.
2-8. Interconnections
Interconnection data for the Hewlett-Packard Interface Bus is provided in Figure 2-4.
2-4
1
1
1
1
1
1
L
M
0
0
1
1 1 1 1 1 1 1 1 0 1
#
12
-
13
14
N
0
P
Q
V
Y
9
S
T
U
\
1
n
15
16
17
18
19
20
I
0
1
2
3
4
5
6
R
Z
0
2
3
B
C
21
22
<
-
>
1
25
26
27
28
29
30
Model 89033
Installation
Temperature .....................
0°C to +55”C
Humidity . . . . . . . . . . . . . . . . . . . . . . . .
<95% relative
Altitude . . . . . . . . . . . . . <4570 meters (15 000 feet)
2-1 1. Bench Operation
The instrument cabinet has plastic feet and foldaway
tilt stands for convenience in bench operation. (The
plastic feet are shaped to ensure self-aligning of the
instruments when stacked.) The tilt stands raise the
front of the instrument for easier viewing of the front
panel.
2-12. Rack Mounting
1-1
The Distortion Analyzer is heavy for its
size (11.8 kg, 26 lb). Care must be exercised
when lifting to avoid personal injury. Use
equipment slides when rack mounting.
DO N O T BLOCK the ventilation holes i n
the bottom panel. Since this instrument
does not use a cooling fan, it is important
that good ventilation be provided. Allow
for 1 to 2 inches clearance around the
bottom panel.
Rack mounting information is provided with the rack
mounting kits. If the kits were not ordered with the
instrument as options, they may be ordered through
the nearest Hewlett-Packard office. Refer to paragraph 1-13, Mechanical Options, in Section 1.
Temperature . . . . . . . . . . . . . . . . . . -55°C to +75”C
Humidity . . . . . . . . . . . . . . . . . . . . . . . .
<95% relative
Altitude . . . . . . . . . . . . . 15 300 meters (50 000 feet)
2-15. Packaging
Original Packaging. Containers and materials identical to those used in factory packaging are available
through Hewlett-Packard offices. If the instrument
is being returned to Hewlett-Packard for servicing,
please fill out one of the blue tags located at the end
of this manual. Include on the tag the type of service
required, return address, model number, and full serial
number and attach it to the instrument. Mark the
container “FRAGILE” to assure careful handling. In
any correspondence refer to the instrument by model
number and full serial number.
Other Packaging. The following general instructions
should be used for re-packaging with commercially
available materials:
a.
b. Use a strong shipping container. A doublewall
carton made of 2.4 MPa (350 psi) test material
is adequate.
C.
2-13. STORAGE AND SHIPMENT
2-14. Environment
The instrument should be stored in a clean, dry
environment. The following environmental limitations apply to both storage and shipment:
Wrap the instrument in heavy paper or plastic.
(If shipping to a Hewlett-Packard office or service
center, complete one of the blue tags mentioned
above and attach it to the instrument.)
Use enough shock-absorbing material (75 to 100
mm layer; 3 to 4 inches) around all sides of
instrument to provide a firm cushion and prevent
movement in the container. Protect the front
panel with cardboard.
d. Seal the shipping container securely.
e.
Mark the shipping container “FRAGILE to assure careful handling.
2-5
Model 89033
Installation
SIGNAL GROUND
P/O TWISTED PAIR WITH 11
SHIELD -CONNECT
ATN
EARTH
SRQ
P/O TWISTED PAIR WITH 10
P/O TWISTED PAIR WITH 9
SHOULD BE GROUNDED
NDAC
P/O TWISTED PAIR WITH 7
P/O TWISTED PAIR WITH 6
TWISTED PAIR
GROUND
IFC
P/O TWISTED PAIR WITH 8
NEAR TERMINATION
OF OTHER WIRE OF
TO
NRFD
DAV
EO1
Dl0 4
DIO 3
Dl0 2
DIO 1
ISOMETRIC
THREAD M3.5
24-PIN MICRO-RIBBON
(SERIES 57) CONNECTOR
logic levels
The Hewlett-Packard Interface Bus logic levels are TTL compatible, that is, the true (1) state is
0.0 Vdc to +0.4 Vdc and the false (0) state is 2.5 Vdc to +5 Vdc.
Programming and Output Data Format
Refer to Section 3, “Operation”.
Mating Connector
HP 1251-0293; Amphenol 57-30240.
Mating Cables Available
HP 10631A, 1 meter (3.3 ft), HP 10631B, 2 meters (6.6 ft)
HP 10631C, 4 meters (13.2 ft), HP 10631D, 0.5 meters (1.6
ft)
Cabling Restrictions
1. A Hewlett-Packard Interface Bus system may contain no more than 2 meters (6.6 ft) of
connecting cable per instrument.
2. The maximum accumulative length of connecting cable for any Hewlett-Packard Interface Bus
system is 20 meters (65.6 ft).
Figure 2-4. Hewlett-Packard Interface Bus Connection
2-6
Model 89033
Operation
Section 3
OPERATION
3-1. INTRODUCTION
3-2. General
This section provides complete operating information
for the Distortion Analyzer. Included in this section
are descriptions of all front and rear-panel controls,
connectors, and indicators, remote and local operator’s checks, operating instructions, and operator’s
maintenance.
3-3. Operating Characteristics
A
Table 3- 1 briefly summarizes the major operating
characteristics of the Distortion Analvzer. The table
is not intended to be an in-depth listing of all operations and ranges but gives an idea of the instrument’s
capabilities. For more information on the Distortion
Analyzer capabilities, refer to the description in Section 1; Table 1-1, Specifications;and Table 1-2, Supplemental Information. For information on HP-IB
capabilities, refer to the summary contained in Table
3-3, Message Reference Table.
3-4. Turn-On Procedure
pziz-1
Before the Distortion Analyzer is switched
on, all protective earth terminals, extension
cords, auto-transformers, and devices connected to it should be connected to a protective earth socket. A n y interruption of
the protective earth grounding will cause
a potential shock hazard that could result
i n personal injury. I n addition, verify that
a common ground exists between the unit
under test and the Distortion Analyzer
prior to energizing either unit.
For continued protection against fire hazard, replace the line fuse with a 250V time
delay fuse of the same rating. Do not use
repaired f u s e s or short-circuited
fuseholders.
T o avoid the possibility of hazardous electrical shock, the input signal voltage on
the outer connector (referenced to ground),
is not to exceed 42V peak in the FLOAT
mode.
I n s i n g l e - e n d e d ( F L O A T s w i t c h in
grounded position) or differential (FLOAT
switch i n FLOAT position) operation, the
input signal voltage is not to exceed 300V
when referenced to ground, on the high
I N P U T connector (inside conductor of the
BNC).
I n differential (FLOAT switch in FLOAT
position) operation, the peak voltage on
the low INPUT connector (outer conductor
of the BNC) is not to exceed 42V.
Before the Distortion Analyzer is switched
on, it must be set to the voltage of the
power source, or damage to the instrument
may result.
If the Distortion Analyzer is already plugged in, set
the LINE switch to ON. If the power cable is not
plugged in, follow these instructions.
1. Check that the line voltage setting matches the
power source (see Figure 2-1).
2. Check that the fuse rating is appropriate for the
line voltage used (see Figure 2-1). Fuse Ratings
are given under paragraph 3-8, Operator’s
Maintenance.
3. Plug in the power cable.
4. Set the LINE switch to ON.
NOTE
When the L I N E switch is set to ON, all
front-panel indicators will light for approximately 4 seconds after which the instrument is ready to be operated.
3-5. Local Operation
Information covering front-panel operation of the
Distortion Analyzer is given in the sections described
below. To rapidly learn the operation of the instrument, begin with the Simplified Operation and Operator’s Checks. Once familiar with the general operation
of the instrument, use the Detailed Operating Instructions for in-depth and complete information on operating the Distortion Analyzer.
3- 1
Operation
Simplified Operation. Information on subsequent
pages under Simplified Operation provides a quick
introduction t o front-panel operation of the
Distortion Analyzer. It is designed to rapidly orient
the novice user with basic procedures and, therefore,
is not an exhaustive listing of all Distortion Analyzer
functions. However, an index to the Detailed Operating Instructions appears in Table 3-2 to guide the
operator to the more complete discussion of the topic
of interest.
Panel Features. Front-panel controls, indicators, and
connectors are illustrated and described in Figure 3-1.
This figure describes the functions of the various key
groups and summarize briefly how to use them. Rearpanel features are shown in Figure 3-2.
Detailed Operating Instructions. The Detailed Operating Instructions provide the complete operating
reference for the Distortion Analyzer user. The instructions are organized alphabetically by subtitle.
Not only do the instructions contain information on
the various measurements that can be made (listed
under titles such as AC Level, Distortion, etc.) but
there are also individual discussions of nearly all
controls, inputs, and outputs, (for example, AVG/
RMS Detector, Monitor, etc.). Also included are instructions for using the many User Special Functions
(for example, Hold Settings, Error Disable, Special
Functions, etc.). The Detailed Operating Instructions
are indexed by function in Table 3-2.
Each section contains a general description which
covers signal levels, ranges, and other general information. Following the description are related procedures,
an operating example, the relevant HP-IB codes, front
panel indications, and, where pertinent, a description
of the technique the Distortion Analyzer uses to make
the measurement. At the end of each discussion are
comments intended to guide the user away from
measurement pitfalls and to help get the most out
of the Distortion Analyzer. Also included are references to other sections which contain related information. The Detailed Operating Instructions are designed so that both casual and sophisticated users
can rapidly find a t one location all the information
needed to apply the instrument to the task at hand.
Supplemental Information. In addition to the information described above, several other discussions pertinent to the operating of the Distortion Analyzer to
its fullest capabilities are contained in Section 1 of
this manual. Principles of Operation for a Simplified
Block Diagram is a fundamental description of what
the Distortion Analyzer is, and how it works. This
information supplements the block diagrams given in
the Detailed Operating Instructions and provides a
3-2
Model 89033
basis for applying the Distortion Analyzer to various
measurement situations. Basics of Audio Measurements is a general discussion of audio measurements.
It is intended to provide an intuitive understanding
of audio measurements, rather than an in-depth mathematical analysis.
3-6. Remote Operation
The Distortion Analyzer is capable of remote operation via the Hewlett-Packard Interface Bus (HP-IB).
Instructions pertinent to HP-IB operation cover all
considerations and instructions specific to remote operation including capabilities, addressing, input and
output formats, the status byte, and service requests.
At the end of the discussion is a complete summary
of all codes and formats.
In addition to the section described above, information concerning remote operation appears in several
other locations. HP-IB Address selection is discussed
under paragraph 2-7 in Section 2. Numerous examples
of program strings appear throughout the Detailed
Operating Instructions described under Local Operation above.
3-7. Operator’s Checks
Operator’s checks are procedures designed to verify
the proper operation of the Distortion Analyzer’s
main functions. Two procedures are provided as described below.
Basic Functional Checks. This procedure requires
an audio oscillator, oscilloscope, and inter-connecting
cables. It assumes that most front-panel controlled
functions are being properly executed by the
Distortion Analyzer.
HP-IB Functional Checks. This series of procedures
requires an HP-IB compatible computing controller
and an HP-IB interface and connecting cable. The
HP-IB Functional Checks assume that front-panel
operation has been verified (for example, by performing the Basic Functional Checks). The procedures
check all of the applicable bus messages summarized
in Table 3-3.
3-8. Operator’s Maintenance
pG-1
For continued protection against fire hazard, replace the line fuse with a 250V time
delay fuse of the same rating only. Do not
use repaired f u s e s or short-circuited
fuseholders.
Model 89033
Operation
The only maintenance the operator should normally
perform is the replacement of the primary power fuse
located within the Line Power Module (A14). For
instructions on how to change the fuse, refer to Figure
2-1 steps 1 and 3 in Section 2, Installation.
Fuses may be ordered by looking up the reference
designator F1 in Section 6, Replaceable Parts, and
ordering the correct part number for 100/120 Vac or
for 2201240 Vac operation (both fuses are 250V time
delay).
NOTE
I f the instrument does not operate properly
and is being returned to Hewlett-Packard
for service, please complete one of the blue
repair tags located at the end of this manual and attach it to the instrument. Refer
to paragraph 2-15 in Section 2 for packaging instructions.
Table 3-1. Operating Characteristics Summary
Operating Parameter
Input Limits
Measurements
~
CaDa bilities
Frequency: 20 Hz to 100 kHz (150 kHz, AC Level)
Level: =O to 300V ac or dc.
Impedance: 100 kQ (except DC Level); 101 kQ (DC Level); floating input can
be selected.
~
~~
(including counter frequency
measurements except in
DC Level)
AC LEVEL: =O to 300 Vac; 20 Hz to 150 kHz. Full range display from
.3000 mV to 300.0V in seven ranges.
DC LEVEL 0 to 300 Vdc. Full range display from 4.000V to 300.0V in four ranges.
SINAD: 50 mV to 300V; 20 Hz to 100 kHz. Display range 0 to 99.99 dB.
DISTN: 50 mV to 300V; 20 Hz to 100 kHt. Display range -99.99 to 0 dB.
r
Detection
True rms or average detection.
Audio Filters
HP/BP FILTER-Up to two of the following HP/BP filters may be installed:
HIGH PASS 400 Hz: 400 240 Hz (3 dB cutoff)
CCllT Weighting: Recommendation P53.
CClR Weighting: CClR 468-2, DIN 45405
C-MESSAGE: BSTM #41009 FIG 1
A-Weighting: ANSI S1.4, IEC rec 179, DIN 45633
CCIR/ARM Weighting: Dolby Labs
LP FILTER
LOW PASS
30 kHz: 30 22 kHz (3 dB cutoff).
80 kHz: 80 24 kHz (3 dB cutoff).
Manual Operation
Average and rrns detection, notch tune, ratio, log/linear, filter selection and
measurement selections can be manually controlled.
All Distortion Analyzer operations except the LINE and FLOAT switches can
be controlled via the Hewlett-Packard Interface Bus.
3-3
Model 8903E
Operation
2
3
6
5
4
7
8
9
1
10
17
16
15
14
13
11
FLOAT switch provides floating input when
required.
1. HP-IB Annunciators indicate remote operation
status.
1
2. LCL (local) key returns the Distortion Analyzer to
keyboard control from remote (HP-IB) control.
12. LOW PASS 30 kHz and 80 kHz filters reject high
frequency noise.
3. Frequency Display Annunciators indicate the
frequency units.
13. RIGHT-MOST OPTIONAL PLUG-IN FILTER key selects the filter that is installed in the right-most filter
slot. The C-Message Weighting (bandpass) Filter
(Option 053) shown weights receiver testing according to BSTM 41004.
4. MEASUREMENT CYCLE Indicator blinks after each
measurement cycle.
5. The two Numeric Displays show the frequency,
measurement results, error codes, or instrument or
Special Function status.
6. Measurement Display Annunciators indicate the
measurement result units.
7. RATIO key causes measurements to be displayed
in % or dB relative to a reference.
8. LOG/LIN key causes results to be displayed in logarithmic or linear units.
9. MEASUREMENT keys command the Distortion
Analyzer to make and display the selected
measurement.
10. INPUT couples measurement signal into the instrument.
14. LEFT-MOST OPTIONAL PLUG-IN FILTER key selects
the filter that is installed in the left-most filter slot.
The CClR Weighting (bandpass) Filter (Option 012)
shown weights receiver testing according to CCIR
Recommendation 468-2, DIN 45405.
15. NOTCH TUNE key switches the Notch Filter tune
control between Auto Tuned and Hold mode (locking
the Notch Filter at its current frequency setting).
16. MONITOR OUTPUT in ac level mode, provides a
scaled voltage output representing the input signal.
In SINAD, distortion, and distortion level modes,
provides a scaled voltage output of the input signal
with fundamental removed. Output impedance is
6009.
17. LINE switch applies power to the Distortion Analyzer
when set to ON.
Figure 3-1. Front-Panel Features
3-4
12
Operation
Model 89033
SIMPLIFIED OPERATION
Measurement
fi
AC
For ac level or distortion measurements, press:
or
Filters
I
HP/BP Filter
Corresponding
Fllter
To activate any of the optional plug-in filters, press:
LP Filter
[
.
I
LOW PASS
To activate the LOW PASS 30 kHz filter, press:
30 kH2
I.1
RATIO and LOG/LIN
RATIO
To set the displayed measurement as the ratio reference, press:
0
wno
.
LOG/LIN
To convert from linear to logarithmic (or from logarithmic to linear) measurement units, press:
I
I
I
Measurement
Mode
-1
I
RATIO ofl
RATIO on
I
LOG
AC LEVEL
I
--
I
o(@>
LIN
LOG
V or mV
dBm into 600Q
dBm into 600Q
I
.
I
NOTE
Duringpower up, the Distortion Analyzer is initialized and set to automatic operation.
3-5
Model 89033
Operation
Table 3.2 . Detailed Operating Instructions Table of Contents (Functional Listing)
Section
Measurements
AC Level . . . . . . . . . . . . . . . . . . . . . . . . . . .
Common Mode ......................
DC Level ...........................
Detector Selection ....................
Distortion ...........................
Distortion Level (HP-IB
controlled only) .....................
SINAD . . . . . . . . . . . . . . . . . . . . . . . . . . . . . .
Page
3-33
3-36
3-39
3-41
3-43
3-45
3-78
Filters
Filters (Low.Pass.
High.Pass. Bandpass) . . . . . . . . . . . . . . . 3-51
Notch Tune .........................
3-67
Post-Notch Detector Filtering . . . . . . . . . . . 3-68
Data Manipulation
Display Level in Watts (HP-IB
controlled only) .....................
3-42
Hold Decimal Point (HP-I6
controlled only) .....................
3-57
Ratio and Log/Linear . . . . . . . . . . . . . . . . . 3-73
Errors
Error Disable ........................
3-47
Error Message Summary . . . . . . . . . . . . . . 3-48
Inputs and Outputs
Float . . . . . . . . . . . . . . . . . . . . . . . . . . . . . . .
Monitor . . . . . . . . . . . . . . . . . . . . . . . . . . . . .
3-6
3-55
3-64
Section
Page
Special Functions
Detector Selection ....................
3-41
Display Level in Watts (HP-IB
controlled only) .....................
3-42
Error Disable ........................
3-47
Hold Decimal Point (HP-IB
controlled only) .....................
3-57
Hold Settings (HP-IB controlled only) . . . . 3-58
HP-IB Address .......................
3-59
Input Level Range (DC Level) (HP-IB
controlled only) .....................
3-61
Input Level Range (Except DC Level)
(HP-IB controlled only) . . . . . . . . . . . . . . 3-62
Notch Tune .........................
3-67
Post-Notch Detector Filtering
(HP-IB controlled only) . . . . . . . . . . . . . . 3-68
Post-Notch Gain (HP-IB controlled only) . 3-69
Read Display to HP-IB (HP-IB
controlled only) .....................
3-75
Service Request Condition (HP-IB
3-76
controlled only) .....................
Special Functions (HP-IB
3-80
controlled only) .....................
Time Between Measurements (HP-IB
controlled only) .....................
3-86
HP-IB
HP-IB Address .......................
3-59
Rapid Frequency Count . . . . . . . . . . . . . . . 3-70
Read Display to HP-I6 . . . . . . . . . . . . . . . . 3-75
Service Request Condition . . . . . . . . . . . . . 3-76
Miscellaneous
Automatic Operation . . . . . . . . . . . . . . . . . . 3-35
Default Conditions and
Power-Up Sequence . . . . . . . . . . . . . . . . 3-40
Float . . . . . . . . . . . . . . . . . . . . . . . . . . . . . . .
3-55
Mode1 89033
Operation
HP-IB Connector connects the Distortion Analyzer to the Hewlett-Packard Interface Bus for
remote operations. When in remote mode, the
front-panel REMOTE annunciator lights.
Fuse. 1.50A (250V, time delay) for 100/120 Vac.
0.75A (250V, time delay) for 220/240 Vac.
/
\
Serial Number Plate. First four numbers and
letter comprise the prefix that denotes the instrument configuration. The last five digits form
the suffix that is unique to each instrument.
Line Power Module permits operation from
100, 120, 220, or 240 Vac. The number visible
in window indicates nominal tine voltage to
which instrument must be connected (see Figure 2-1). Center conductor is safety earth ground.
Figure 3-2. Rear Panel Features
1
3-7
Operation
Model 89033
OPERATOR’S CHECKS
3-9 OPERATOR’S CHECKS
3-10. Basic Functional Checks
DESCRIPTION
Using only an oscilloscope and an audio oscillator, the overall operation of the Distortion
Analyzer is verified.
OSClLLOSCOPE
II I
nI
VERTICAL
INPUT
U
0
II
0
0
8903E
ANAL.YZER
D I STORT ION
I
~
~~
onno
0
I
INPUT
0 €%?onI O
OUTPUT
AUDIO
OSC I LLATOR
Figure 3-3. Basic Functional Checks Setup
EQUIPMENT
Audio Oscillator ........................
HP339A or HP 8903B
Oscilloscope ....................................... HP1740A
PROCEDURE:
Preliminary Check
1. Remove any cables from the Distortion Analyzer’s INPUT. Set the LINE switch
to OFF, and then back to ON and note that the front-panel LED annunciators,
display segments and decimal points, and key lights turn on. All LEDs should light
for approximately three seconds.
2.
After the turn-on sequence, the left display should show 0.000 kHz and the right
display should show a low flickering value in mV. In addition, the measurement
cycle annunciator in the upper left-hand corner of the right display should be blinking
and the AC LEVEL and LOW PASS 80 kHz keys should light.
3.
Connect the audio oscillator output to the INPUT of the Distortion Analyzer with
a BNC-to-BNC cable. Set the FLOAT switch to the ground position. See Figure 3-3.
4.
Connect the oscilloscope to the MONITOR output. See Figure 3-3.
5. Set the audio oscillator to 1 Vrms at 1 kHz. The left display should show the
frequency of the audio oscillator, at approximately 1 kHz. The right display should
show the amplitude of the audio oscillator, a t approximately 1V. The oscilloscope
should show a 1kHz (1 ms period) sine wave of approximately 7 Vpp.
6. Press the RATIO key. The RATIO light should light. The right display should show
100%.
NOTE
I n this and the following steps, the displays may vary a few least-significant
digits.
7.
Press the AVG/RMS key. The AVG/RMS key should light. The right display should
remain at approximately 100%.
Model 89033
Operation
OPERATOR’S CHECKS
8.
Press the AVG/RMS key. The AVG/RMS key should light. Set the FLOAT switch
to FLOAT. The right display should remain a t approximately 100%.
9.
Set the FLOAT switch back to ground. Press the LOG/LIN key. The right display
should show 0.00 dB.
Filter Check
10. Adjust the frequency (but not the level) of the audio oscillator (to approximately 80
kHz) until the right display reads -3 dB. The left display should show between 72
and 88 kHz.
11. Press the LOW PASS 30 kHz key. The LOW PASS 30 kHz key light should light.
Adjust the frequency (but not the level) of the audio oscillator (to approximately 30
kHz) until the right display reads -3 dB. The left display should show between 26
and 34 kHz.
12. Press the LOW PASS 30 kHz key again to turn it off. Set the audio oscillator to
100 kHz. The right display should show between -1 and 1dB.
13. If the instrument has option 010 or 050 installed, press 400 Hz HIGH PASS. The
400 Hz HIGH PASS key light should light. Adjust the frequency of the audio
oscillator (to approximately 400 Hz) until the right display reads -3 dB. The left
display should show between 360 and 440Hz.
14. Press the filter key listed in the following table for the filter option installed in the
instrument. The respective key light should light. For each filter, set the audio
oscillator frequency as shown in the following tables. Verify that the level ratio in
the right display is within the limits shown for each frequency.
Oscillator Frequency (Hz)
300
800
3 000
3 500
5 000
Oscillator Frequency (Hz)
31.5
200
6 300
7 100
10 000
20 000
Ratio limits (dB)
-12.1
-0.4
-7.1
-11.5
-40.0
to -9.1
to +0.4
to -4.1
to -5.5
to -32.0
Ratio Limits (dB)
-31.4 to
-14.5 to
+12.0 to
+11.7 to
+7.5 to
-23.7 to
-28.4
-13.1
+12.4
+12.3
+8.7
-20.7
1
3-9
Operation
Model 89033
OPERATOR’S CHECKS
Table for C-Message Weighting Filter (Option 013 or 053)
Oscillator Frequency (Hz)
100
500
1 000
3 000
5 000
Ratio limits (dB)
-44.0
-9.0
-0.2
-4.0
-30.0
to -41.0
to -6.0
to
+0.2
to -1.0
to -27.0
Table f o r CCIRIARM Weighting Filter (Option 014 or 054)
Oscillator Frequency (Hz)
31.5
200
6 300
7 100
10 000
20 000
Oscillator Frequency (Hz)
50
200
1 000
2 000
10 000
20 000
Ratio Limits (dB)
-37.0 to
-20.1 to
+6.4 to
+6.1 to
11.9 to
-29.3 to
-34.0
-18.7
1-6.8
+6.7
+3.1
-26.3
Ratio Limits (dB)
-30.9 to
-11.7 to
-0.2 to
+0.5 to
-3.2 to
-10.8 to
-29.5
-10.3
+0.2
+1.9
-1.8
-7.8
Distortion Check
15. Set all filters on the Distortion Analyzer off. Press the LOW PASS 80 kHz key.
Press the DISTN key. The DISTN key light should light.
16. Set the audio oscillator frequency to 1 kHz. The right display should show 0.01%
or less.
SINAD Check
17. Press the S (Shift) SINAD keys. The SINAD key light should light. The right
display should show 80 dB or more.
18. Press the Notch Tune key. The NOTCH TUNE KEY light should light.
19. Set the audio oscillator frequency to 890 Hz. The right display should show between
12 and 19 dB.
D C Level Check
20.
3-10
Press the S (Shift) and DC LEVEL keys. The DC Level light should light. The
right display should show between -10 and 10mV. (With an ac voltage applied to
the input, the reading will not be steady.)
Model 89033
Operation
OPERATOR’S CHECKS
3-11. HP-I6 Functional Checks
DESCRIPTION:
The following ten procedures check the Distortion Analyzer’s ability to process or send
all of the applicable HP-IB messages described in Table 3-3. In addition, the Distortion
Analyzer’s ability to recognize its HP-IB address is checked and all of the bus data,
handshake, and control lines except D108 (the most significant data line which is not
used by the Distortion Analyzer) are set to both their true and false states. These
procedures do not check whether or not all Distortion Analyzer program codes are being
properly interpreted and executed by the instrument, however, if the front-panel operation
is good, the program codes, in all likelihood will be correctly implemented.
The validity of these checks is based on the following assumptions:
The Distortion Analyzer performs properly when operated via the front-panel keys
(that is, in local mode). This can be verified with the Basic Functional Checks.
The bus controller properly executes HP-IB operations.
The bus controller’s HP-IB interface properly executes the HP-IB operations.
If the Distortion Analyzer appears to fail any of these HP-IB checks, the validity of the
above assumptions should be confirmed before attempting to service the instrument.
The select code of the controller’s HP-IB interface is assumed to be 7. The address of
the Distortion Analyzer is assumed to be 28 (its address as set at the factory). This select
code-address combination (that is, 728) is not necessary for these checks to be valid.
However, the program lines presented here would have to be modified for any other
combination.
These checks are intended to be as independent of each other as possible. Nevertheless,
the first four checks should be performed in order before other checks are selected. Any
special initialization or requirements for a check are described at its beginning.
INITIAL
SETUP:
The test setup is the same for all of the checks. Connect the Distortion Analyzer to the
bus controller via the HP-IB interface. Do not connect any equipment to the Distortion
Analyzer’s INPUT.
EQUIPMENT:
HP-IB Controller . . . . . . HP 9825A/98213A (General and Extended 1/0 ROM)
-orHP 85B option 007
-orHP 9000 Model 226 or any H P 9000 series 200 Computer
Address Recognition
NOTE
This check determines whether or not the Distortion Analyzer recognizes when it is being
addressed and when it is not. This check assumes only that the Distortion Analyzer can
properly handshake on the bus. Before beginning this check, set the Distortion Analyzer’s
LINE switch to OFF, then to ON.
3-11
Operation
Model 89033
OPERATOR’S CHECKS
Description
Set the Remote Enable (REN) bus control
line false.
Send the Distortion Analyzer’s listen address.
OPERATORS
RESPONSE
IC1
7
wrt 728
BASIC
LOCAL 7
OUTPUT 728
Check that the Distortion Analyzer’s REMOTE annunciator is off and that its ADDRESSED annunciator is on.
Unaddress the Distortion Analyzer by sending a different address.
OPERATOR’S
RESPONSE
HPL
wrt 729
OUTPUT 729
Check that both the Distortion Analyzer’s REMOTE and ADDRESSED annunciators
are off.
Remote and Local Messages and the LCL Key
NOTE
This check determines whether the Distortion Analyzer properly switches from local to
remote control, from remote to local control, and whether the LCL key returns the
instrument to local control. This check assumes that the Distortion Analyzer is able to
both handshake and recognize its own address. Before beginning this check, set the
Distortion Analyzer’s LINE switch to OFF, then to ON.
~
Send the Remote message (by setting Remote Enable, REN, true and addressing the
Distortion Analyzer to listen).
OPERATOR’S
RESPONSE
3-12
Id 728
LOCAL 728
Check that the Distortion Analyzer’s REMOTE annunciator is off but its ADDRESSED
annunciator is on.
Send the Remote message to the Distortion
Analyzer.
OPERATOR’S
RESPONSE
REMOTE 728
Check that both the Distortion Analyzer’s REMOTE and ADDRESSED annunciators
are on.
Send the Local message to t h e Distortion
Analyzer.
OPERATORS
RESPONSE
~~
rem 728
rem 728
REMOTE 728
Check that both the Distortion Analyzer’s REMOTE and ADDRESSED annunciators
are on. Press the LCL key on the Distortion Analyzer. Check that the Distortion Analyzer’s
REMOTE annunciator is now off, but that its ADDRESSED annunciator remains on.
Model 89033
Operation
OPERATOR’S CHECKS
Sending the Data Message
NOTE
This check determines whether or not the Distortion Analyzer properly issues Data
messages when addressed to talk. This check assumes that the Distortion Analyzer is
able to handshake and recognize its own address. Before beginning this check, set the
Distortion Analyzer’s LINE switch to OFF, then to ON, then after the power-up sequence
is complete, press the DISTN key.
Description
Address the Distortion Analyzer to talk and
store its output data in variable V. (The output is E96 since there is no signal at its INPUT.)
Display the value of V.
OPERATOR’S
RESPONSE
HPL
BASIC
red 728,V
ENTER 728;V
dsp V
PRINT V
Check that the Distortion Analyzer’s REMOTE annunciator is off but that its ADDRESSED annunciator is on. The controller’s display should read 9009600000.00 (HPL)
or 9009600000 (BASIC).
Receiving the Data Message
NOTE
This check determines whether or not the Distortion Analyzer properly receives Data
messages. The Data messages sent also cause the 7 least significant HP-IB data lines to
be placed in both their true and false states. This check assumes the Distortion Analyzer
is able to handshake, recognize its own address and properly make the remote/local
transitions. Before beginning this check, set the Distortion Analyzer’s LINE switch to
OFF, then to ON.
Description
Send the first part of the Remote message
(enabling the Distortion Analyzer to remote).
Address the Distortion Analyzer to listen
(completing the Remote message), then
send a Data message (selecting the
Distortion measurement).
OPERATOR’S
RESPONSE
HPL
BASIC
rem 7
REMOTE 7
wrt 728,“M3
OUTPUT 728;“M3”
Check that both the Distortion Analyzer’s REMOTE and ADDRESSED annunciators
are on. Check also that its Distortion key light is on.
Local Lockout and Clear Lockout/Set Local Messages
NOTE
This check determines whether or not the Distortion Analyzer properly receives the Local
Lockout message, disabling all front-panel keys. The check also determines whether or
not the Clear Lockout/Set Local message is properly received and executed by the Distortion
Analyzer. This check assumes that the Distortion Analyzer is able to handshake, recognize
its own address, and properly make the remote/local transitions. Before beginning this
check, set the Distortion Analyzer’s LINE switch to OFF, then to ON.
3- 13
Operation
Model 89033
OPERATOR’S CHECKS
Description
HPL
Send the first part of the Remote message
(enabling the Distortion Analyzer to remote).
BASIC
rem 7
REMOTE 7
Send the Local Lockout message.
Address the Distortion Analyzer to listen
(completing the Remote message).
OPERATOR’S
RESPONSE
7
wrt 728
LOCAL LOCKOUT 7
OUTPUT 728
Check that both the Distortion Analyzer’s REMOTE and ADDRESSED annunciators
are on. Press the Distortion Analyzer’s LCL key. Both its REMOTE and ADDRESSED
annunciators should remain on.
Send the Clear Lockout/Set Local message.
OPERATOR’S
RESPONSE
I10
7
IC1
7
LOCAL 7
Check that the Distortion Analyzer’s REMOTE annunciator is off but its ADDRESSED
annunciator is on.
Clear Message
NOTE
This check determines whether or not the Distortion Analyzer properly responds to the
Clear message. This check assumes that the Distortion Analyzer is able to handshake,
recognize its own address, make the remote/local changes and receive Data messages.
Before beginning this check set the Distortion Analyzer’s LINE switch to OFF, then to
ON.
Description
Send the first part of the Remote message
(enabling the Distortion Analyzer to remote).
Address the Distortion Analyzer to listen
(completing the Remote message), then
send a Data message that selects the
Distortion measurement.
OPERATOR’S
RESPONSE
rem 7
REMOTE 7
wrt 728,”M3
OUTPUT 728;”M3”
clr 728
RESET 728
Check that both the Distortion Analyzer’s REMOTE and ADDRESSED annunciators
are on and that the AC LEVEL key light is on.
~
3-14
BASIC
Check that both the Distortion Analyzer’s REMOTE and ADDRESSED annunciators
are on and that the Distortion key light is also on.
Send the Clear message (setting the
Distortion Analyzer’s measurement to AC
LEVEL).
OPERATORS
RESPONSE
HPL
Operation
Model 89033
OPERATOR’S CHECKS
~~~~
~
Abort Message
NOTE
This check determines whether or not the Distortion Analyzer becomes unaddressed when
it receives the Abort message. This check assumes that the Distortion Analyzer is able
to handshake, recognize its own address, make the remote/local changes, and enter serial
poll mode. Before beginning this check, set the Distortion Analyzer’s LINE switch to
OFF, then to ON.
Description
Send the Remote message to the Distortion
Analyzer.
OPERATORS
RESPONSE
Distortion Analyzer to listen.
Address the Distortion Analyzer to talk and
store its output data in variable V.
cli 7
ABORT10 7
IC1
7
red 728.V
(The Local message was
already sent with the
ABORT10 7 statement
above.)
ENTER 728:V.
Check that the Distortion Analyzer’s REMOTE annunciator is off but that its ADDRESSED annunciator is on.
Send the Abort message, unaddressing the
Distortion Analyzer to talk.
OPERATOR’S
RESPONSE
REMOTE 728
Check that the Distortion Analyzer’s ADDRESSED annunciator is off. Note that the
BASIC “ABORTIO” statement sends both the Abort message and the Local message.
Thus if HPL is being used, the Distortion Analyzer’s REMOTE annunciator should
remain on. If BASIC is being used, the Distortion Analyzer’s REMOTE annunciator
should turn off.
Send the Local message (HPL only).
OPERATOR’S
RESPONSE
BASIC
Check that both the Distortion Analyzer’s REMOTE and ADDRESSED annunciators
are on.
Send the Abort message, unaddressing t h e
OPERATORS
RESPONSE
HPL
rem 728
cli 7
ABORT10 7
Check that both the Distortion Analyzer’s REMOTE an ADDRESSED annunciators are
off.
3-15
a
Operation
OPERATOR’S
RESPONSE
Model 89033
OPERATOR’S CHECKS
Send the serial poll-enable bus command
(SPE) through the interface to place the
Distortion Analyzer in serial-poll mode.
wti 0,7; wti 6,24
SENDBUS 728; 1,24
Send Special Function 61.3
wrt 728,”61.3SP”
OUTPUT 728; “61.3SP
On the Distortion Analyzer, the right display should show 1.0. This indicates the Distortion
Analyzer is in serial-poll mode (indicated by the “1”).
Send the Abort message, removing the
Distortion Analyzer from serial-poll mode.
OPERATORS
RESPONSE
cli 7
ABORT10 7
Check that the Distortion Analyzer’s right display shows 0.0. This indicates the Distortion
Analyzer properly left serial-poll mode upon receiving the Abort message.
Status Byte Message
NOTE
This check determines whether or not the Distortion Analyzer sends the Status Byte
message in both the local and remote modes. This check assumes that the Distortion
Analyzer is able to handshake, recognize its own address, and make the remote/local
changes. Before beginning this check, set the Distortion Analyzer’s LINE switch to OFF,
then to ON.
Description
Place the Distortion Analyzer in serial-poll
mode and address it to talk (causing it to
send the Status Byte message).
Display the value of V.
OPERATORS
RESPONSE
rds (728)
-
BASIC
V
dsp V
STATUS 728;V
PRINT V
Check that Distortion Analyzer’s REMOTE annunciator is off. Depending upon the
vintage of the HP-IB interface (HPL) used, the Distortion Analyzer’s ADDRESSED
annunciator may be either on or off. The controller’s display should read 0.00 (HPL) or
0 (BASIC).
Send the Remote message.
Place the Distortion Analyzer in serial-poll
mode and address it to talk (causing it to
send the Status Byte message).
Display the value of V.
3-16
HPL
-
rem 728
rds (728)
dsp V
REMOTE 728
V
STATUS 728;V
PRINT V
1
a
Model 89033
Operation
OPERATOR’S CHECKS
Require Service Message
NOTE
This check determines whether or not the Distortion Analyzer can issue the Require
Service message (set the SRQ bus control line true). This check assumes that the Distortion
Analyzer is able to handshake, recognize its own address, make the remote/local changes,
and receive Data messages. Before beginning this check, set the Distortion Analyzer’s
LINE switch to OFF, then to ON, then after the power-up sequence is complete, press
the DISTN key.
Description
Send the first part of the Remote message
(enabling the Distortion Analyzer to remote).
HPL
rem 7
BASIC
REMOTE 7
Address the Distortion Analyzer to listen
wrt 728.”22.4SP
(completing the Remote message) then send
a Data message (enabling a Require Service
message to be sent upon Instrument Error).
Make the controller wait 2 seconds to allow
time for t h e Distortion Analyzer to send the
Require Service message. (This step is not
necessary if sufficient time is allowed.)
Read the binary status of the controller’s
HP-IB interface and store the data in variable V (in this step, 7 is the interface’s select
code).
Display the value of the SRQ bit (in (in this
step, 7 is the SRQ bit, numbered from 0).
OPERATORS
RESPONSE
wait 2000
rds (7)
-
V
dsp“SRQ=”,bit
(77V)
OUTPUT 728;“22.4SP
WAIT 2000
STATUS 7; V
PRINT “SRQ=”;BIT(V,7)
Check that the SRQ value is 1, indicating the Distortion Analyzer issued the Require
Service message.
Trigger Message and Clear Key Triggering
NOTE
This check determines whether or not the Distortion Analyzer responds to the Trigger
message and whether the CLEAR key serves as a manual trigger in remote. This check
assumes that the Distortion Analyzer is able to handshake, recognize its own address,
make the remote/local changes, and send and receive Data messages. Before beginning
this check, set the Distortion Analyzer’s LINE switch to OFF, then to ON, then, when
the power-up sequence is complete, press the DISTN key.
3-17
a
Operation
Model 89033
OPERATOR’S CHECKS
Description
Send the first part of the Remote message
(enabling the Distortion Analyzer to remote).
HPL
rem 7
REMOTE 7
Address the Distortion Analyzer to listen
(completing the Remote message), then
send a Data message (placing the Distortion
Analyzer in Hold mode).
wrt 728, “Tl”
OUTPUT 728; “Tl”
trg 728
TRIGGER 728
red 728, V
ENTER 728;V
dsp V
PRINT V
Send the Trigger message.
Address the Distortion Analyzer to talk and
store the data in variable V.
Display the value of V.
OPERATORS
RESPONSE
Check that both the Distortion Analyzer’s REMOTE and ADDRESSED annunciators
are on. The controller’s display should read 9009600000.00 (HPL) or 9009600000 (BASIC).
I
OPERATOR’S
RESPONSE
3-18
~~~
Address the Distortion Analyzer to talk and
store the data in variable V.
red 728,V
I
~
ENTER~~~:V-~
Check that the controller’s “run” indicator is still on indicating that it has not received
data from the Distortion Analyzer. Press the Distortion Analyzer’s S (Shift) AVG/RMS
keys (instrument clear). The controller’s “run” indicator should turn off.
Model 89033
3-12. REMOTE OPERATION, HEWLETTPACKARD INTERFACE BUS
The Distortion Analyzer can be operated through the
Hewlett-Packard Interface Bus (HP-IB). Bus compatibility, programming, and data formats are described
in the following paragraphs.
Except for the LINE switch, the low terminal ground/
FLOAT switch, and the Controller Reset Service Special Function, all Distortion Analyzer operations (including service related f u n c t i o n s ) a r e fully
programmable via H P - I B . I n addition, rapid
frequency count capabilities (not available from the
front-panel) are provided in remote operation. All
the Special Functions and t h e distortion level
measurement mode are available only through HP-IB
control.
A quick test of the HP-IB 1/0 is described under
HP-IB Functional Checks. These checks verify that
the Distortion Analyzer can respond to or send each
of the applicable bus messages described in Table 3-3.
For more information about HP-IB, refer to IEEE
Standard 488, ANSI Standard MC1.1, the HewlettPackard Electronic Systems and Instruments catalog,
and the booklet, “Improving Measurements in Engineering and Manufacturing” ( H P part number
5952-0058).
3-13. HP-IB Compatibility
The Distortion Analyzer’s complete bus compatibility
(as defined by IEEE Standard 488, and the identical
ANSI Standard MC1.l) is described at the end of
Table 3-3. Table 3-3 also summarizes the Distortion
Analyzer’s HP-IB capabilities in terms of the twelve
bus messages in the left-hand column.
3-14. Remote Mode
Remote Capability. In remote, most of the Distortion
Analyzer’s front-panel controls are disabled (exceptions are the LCL key and the Clear Key Function,
S (Shift) AVG/RMS). However, front-panel displays
and the signal at various outputs remain active and
valid. In remote, the Distortion Analyzer may be
addressed to talk or listen. When addressed to listen,
the Distortion Analyzer will respond to the Data,
Trigger, Clear (SDC), and Local messages. When addressed to talk, the Distortion Analyzer can issue the
Data and Status Byte messages. Whether addressed
or not, the Distortion Analyzer will respond to the
Clear (DCL), Local Lockout, Clear Lockout/Set
Operation
Local, and Abort messages, and in addition, the
Distortion Analyzer may issue the Require Service
message. Local-to-Remote Mode Changes. The
Distortion Analyzer switches to remote operation
upon receipt of the Remote message. The Remote
message has two parts. They are:
Remote enable bus control line (REN) set true
Device listen address received once (while REN is
true)
When the Distortion Analyzer switches to remote,
both the REMOTE and ADDRESSED annunciators
on its front panel will turn on.
3-15. Local Mode
Local Capability. In local, the Distortion Analyzer’s
front-panel controls are fully operational and the instrument will respond to the Remote message.
Whether addressed or not, it will also respond to the
Clear, Local Lockout, Clear Lockout/Set Local, and
the Abort messages. When addressed to talk, the
instrument can issue Data messages and the Status
Byte message, and whether addressed or not, it can
issue the Require Service message.
Remote-to-Local Mode Changes. The Distortion
Analyzer always switches to local from remote whenever it receives the Local message (GTL) or the Clear
Lockout/Set Local message. (The Clear Lockout/Set
Local message sets the Remote Enable control line
[REN] false.) If it is not in Local Lockout mode, the
Distortion Analyzer switches to local from remote
whenever its front panel LCL key is pressed.
3-16. Addressing
The Distortion Analyzer interprets the byte on the
bus’ eight data lines as an address or a bus command
if the bus is in the command mode: attention control
line (ATN) true and interface clear control line (IFC)
false. Whenever the Distortion Analyzer is being addressed (whether in local or remote), the ADDRESSED annunciator on the front-panel will turn
on.
The Distortion Analyzer talk and listen addresses are
switch selectable as described under paragraph 2-7
in Section 2. Refer to Table 2-1 for a comprehensive
listing of all valid HP-IB address codes. To determine
the present address setting, refer to the discussion
titled HP-IB Address in the Detailed Operating Instructions near the end of this section.
3-19
Operation
Model 89033
Table 3-3. Message Reference Table (1 of 2)
ipplicable
Yes
Related
Commands Interface
and
Functions'
Controls
Response
All Distortion Analyzer operations except the LINE and
AH 1
SH1
T5, TEO
L3, LEO
FLOAT switch functions are bus-programmable. All
measurement results, special displays, and error outputs
except the - - -" display are available to the bus.
'I-
Yes
If in remote and addressed to listen, the Distortion
Analyzer makes a settled measurement according to previously programmed setup. It responds equally to bus command GET and program code T3, Trigger with Settling (a
Data message).
GET
DT1
Yes
Sets MEASUREMENT to AC LEVEL with the 80 kHz LP
FILTER on, and sets the trigger mode to free run. Resets
many additional parameters as shown in Table 3-5. Clears
Status Byte, RQS bit, Require Service message (if issued)
and Local Lockout. Sets the Service Request Condition to
the 22.2 state. Responds equally to Device Clear (DCL)
and Selected Device Clear (SDC) bus commands.
DCL
SDC
DC1
Yes
Remote mode is enabled when the REN bus control line is
true. However, remote mode is not entered until the first
time the Distortion Analyzer is addressed to listen. The
front-panel REMOTE annunciator lights when the instrument
is actually in the remote mode. When entering remote
mode, no instrument settings or functions are changed, but
all front-panel keys except LCL are disabled, and entries in
progress are cleared.
REN
RL1
Yes
The Distortion Analyzer returns to local mode (front-panel
control). Responds equally to the GTL bus command and
the front-panel LCL key. When entering local mode, no instrument settings or functions are changed but entries in
progress are cleared. In local, triggering is free run only.
GTL
RL1
Yes
Disables all front-panel keys including LCL. Only the controller can return the Distortion Analyzer to local (frontpanel control).
LLO
RL1
Clear
Lockout/
Set Local
Yes
The Distortion Analyzer returns to local (front-panel control)
and local lockout is cleared when the REN bus control line
goes false. When entering local mode, no instrument settings or functions are changed, but entries in progress are
cleared. In local, triggering is free run only.
REN
RL1
Pass Control/
Take Control
No
The Distortion Analyzer has no control capability.
Require
Service
Yes
The Distortion Analyzer sets the S R Q bus control line true
if an invalid program code is received. The Distortion
Analyzer will also set S R Q true, if enabled by the operator
to do so, when measurement data is ready or when an instrument error occurs.
~~~
~~
co
SRQ
SR1
*Commands, Control lines, and Interface Functions are defined in IEEE Std. 488. Knowledge of these might not be
necessary if your controller's manual describes programming in terms of the twelve HP-IB Messages shown in the left
column.
3-20
Operation
Model 89033
Table 3-3. Message Reference Table (2 of 2)
Response
The Distortion Analyzer responds to a Serial Poll Enable
(SPE) bus command by sending an 8-bit byte when addressed to talk. If the instrument is holding the SRQ control line true (issuing the Require Service message) bit 7
(RQS bit) in the Status Byte and the bit representing the
condition causing the Require Service message to be issued will both be true. The bits in the Status Byte are
latched but can be cleared by:
1) removing the causing condition, and
2) reading the Status Byte.
Yes
Status Byte
c-c
It
Status Bit
Abort
I
I
~~~
Related
Commands Interface
Functions*
and
Controls
SPE
SPD
~
The Distortion Analyzer does not respond to a parallel poll.
Yes
T5, TEO
The Distortion Analyzer stops talking and listening.
PPO
~~
I FC
I
T5, TEO
L3, LEO
'Commands, Control lines, and Interface Functions are defined in IEEE Std. 488. Knowledge of these might not be
necessary if your controller's manual describes programming in terms of the twelve HP-IB Messages shown in the left
column.
Complete HP-IB capability as defined in IEEE Std. 488 and ANSI Std. MC1.1 is: SH1,AH1, T5,
SR1, RL1, PPO,DC1, DT1, CO, El.
Local Lockout. When a data transmission is interrupted, which can happen by returning the Distortion
Analyzer to local mode by pressing the LCL key, the
data could be lost. This would leave the Distortion
Analyzer in an unknown state. To prevent this, a
local lockout is recommended. Local lockout disables
the LCL key (and the Clear Key Function, S (Shift)
AVG/RMS) and allows return-to-local only under
program control.
NOTE
Return-to-local can also be accomplished
by turning the Distortion Analyzer's LINE
switch to OFF, then back to ON. However,
this technique has several disadvantages:
I t defeats the purpose and advantages of
local lockout (that is, the system controll e r will l o s e c o n t r o l of a s y s t e m
element).
There are several HP-IB conditions that
reset to default states at turn-on.
3-17. Data Messages
The Distortion Analyzer communicates on the interface bus primarily with data messages. Data messages
consist of one or more bytes sent over the 8 data
bus lines, when the bus is in the data mode (attention
TEO,L3, LEO,
control line [ATN] false). Unless it is set to Talk
Only, the Distortion Analyzer receives data messages
when addressed to listen. Unless it is set to Listen
Only, the Distortion Analyzer sends data messages
or the Status Byte message (if enabled) when addressed to talk. Virtually all instrument operations
available in local mode may be performed in remote
mode via data messages. The only exceptions are
changing the LINE switch and the FLOAT switch.
In addition, the Distortion Analyzer may be triggered
via data messages to make measurements at a particular time.
3-18. Receiving the Data Message
Depending on how the internal address switches are
set, the Distortion Analyzer can either talk only, talk
status only, listen only, or talk and listen both (normal
operation). The instrument responds to Data messages when it is enabled to remote (REN control line
true) and it is addressed to listen or set to Listen
Only. If not set to Listen Only, the instrument remains addressed to listen until it receives an Abort
message or until its talk address or a universal unlisten
command is sent by the controller.
Listen Only. If the internal LON (Listen Only) switch
is set to "l",the Distortion Analyzer is placed in the
3-21
Operation
Model 89033
Listen Only mode when the remote enable bus control
line (REN) is set true. The instrument then responds
to all Data messages, and the Trigger, Clear, and
Local Lockout messages. However, it is inhibited from
responding to the Local or Abort messages and from
responding to a serial poll with the Status Byte
message.
Listen Only mode is provided to allow the Distortion
Analyzer to accept programming from devices other
than controllers (for example, card readers).
Data Input Format. The Data message string, or
program string, consists of a series of ASCII codes.
Each code is typically equivalent to a front-panel
keystroke in local mode. Thus, for a given operation,
the program string syntax in remote mode is the
same as the keystroke sequence in local mode.
Example 1 shows the general case programming order
for selecting Distortion Analyzer functions. Specific
program order considerations are discussed i n
following paragraphs under “Program Order Considerations”. All functions can be programmed together
as a continuous string as typified in Example 2. The
string in Example 2 clears most Special Functions
(with Automatic Operation), selects a distortion
measurement with 30 kHz low-pass filtering and log
units, then triggers a settled measurement.
Program Codes. All of the valid HP-IB codes for
controlling Distortion Analyzer functions are summarized in Table 3-6. All front-panel keys except the
LCL key have corresponding program codes.
Table 3-4 shows the Distortion Analyzer’s response
to various ASCII characters not used in its code set.
The characters in the upper table will be ignored
unless they appear between two characters of a
program code. The characters in the lower table, if
received by the Distortion Analyzer, will always cause
Error 24 (invalid HP-IB code) to be displayed and
a Require Service message to be generated. The controller recognizes the invalid code entry and clears
the Require Service condition. Thereafter, the invalid
code entry is ignored, and subsequent valid entries
are processed in normal fashion. As a convenience,
all lower case alpha characters are treated as upper
case.
In addition to the ignored codes given in Table 3-4,
codes used in the H P 8903A and 8903B Audio Analyzers but not common to the Distortion Analyzer are
ignored. (They do not generate an error message.)
For example, the output code ”APlVL”, which sets
the audio analyzer’s source to lV, will be ignored.
I
I
Table 3-4. Distortion Analyzer Response
to Unused ASCII Codes
lgnoredt
Generate Error 24
@
B
E
G
Z
[.
I
J
A
-
\
Q
1
Y
DEL
I
tExcept when inserted between two characters of a
program code.
1
EXAMPLE 1: General Program Syntax and Protocol*
{
Controller Talk
Audio Analyzer Listen
[Automatic Operation] [Measurement] [Filters] [Special Functions] [Log/Lin] [Ratio] [Trigger]
‘Excluding Rapid Frequency Count Mode
EXAMPLE 2: Typical Program String
Controller Talk
Audio Analyzer Listen
rTL_
A U M S L l LGT3
Automatic Operation
Distortion
2
-Trigger
30 kHz Low-Pass Filter
3-22
-1
Log
With Settling
Model 89033
Operation
Turning off Functions. When operating in local mode
the High-Pass/Bandpass (optional plug-in filters) and
Low-Pass Filters and the Notch Tune, the AVG/
RMS, and Ratio functions toggle on and off with
successive keystrokes. In remote mode, these functions do not toggle on and off. Instead, each of the
above groups has a specific code which turns off all
the keys in the group. The HP-IB codes for turning
off these functions are given in the table below.
I
I
Function
HP-IB Code
I
Average off (returns to R M S mode)
HP/BP FILTERS all off
LP FILTERS all off
NOTCH HOLD off
RATIO off
Programming Numeric Data. When entering ratio
references to the Distortion Analyzer, certain precautions should be observed. Numeric data may be
entered in fixed, floating point, or exponential formats. Usually, numeric data consists of a signed mantissa of up to five digits (including leading zeros),
one decimal point, and one- or two-digit signed exponent. The decimal point may fall between any two
digits of the mantissa but should not appear ahead
of the fiist digit. If it does, a leading zero will be
automatically inserted by the Distortion Analyzer.
Any digit beyond the five allowed for the mantissa
will be received as zero. The general format for numeric data entry is given below, followed by several
examples illustrating various entries and the resulting
data as received by the Distortion Analyzer.
General Numeric Data Input Format:
+DDDDDE+NN
T
5-Digit S i g n e d A
Mantissa
T
IIL
T
T
L E x p o n e n t Magnitude
Indicates Exponent Follows
Exponent Sign
Example: + .12345E+01 issued
Example:
0.123403+01 received by
Distortion Analyzer
Example: +1234563+01 issued
Example: +12345OE+Ol received by
Distortion Analyzer
Example: +00012345 issued
Example:
12000
received by
Distortion Analyzer
In general, do not issue numeric data with more
significant digits than can be displayed on the
Distortion Analyzer’s five-digit left display.
Triggering Measurements with the Data Message.
A feature that is only available via remote programming is the selection of free run, standby, or triggered
operation of the Distortion Analyzer. During local
operation the Distortion Analyzer is allowed to free
run, outputting d a t a t o t h e display a s each
measurement is completed. In remote, three additional operating modes are allowed: Hold, Trigger
Immediate, and Trigger with Settling. In addition,
the Clear Key Function can act as a manual trigger
while the instrument is in remote. The trigger modes
and use of the Clear Key Function are described
below.
Free Run (TO). This mode is identical to local
operation and is the mode of operation in effect when
no other trigger mode has been selected. The
measurement result data available to the bus are
constantly being updated as rapidly as the Distortion
Analyzer can make measurements. A Device Clear
message or entry into remote from local sets the
Distortion Analyzer to the Free Run mode.
Hold (Tl). This mode is used to set up triggered
measurements (initiated by program codes T2 or T3,
the Trigger message, or the Clear Key Function explained below). In Hold mode, internal settings can
be altered by the instrument itself or by the user via
the bus. Thus, the signal at the MONITOR output
can change. However, the instrument is inhibited
from outputting any data to the front-panel key lights
and display, or to the HP-IB except as follows. The
instrument will issue the Require Service message or
if an HP-IB code error occurs. The instrument will
issue the Status Byte message if serial polled. (A
serial poll, however, will trigger a new measurement,
update displays, and return the instrument to Hold.)
Upon leaving Hold, the front-panel indications are
updated as the new measurement cycle begins. The
Status Byte will be affected (and the Require Service
message issued) by the events that occur during the
new measurement cycle. The Distortion Analyzer
leaves Hold when it receives either the Free Run,
Trigger Immediate, Trigger with Settling codes, or
the Trigger Message, when the S (Shift) AVG/RMS
keys (the Clear Key Function) are pressed (if not in
Local Lockout), or when it r e t u r n s t o local
operation.
Trigger Immediate (T2). When the Distortion
Analyzer receives the Trigger Immediate code, it
akes one measurement in the shortest possible time.
he instrument then waits for the measurement
results to be read. While waiting, the instrument can
!
3-23
Operation
process most bus commands without losing the
measurement results. However, if the instrument receives GTL (Go To Local), GET (Group Execute
Trigger), or its listen address or if it is triggered by
the Clear Key Function, a new measurement cycle
will be executed. Once the data (measurement results)
are read onto the bus, the Distortion Analyzer reverts
to the Hold mode. Measurement results obtained via
Trigger Immediate are normally valid only when the
instrument is in a steady, settled state.
Trigger with Settling (T3).Trigger with Settling
is identical t o Trigger Immediate except t h e
Distortion Analyzer inserts a settling-time delay
before taking the requested measurement. This settling time is sufficient to produce valid, accurate
measurement results. Trigger with Settling is the trigger type executed when a Trigger message is received
via the bus.
Triggering Measurements with the Clear Key
Function. When the Distortion Analyzer is in remote
Hold and not in Local Lockout, the front-panel Clear
Key Function may be used to issue a Trigger with
Settling instruction. First place the instrument in
Hold mode (code Tl). Trigger the measurement by
pressing the S (Shift) and AVG/RMS keys. Each
time this key sequence is entered the Distortion
Analyzer performs one Trigger with Settling
Measurement cycle, then waits for the data to be
read. Once the data is read out to the bus, the instrument returns to Hold mode. If data is not read
between trigger cycles, it will be replaced with data
acquired from subsequent measurements.
Special Considerations for Triggered Operation.
When in free-run mode, the Distortion Analyzer must
pay attention to all universal bus commands, for
example, serial poll enable (SPE), local lockout (LLO),
etc. In addition, if it is addressed to listen, it must
pay attention to all addressed bus commands, for
example, Go To Local (GTL), Group Execute Trigger
(GET), etc. As a consequence of this, the Distortion
Analyzer must interrupt the current measurement
cycle to determine whether any action in response
to these commands is necessary. Since many elements
of the measurements are transitory, the measurement
must be re-initiated following each interruption.
Thus, if much bus activity occurs while the Distortion
Analyzer is trying to take a measurement, that
measurement may never be completed.
Trigger Immediate and Trigger with Settling provide
a way to avoid this problem. When the Trigger Immediate (T2) and Trigger with Settling (T3) codes are
received, the Distortion Analyzer will not allow its
measurement to be interrupted. (Indeed, handshake
3-24
Model 89033
of bus commands is inhibited until the measurement
is complete.) Once the measurement is complete, bus
commands will be processed, as discussed under Trigger Immediate above, with no loss of data. Thus, in
an HP-IB environment where many bus commands
are present, Trigger Immediate or Trigger with Settling should be used for failsafe operation.
Reading Data from the Right or Left Display. The
Distortion Analyzer can only read data to the HP-IB
once for each measurement made. Only the information on one display can be read each time. Use the
codes RR (read right display) or RL (read left display)
to control which information is read. The display
will remain selected until the opposing display is
specified (or until a clear message is received or powerup occurs). Errors (which occupy two displays) are
o u t p u t a s described above, a n d DC LEVEL
measurement results (always occupying the right
display only) are placed on the bus (when requested)
regardless of which display is enabled.
Program Order Considerations. Although program
string syntax is virtually identical to keystroke order,
some program order considerations need
highlighting.
Automatic Operation (AU). When Automatic Operation is executed in remote only, it sets all Special
Functions prefixed 1 through 8 to their zero-suffix
mode and also affects many other Special Functions.
Thus when Automatic Operation is used, it should
appear at the beginning of a program string.
Trigger Immediate and Trigger with Settling
(T2 and T3). When either of the trigger codes T2
or T3 is received by the Distortion Analyzer, a
measurement is immediately initiated. Once the
measurement is complete, some bus commands can
be processed without losing the measurement results.
However, any HP-IB program code sent to the
Distortion Analyzer before the triggered measurement
results have been output will initiate a new
measurement Thus, trigger codes should always appear at the end of a program string, and the triggered
measurement results must be read before any additional program codes are sent.
3-19. Sending the Data Message
Depending on how the internal address switches are
set, the Distortion Analyzer can either talk only, talk
status only, listen only, or talk and listen both (normal
operation). If set to both talk and listen, the instrument sends Data messages when addressed to talk.
The instrument then remains configured to talk until
it is unaddressed to talk by the controller. T o
unaddress the Distortion Analyzer, the controller
must send either an Abort message, a new talk address, or a universal untalk command.
Model 89033
Operation
Talk Only Mode. If the internal address switches are
set to a valid Talk address and the TON (Talk Only)
switch is set to “l”,the Distortion Analyzer is placed
in the Talk Only mode. In this mode instrument is
configured to send Data messages whenever the bus
is in the data mode. Each time the measurement is
completed, the measurement result will be output to
the bus unless the listening device is not ready for
data. If the listener is not ready and the Distortion
Analyzer is n o t i n a trigger mode, a n o t h e r
measurement cycle is executed.
Talk Status Only Mode. If all the internal address
switches and the TON (Talk Only) switch are set to
“l”,but the LON (Listen Only) switch is set to “0”,
the Distortion Analyzer is placed in the Talk Status
Only mode. In this mode the instrument is configured
to send a one-byte data message whenever the bus
is in the data mode. The byte sent is an exact copy
of the Status Byte. Each time this byte is successfully
sent on the bus, the internal Status Byte is cleared.
The Data Valid (DAV) handshake line is pulsed each
time the one-byte Data message is sent.
Data Output Format. As shown below, the output
data is usually formatted as a real constant in exponential form: first the sign, then five digits (leading
zeros not suppressed) followed by the letter E and a
signed power-of-ten multiplier. (Refer to Rapid
Frequency Count in the Detailed Operation Instructions for the only exception to this format.) The
string is terminated by a carriage return (CR) and a
line feed (LF), string positions 11 and 12. Data is
always output in hndamental units (for example, Hz,
volts, dB, %, etc.), and the decimal point (not sent)
is assumed to be to the right of the fifth digit of the
mantissa. Data values never exceed 4 000 000 000.
Data Output Format:
+DDDDDE+NNCRLF
Signed Mant
r
Indi cates Exponent Fo I lows
Exponent Sign
][-rLL
Line Feed
Carriage Return
Exponent Magnitude
NOTE
For the only exception to the above format,
refer to Rapid Frequency Count in the
Detailed Operating Instructions.
When an error is output to the bus, it follows the
same twelve-byte format described above except most
of the numeric digits have predetermined values as
shown below. Error o u t p u t s always exceed
9 000 000 000. The two-digit error code is represented
by the last two digits of the five-digit mantissa. The
error code can be derived from the string by subtracting 9 X lo9, then dividing the results by 100000.
Error Output Format:
3
+900DDE+05CR L F
Error Code
P
L
i
n
e Feed
Carriage Return
3-20. Receiving the Clear Message
The Distortion Analyzer responds to the Clear message
by assuming the settings detailed in Table 3-5. The
Distortion Analyzer responds equally to the Selected
Device Clear (SDC) bus command when addressed to
listen, and the Device Clear (DCL) bus command
whether addressed or not. The Clear message clears
any pending Require Service message and resets the
Service Request Condition (Special Function 22) such
that the Require Service message will be issued on
HP-IB code errors only (Special Function 22.2).
Table 3-5. Response to a Clear Message
Parameter
Settina
Measurement
Detection
Low-Pass (LP) Filter
High-Pass (HP)/ Bandpass (BP) (optional
plug-in Filters)
Special Functions
AC Level
RMS
80 kHz Low-Pass On
Ratio
Log/Lin
Off
Right Display Read
Service Request Condition
Status Byte
Trigger Mode
Local Lockout
All off
All Special Functions off or set to their zero-suffix mode
except Service Request Condition set to 22.2 (HP-I8
code error).
Linear (Refer to RATIO and LOG/LIN Detailed Operating
Instructions.)
Enabled
HP-IB Code Error Only
Cleared
Free Run (Code TO)
Cleared
3-25
Operation
3-21. Receiving the Trigger Message
When in remote and addressed to listen, t h e
Distortion Analyzer responds to a Trigger message
by executing one settled-measurement cycle. The
Distortion Analyzer responds equally to a Trigger
message (the Group Execute Trigger bus command
[GET]) and a Data message, program code T3 (Trigger
with Settling). Refer to “Triggering Measurements
with the Data Message” under paragraph 3-18, Receiuing the Data Message.
3-22. Receiving the Remote Message
The Remote message has two parts. First, the remote
enable bus control line (REN) is held true, then the
device listen address is sent by the controller. These
two actions combine to place the Distortion Analyzer
in remote mode. Thus, the Distortion Analyzer is
enabled to go into remote when the controller begins
the Remote message, but it does not actually switch
to remote until addressed to listen the first time. No
instrument settings are changed by the transition
from local to remote, but the Trigger mode is set to
Free Run (code TO). When actually in remote, the
Distortion Analyzer lights its front-panel REMOTE
annunciator. When the Distortion Analyzer is being
addressed (whether in remote or local), its front-panel
ADDRESSED annunciator turns on.
3-23. Receiving the Local Message
The Local message is the means by which the controller sends the Go To Local (GTL) bus command. If
addressed to listen, the Distortion Analyzer returns
to front-panel control when it receives the Local
message. If the instrument was in local lockout when
the Local message was received, front-panel control
is returned, but lockout is not cleared. Unless it receives the Clear Lockout/Set Local message, the
Distortion Analyzer will return to local lockout the
next time it goes to remote. No instrument settings
are changed by the transition from remote to local,
but all measurements are made in a free run mode.
When the Distortion Analyzer goes to local mode,
the front-panel REMOTE annunciator turns off.
However, when the Distortion Analyzer is being addressed (whether in remote or local), its front-panel
ADDRESSED annunciator lights.
If the Distortion Analyzer is not in local lockout
mode, pressing the front-panel LCL (local) key might
interrupt a Data message being sent to the instrument,
leaving the instrument in a state unknown to the
controller. This can be prevented by disabling the
Distortion Analyzer’s front-panel keys entirely using
the Local Lockout message.
3-26
Model 89033
3-24. Receiving the Local Lockout Message
The Local Lockout message is the means by which
the controller sends the Local Lockout (LLO) bus
command. If in remote, the Distortion Analyzer responds to the Local Lockout Message by disabling
the front-panel LCL (local) key and the Clear Key
Function. (In remote, the Clear Key Function initiates
a Trigger with Settling cycle.) The local lockout mode
prevents loss of data or system control due to someone
accidentally pressing front-panel keys. If, while in
local, the Distortion Analyzer is enabled to remote
(that is, REN is set true) and it receives the Local
Lockout message, it will switch to remote mode with
local lockout the first time it is addressed to listen.
When in local lockout, the Distortion Analyzer can
be returned to local only by the controller (using the
Local or Clear Lockout/Set Local messages), or by
setting the LINE switch to OFF and back to ON,
or by removing the bus cable.
3-25. Receiving the Clear LockoutlSet Local
Message
The Clear Lockout/Set Local message is the means
by which the controller sets the Remote Enable
(REN) bus control line false. The Distortion Analyzer
returns to local mode (full front-panel control) when
it receives the Clear Lockout/Set Local message. No
instrument settings are changed by the transition
from remote with local lockout to local. When the
Distortion Analyzer goes to local mode, the frontpanel REMOTE annunciator turns off.
3-26. Receiving the Pass Control Message
The Distortion Analyzer does not respond to the
Pass Control message because it cannot act as a
controller.
3-27. Sending the Require Service Message
The Distortion Analyzer sends the Require Service
message by setting the Service Request (SRQ) bus
control line true. The instrument can send the Require
Service message in either local or remote mode. The
Require Service message is cleared when a serial poll
is executed by the controller or if a Clear message
is received by the Distortion Analyzer. (During serial
poll, the Require Service message is cleared immediately before the Distortion Analyzer places the Status
Byte message on the bus.) An HP-IB code error will
always cause a Require Service message to be issued.
In addition, there are two other conditions which
can be enabled to cause the Require Service message
to be sent when they occur. All three conditions are
described as follows.
a
Model 89033
Operation
Data Ready: When the Distortion Analyzer is ready
to send any information except error codes or the
Status Byte.
HP-IB Code Error: When the Distortion Analyzer
receives an invalid Data message. (This condition
always causes a Require Service message to be sent.)
NOTE
The “ - - - - ”display indicates a transient
condition. After nine attempts to make a
measurement, it is replaced by Error 31
which causes the Require Service message
to be sent.
Instrument Error: When any Error is being
displayed by the Distortion Analyzer including HPIB Code error, Error 24.
3-28. Selecting the Service Request
Condition
Use Special Function 22, Service Request Condition,
to enable the Distortion Analyzer to issue the Require
Service message on any of the conditions above (except HP-IB code errors which always cause the Require Service message to be sent). The Service
Request Condition Special Function is entered from
HP-IB. The conditions enabled by Special Function
22 are always disabled by the Clear message. A
description of the Service Request Condition Special
Function and the procedure for enabling the various
conditions are given under Service Request Condition
in the Detailed Operation Instructions. Normally,
device subroutines for the Distortion Analyzer can
be implemented simply by triggering measurements
then reading the output data. In certain applications,
the controller must perform other tasks while controlling the Distortion Analyzer. Figure 3-7 illustrates a
flow chart for developing device subroutines using
the instrument’s ability to issue the Require Service
message when data is ready. This sub-routine structure frees the controller to process other routines
until the Distortion Analyzer is ready with data.
3-29. Sending the Status Byte Message
The Status Byte message consists of one %bit byte
in which 3 of the bits are set according to the enabled
conditions described above under Sending the Require
Service Message. If one or more of the three conditions described above are both enabled and present,
all the bits corresponding to the conditions and also
bit 7, the RQS bit, will be set true (and the Require
Service message is sent). If one of the above conditions occurs but has not been enabled by Special
Function 22, neither the bit corresponding to the
condition nor the RQS bit will be set (and the Require
Service message will not be sent). The bit pattern of
the Status Byte is shown in the table labeled “Status
Byte:”, on the following pages.
Once the Distortion Analyzer receives the serial poll
enable bus command (SPE), it is no longer allowed
to alter the Status Byte. When addressed to talk
(following SPE), the Distortion Analyzer sends the
Status Byte message.
NOTE
Since the Distortion Analyzer cannot alter
the Status Byte while in serial poll mode,
it is not possible to continually request the
Status Byte while waiting for a condition
to cause a bit to be set.
After the Status Byte message has been sent it will
be cleared if the Serial Poll Disable (SPD) bus command is received, if the Abort message is received,
or if the Distortion Analyzer is unaddressed to talk.
Regardless of whether or not the Status Byte message
has been sent, the Status Byte and any Require
Service message pending will be cleared if a Clear
message is received. If the instrument is set to Talk
Only, the Status Byte is cleared each time the onebyte Data message is issued to the bus.
3-30. Sending the Status Bit Message
The Distortion Analyzer does not respond to a Parallel Poll Enable (PPE) bus command, and thus cannot
send the Status Bit Message.
3-31. Receiving the Abort Message
The Abort Message is the means by which the controller sets the Interface Clear (IFC) bus control line
true. When the Abort message is received, the
Distortion Analyzer becomes unaddressed and stops
talking or listening.
3-27
Model 89033
0peration
T
INTERRUPT ON SRO
( START 8903E )
SET TRIGGER
MODE TO HOLD
(HP-18 CODE T1)
I
I
ENABLE SRQ ON
DATA READY
(HPIIB CODE 22.3SP)
I
READ STATUS BYTE
FROM 8903E
I
I
SRQ FROM
TO OTHER INSTRUMENT
SERVICE ROUTINES
8903E
I
c
I
CONF 1 GURE
MEASUREMENT
I
TRIGGER MEASUREMENT
(HP-IB CODE T2
OR T3).
I
I
1
PROCESS OTHER
ROUTINES UNTIL
SRQ CAUSES INTERRUPT
TEST OTHER 8903E
SRQ CONDITIONS
le
1
NO < 9 :DUE
: t n TO
t p DATA
Y E S
I
READ DATA
FROM 8903E
(-)
4
I
Figure 3-4. Example Flow Chart for Driving the Distortion Analyzer Using the Require Service Message (SRQ)
3-28
Model 89033
Operation
HP-IB SYNTAX AND CHARACTERISTICS SUMMARY
Address:
Set in binary by internal switches - may be displayed on front panel using S (Shift) LCL. Factory set
to 28 decimal.
General Operating Syntax: (Excluding Rapid Frequency Count modes.)*
[Automatic Operation]
[Measurement] [Filters] [Special Functions] [Log/Lin] [Ratio]
Numeric Data Input Format: (Except in Rapid Source mode.)*
f DDDDDEkNN
5-Digit Signed Mantissa
(leading decimal not allowed)
Exponent Magnitude
Exponent Sign
Indicates Exponent Follows
Output Formats: (Except in Rapid Frequency Count mode.)*
Data (valid data output value always <4 X 10⁹ and in fundamental units):
TI TT
+DDDDDE+NNCRLF
Signed M a n t i s s a r
Indicates Exponent Follows
Exponent Sign
Bit
Weight
Service
Request
Condition
~~~~
Line Feed
Carriage Return
Exponent Magnitude
8
7
6
5
4
3
2
1
128
64
32
16
8
4
2
1
0 (always)
R Q S Bit
Require
Service
0 (always)
0 (always) 0 (always)
Instrument
Error
HP4B
Code
Error
Data
Ready
~
* For information on Rapid Frequency Count mode refer to it by name in the Detailed Operating Instructions.
3-29
Model 89033
Operation
Table 3-6. Distortion Analyzer Parameter to HP-IB Code Summary
Parameter
Program Code
Automatic Operation
AU
SPCL
SPCL SPCL
SP
ss
Measurements
AC Level
SINAD
Distortion
DC Level
Distortion Level
RMS Detector
AVG Detector
Automatic Notch Tuning
Notch Hold
M1
M2
M3
s1
s3
A0
A1
NO
N1
Internal Plug-in HP/BP Filters
Left Plug-in Filter on
Right Plug-in Filter on
All Plug-in HP/BP Filters off
H1
H2
HO
LP Filters
30 kHz LP Filter on
80 kHz LP Filter on
All LP Filters off
L1
L2
LO
Parameter
Program Code
Ratio
On
Off
R1
RO
Log/Lin
Log
Lin
LG
LN
Trigger Modes
Free Run
Hold
Trigger Immediate
Trigger with Settling
TO
T1
T2
T3
Miscellaneous
Read Left Display
Read Right Display
Rapid Frequency Count
Clear Key Function*
RL
RR
RF
CL
'Not to be confused with Clear message which is defined in Table 3.
Table 3-7. Audio Analyzer HP-IB Code to Parameter Summary
Program Code
A0
A1
AU
RMS Detector
AVG Detector
Automatic Operation
CL
Clear Key Function*
HO
H1
H2
All Internal Plug-in HP/BP Filters
LG
LO
L1
L2
Log
Linear
All LP Filters off
30 kHz LP Filter on
80 kHz LP Filter on
M1
M2
M3
NO
N1
AC Level
SINAD
Distortion
Automatic Notch Tuning
Notch Hold
LN
11 Program COG
Parameter
Left Plug-in Filter on
Right Plug-in Filter on
off
RF
RL
RR
RO
R1
Rapid Frequency Count
Read Left Display
Read Right Display
Ratio on
Ratio off
SP
s3
SPCL
SPCL SPCL
DC Level
Distortion Level
TO
T1
T2
T3
Free Run
Hold
Trigger Immediate
Trigger with Settling
-
- (minus)
ss
s1
0-9
*Not to be confused with Clear messaae which is defined in Table 3-3.
3-30
Parameter
0-9
. (decimal point)
Model 89033
Operation
Table 3-8. Distortion Analyzer Special Function to HP-IB Code Summary
~~
Special Function
Program Code
~
~
~~
Special Function
Program Code
~~
Input Level Range (except DC Level)
Automatic Selection
300V range
189V range
119V range
75.4V range
47.6V range
30.0V range
18.9V range
11.9V range
7.54V range
4.76V range
3.00V range
1.89V range
1.19V range
0.754V range
0.476V range
0.300V range
0.189V range
0.1 19VV range
0.0754V range
1.OSP
1.lSP
1.2SP
1.3SP
1.4SP
1.5SP
1.6SP
1.7SP
1.8SP
1.9SP
1.1OSP
1.1lSP
1.12SP
1.13SP
1.14SP
1.15SP
1.16SP
1.17SP
1.18SP
1.19SP
Input Level Range (DC Level only)
Automatic Selection
300V range
64V range
16V range
4V range
2.0SP
2.1 SP
2.2SP
2.3SP
2.4SP
Post Notch Gain
Automatic Selection
0 dB gain
20 dB gain
40 dB gain
60 dB gain
3.0SP
3.1 SP
3.2SP
3.3SP
3.4SP
Hold Decimal Point
Automatic Selection
DDDD. range
DDD.D range
DD.DD range
D.DDD range
O.DDDD range
DD.DD rnV range
D.DDD mV range
0.DDDD rnV range
4.0SP
4.1 SP
4.2SP
4.3SP
4.4SP
4.5SP
4.6SP
4.7SP
4.8SP
Post Notch Detector Response
(except in SINAD)
Fast RMS Detector
Slow RMS Detector
Fast AVG Detector
Slow AVG Detector
5.0SP
5.1 SP
5.2SP
5.3SP
Notch Tune
Automatic notch tuning
Hold notch tuning
6.0SP
6.1SP
Error Disable
All errors enabled
Disabled Analyzer errors
(Errors 12-17,31, and 96)
Disable External Source errors
(Error 19)
Hold Settings
Hold input level ranges,
post-notch gain, decimal
point and notch tuning
at present settings.
8.0SP
8.1 SPor
8.3SP
8.2SP'
*(This code is
ignored)
9.OSP
Re-enter Ratio Mode
Restore last RATIO reference
and enter RATIO mode if allowed.
Display RATIO reference.
11.OSP
11.1SP
Time Between Measurements
Minimum time between
measurements
Add 1s between measurements
14.0SP
14.1SP
SINAD Display Resolution
0.01 dB above 25 dB;
0.5 dB below 25 dB
0.01 dB all ranges
Display Level in Watts
Display level as watts into 852.
Display level as watts into NNNR.
Read Display to HP-IB.
Read right display.
Read left display.
HP-IB Address
Displays HP-IB address (in binary)
in left display; right display
in form TLS where T = l
means talk only; L=l means
listen only; S=l means SRQ.
Displays HP-IB address in decimal.
HP-I6 Service Request Condition
Enable a Condition to cause a
service request, N is the sum
of any combination of the
weighted conditions below:
1-Data Ready
2-HP-IB error
4-Instrument error
The instrument powers up in
the 22.2 state (HP-IB error).
16.0SP
16.1 SP
19.OSP
19.NNNSP
20.0SP
20.1SP
21.OSP
21.1 SP
22.NSP
3-31
Model 89033
Operation
ASCII
-
Octal
Decima
decimal
ASCII
0
1
2
3
00
01
02
03
0
01 000 000
01 000 001
01 000 010
01 000 011
100
101
102
103
40
41
42
43
D
01 000 100
01 000 101
01 000 110
01 000 111
104
105
106
107
44
45
46
47
-
NUL
SOH
STX
ETX
00 000 000
00 000 001
00 000 010
00 000 011
000
00 1
002
003
EOT
EN0
ACK
BEL
00 000 100
00 000 101
00 000 110
00 000 111
004
005
006
007
4
5
6
7
04
05
06
07
BS
HT
LF
VT
00 001 000
00 001 001
00 001 010
00001 011
010
011
012
013
8
H
10
11
08
09
OA
OB
01 001 000
01 001 001
01 001 010
01 001 011
48
49
4A
48
FF
so
014
015
016
017
12
13
14
15
OD
L
M
SI
00 001 100
00 001 101
00 001 110
00001 111
oc
110
111
112
113
01 001 100
01 001 101
01 001 110
01 001 111
114
115
116
117
4c
40
4E
4F
DLE
DC1
DC2
DC3
00 010 000
00 010 001
00 010 010
00 010 011
020
021
022
023
16
17
18
19
10
11
12
13
01 010 000
01 010 001
01 010 010
01 010 011
120
121
122
123
50
51
52
53
DC4
NAK
SY N
ETB
00 010 100
00 010 101
00 010 110
00 010 111
024
025
026
027
20
21
22
23
14
15
16
17
01 010 100
01 010 101
01 010 110
01 010 111
124
125
126
127
54
CAN
EM
SUB
ESC
00011 OOO
00 011 001
00 011 010
00 011 011
030
031
032
18
19
1A
1B
X
Y
033
24
25
26
27
01 011 000
01 011 001
01 011 010
01 011 011
130
131
132
133
58
59
5A
58
FS
GS
RS
00011 111
034
035
036
037
28
29
30
31
1c
1D
1E
1F
\
us
00 011 100
00 011 101
00 011 110
01 011 100
01 011 101
01 011 110
01 011 111
134
135
136
137
5c
5D
5E
5F
SP
00 100 OOO
00 100 001
00 100 010
00100011
040
041
042
043
32
33
34
35
20
21
22
23
01 100 000
01 100 001
01 100010
01 100011
140
141
142
143
60
61
62
63
00 100 loo
00 100 101
00 100 110
00 100 111
044
045
046
047
36
37
38
39
24
25
26
27
d
e
f
01 100 100
01 100 101
01 100 110
01 100 111
144
145
146
147
64
65
66
67
00 101 000
00 101 001
00 101 010
00 101 011
050
051
052
053
40
41
42
43
28
29
2A
28
h
01 101 000
01 101 001
01 101 010
01 101 011
150
151
152
153
68
69
6A
6B
/
00 101 100
00 101 101
00 101 110
00 101 111
054
055
056
057
44
45
46
47
2c
2D
2E
2F
I
m
n
01 101 100
01 101 101
01 101 110
01 101 111
154
155
156
157
6C
60
6E
6F
0
1
2
3
00 110 000
00 110 001
00 110 010
00110011
060
061
062
063
48
49
50
51
3G
P
q
r
01 110 000
01 110 001
01 110010
01 110011
160
161
162
163
70
71
72
73
4
00 110 100
00 110 101
00 110 110
00 110 111
064
065
066
067
52
53
54
34
35
36
37
t
01 110 100
01 110 101
01 110 110
01 110 111
164
165
166
167
74
75
76
77
00 111 000
00 111 001
00 111 010
00 111 011
070
071
072
073
56
57
58
59
38
39
3A
38
01 111 000
01 111 001
01 111 010
01 111 011
170
171
172
173
78
79
7A
78
00 111 100
00 111 101
00 111 110
00 111 111
074
075
076
077
60
61
62
63
3c
3D
3E
3F
01 111 100
174
7c
7D
7E
CR
I
#
$
010
8
(
)
-
5
6
7
8
9
7
3-32
Binary
3-9. Commonly- Used Code Conversions
-Table
Hexa-
9
55
OE
OF
31
32
33
A
B
C
E
F
G
I
J
K
N
0
P
a
R
S
T
U
v
W
Z
I
I
A
a
b
C
9
I
I
k
0
S
U
v
W
X
Y
z
i
I
DEL
-
55
56
57
7F
~
Model 8903B
Operation
AC Level
Description
The Distortion Analyzer contains a wideband, true rms or average-responding voltmeter
with high accuracy and sensitivity. Pressing the AC LEVEL key causes the Distortion
Analyzer to measure the differential ac voltage between the center and outer conductor of
the INPUT connector or, for Option 001 only, the center conductors of the (rear-panel)
INPUT connectors. Signals common to both high and low inputs are rejected. See the
following Warning and Caution.
T o avoid the possibility of hazardous shock on standard instruments (those
without Option OOl), do not apply more than 42Vpeak to the outer conductor
of the BNC I N P U T connector when the FLOAT switch is in the FLOATposition.
Do not apply more than 300 Vrms (either differential, common-mode, or a
combination) to the I N P U T connector(s).
Procedure
To make an ac level measurement, press the AC LEVEL key. AC level results can be
displayed in V, mV, B m , watts, or as the ratio to an entered or measured value. The
Distortion Analyzer powers up displaying ac level in linear units (mV or V). To obtain a
display in dBm (that is, dI3 relative to 1 milliwatt into a 600-ohm load, equivalent to dBre
0.775V), press the LOG/LIN key. To return to linear, simply press the LOG/LIN key again.
If the ac level is to be displayed relative to a reference, refer to Ratio and LOG/LIN.-
Example
To measure the ac level of a signal at the INPUT connector:
LOCAL
(keystrokes)
Measurement7
AC
iY
M1
(program codes)
T
Measurement
Program Code M1 is the program code for AC LEVEL.
Indications
When ac level is selected, the LED within the AC LEVEL key will light. The right display
shows the ac level with the appropriate units. The Distortion Analyzer automatically ranges
for maximum resolution and accuracy. The left display shows the input signal frequency. If
the input level to the frequency counter is too small, the left display will show 0.000 kHz.
(This will often occur when the signal is in the stop band of the optional plug-in HP/BP
filters, but not the low-pass filters.)
Measurement In ac level the Distortion Analyzer acts as an ac voltmeter. The Distortion Analyzer
automatically sets the input attenuation and the gain settings of the various amplifiers so
Technique
that the input signal amplitude lies within the range of the output detector. The output
3-33
Model 8903B
Operation
AC Level (cont’d)
Measurement
Technique
(cont’d)
detector converts the ac level to a dc voltage which is then measured by the dc voltmeter
and after correction for input gain and attenuation, displayed in appropriate units. The
frequency of the input signal is also measured and displayed.
COUNTER/
LEFT DISPLAY
(FREQUENCY)
INTERNAL
PLUG-IN
HP/BP
FILTERS
INPUT
OUTPUT
LOW-PASS
-
RWAVG
DETECTOR
b
INPUT
AMPLIFIER
PROGRAMABLE
GAIN AMPLIFIER
PR~GRAHAELE
GAIN AMPLIFIER
U
-
VOLTMETER/
RIGHT DISPLAY
(AMPLITUDE)
.qC/,r/
-u
cu
AC Level Measurement Block Diagram
Comments
The Distortion Analyzer powers up in the ac level measurement mode with the 80 kHz
low-pass filter activated. The 80 kHz low-pass filter reduces the measurement bandwidth
from 750 kHz to 80 kHz.
Two ac level detectors are available: true rms and average-responding (but rms calibrated).
See the section Detector Selection for details.
Related
Sections
3-34
Common Mode
Detector Selection
Display Level in Watts
Filters
Monitor
RATIO and LOG/LIN
Special Functions
Model 89033
Operation
Automatic Operation
Description
The Automatic Operation code sets the instrument functions to automatic (that is, each
function is allowed to automatically range to the appropriate setting). It also cancels all of
the special functions.
Procedure
To set the Distortion Analyzer to automatic operation, you must use HP-IB.
Example
To set the Distortion Analyzer to automatic operation:
AU
(program codes)
7-
Function
Program Code AU is the HP-IB code for Automatic Operation.
indications
When the HP-IB program code is entered, the left and right displays blank, the right display
shows four dashes, then both displays show the current measurement mode and input.
Comments
The converse of the automatic operation mode is the Hold Settings Special (prefixed9).
Refer to Hold Settings.
For information on which specific Special Functions are turned off by the Automatic
Operation mode, refer to Special Functions. Since Automatic Operation affects Special
Functions, it is a good practice to place the AU code at the beginning of a program string
when programming the instrument.
Related
Sections
Hold Settings
Special Functions
3-35
Operation
Model 89033
Common Mode
Description
.
Common-mode rejection ratio, or “common-mode” as it is usually referred to, is a measure
of the ability of an amplifier to reject signals that are common to both amplifier inputs
while allowing the differential signals (which may or may not be the weaker signal) to be
amplified and passed on to the measurement circuitry.
Since the analyzer input is fully balanced, it can reject signals which are common to the
High and Low Inputs (with the INPUT FLOAT switch in the FLOAT position). For
standard instruments, the High Input is the center conductor of the INPUT BNC connector;
the Low Input is its outer conductor. For instruments with Option 001, the High and Low
Inputs are the center conductors of the respective HIGH and LOW INPUT connectors.
However, for valid measurement results, there are limitations to the maximum level of
common-mode signals.
To avoid the possibility of hazardous shock o n standard instruments (those without
Option OOl), do not apply more than 42V peak to the outer conductor of the
BNC I N P U T connector when the FLOAT switch is in the FLOAT position.
Do not apply more than 300 V r m s (either differential, common-mode, or a
combination) to the I N P U T connector(s).
Common-mode signal limitations exist because the instrument’s ranging detector (which
determines the input voltage range), is designed to read only the differential signal (between
the High and Low Inputs). Thus, the instrument can set an incorrect input range if a large
common-mode signal is present. Erroneous measurements may be obtained as a result.
The Analyzer Input Block Diagram illustrates that the ranging detector senses the voltage
difference between the High and Low Input lines. Common-mode signals are “ignored” by
the ranging detector, while the differential signals are measured. The block diagram also
illustrates that the High and Low Input lines have over-voltage protection circuits that open
when the input voltage (single or combined common-mode and differential) exceeds the
maximum safe limit.
OVER-VOLTAGE
PROTECTION
fl
HIGH INPUT
ATTENUATOR
‘ HIGH
DIFFERENTIAL-TOSINGLE-ENDEO CONVERTER
TO PROGRAMMABLE
GAIN AMPLIFIER
LOW INPUT
ATTENUATOR
Low
h
L
3-36
Analyzer Input Block Diagram
Model 89033
Operation
Common Mode (cont’d)
Example
If a common-mode signal of 1OV is on the analyzer’s input with a 1V differential signal,
the ranging detector selects the 1.19V range. The signal that is present at the input is
actually 11V (1OV common-mode signal the 1V differential signal). A voltage signal this
large can exceed the input amplifiers’ operating range and cause erroneous measurements.
However, the instrument will not be damaged because the Over-voltage Protection circuitry
will open whenever the combined common-mode and differential signals exceed the
instrument’s safe operating range. (Setting Special Function 1.8 will set the input range to
11.9V.)
+
Comments
For error-free measurements, the Operating Region For Valid Measurements graphs, shown
below, indicate the maximum allowable common-mode input voltages for a given differential
input voltage. Case 1 is for a single-ended source with a common-mode signal present on
both input lines. Case 2 is for a balanced source with common-mode signals on both input
lines.
To obtain the maximum common-mode input voltage level from the graphs, select the desired
value for the differential input voltage. Then read the common-mode input voltage level.
For example, on the Case 1 graph, for a differential input voltage level of lV, the maximum
common-mode input voltage level is 2.8V. For a differential input voltage of 20V, the
maximum common-mode input level is 20V.
Y
0
c
-8
c
a
a.
z
Y
8
7
0
3
0
O I F F E R E N T I A L INPUT VOLTAGE
3dOV
CASE 1. Single-Ended Source with Common Mode on Both Lines
3-37
Model 89033
Operation
Common Mode (cont’d)
Comments
(cont’d)
a
<
Y
i
_I
>
0
=
z
L
I-
w
n
0
7
0
z
3
0
0
VDIFF
(rms)
-D
5.6V
300V
DIFFERENTIAL INPUT VOLTAGE
CASE 2. Balanced Source with Common Mode on Both Sides
Related
Sections
3-38
AC Level
DC Level
IOV
~
Model 89033
Operation
DC Level
Description
Pressing the DC LEVEL key causes the Distortion Analyzer to measure the differential dc
voltage between the center and outer conductor of the INPUT connector or, for Option 001
only, the center conductors of the (rear-panel) INPUT connectors. Voltage common to both
high and low inputs are rejected. See the following Warning and Caution.
To avoid the possibility of hazardous shock on standard instruments (those
without Option OOl), do not apply more than 42Vpeak to the outer conductor
of the B N C I N P U T connector when the FLOAT switch is in the FLOATposition.
Do not apply more than 300 Vrms (either differential, common-mode, or a
combination) to the I N P U T connector(s).
Procedure
To make a dc level measurement, press the S (Shift) key, then the DC LEVEL key. The
voltage can be expressed in either volts, or, if the voltage is positive, in dBm (that is, dB
relative to 1 milliwatt into 600Q). To obtain a display in a m , press the LOG/LIN key.
To return to linear, simply press the LOG/LIN again. If the dc level is to be displayed
relative to a reference level, refer to RATIO and LOG/LIN.
Example
To measure the dc level at the INPUT connector:
LOCAL
(keystrokes)
(program codes)
L2 J W
DC
LEVEL
s1
T
Measurement
Program Code
Indications
When dc level is selected, the LEDs within the DC LEVEL key and the S (Shift)key will
light. The right display shows the dc level with the appropriate units. The Distortion
Analyzer automatically ranges for maximum resolution and accuracy. In the dc level
measurement mode, the left display is blanked even though an ac signal may be present.
Measurement
Technique
In the dc level measurement mode the Distortion Analyzer automatically sets the input
attenuation and the gain of the input amplifier so that the signal amplitude lies within the
proper range of the dc voltmeter. The signal is then measured by the dc voltmeter and after
correction for input gain and attenuation, displayed in appropriate units.
Comments
In the dc level measurement mode only the ac component of the input signal is coupled to
the MONITOR output. The ac component also affects the input gain.
Related
Sections
Common Mode
RATIO and LOG/LIN
Special Functions
3-39
Operation
Model 89033
Default Conditions and Power-up Sequence
Description
When first turned on, the Distortion Analyzer performs a sequence of internal checks after
which the instrument is ready to make measurements. During the power-up sequence, all
front-panel indicators light to allow the operator to determine if any are defective. After
approximately four seconds, this sequence is completed and the Distortion Analyzer is preset
as follows:
MEASUREMENT . . . . . . . . . . . . . .
DETECTOR ....................
LP FILTER ....................
HPPeighting BP Filter . . . . . . . . .
RATIO ........................
Ratio Reference . . . . . . . . . . . . . . . . .
LOG/LIN ......................
Left Display ....................
Right Display . . . . . . . . . . . . . . . . . . .
Service Request Condition . . . . . . . .
Status Byte .....................
Trigger Mode . . . . . . . . . . . . . . . . . . .
Special Functions . . . . . . . . . . . . . . .
AC LEVEL
RMS
LOW PASS 80 kHz
Off
Off
0
LIN (see RATIO and LOGILIN Detailed
Operating Instruction)
Input Frequency
Input AC Level
HP-IB Code Error Only
Cleared
Free Run (Code TO)
All Special Functions off or in their zero suffix,
except Service Request Condition which is set
to 22.2 (HP-IB Code Error).
NOTE
The FLOAT switch is set manually.
Related
Sections
3-40
Ratio and LOG/LIN
Service Request Condition
Model 89033
Operation
Detector Selection
(Special Function 5)
Description
The Distortion Analyzer contains a wideband, true rms or average-responding voltmeter
with high accuracy and sensitivity. The Distortion Analyzer can be switched to have either
a true rms or averaging detector response.
Procedure
To select the AVG Detector, press the AVG/RMS key. The key light will light to indicate
average detection. To select the RMS Detector, press the AVG/RMS key again. The key
light will extinguish, indicating true rms detection.
Example
I 1
Detector
Program Code
A0 or 5.0SP
Program Code Code A0 is the HP-IB code for RMS Detector. A1 is the HP-IB code for AVG Detector.
For fast or slow detection selection (either rms or average), enter the following HP-IB codes:
5.0SP for fast rms detection, or 5.1SP for slow rms detection. For average detection, enter
the following HP-IB codes: 5.2SP for fast average detection, or 5.3SP for slow average
detection.
Indications
When 5.0SP or 5.1SP is entered, the light in the AVG/RMS key will go out if it is on.
When 5.2SP or 5.3SP is entered, the light in the AVG/RMS key will light indicating average
detection has been selected.
Measurement
Technique
When measuring complex waveforms or noise, a true r m s detector will provide a more
accurate rms measurement than an average-responding detector which has been calibrated
to indicate the rms value of a sine wave. For a sine wave, both the true rms and the
average-responding detectors give correct rms readings. However, when the signal is a complex
waveform, or when significant noise is present, the average-responding detector reading can
be in error. The amount of error depends upon the particular signal being measured. For
noise, an average-responding detector reads low.
Comments
Many ac voltmeters employ an average-responding detector. For those applications requiring
the use of an average-responding detector, press the AVG/RMS key for average detection.
Related
Sections
AC Level
Distortion
Distortion Level
SINAD
3-41
Model 89033
Operation
Display Level in Watts
(Special Function 19)
Description
The measurement mode can be set to read the ac input power level in watts into a specified
external load resistance by using Special Function 19 through HP-IB. The range of the
selectable load resistance (in ohms) is an integer value from 1 to 999.
Procedure
To set the measurement to display the ac level in watts into a specified resistance, enter
the corresponding HP-IB code.
Program Code
Resistance (0)
8
1-999
Example
19.OSP
19.NNNSP (where NNN corresponds to the load resistance in ohms.)
To set the right display to read INPUT signal level in watts into an external 16R speaker:
19.16SP
(program codes)
Code
LFunction
Program Code For HP-IB codes, refer to Procedure above.
indications
The right display shows a four-digit readout of the ac power in watts but no units are
indicated. All measurement LEDs go off.
Comments
The load resistance in ohms must be an integer (for example, a resistance of 5.80 cannot
be entered). The decimal point has already been used when entering the Special Function.
An attempt to enter a second decimal point is ignored.
Remember that the instrument assumes that the input voltage is being developed across
the specified external load resistance. If an incorrect resistance is entered, the readout in
watts is shown for the resistance entered.
Zeros immediately following the decimal point are optional. For example,when setting the
load resistance to 1 ohm, 19.1 is equivalent to 19.01 and 19.001. However, 19.1 is not
equivalent to 19.10 or 19.100. Note that 19., 19.0, and 19.8 are equivalent (that is, they
both specify an 8R load resistance).
The displayed power level is accurate regardless of distortion unless the Distortion Analyzer’s
audio detector is set to average responding.
Neither the RATIO nor the LOG function can be used with this Special Function.
Related
Sections
3-42
AC level
Detector Selection
Model 89033
Operation
Distortion
Description
The Distortion Analyzer measures distortion by first determining the following value:
D =
noise + distortion
signal + noise + distortion
It then converts D into the appropriate measurement units as follows:
% units = D X 100%
dB units
=
2010g D
The RATIO key can be used to compare the measured results to a predetermined ratio
reference value (refer to RATIO and LOGILIN).
A distortion measurement can be made on signals from 20 Hz to 100 kHz and from 50 mV
to 300V in the single-ended mode (FLOAT switch in the grounded position).
Procedure
To make a distortion measurement, press the DISTN key. Use the filters to limit noise,
hum, spurious signals, etc. The Distortion Analyzer powers up with the LOW PASS 80 kHz
filter activated.
Example
To measure the distortion of an external source in a 30 kHz bandwidth:
a
(program codes)
M3L 1
Measurement
T-Filter
Program Code M3 is the HP-IB code for the distortion measurement.
Indications
When distortion is selected, the LED within the DISTN key will light. The frequency and
distortion of the input signal are displayed, and the appropriate annunciators are lighted
(see Description above).
Measurement
Technique
In the distortion measurement mode, the controller automatically sets the input attenuation
and the gain settings of various amplifiers. This is accomplished by measuring the input
signal with the ranging rms detector. This control ensures that the signal amplitude is within
the proper range for the input and output detectors. The Input RMS/AVG Detector converts
the ac level of the combined signal + noise + distortion to dc. The notch filter removes
the fundamental signal. The notch filter automatically tunes to the component whose frequency
is measured by the counter (usually the fundamental of the input signal). The output detector
converts the residual noise + distortion to dc. The dc voltmeter measures both dc signals.
The controller then corrects for the programmed gain and attenuation, computes the ratio
of the two signals , and displays the results in appropriate units. The frequency of the input
signal is also measured and displayed.
(Distortion Measurement Block Diagram on next page)
3-43
Model 89033
Operation
Distortion (cont’d)
COUNTER/
LEFT OISPLAY
(FREOUENCY)
FREQUENCY
HP/BP
FILTERS
INPUT
ATTENUATOR
OUTPUT
DETECTOR
RMS/AVG VOLTMETER/
NOTCH
FILTER
IINpuTI++
/
INPUT
RMS/AVG
DETECTOR
INPUT
AMPLIFIER
u1
I
RANGING
RMS
DETECTOR
-
u
-
CONTROLLER
RIGHT OISPLAY
(AMPLITUDE)
(StNtO)
.
L
Distortion Measurement Block Diagram
Comments
Distortion can be measured with either the true rms or average-responding detector. Most
applications specify true rms detection.
Related
Sections
Detector Selection
Distortion Level
Filters
Notch Tune
RATIO and LOG/LIN
3-44
Model 89033
Operation
Distortion Level
Description
This measurement mode can be accessed only via HP-IB. The Distortion Analyzer measures
the distortion level by removing the fundamental of the input signal and then measuring
the ac level of the remaining noise and distortion. The mV and V units are displayed in
the linear mode or the values are converted to dJ3m (that is, dB relative to 1 milliwatt into
a 6000 load). The RATIO key can be used to compare the measured results to a predetermined
ratio reference (refer to RATIO and LOGILIN).
Procedure
To make a distortion level measurement, you must use the HP-IB Distortion Level program
code S3. The filters are used to limit the bandwidth. The Distortion Analyzer powers up
with the LOW-PASS 80 kHz filter activated.
Example
To measure distortion level on an external source signal in a 30 kHz bandwidth
S3L1
(program codes)
Measurement -J7--Filter
Program Code S3 is the HP-IB code for distortion level.
Indications
When distortion level is selected, the frequency and amplitude of the input signal are
displayed, and the appropriate annunciators and DISTN key light will light (see Description
above).
Measurement
Technique
In the distortion level measurement mode, the controller automatically sets the input attenuation and the gain settings of various amplifiers. This control ensures that the signal amplitude
is within the proper range for the output detector. The notch filter removes the fundamental
from the input signal. The notch filter automatically tunes to the component whose frequency
is measured by the counter (usually the fundamental of the input signal). The output detector
converts the residual noise + distortion to dc. The dc voltmeter measures the signal, and
the controller corrects for the programmed gain and attenuation. The results are then
displayed in the appropriate units. The frequency of the input is also measured and displayed.
(Distortion Level Measurement Block Diagram on next page)
3-45
Model 89033
Operation
Distortion Level (cont’d)
Measurement
Technique
(cont’d)
COUNTER/
LEFT OISPLAY
(FREQUENCY)
FREQUENCY
U
RANGIN6
RWS
DETECTOR
1
Related
Sections
3-46
Distortion Level Measurement Block Diagram
Detector Selection
Distortion
Filters
Monitor
Notch tune
RATIO and LOG/LIN
Model 89033
Operation
Error Disable
(Special Function 8)
Description
The Error Disable Function is used to selectively disable operating error messages. Using
the 8.N Special Function allows the user to enable all operator error messages, or disable
analyzer errors (measurement related errors).
Procedure
To selectively disable (or enable) operator error messages, enter the corresponding HP-IB code.
Error Message Status
Example
All error messages enabled.
8.0SP
Disable analyzer error messages.
8.1SP or 8.3SP
To disable the analyzer error messages:
8.1SP
(program codes)
Code T T - F u n c t i o n
Program Code For HP-IB codes refer to Procedure above.
Indications
As the program code is entered, both displays will blank, and the entered code will flash
in the left display. Both displays return to the display that is appropriate for the currently
selected measurement mode.
Comments
HP-IB codes 8.1SP and 8.3SP perform the same function. HP-IBcode 8.2SP can be entered
over the bus, but is ignored.
The error messages can also be selectively disabled to prevent unwanted error interrupts to
the HP-IB bus controller.
Error messages are one means by which the instrument safeguards accurate measurements.
When these safeguards are disabled, erroneous measurements can result under certain conditions. This should be kept in mind when operating the instrument with error messages
disabled.
Related
Sections
Automatic Operation
Error Message Summary
Special Functions
3-47
Operation
Model 89033
Error Message Summary
Description
The instrument generates error messages to indicate operating problems, incorrect HP-IB
entries, or service related problems. The error message is generally cleared when the error
condition is removed. (Error 31 is an exception.) The Error Messages are grouped by error
code as follows:
Error 10 through Error 39 and Error 90 through Error 99. These are Operating
and Entry Errors that indicate that not all conditions have been met to assure a calibrated
measurement, or that an invalid HP-IB code sequence entry has been made. The Error
Disable Special Function (8.N) can be used to selectively disable certain operating error
messages. Entry Errors require that a new program code entry be made.
Error 65 through Error 89. These are Service Errors that provide additional service
related information. Service Errors must be enabled to appear and do not necessarily represent
failures within the instrument. Service Errors are discussed in the Service Section (8) of
this manual.
HP-IB Output
Format
The HP-IB output format for errors is shown below:
T -LL
+900DDE+05CR LF
Fixed Data
I
J
Line
-
Error Code
Fixed Exponent
Feed
Carriage Return
For example, Error 10 is output to the HP-IB as +90010E+05CRLF. This format differs
from normal data outputs since normal data outputs will never exceed 4 X 10⁹. Once an
error has been input to the computing controller, the error code is simply derived by
subtracting 9 X lo9 from the input number, then dividing the result by 100 000.
Error
Displays
Shown below and on the next page are three types of error displays. The first is typical of
most error displays and is shown as a general case. The second and third have specific
meaning and occur often.
This display shows the general error display format. These errors are output to the HP-IB
as shown under the HP-IB format above.
This display means that no signal has been sensed at the input. This display is output to
the HP-IB as Error 96 using the HP-II3 format shown above.
3-48
Model 89033
Operation
Error Message Summary (cont’d)
Error
Displays
(cont’d)
This display means that a signal has been detected, but for various reasons a measurement
result i s not yet available. This display i s never output to the HP-IB and typically indicates
a transitory state in instrument operation. After nine successive occurrences, t h e display
changes t o Error 31. Error 31 i s output to the HP-IB using the HP-IB format shown above.
Error
Messages
The table below describes all Operating and Entry errors. The error code, message, and the
action typically required t o remove the error-causing condition i s given. Additional information
pertaining t o particular errors i s also given.
Code
Error
I
Message
Action Required/Comments
Operating Errors
10
Reading too large for
display.
This error code indicates that although the required
calculation is within the capability of the instrument, the
result of the calculation exceeds the display
capabilities.
11
Calculated value out of
range.
Enter new RATIO reference. Refer to RATIO and LOG/LIN.
13
Notch cannot tune to
input.
Adjust input frequency to within specified limits. Refer
to Table 1-1.
14
Input level exceeds
instrument specifications.
This error code indicates that the input overload
detector has tripped (not in range hold). This could be
caused by too large an ac signal, or too much ac on a
dc signal.
NOTE
Although error codes 17 and 19 are officially listed here under Operating
Errors, they should be considered rather as diagnostic indications.
17
Internal voltmeter cannot
make measurement.
This error code indicates that the counter has failed to
return a value. This can only be caused by a
malfunction in the counter. Refer to Service Sheet 14.
19
Cannot confirm external
source frequency.
This error indicates that in notch routine, the frequency
could not be measured, and thus the notch could not
be adjusted. This usually indicates a counter problem.
Refer to Service Sheet 14.
26
RATIO not allowed in
present mode.
This error code indicates that use of the RATIO key
does not make sense in the current mode. Refer to
RATIO and LOG/LIN.
3-49
Model 89033
Operation
Error Message Summary (cont’d)
Error
Messages
(cont’d)
Error
Code
I
Message
I
Action Required/Comments
rating Errors (Cont’d)
30
Input overload detector
tripped in range hold.
This error code indicates that the input signal is too
high for the selected range. Use Special Function 1 to
enter a more realistic range setting, or enter AU over
the HP-IB to allow the Distortion Analyzer to seek the
correct input range. Refer to Automatic Operation.
31
Cannot make
measurement.
This error code indication occurs when the input signal
is changing too quickly for the Distortion Analyzer to
make consistent measurements or when the common
mode signal is too large for the Distortion Analyzer.
- - -” display indicates that the instrument is
The
trying to make a measurement. After nine unsuccessful
tries, Error 31 is displayed.
‘I-
96
(HP-IB only) No signal
sensed at input.
This error is sent on the HP-IB when the
is shown.
‘I-
-”
display
Entry Errors
20
Entered value out of
range.
Re-enter new value.
21
Invalid HP-IB code
sequence.
Check for compatibility of functions selected.
22
Invalid Special Function
prefix.
Check, then re-enter correct Special Function code.
Refer to Special Functions.
23
Invalid Special Function
suffix.
Check, then re-enter correct Special Function code.
Refer to Special Functions.
24
Invalid HP-IB code.
Check, then re-enter correct HP-IB code. This error
causes a Require Service message to be sent on the
HP-IB. Refer to Table 3-4 and accompanying text.
Service Errors
~~
65-89
Related
Sections
3-50
Service-related errors.
Automatic Operation
RATIO and LOG/LIN
Refer to paragraph 8-12, Service Errors.
Model 89033
Operation
Filters
(High-Pass, Bandpass, Low-Pass)
Description
The optional plug-in high-pass and weighting bandpass, and the LP (low-pass) FILTER
keys cause the respective filters to be inserted into the audio signal path. The filters limit
the measurement bandwith. The high-pass and bandpass filters are inserted before the notch
filter (control of the notch filter is covered in the Notch Tune discussion). The low-pass
filters are inserted after the notch filter. When in use, the high-pass, bandpass and low-pass
filters always affect the signal at the MONITOR output.
Procedure
Select the desired signal filters by pressing the appropriate keys. Only one high-pass or
bandpass and one low-pass filter can be in use at a time. To turn a filter off, press the key
again or select another filter in the same group. HP-IB codes for the different filter keys
(shown below) turn on the selected filter (defeating others in the group if on). To turn a
high-pass/bandpass or low-pass filter off via HP-IB, use code HO or LO respectively, or
select the alternate filter in the pair.
Example
To select the left high-pass or bandpass filter and the 30 kHz low-pass filter:
LOCAL
(keystrokes)
r High-Pass Filter 7 7 Low-Pass F i l t e r 7
(program codes)
High-Pass/Bandpass Filter
Left High-Pass or Bandpass Filter
Right High-Pass or Bandpass Filter
B
HIGH P A S S
High-Pass Filter
B
LOW PASS
!f-
Low -Pass F i I ter
Program
Code
Low-Pass Filter
H2
Both off (750 kHz low-pass)
Low Pass 30 kHz
Low Pass 80 kHz
Program
Code
@@
L2
Indications
When a filter is activated (by either automatic or manual selection), the LED within that
filter key will light.
Comments
Two plug-in positions within the instrument permit the Distortion Analyzer to be configured
with various high-pass and band-pass filter combinations. The optional plug-in filter assemblies include a 400 Hz High-Pass (used to filter out 50/60 Hz hum, and squelch signals),
and CCITT, CCIR, CCIR/ARM, “A” Weighting, and C-Message Weighting Bandpass Filters.
These weighting bandpass filters are all psophometric in nature; each filter characteristic
approximates the response of human hearing according to separately established standards.
These optional plug-in filter assemblies may be inserted in either the left-most or right-most
key position, according to the filter option number.
3-51
Operation
Model 89033
Filters (cont’d)
(High-Pass, Bandpass, Low-Pass)
Comments
(cont’d)
Filter
400 Hz high pass
CClTT weighting bandpass filter
CClR weighting bandpass filter
Left-Most Key Position
Filter Option Number
Right-Most Key Position
Filter Option Number
010
011
012
013
014
015
050
C-Message weighting bandpass filter
CCIR/ARM weighting bandpass filter
“ A weighting bandpass filter
051
052
053
054
055
The selected filters are always in the path of the audio signal.
With all filters off, the 3 dB measurement bandwidth is approximately 10 Hz to 750 kHz.
The high-pass or bandpass filters affect the signal being counted however, the low-pass
filters do not. Repeating the HP-IB command to turn on a specific fdter has no effect (that
is, the filters cannot be toggled on and off using the same HP-IB command).
The individual filter characteristics are given in Table 1-1, Specifications and in Table 1-2,
Supplemental Information.
The optional, weighting bandpass plug-in filter assemblies weights the frequency response
of the Distortion Analyzer as shown in their respective curve plots.
t15
t10
t5
0
-5
-
-10
I
m
0
-15
Y)
Y
-20
z
0
a.
W
Y)
a
-25
-30
-35
-40
-45
-50
-55
10
FREQUENCY ( H z )
CCITT and 400 Hz High-Pass Filter Plot
3-52
Model 89033
Operation
Filters (cont’d)
(High-Pass, Bandpass, Low-Pass)
t15
+lo
t5
0
-5
-10
-15
-20
-25
-30
-35
-40
-45
-50
-55
10
FREOUENCY ( H z )
CCIR and CCIRIARM Weighting Filter Plot
m
0
u)
W
z
0
n
I
n
a
W
FREQUENCY ( H Z )
“A” Weighting and “C”-Message Weighting Filter Plot
3-53
Model 89033
Operation
Filters (cont’d)
(High-Pass, Bandpass, Low-Pass)
Related
Sections
3-54
AC Level
Distortion
Distortion Level
SINAD
Model 89033
Operation
Float
Description
To minimize measurement errors caused by ground loops, the analyzer input can be floated.
Floating the input improves rejection of low frequency and common mode signals (for
example, line-related hum and noise). The front-panel FLOAT switch determines whether
the input is floating or single-ended. When in the float mode, the analyzer input is fully
balanced.
T o avoid the possibility of hazardous shock o n standard instruments (those
without Option 001)) do not apply more than 42V peak to the outer conductor
of the BNC I N P U T connector when the FLOAT switch is in the FLOATposition.
Do not apply more than 300 Vrms (either differential, common-mode, or a
combination) to the I N P U T connector(s).
Procedure
To float the analyzer input, set the FLOAT switch to the FLOAT position. In the float
mode the center conductor is the High Input, and the outer conductor is the Low Input
that is isolated from chassis ground. In the single-ended mode (the FLOAT switch in the
grounded position) the outer conductor is connected directly to chassis ground.
Comments
The INPUT BNC connector allows the attachment of a shielded cable in the single-ended
mode, which minimizes electromagnetic interference (EMI). This is important if the Distortion
Analyzer is operated near a transmitter, or in the presence of large RF signals.
When the FLOAT switch is in the grounded position, the outer conductor of the connector
is connected to chassis ground.
If EM1 shielding is not critical, banana-type connectors can be used. For Option 001)two
BNC-to-banana adapters are supplied with the instrument to convert the BNC input and
output to dual banana with standard 3h-inch spacing. The adapters connect the conductor
of the banana connector to the center conductor of the BNC connector. These adapters are
normally used when the FLOAT switches are set in the FLOAT position.
8903E
DEVICE
FNDER TEST,
Effect of Multipoint Ground System (FLOAT Switch Closed)
3-55
Model 89033
Operation
Float (cont’d)
Comments
(cont’d)
3-56
One major source of error which must be considered when measuring low level ac signals
or when making low distortion measurements is error introduced by ground loops. The figure
above illustrates a typical measurement setup using the Distortion Analyzer. In the figure
the system common line is connected to chassis or earth ground at two separate points: the
chassis of the Distortion Analyzer and the common point of the device under test. Since
two physically separate ground points are seldom at the same ground potential, current will
flow in the system common line. Due to conductor resistance (RC) in the system common
line, the current causes a voltage drop. This voltage drop (a common mode voltage) sums
with the signal under measurement and can cause erroneous readings. Grounding the system
common line at a single point minimizes the effect of common mode voltages caused by
ground loops. Floating the Distortion Analyzer input circuitry isolates the outer conductor
of the Distortion Analyzer from chassis ground. Thus, the Distortion Analyzer input circuits
are grounded only through the device under test. Note that the system common line is now
grounded at a single point.
Model 89033
Operation
Hold Decimal Point
(Special Function 4)
Description
The position of the decimal point in the right display can be held in a specific location by
using Special Function 4.
Procedure
To hold the decimal point in the right display to a specific position, enter the corresponding
HP-IB program code.
Decimal
Hold Position
Automatic Selection
DDDD. V Range*
DDD.D V Range
DD.DD V Range
D.DDD V Range
0.DDDD V Range"
DD.DD rnV Range
D.DDD mV Range
0.DDDD rnV Range"
I
1 -
Program
Code
4.0SP
4.1 SP
4.2SP
4.3SP
4.4SP
4.5SP
4.6SP
4.7SP
4.8SP
I
'The decimal point does not appear on the display. It is
shown to establish the position it would appear in the
numeric value of the readout.
"The zero does not appear on the display. It is shown
to clarify the position of the decimal point.
Example
To hold the decimal point after the first digit of a mV Range (D.DDD mV):
4.7SP
(program codes)
Code
1
-L
Function
Program Codes For HP-IB codes refer to Procedure above.
Indications
As the program code is entered, both displays will blank, and the entered code will flash
in the left display. The right display will show the amplitude with the decimal held in the
position requested. The left display provides the normal information associated with the
selected measurement mode.
Comments
It is possible to use the Hold Decimal Point Special Function to set the display for a readout
that exceeds the resolution of the instrument. For example, in the dc level measurement
.mode, 4.7SP will set the display to a mV range. In this case, the three digits following the
decimal point will always be zeros, and are not significant digits in the amplitude readout.
Related
Sections
Automatic Operation
Special Functions
3-57
Operation
Model 89033
Hold Settings
(Special Function 9)
Description
The Hold Settings Special Function is used to freeze the instrument in the presently selected
settings for the input level ranges, the post-notch gain, the decimal point position, and the
notch tuning.
Procedure
To hold the presently selected settings for the functions above, enter the HP-IB program
code 9.OSP.
Example
To hold the present settings of the specified functions:
9.OSP
(program codes)
CodeJ
T T
LFunction
Program Code For HP-IB code, refer to Example above.
Indications
As the program code is entered, both displays will blank, and the entered code will appear
in the left display. The displays will then show the normal readings for the currently selected
measurement mode.
Comments
Using Special Function 9 is equivalent to entering the following special functions through
the HP-IB bus:
l.N Input Level Range (Except DC Level)
2.N Input Level Range (DC Level Only)
3.N Post-Notch Gain
4.N Hold Decimal Point (Right Display Only)
6.1 Hold Notch Tuning
For Special Functions 1 through 4, N is set equal to the currently selected value that the
instrument is using for that function. These values can be read by using the Special Special
Display (refer to Special Functions).
Note that using the Hold Settings Special Function can cause inaccurate measurements
under some circumstances.
Once settings have been held by the Hold Settings Special Function, one or more of them
can be reset to their automatic modes by issuing the 0 suffix code of the corresponding
Special Function code. As an example, Hold Settings places the instrument in hold notch
tuning mode. Use 6.0 SP to re-enter the automatic notch tuning mode.
Related
Sections
3-58
Automatic Operation
Special Functions
Model 89033
Operation
HP-lB Address
(Special Function 21)
Description
The Distortion Analyzer’s present HP-IB address can be displayed by using the front-panel
S (Shift) LCL keys (for the decimal display). This display is of the form “Addr=” (in the
left display) “NN” (in the right display), where “NN” is the HP-IB decimal address. The
address set at the factory is 28 (11100 in binary). The HP-IB address can also be displayed
using Special Function 21. Information on Special Function 21 is found in Comments,below.
Procedure
To display the HP-IB address in decimal, key in the S (Shift) LCL keys.
To display the HP-IB address in decimal:
LOCAL
(keystrokes)
Indications
Assuming the same address, the following will be displayed
A list of the allowable addresses for the Distortion Analyzer is given below:
-
Address Switches
---
A5
A4
-0
0
0
0
0
0
0
0
0
0
0
0
0
0
0
0
0
0
0
0
0
0
0
0
1
1
1
1
1
1
1
1
--
A3
A2
A1
0
0
0
0
1
0
1
0
1
0
1
0
1
0
1
0
1
0
1
0
0
0
1
1
1
1
0
0
0
0
1
1
1
1
1
1
0
0
1
1
0
0
1
1
0
0
1
1
Talk
Address
Character
@
A
B
C
D
E
F
G
H
I
J
K
L
M
N
0
-Listen Decimal
Address Equiva
Charlent
acter
0
1
2
3
4
5
6
7
8
9
10
11
12
13
14
15
-
I
-
Address Switches
A5
-
Talk
Address
Character
I
I
Listen Decimal
Address Equiva
Char- lent
acter
1
1
1
1
1
1
1
1
1
1
1
1
...
.........
...(...
.:....
, ..Ip
..+:.:.:
:.:.:,,:..../
.........
:x...
::5qp$
1
1
Program Codes For HP-IB codes refer to the Program Code table under Comments following.
3-59
Operation
Model 89033
HP-IB Address (cont’d)
(Special Function 21)
Comments
The HP-IB address display is continuously updated. This makes setting the address easy
since the result of changing a switch setting is immediately visible on the display. For
information on setting the HP-IB address of the Distortion Analyzer, refer to Section 2 of
this manual. The factory-set address is, as shown in the examples, decimal 28. The T and
L bits are set to 0. The S bit powers up at 0.
To clear the display (from the instrument front panel), press the LCL key, then any function
key. The instrument reverts to the new measurement mode.
The HP-IB address can also be displayed via Special Function 21. Since Special Functions
can only be executed via HP-IB, the instrument’s HP-IB address must be known prior to
its use. The primary value of using HP-IBis that the status of the Require Service message
can be displayed.
To display the HP-IB address via HP-IB, key in the appropriate HP-IB program code as
follows:
Display
Format
Binary
Decimal
21.0 SP
21.1 SP
As the program code is entered, it will appear on the left display. When the HP-IB code
is entered, the top row measurement key lights and annunciators will turn off. If the 21.0
Special Function was entered, the left display will show a binary number of the form AAAAA
where AAAAA is the HP-IB address in binary. The right display will show a binary number
of the form TLS where the T , L, and S have the meaning indicated in the table on the
following page.
T
0
’
L
S
NOT
TALK
ONLY
NOT
LISTEN
ONLY
NOT
REQUESTING
SERVICE
TALK
ONLY
LISTEN
ONLY
REQUESTlNG
SERVICE
If T and L are both 1, the instrument is set to talk only (talk overrides listen). If all the
A digits are set to 1 and T is 1, the instrument will be in talk status only (that is, output
the status byte only). (If all digits W . T L are 1 but S is 0, the Remote Interface board
is not installed.) If the 21.1 Special Function was entered, the left display will show the
statement “Addr=” and the right display will show the decimal value of the instrument’s
HP-IB address (28 if it has not been changed).
Related
Sections
3-60
Remote Operation, Hewlett-Packard Interface Bus
Special Functions
Model 89033
Operation
Input Level Range (DC Level)
(Special Function 2)
Description
In all measurement modes the input level range can be set to a desired range by using
Special Function 2.N through HP-IB. The following discussion describes this function
formode only. Refer to Input Level Range (Except DC Level) for additionthe automatic
operation mode, the input level range is determined by both the dc and ac level (if there
is one) of the input signal.
Procedure
To set the input level range to a selected range, or to re-enter the automatic selection mode,
the corresponding HP-IB program code.
Input Level Range
(Full Scale)
Automatic Selection
300V range
64V range
16V range
4V range
Example
40
24
12
0
2.0SP
2.1 SP
2.2SP
2.3SP
2.4SP
dB
dB
dB
dB
To set the input level range to the 16V range:
(program codes)
a
Program Code
HP-IB
Input
Attenuation
YL
Code
F unction
Program Codes For HP-IB codes, refer to Procedure above.
Indications
As the program code is entered, it will flash on the left display, which then temporarily
blanks out. Note that for all measurement modes except dc level, the left display will return
to show the input signal frequency after the HP-IB code is entered.
Comments
When the Distortion Analyzer powers up, or when Automatic Operation is selected, the
input level range is placed in the automatic selection mode.
If the input level range is set such that the input signal level causes the input overload
detector to trip, Error 30 will be displayed.
Manually selecting the gain of the input level circuitry can cause measurement error.
Measurement accuracy is not specified whenever the gain of the input level circuitry is
manually selected because the selected gain setting may be less than optimum. It is important
to note that error messages indicating invalid measurements due to incorrect gain settings
are not generated unless overload conditions occur. Automatic operation ensures accurate
measurements for all combinations of input signals and measurement modes.
Related
Sections
Automatic Operation
DC Level
Input Level Range (Except DC Level)
Monitor
Special Functions
3-61
Model 89033
Operation
Input Level Range (Except DC Level)
(Special Function 1)
Description
In all measurement modes the input level range can be set to a desired range by using
Special Function 1.NN through HP-IB. The following discussion describes this function for
function for all measurement modes except DC Level mode. Refer to Input Leuel Range
(DC Leuel) for additional information. The input circuitry consists of a programmable
attenuator and two programmable amplifiers. In automatic operation mode, the gain of the
attenuator-amplifier section of the input is automatically set according to the level of the
input signal.
Procedure
To set the input level range to a selected range or to re-enter the automatic selection mode,
enter the corresponding HP-IB program code.
Example
Input Level Range
(Full Scale)
Program Code
Automatic Selection
300V
189V
119v
75.4v
47.6V
30.0V
18.9V
11.9v
7.54v
4.76V
3.00V
1.89V
1.19v
0.754V
0.476V
0.300V
0.1 89V
0.119v
0.0754V
1.OSP
1.15p
1.25p
1.35p
1.45p
1.55p
1.65p
1.75p
1.85p
1.95p
1.1OSP
1.11SP
1.12SP
1.13SP
1.14SP
1.15SP
1.16SP
1.17SP
1.1 8SP
1.1 9SP
To set the input level range to the 30.0V range:
1.6SP
(program codes)
Code- 7 - Z - F u n c t i o n
e
Program Code For HB-IB codes, refer to Procedure above.
Indications
3-62
As the program code is entered, it will appear on the left display. The display returns to
show the input signal frequency.
Model 89033
Operation
Input Level Range (Except DC Level) (Cont’d)
(Special Function 1)
Comments
When the Distortion Analyzer is first powered up or when Automatic Operation is selected,
the input level range is placed in the automatic selection mode. If the input level range is
set such that the input signal level creates an overrange condition, an error message will
be displayed. The error message generated depends on instrument settings and the input
signal level. For example, if the input level range is set such that the input signal level
causes the input overload detector to trip, Error 30 will be displayed. For a complete listing
of the error messages, refer to Error Message Summary.
Manually selecting the gain of the input level circuitry can cause measurement error.
Measurement accuracy is not specified whenever the gain of the input level circuitry is
manually selected because the selected gain setting may be less than optimum. It is important
to note that error messages indicating invalid measurements due to incorrect gain settings
are not generated unless overload conditions occur. Automatic operation ensures accurate
measurements for all combination of input signals and measurement modes.
Related
Sections
AC Level
Automatic Operation
Input Level Range (DC Level)
Monitor
Special Functions
3-63
Model 89033
Operation
Monitor
The MONITOR output provides a means of monitoring the ac signal into the output rms
detector. The auto-ranging MONITOR output level is normally a 0.3 to 3 Vrms signal which
is proportional to the input signal. In ac level and dc level the MONITOR output provides
a scaled representation of the ac component of the input signal. In SINAD, distortion, and
distortion level the MONITOR output provides a scaled representation of the input signal
with the fundamental removed. The output is dc coupled with a 600R output impedance,
and a BNC female connector. The MONITOR output can be used to drive other test
instruments, such as an oscilloscope, wave analyzer, or spectrum analyzer for further analysis.
Description
Block Diagram A simplified block diagram of the Distortion Analyzer measurement circuits illustrating the
relationships between the MONITOR output and the other circuit blocks is shown below.
The MONITOR output block diagram illustrates the signal path from the INPUT to the
MONITOR output. The diagram is that of a programmable gain amplifier with a tunable
notch filter. In ac level and dc level, the notch filter is bypassed. In SINAD, distortion,
and distortion level the notch filter is switched into the signal path, removing the fundamental
frequency.
/-INPUT
STAGE GAIN-
/-POST
NOTCH GAIN
\
INTERNAL
PLUG-IN
(INPUrl)
:
F HP/EP
ILTERS
INPUT
ATTENUATOR
NOTCH
PROGRAUABLE
GAIN AUPLIFIER
PROGRAUABLE
GAIN AUPLIFIER
w
INPUT
AWPLIF I E R
FILTERS
OUTPUT
RUWAVG
DETECTOR
)I
Monitor Output Block Diagram
Comments
The MONITOR output gain and sensitivity (that is, the net signal gain from the INPUT
to the MONITOR output) are dependent on the input stage gain and the post-notch gain.
Both the input stage gain and the post-notch gain can be determined by viewing the Special
Special Display (refer to Special Functions).
The input stage gain, and post-notch gain for various instrument settings are listed in the
tables below.
3-64
Operation
Model 89033
Monitor (Cont’d)
Comments
(Cont’d)
INPUT STAGE GAIN (Except dc)
Special Special
Display
1.”
1.1
1.2
1.3
1.4
1.5
1.6
1.7
1.8
1.9
1.10
1.11
1.12
1.13
1.14
1.15
1.16
1.17
1.18
1.19
I
Gain
Input level
Range
300V
189V
119v
75.4v
47.6V
30.0V
18.9V
11.9v
7.54v
4.76V
3.00V
1.89V
1.19v
0.754V
0.476V
0.300V
0.1 89V
0.119v
0.0754V
0
+4
+8
+12
$1 6
+20
+24
+28
+32
I
POST-NOTCH GAIN
Special Special
Display
3.N
3.1
3.2
3.3
3.4
Log (dB)
0
+20
+40
+60
0.0100
0.01 58
0.0251
0.0398
0.0631
0.1000
0.1585
0.2512
0.3981
0.6310
1-00
1.58
2.51
3.98
6.31
10.00
15.85
25.1 2
39.81
-40
-36
-32
-28
-24
-20
-1 6
-1 2
-8
-4
Linear
1
10
100
1000
The measurement system net gain equals the combined gain of the two stages. To calculate
the net gain use the following formulas:
Net Gain (LOG) = Input Stage Gain (LOG)
+ Post-Notch
Gain (LOG)
or
Net Gain (LIN)
=
Input Stage Gain (LIN) X Post-Notch Gain (LIN)
In a c level the MONITOR output is a scaled replica of the input signal. The MONITOR
output level is calculated as:
VOut= Vi,, X Net Gain
where Vi” is the input signal level and the linear net gain is used.
3-65
Model 89033
Operation
Monitor (Cont’d)
Comments
(Cont’d)
In SINAD, distortion, and distortion level, the fundamental frequency is removed (suppressed)
by more than 80 dB. The output after the notch filter includes all harmonics of the
fundamental plus any noise, hum, and other spurious signals that may be present. These
signal impurities are amplified and are available at the MONITOR output for further analysis.
The following equations express the MONITOR output level as a function of the parameter
being measured (the displayed reading). (Use linear Net Gain.) For distortion:
Vout =
Displayed Reading (in 7%) X Vin X Net Gain
100
or
For distortion level:
Vou, = Displayed Reading (in volts) X Net Gain
or
vout
=
1ODisplayed Reading (in dBm)/PO
x Net Gain
For SINAD:
vout
=
100
x Vin X Net Gain
Displayed Reading (in %)
or
Vout
=
10-iDisplayed Reading (in dB)1/20
x Vin x Net Gain
In the above equations Voutis the MONITOR output level as measured with a true
rms voltmeter and Vin is the input signal level.
The MONITOR output does not respond to dc signals presented at the INPUT. In
the dc level measurement mode only the ac components of the input signal are presented
at the MONITOR output.
Related
Sections
3-66
AC Level
DC Level
Distortion
Distortion Level
Input Level Range (DC Level)
Input Level Range (Except DC Level)
Model 89033
Operation
Notch Tune
Description
Procedure
(Special Function 6)
In SINAD, distortion, and distortion level modes, the Distortion Analyzer automatically
tunes the notch filter to the input frequency. By means of keyboard entry using the NOTCH
key, the notch filter can be held to the current notch filter frequency setting.
To freeze the notch filter, press the NOTCH TUNE key. To return to the automatic tuning
mode, press the NOTCH TUNE key again, or enter the HP-IB program code NO or 6.0SP.
Notch Tune
[
Example
Automatic Notch Tuning
Tuning
1 - 1
Program Code
6.0SP or NO
6.1SP or N1
:oldNoih
To freeze the notch filter, press NOTCH TUNE:
Notch Tune
LOCAL
(keystrokes)
N1
(program codes)
Function
T
i.1
or
Code
Y?-
Function
4
Codes The above procedure gives the HP-IB codes NO and N1 for the Notch Tuning function.
Notch Tuning may also be controlled over HP-IB with Special Functions 6.0 and 6.1.
Indications
When the NOTCH TUNE key is pressed, the LED within the NOTCH TUNE key will
light, indicating the notch filter is on. Pressing the NOTCH TUNE key again will turn off
the key light, indicating the notch filter is off.
When either HP-IB program code 6.0SP or 6.1SP is entered, the program code will flash
on the left display. The display blanks, then shows the input signal frequency. For HP-IB
program code 6.1SP the light within the NOTCH TUNE key will turn on. The light will
turn off for HP-IB program code 6.0SP. When the HP-IB program codes NO or N1 are
used, there is no numeric code shown in the left display.
Comments
When the Distortion Analyzer first powers up or when Automatic Operation is selected
(NOTCH TUNE key light is off), the Distortion Analyzer is placed in the automatic notch
tuning mode.
In the automatic tuning mode the Distortion Analyzer counts the frequency of the input
signal, then coarsely tunes the notch filter to that frequency. The notch filter is then fine
tuned via circuitry internal to the notch filter. In the hold tune mode, the notch filter is
no longer coarsely tuned, however the fine tune circuitry still remains operational. Thus the
notch filter still automatically tunes, but now over a limited range. In the hold tuning mode
the tuning or nulling range of the notch filter is approximately 5% of the frequency of the
original notch filter setting.
Related
Sections
Automatic Operation
Distortion
Distortion Level
SINAD
Special Functions
3-67
Model 89033
Operation
Post-Notch Detector Filtering (Except SINAD)
(Special Function 5)
Description
The Distortion Analyzer normally makes audio measurements using a fast-responding detector.
By means of HP-IB program code entry, additional low-pass filtering can be added after
the post-notch detector. The additional low-pass filtering (slow detector) is useful in stabilizing
measurements on unstable or noisy signals, or whenever display jitter is considered excessive.
Procedure
To change the Distortion Analyzer post-notch filtering response from fast to slow or vice
versa, enter the corresponding HP-IB program code.
Post-Notch
Detector Response
Fast RMS Detector
Slow RMS Detector
Fast AVG Detector
Slow AVG Detector
Example
5.0SP
5.1SP
5.2SP
5.3SP
To enter a slow rms detector response mode:
(program codes)
Code
-YT-
Function
Program Codes For HP-IB codes, refer to the Procedure above.
Indications
As the HP-IB program code is entered, it will flash on the left display, with the display
returning to show the input signal frequency. When HP-IB program code 5.2SP or 5.3SP
is entered, the LED within the AVG/RMS key will light if not already on. If the light is
already on, it will remain on. When HP-IB program code 5.0SP or 5.1SP is entered, the
LED within the AVG/RMS key will turn off (if not already off).
Comments
When the Distortion Analyzer is first turned on or when Automatic Operation is selected,
the fast rms detector is selected.
In SINAD, additional low-pass filtering is always used. Fast detection (either r m s or avg)
cannot be selected by means of HP-IB entry when in SINAD. Slow detection can be used
when in SINAD.
Related
Sections
3-68
Automatic Operation
Special Functions
Model 89033
Operation
Post-Notch Gain
(Special Function 3)
Description
The overall stage gain of the post-notch circuit can be manually set by HP-IB program
code entry. The gain is selectable from 0 dB to 60 dB in 20 dB steps. In automatic operation
mode, the instrument will automatically select the optimum post-notch gain.
Procedure
To manually set the gain of the post-notch circuit, or to re-enter the automatic selection
mode, enter the corresponding HP-IB program code.
Post-Notch Gain
Automatic Selection
0 dB gain
20 dB gain
40 dB gain
Example
To set the post-notch gain to 40
(program codes)
3.0SP
3.1SP
3.2SP
3.3SP
dB:
YE ""
Code
F
C t ion
Program Codes For HP-IB codes, refer to Procedure above.
Indications
As the program code is entered, it will flash on the left display, the display then returns
to show the input signal frequency.
Comments
When the Distortion Analyzer is first powered up, or when Automatic Operation is selected,
the Distortion Analyzer is placed in the automatic selection mode.
If the post-notch gain is set such that the input signal level causes the post-notch circuitry
to be overdriven, four dashes will be displayed on the right display. If this overload condition
is not corrected within nine measurement cycles, Error 31 will be displayed.
Manually selecting the gain of the post-notch circuit can cause measurement error.
Measurement accuracy is not specified whenever the gain of the post-notch circuitry is
manually selected because the selected gain setting may be less than optimum. It is important
to note that error messages indicating invalid measurements due to incorrect gain settings
are not generated unless overload conditions occur. Automatic operation ensures accurate
measurements for all combination of input signals and measurement modes.
Related
Sections
Automatic Operation
Monitor
Special Functions
3-69
Model 89033
Operation
Rapid Frequency Count
Description
Rapid Frequency Count mode allows a remote controller to partially bypass the Distortion
Analyzer’s own internal controller. The advantage is that frequency count measurements
can then be obtained from the Distortion Analyzer much more quickly. The data obtained,
however, is in a packed binary form, and thus requires additional processing to produce the
final results in hertz (Hz).Once the Rapid Frequency Count mode is entered, data will be
placed on the bus in four-byte sequences until the mode is terminated. Rapid Frequency
Count mode is terminated whenever the Distortion Analyzer receives a bus command, or
whenever it is sent new programming data.
Procedure
To use the Rapid Frequency Count mode, the remote controller must be able to read the
four-byte compacted frequency data using a binary specifier. First, place the Distortion
Analyzer into the ac level measurement mode, set it to measure the input signal (that is,
the signal before the notch filter), and to trigger with settling. The HP-IB codes for this
configuration are M146.1SPT3. Next, issue the HP-IB code for Rapid Frequency Count
(RF) and then read the frequency data from the Distortion Analyzer. The Distortion Analyzer
does not send carnage return, line feed, or any other characters as delimiters.
The frequency data will be in the form shown below:
BYTE 1
BYTE 2
BBBB BBBB
Jl
BBBB BBBB
r
.
I
260 minus J
number of
Least significant
clock Carries
digit ( LSD)of
clock count
I
I
BYTE 3
BYTE 4
BBBB BBBB
255minus J
number of
Cycle carries
Most significant
digit (MSD) of
clock count
Second least significant
digit (2LSD) of clock count
Cvcle count
To obtain the frequency, compute:
Total clock counts = LSD
+ 16(2LSD) + 256(MSD) + 1024(260 - BYTE
Total cycle counts = Cycle count
Frequency =
+ 16(255 - BYTE 3)
1)
Total cycle counts
x (2.106)
Total clock counts
Where:
LSD = Least significant digit of clock count
2LSD = Second least significant digit of clock count
MSD = Most significant digit of clock count
Using a BASIC controller such as the Hewlett-Packard Model 85B Desktop Controller, the
computation is set up in seven steps as shown below:
10 OUTPUT 728 USING “ K ; “46.1SPT3,RF
20 ENTER 728 USING “#,E
; A,B,C,D
30 T=IP(B/16)+16*BINAND(B,15)+16*BINAND(D,48)+1024*(26O-A)
40 E=BINAND(D,15)+16*(255-C)
50 F=lP(E/T*200000000)/100
60 DlSP F
70 END
3-70
Model 89033
Operation
Rapid Frequency Count (cont’d)
Procedure
(cont’d)
Explanation:
Line 10: Places the Distortion Analyzer in the Rapid Count Mode (“46.1SPT3” sets up the
analyzer for transient free operation).
Line 20: Enter the four rapid count bytes using the Binary format “#,B”.
Line 30: Calculate T=total clock counts by bit manipulation and proper weighting.
Line 40: Calculate E=total cycle counts by bit manipulation and proper weighting.
Line 50: Calculate the frequency F=(total cycle count/total clock count) X 2 106. Note
that the value is multiplied by 100 to round the integer part and then divide by
100 to round the answer to 2 digits to the right of the decimal.
Line 60: Displays the frequency count result.
Line 70: Terminates the program.
Using a HPL controller such as the Hewlett-Packard Model 9825A Desktop Controller, the
computation is set up in seven steps as shown below:
0: wrt 728, “ R F
1: frnt, z, 4b
2: red 728, r l , r2, r3, r4
3: shf (r2, 4) + 16 (band (r2, 15)
4: band (r4,15) + 16 (255 -r3)
5: 2e6r6/r5
B
6: dsp B
7: end
-
-+
band (r4, 28))
r6
-
+ 1024 (260 4) r5
Explanation:
Line 0:
Place the Distortion Analyzer in the Rapid Frequency Count mode.
Steps 1,2: Establish a format suitable for reading four binary bytes from the Distortion
Analyzer. Take the readings and store the value in four “r” variables. The value
stored is the decimal equivalent of the binary word.
Line 3:
Shift various bytes around and weight their value by the proper amount (in
accordance with the routine given) to obtain the number of Distortion Analyzer
clock counts. Assign that value to variable “r5”.
Line 4:
Position bits correctly and weight appropriately to determine the number of cycle
counts. Assign that value to variable 56”.
Line 5:
Since the Distortion Analyzer uses a reciprocal counter, the frequency of the
input signal equals the number of input cycles (r6) divided by total time elapsed
during these input cycles. The denominator is determined by counting the number
of 2 MHz clock counts that occur during these input cycles and multiplying by
the frequency of the clock (2 MHz). Total time equals number of clock counts
divided by 2010~.
Total time (seconds) =
r5
Thus:
Input frequency (Hz)=
Line 6:
Displays the frequency count result.
Line 7:
Terminates the program.
= ($)X
r5/2 -106
2 -106
3-71
Model 89033
Operation
Rapid Frequency Count (cont'd)
Program Code Program Code RF is the HP-IB code that initiates the Rapid Frequency Count mode.
indications
When in Rapid Frequency Count mode, the Distortion Analyzer's left display will show
''- - - - -*
Comments
The major advantage of Rapid Frequency Count mode is that data can be taken in rapid
sequence and stored in an array in the computing controller. Then, at a later time when
operations do not require immediate controller attention, the packed binary data can be
converted into decimal frequency data. This way the time required for the Distortion Analyzer
to process the data into decimal frequency is eliminated. This greatly increases its
measurement speed for measuring tone burst sequences.
3-72
Model 89033
Operation
RATIO and LOG/LIN
(Special Function 11)
Description
The RATIO key can be used to compare any measurement (except frequency and power)
to a reference value. The reference value can be the result of a previous measurement. The
LOG/LIN (logarithmic/linear) key can be used to express the results in logarithmic or linear
units. The following table shows which units are applicable to the individual measurement
modes:
Measurement
I
RATIO On
LIN
AC LEVEL
DC LEVEL
SINAD
DISTN
DISTN LEVEL
RATIO Off*
LOG
LIN
LOG
dB
dB
dB
dB
dB
V or rnV'
V or mV
dBrn into 600Q
dBrn into 600Q
dB'
dB
dBrn into 600Q
O/O
YO
Y
O
%
O/O
~~~
I
YO
V
YO*
or rnV'
~
~
~~
~
*After initial power on, switching measurement mode results in the configuration
indicated by the asterisks. In subsequent operations, the last setting of the LOG/LIN
key is remembered for each measurement mode and applied to the new
measurement.
When the RATIO LED is on, the measurement result is compared to a reference value.
The reference value can be the result of a previous measurement. The LOG/LIN key allows
any measurement result to be viewed in linear or logarithmic format.
The Distortion Analyzer stores only one ratio reference at a time. When in ratio, if a new
measurement is selected, ratio is disabled.
When returning to the previous measurement, it is possible to re-enter the ratio mode with
the same factor as before using HP-IB program code 11.0. Additionally, the ratio reference
can be displayed using HP-IB program code 11.1.
Procedure
To use the RATIO key, set the display to the desired reference value. This can be done by
adjusting the signal parameter being measured to a reference setting, or by entering the
numeric reference via the HP-IB, followed by HP-IB code R1. The entry must be made in
fundamental units (for example, for a ratio reference of 60 mV enter .06 regardless of the
displayed value). The display will show the measurement result relative to the reference
value. The units used with the right display depend upon the setting of the LOG/LIN key
(see table above). Pressing the LOG/LIN key alternates the display between the LOG and
the LIN functions. When the measurement mode is changed, the last setting of the LOG/LIN
key for that mode is remembered and applied to the new measurement.
To re-enter ratio with the previous ratio reference or to read the reference, enter in the
corresponding HP-IB program code. The special function codes are listed as follows:
I
Ratio Operation
Re-enter ratio with the previous reference.
I
Examples
Read ratio reference.
11.OSP
I
11.1SP
I
If the display shows 100 mV, to enter this value as the RATIO reference for future
measurements:
3-73
Model 89033
Operation
RATIO and LOG/LIN (cont’d)
(Special Function 11)
Examples
(cont’d)
Ratio
LOCAL
(keystrokes)
Q RATIO
a
R1
T
(program codes)
Ratio
If the display shows O.lOOV, to compare this to a value of 2V:
2R1
(program codes)
e
D a t aJ L R a t i o
Program Codes The HP-IB codes for re-entering ratio or for reading the reference are given above. The
HP-IB codes for the RATIO and LOG/LIN keys are given below:
Function
LOG
LIN
RATIO Off
RATIO On
LG
LN
RO
R1
Indications
When the instrument is displaying a ratio measurement, the RATIO key lights. The status
of the LOG/LIN key can be determined by observing the the current measurement mode,
the measurement unit lights, and the table above.
Comments
The ratio mode can also be used to view an extra digit of resolution when the right display
is only showing three digits. Depending upon the current value displayed, entering either
lOORl or 1R1 will cause an unscaled right display readout (that is, the numbers are correct
but the decimal point may not be in the correct position). However, an extra digit of
resolution is displayed (for example, if 1.58 was originally displayed, the new display might
indicate 1.576). Note that the units annunciator will change to % and should be interpreted
properly.
Ratio cannot be used with a frequency measurement. Also, if a negative reference is entered,
the ratio indication will be displayed in absolute (unsigned) value.
The LOG function cannot be used with a reference that is zero or negative. If the reference
is zero, Error 20 (entered value out of range) is displayed. If the reference is negative, Error
11 (calculated value out of range) is displayed.
Related
Sections
3-74
AC Level
DC Level
Distortion
Distortion Level
Error Message Summary
SINAD
Special Functions
Model 89033
Operation
Read Display to HP-IB
(Special Function 20)
Description
The Distortion Analyzer can be set to read the information shown in either the left or right
display to the HP-IB bus. Using Special Function 20 through HP-IB allows the operator
to manually determine which display’s information will be placed on the HP-IB bus. This
capability is typically used in the Talk Only Mode when logging data to a monitoring device.
(Note that when set to Listen Only, the Distortion Analyzer cannot place data on the bus.
If it is set to talk and listen both, front-panel control is relinquished and HP-IB codes RR
and RL determine the data output.)
Procedure
To set the Distortion Analyzer to output data to the HP-IB from either the left or right
display, enter the corresponding HP-IB program code.
1
Display
Read
Right
20.0SP (or RR)
20.1SP (or RL)
Example
To read the left display to the HP-IB:
~
20.1SP
(program codes)
Code
1
L F unction
or
Y F u n c t ion
Program Code For HP-IB codes, refer to the table in the Procedure above.
Indications
As the program code is entered, both displays will blank, the entered code will flash in the
left display, and four dashes will momentarily appear in the right display. Both displays
then return to the display that is appropriate for the current measurement mode.
T u
Related
Sections
Bytes 1 I and 12: CR, LF (carriage return, line feed)
Bytes 9 and 10: Two-digit exponent
Byte 8: Sign of exponent, + or Byte 7: E (exponent)
Bytes 2-6: DDDDD, reading from display where
Byte 6 corresponds to the least significant digit
of the reading in the display.
Special Functions
3-75
Model 89033
Operation
Service Request Condition
(Special Function 22)
Description
The Distortion Analyzer will issue a Require Service message under various circumstances.
For example, a Require Service message will always be issued if an HP-IB code error occurs.
Using HP-IB program codes, the operator may enable one or more conditions to cause the
Require Service message to be issued. Whenever the enabled condition occurs, it sets both
the bit corresponding to the condition, and bit 7 (RQS bit) in the Status Byte. The bits
set in the status byte and the Require Service message are not cleared unless the status
byte is read (by serial polling), a Clear message is received and executed by the Distortion
Analyzer, or a ControlIer Reset or Controller Clear Service Special Function is performed.
The enabled Service Request conditions are always disabled again whenever a Clear message
is received and executed by the Distortion Analyzer, or whenever a Controller Reset, or
Controller Clear Service Special Function is performed. Automatic operation does not clear
a Require Service message.
Procedure
To enable one or more conditions to cause the Distortion Analyzer to issue a Require Service
message, sum the weights of the conditions to be enabled (from the table below). This sum
becomes the code suffix of Special Function 22. Enter the special function code (prefix,
decimal, and suffix) via the HP-IB program code. An HP-IB code error (weight 2) will
always cause a Require Service message. This condition cannot be disabled, and if the weight
is not summed in, it will be assumed by the instrument.
Condition
Weight
~~
Data ready
HP-IB code error
instrument error
Example
1
2
4
To set the Distortion Analyzer to send a Require Service message when an instrument error
occurs (or when an HP-IB code error occurs) first compute the special function suffix by
summing the weights corresponding to those conditions:
(2)
+4 =6
Then enter the code:
(program codes)
Code
YT-
Function
Program Code Compute the special function code as described under Procedure above.
3-76
Model 89033
Operation
Service Request Condition (cont’d)
(Special Function 22)
Indications
As the HP-IB program code is entered, it will flash on the front-panel display, then the
display returns to show the measurement previously selected. When any enabled condition
occurs, both the RQS bit and the bit corresponding to the enabled condition are set in the
status byte, and the SRQ control line on the HP-IB will be set true. The Distortion
Analyzer’s status byte is shown below for reference.
Bit
8
7
6
5
4
3
2
1
Weight
128
64
32
16
8
4
2
1
0
Instrument
HP-IB
Data
Ready
0
Condition (always)
Comments
RQS
0
0
(always) (always
(always)
Error
Code
Error
For more information on HP-IB operation, serial polling, and the Status Byte message, refer
to the HP-IB discussion titled HP-IB Operation appearing earlier in Section 3 of this manual.
The HP-IB Address Special Function provides a convenient means to determine at any
time whether a Require Service message is being issued by the Distortion Analyzer.
Related
Sections
HP-IB Address
HP-IB Operation (appears earlier in Section 3)
3-77
Model 8903E
Operation
SINAD
Description
The Distortion Analyzer measures SINAD (SIgnal to Noise And Distortion) by first determining the following value:
S =
signal, noise, and distortion
noise and distortion
S is then converted into the appropriate measurement units as follows:
% units = S X 100%
dB units
=
2010g S
A SINAD measurement can be made on signals from 20 Hz to 100 kHz and from 50 mV
to 300V in the single-ended mode (FLOAT switch in grounded position). SINAD measurements are generally made to determine the sensitivity of a receiver. In SINAD mode, the
Notch Filter tunes to the Counter Frequency. However, with noisy input signals (SINAD
the signal is too noisy and unsettled for a good reading. Consequently,
ratios less than 15 a),
the notch filter jumps around trying to lock on to the input signal. The resulting SINAD
reading will probably be erroneous. The following procedure will allow you to make stable
SINAD measurements at any SINAD ratio.
Procedure
First, input a clean external source signal (SINAD ratio greater than 20 dB), with Notch
Tune on automatic tuning (NOTCH TUNE off). Press S (Shift) SINAD. This allows the
Notch Filter to tune to the input frequency. Freeze the notch filter by pressing the NOTCH
TUNE key. This locks the NotchtFilter onto the input frequency. Enter your desired signal
to be measured (SINAD less than 15 dB),but at the same external source frequency. The
SINAD ratio measurement is read on the right display.
Example
To select SINAD:
~
LOCAL
(keystrokes)
NOTCH TUNE
Enter a clean
external signal.
-S
El
SINAD
N1
-
7-
(program codes)
a
Measurement
Function
Program Code M2 is the HP-IB code for the SINAD measurement.
Indications
3-78
When the HP-IB program code is entered, both displays blank and four dashes are momentarily displayed in the right display. The displays then return to the normally displayed
information for the currently selected measurement mode. The LEDs in the DISTN/SINAD
and S keys light and the appropriate SINAD information for the input signal is displayed.
Model 89033
Operation
SINAD (cont’d)
Measurement
Technique
In the SINAD measurement mode, the controller automatically sets the input attenuation
and the gain of various amplifiers. This is accomplished by measuring the signal with the
ranging rms detector. This control ensures that the signal amplitude is within the proper
range of the input and output detectors. The input detector converts the combined signal
+ noise + distortion ac signal to dc. The notch filter then removes the fundamental signal
and the output detector converts the noise + distortion ac signal to dc. The dc voltmeter
measures both signals. The controller then corrects for the programmed gain and attenuation,
computes the ratio, and displays the results in the appropriate units. The frequency of the
input signal is also measured and displayed.
COUNTER/
LEFT DISPLAY
LFREQUENCY~
IH*/y
-
c
*
c*
c
*
-
c/c/c/c/
- uuuu
SINAD Measurement Block Diagram
Comments
During a SINAD measurement, the output detector uses increased filtering to obtain more
consistent readings in the presence of noise.
SINAD can be measured with either the true rms or average responding detector. Most
applications specify true rms detection.
The Distortion Analyzer powers up with Special Function 16.1 active for 0.0 dB resolution
at all SINAD ratios. Special Function 16.0 rounds the digital display to 0.5 dB to reduce
digit flicker, for SINAD ratios less than 25 dB.
Related
Sections
Detector Selection
Special Functions
3-79
Operation
Model 89033
Special Functions
Description
General Information. Special Functions extend user control of the instrument beyond that
normally available from dedicated front-panel keys. They are intended for the user who has
an understanding of the instrument, and the service technician who needs arbitrary control
of the instrument functions. Special Functions are accessed via HP-IB entry of the appropriate
numeric code (refer to Procedures below). The codes comprise a prefix, decimal, and suffix.
Special Functions are disabled by a variety of means, depending upon the function. Refer
to the comprehensive listings below for actions which clear or disable any Special Function.
Special Functions are grouped by their prefixes into three categories as follows:
Prefix 0
This is the Direct Control Special Function and is intended for use in servicing
the Distortion Analyzer. All instrument error messages and safeguards are inactive.
This is discussed in detail in Section 8. If the Direct Control is entered inadvertently, enter Automatic Operation (AU) over the HP-IB.
Prefixes 1 to 39
These are the User Special Functions which are used during normal instrument
operation when a special configuration, a special measurement, or special information is required. All error messages and some safeguards remain in effect unless
the operator disables them. These Special Functions are described below.
Prefixes 40 to 99
These are the Service Special Functions used to assist in troubleshooting an
instrument fault. The functions available are quite diverse - special internal
measurements, software control, and special service tests and configurations. Most
instrument safeguards are relinquished. These Special Functions are discussed in
detail in Section 8. If a Service Special Function is entered inadvertently, enter
Automatic Operation (AU) over the HP-IB.
Viewing Special Function States. The operator-requested settings of Special Functions
prefixed 1 through 8 may be viewed by pressing the S (Shift) Notch Tune keys once. This
display is called the Special Display. If some of these Special Functions are in automatic
modes (generally the 0-suffix setting), the actual instrument settings of these functions may
be displayed by pressing the S (Shift) Notch Tune keys a second time while the Special
Display is active. This display is called the Special Special Display. If desired, these displays
can be cleared by pressing any key except the LCL or S (Shift) keys. A summary of User
Special Functions is given on the following pages. Following the summary are procedures
for using Special Display. These displays are also illustrated and explained.
NOTE
The following special functions are ignored: 7.0SP, 7.1SP, 8.2SP, 10.0SP) 12.1SP
through 12.9SP, 13.OSP) 13.1SP, and 17.1SP through 17.9SP. The instrument
will accept the above HP-IB codes (with the possibility of an erroneous display),
but they will not result in a measurement.
3-80
Operation
Model 89033
Special Function Summary (1 of 3)
HP-IB
Code
Special Function
Name
Code
Description
1.o
1.1
1.2
1.3
1.4
1.5
1.6
1.7
1.8
1.9
1.10
1.11
1.12
1.13
1.14
1.15
1.16
1.17
1.18
1.19
1.OSP
l.lSP
1.2SP
1.3SP
1.4SP
1.5SP
1.6SP
1.7SP
1.8SP
1.9SP
1.1OSP
1.11SP
1.12SP
1.13SP
1.14SP
1.15SP
1.16SP
1.17SP
1.18SP
1.19SP
Automatic selection
300V range
189V range
119V range
75.4V range
47.6V range
30.0V range
18.9V range
11.9V range
7.54V range
4.76V range
3.00V range
1.89V range
1.19V range
0.754V range
0.476V range
0.300V range
0.189V range
0.119V range
0.0754V range
Input Level
Range (DC
Level only)
2.0
2.1
2.2
2.3
2.4
2.0SP
2.1 SP
2.2SP
2.3SP
2.4SP
Automatic Selection
300V range
64V range
16V range
4V range
Post-Notch
Gain
3.0
3.1
3.2
3.3
3.4
3.0SP
3.1SP
3.2SP
3.3SP
3.4SP
Automatic selection
0 dB gain
20 dB gain
40 dB gain
60 dB gain
Hold Decimal
Point (right
display only)
4.0
4.1
4.2
4.3
4.4
4.5
4.6
4.7
4.8
4.0SP
4.1 SP
4.2SP
4.3SP
4.4SP
4.5SP
4.6SP
4.7SP
4.8SP
Automatic Selection
DDDD.range1
DDD.D range
DD.DD range
D.DDD range
0.DDDD range2
DD.DD mV range
D.DDD mV range
0.DDDD mV range2
5.0
5.1
5.2
5.3
5.0SP
5.1SP
5.2SP
5.3SP
Input Level
Range (except
DC level)
~
~~
Post-Notch
Detector
Filtering
(except in
SINAD)
~
Fast RMS Detector
Slow RMS Detector
Fast Average Detector
Slow Average Detector
RUTO. OP.
Y
Y
Y
Y
Y
Y
Y
1
CLEAR”(
-
Y
Y
Y
Y
Y
Y
Y
Y
Y
Y
Y
Y
N
N
N
N
N
N
N
N
N
N
N
N
N
N
N
N
N
N
N
-
-
Y
Y
Y
Y
Input Level Range
(DC Level only)
N
N
N
N
-
-
Post-Notch Gain
-
-
Hold Decimal Point
Y
Y
Y
Y
Y
Y
Y
Y
Y
Y
Y
Y
Y
Y
Y
N
N
N
N
N
N
N
N
1
2
-
=
No;
- = Not
Applicable: Y = Yes;
Decimal Point not
displayed.
Leading zero not
displayed. Shown
to clarify decimal
point position.
Post-Notch
Detector
Response
N
N
N l
I
N
References and
Comments
‘Except the LCL Keys “The Clear Key Function.
I
3-81
Model 89033
Operation
Special Function Summary (2 of 3)
HP-IB
Code
Special Function
Name
Code
Description
RUTO. OP.
-
Notch Tune
5.0
5.1
6.0SP
6.1 SP
Automatic notch tuning
Hold notch tuning
Error Disable
5.0
5.1 or
5.3
8.0SP
8.1SP or
8.3SP
All errors enabled
Disable Analyzer errors
(Errors 12-17,31 ,and 96)
Hold Settings
9.0
9.OSP
Hold input level ranges,
post-notch gain, decimal
point and notch tuning
at present settings.
Y
Restore last RATIO
reference and enter
RATIO mode if allowed.
Display RATIO
reference
N
~~
11.OSP
11.1
11.1SP
Time Between
Measurements
14.0
14.0SP
14.1
14.1SP
SINAD Display
Resolution
16.0
16.0SP
16.1
16.1 SP
Display Level
in Watts
19.0
19.OSP
19.NNN
19.NNNSP
20.0
20.1
Minimum time between
measurements
Add 1s between
measurements
0.01 dB above 25 dB;
0.5 dB below 25 dB
0.01 dB all ranges
~
~~
HP-IB Address
Y
Y
Y
Y
Y
20.0SP
20.1 SP
Read right display
Read left display
N
N
21 .o
21 .OSP
Y
21.1
21.1 SP
Displays HP-IB address
(in binary) in left display;
right display in form TLS
where:
T=l means talk only;
L=l means listen only;
S=l means SRQ.
Displays HP-IB address
in decimal.
N = NO;
3-82
-
Display level as watts
into 8Sl
Display level as watts
into NNNSl
~~
Read Display
to HP-IB
Y
~
11.0
Re-enter Ratio
Mode
-=
Not ADDliCable; Y
= Yes;
1
Disable
Y
-
References and
I Notch Tune
N I
I--
I Error Disable
1
N l
Hold Settings
RATIO and
LOG/LIN
Y
I
Measurement
_t---SINAD
N l
T
y I
Display Level in
Read Display to
HP-IB
I
Y
I HP-IB Address
'Except the LCL Keys "The Clear Key Function.
Model 89033
I
Operation
Special Function
Special Function Summary (3 of 3)
I
HP-I6
Name
Service Request
I
N
=
Procedure
AUTO. OP.
Enable a condition to
cause a service request,
N is the s u m of any
combination of the
weighted conditions
below:
1-Data Ready
2-HP-IB error
4-Instrument error
The instrument powers
up in t h e 22.2 state
(HP-IB error).
No:
- = Not Applicable;
Y =
I
Disable
Description
References and
N
Yes; 'Except the LCL. S (Shift), and Numeric Keys "The Clear Key Function.
Entering Special Functions. To use a special function, enter the corresponding HP-IB
program code.
Special Display. To display the user-requested modes of Special Functions 1 through 8,
press the S (Shift) key then the NOTCH TUNE key or enter the HP-IB code SP. The
digit position (noted beneath the displays) corresponds to the special function prefix, and
the number displayed in that position corresponds to the special function suffix.
Special Special Display. To determine the actual instrument settings of functions prefixed
1 through 8, press the S (Shift) key and the NOTCH TUNE key once while Special Display
is active or enter the HP-IB code SS. (If the Special Display described above is not in
effect, press the above mentioned keys twice to get this display.) The digit position corresponds
to the function prefix, and the number displayed in that digit corresponds to the function
suffix.
Examples
Entering Special Functions. To set the post-notch gain to 40dB:
Code
(program codes)
Special Display. When the S (Shift) and NOTCH TUNE keys are pressed, the following
display results,
(= PREFIXES)
1
2
3
4
5
6
7
8
3-83
Operation
Model 89033
Special Functions (Cont’d)
Examples
(cont’d)
This display indicates that the following Special Functions were selected by the operator:
Special Function
-
User-Requested Setting
Code
Name
1.17
2.0
3.0
4.6
5.0
6.1
Input Level Range (Except DC Level)
Input Level Range (DC Level only)
Post-Notch Gain
Hold Decimal Point
Post-Notch Detector
Notch Tune
Error Disable
8.1
-
0.189V range
Automatic Selection
Automatic Selection
DD.DD mV range (right display only)
Fast R M S Detector Filtering (Except in SINAD)
Hold notch tuning
Disable analyzer errors
Special Special Display. When the S (Shift) and NOTCH TUNE keys are pressed again
while the Special Display is active and the following display results, the actual instrument
settings are tabulated below.
(= SUFFIXES)
1
(= PREFIXES)
Code
1.17
2.1
3.4
4.6
5.0
6.1
8.1
-
2
3
4
Special Function
Name
Input Level Range (Except DC Level)
Input Level Range (DC Level only)
Post-Notch Gain
Hold Decimal Point
Post-Notch Detection Filtering
Notch Tune
Error Disable
5
6
3-84
8
Actual Instrument Setting
0.189V range
300V range
60 dB Range
DD.DD mV range
Fast R M S Detector (Except in SINAD)
Hold notch tuning
Disable analyzer errors
Code HP-IB Codes for the special functions are summarized in the Special
Function Summary above.
Indications
7
Entering Special Functions. As the HP-IB program code is entered, both
displays will blank, and the entered code will flash in the left display.
Four dashes will momentarily appear in the right display, then are replaced
with the appropriate reading for the selected measurement mode.
Operation
Model 89033
Special Functions (Cont’d)
Comments
If a User Special Function (prefixes 1 to 39) has a suffix of zero, the zero need not be
entered. For example, 5.0 SP equals 5. SP. (However, 1.1 SP does not equal 1.10 SP.) If
when entering an HP-IB program code, Error 21 (invalid key sequence) is displayed, the
special function requested has not been executed. Entry of invalid special function suffixes
results in display of Error 23. For additional information on Direct Control Special Functions
(prefix 0) or Service Special Functions (prefixes 40 to 99) refer to Section 8.
Related
Sections
Automatic Operation
Default Conditions and Power-up Sequence
Special Function Summary table (under Description above)
3-85
Model 8903E
Operation
Time Between Measurements
(Special Function 14)
Description
Procedure
A one-second delay between measurements can be added using Special Function 14. It can
be used to to allow the device under test to settle before making the measurement.
To add or delete the one second time delay between measurements, enter the corresponding
HP-IB program code.
Time Delay Between
Measurements
~~~
Minimum
Add 1 second
Example
14.0SP
14.1SP
To set a one second time delay between measurements:
e
(program codes)
Code
Program Codes For HP-IB codes, refer to Procedure above.
YT-
Function
Indications
As the program code is entered, both displays will blank and the entered code will flash in
the left display. Both displays then return to the display that is appropriate for the currently
selected measurement mode.
Related
Sections
Automatic Operation
Special Functions
3-86
Model 8903E
Performance Tests
Section 4
PERFORMANCE TESTS
4-1. INTRODUCTION
The procedures in this section test the instrument’s electrical performance using the specifications of Table
1-1 as the performance standards. AI1 tests can be performed without access to the interior of the instrument.
A simpler operational test is included in Section 3 under Bclsic Fienctional Cheeks (paragraph 3-10). The Basic
Functional Checks also test the instrument’s ability to function in the automatic mode (which is not thoroughly
checked by the Performance Tests).
NOTE
Unless otherwisc nottd, no warm-icp pcriod is rtqicired for these tt’sts.
Line vollagtp rniist he within +5% and -1090 ojthe spt~i*l/iedinpict voltage (100, 120, 220,
or 240 Vac) fi the performance tes/s art’ to be considtwd valid.
4-2. EQUIPMENT REQUIRED
Equipment required for the performance tests is listed in Table 1-3, Rec*omrncndt>dTcsf Eqiriprncwt in Section
1 of this manual. Any equipment that satisfies the critical specifications in the table may be substituted for the
recommended model(s).
NOTE
The perJormance tests arc ha.5t.d on the asslimption that the rtx*omrntwdcd k’sf quipmcnf is used. Siihstifitling altcmafc fesl cqiiipmcwf may reqirirr modgfication of sornc
proccd i r res.
4-3. TEST RECORD
Results of the performance tests may be tabulated on the Test Record shown in Table 4-1 at the end of
the procedures. The Test Record lists all of the tested specifications and their acceptable limits. The results,
recorded at incoming inspection, can be used for comparison in periodic maintenance and troubleshooting
and after repairs or adjustments.
4-4. CALIBRATION CYCLE
This instrument requires periodic verification of performance. Depending on the use and environmental conditions, the instrument should be checked using the following performance tests at least once every year.
4-5. ABBREVIATED PERFORMANCE TESTING
No abbreviation of performance testing is recommended.
4- 1
Performance Tests
Model 8903E
PERFORMANCE TESTS
4-6. AC LEVEL ACCURACY PERFORMANCE TEST
SPECIFICATION:
Characteristic
Performance Limits
Conditions
AC LEVEL
Accuracy
50 mV to 300V; 20 Hz to 20 kHz
50 mV to 300V; 20 kHz to 100 kHz
0.3 mV to 50 mV; 20 Hz to 100 kHz
32VO
39%
39%
DESCRIPTION:
For each ac range, ac level accuracy is determined by measuring the output of an ac calibrator. In addition, for
the lowest range, the output of an audio synthesizer is set to the lowest level of the just-completed calibration.
This level is established as a ratio reference, then the signal is attenuated by a precise amount.
The procedure is run with the outer conductor of the input connector grounded, then with the inner conductor
grounded and the signal applied to the (ungrounded) outer conductor.
A controller with HP-IB is recommended for this test since it provides the most convenient method for setting
level ranges. However, an alternate method, not requiring a controller, is also mentioned in the procedure.
Voltagcs iip fo 300 Vrms will be applied to fhc Distortion Analyzer's inpirf connmor.
EQUIPMENT:
AC Calibrator..
.............. HP 754A and HP 746A, Datron
4200,
or Fluke 5200A and Fluke 5215A
.....................
HP 3336C
Audio Synthesizer .....................................
Controller with HP-IB ............................
HP 85B Opt 007
HP 10110B
Dual Banana t o BNC Adapter .........................
Dual Banana to BNC Adapter .......................
HP 1251-2277
PROCEDURE
NOTE
The Distortion A n a l y z t ~ 'HP-IB
.~
addrtw is asslimed
are given in BASIC.
IO
be 728. All HP-IB command.s
High-Level, High-Input AC Level Accuracy
1. Connect the HP-IB controller to the Distortion Analyzer. Key in and execute the following command:
O'JTPUT 728; "41.OSP LO"
to initialize the instrument and set the 80 kHt LOW PASS filter off.
NOTE
I f a confrolkr is not k i n g iiwd, swilch lhc Dislorfion Analyzrr to oirthen hack on. AJivr
powr-tip, press thc 80 kHz LOW PASS to tirm if c$$
4-2
Model 8903E
Performance Tests
PERFORMANCE TESTS
2. Set the Distortion Analyzer’s INPUT switch to ground. Connect the ac calibrator to the Distortion Analyzer’s INPUT.
3. Set the ac calibrator to the level indicated in the table. (Use the high voltage amplifier where needed.)
Using the controller, key in and execute the Special Function and ratio commands indicated in the table
below. Now set the ac calibrator to the frequency indicated in the table. The right display of the Distortion
Analyzer should read within the limits indicated.
NOTE
if a controller is not being used, procwd as joIlows:
a. St>tthe ac calihrator (lcvel and jkyircncy) as indicated.
b. P r t x S (Shfl)NOTCH TUNE S (Shifr) NOTCH TUNE. In the kji display. the digit
or digits displayed in position I and the digit prtwding it (if not hlankcd) shoiild
agree with the Special Firnction sigfjx of the controlkr command in the table. (For
example, the displayfor 1.2SP shoirld he 2 in posiiion I (the preceding digit hlank).
The display for 1.12SPshoirld he I.? with 2 in position I and I preceding it.)
c. Pre.$s AC LE VEL. Compiite the ratio of’ f h e wading in the right display to ihe
calibrator set fing. The ratio shoiild he within the limits indicated in the t a h k
Controller
Commands
OUTPUT 728:
“1.1SP 300R1*’
Ratio Limits (“IO)
AC Calibrator
~~~
~~
Actual
Maximum
Level (Vrms)
Frequency (Hz)
Minimum
300
20
2 000
20 000
100 000
98
98
98
96
102
102
102
104
“1.2SP 150R1”
150
100 000
20 000
2 000
20
96
98
98
98
104
102
102
102
“1.3SP 100R1“
100
20
2 000
20 000
100 000
98
98
98
96
102
102
102
104
”1.4SP70R1”
70
100 000
20 000
2 000
20
96
98
98
98
104
102
102
102
“1.5SP 45R1”
45
20
2 000
20 000
100 000
98
98
98
96
102
102
102
104
“1.6SP 30R1”
30
100 000
20 000
2 000
96
98
98
98
104
102
102
102
~~
4-3
Model 8903E
Performance Tests
PERFORMANCE TESTS
Controller
Level (Vtms)
Frequency (Hr)
Minimum
15
20
2 000
20 000
100 000
98
98
98
96
102
102
102
104
"1.8SP 1OR1
10
100 000
20 000
2 000
20
96
98
98
98
102
102
7
20
2 000
20 000
100 000
98
98
98
96
102
102
102
104
4.5
100 000
20 000
2 000
20
96
98
98
98
104
102
102
102
3.0
20
2 000
20 000
100 000
98
98
98
96
102
102
102
104
"1.12SP 1.5R1"
1.5
100 000
20 000
2 000
20
96
98
98
98
104
102
102
102
"1.13SP l R 1 "
1.o
20
2 000
20 000
100 000
98
98
98
96
102
"1.14SP 0.7R1"
0.7
100 000
20 000
2 000
20
96
98
98
98
104
102
102
102
"1.15SP 0.45R1"
0.45
20
2 000
20 000
100 000
98
98
98
96
102
102
102
104
"1.16SP 0.3R1"
0.30
100 000
20 000
2 000
96
98
98
98
104
102
102
102
"
"1.9SP 7R1"
"1.lOSP 4.5R1
"1.11SP 3R1
4-4
Ratio Limits (%)
AC Calibrator
Commands
OUTPUT 728;
"1.7SP 15R1"
'I
I'
Actual
Maximum
104
102
102
102
104
Performance Tests
Model 8903E
PERFORMANCE TESTS
Controller
Commands
OUTPUT 728:
Ratio Limits ("A)
AC Calibrator
~~
Level (Vrms)
Frequency (Hz)
Minimum
20
2 000
20 000
100 000
98
98
98
96
102
1 02
102
104
Actual
Maximum
"1.17SP0.15R1"
0.15
"1.1 8SP 0.1R1"
0.10
100 000
20 000
2 000
20
96
98
98
98
104
102
1 02
102
"1.19SP0.07R1"
0.07
20
2 000
20 000
100 000
98
98
98
96
1 02
1 02
1 02
104
"0.007R1"
0.007
100 000
20 000
2 000
20
96
96
96
96
104
104
104
104
High-Level, Low-Input AC Level Accuracy
4. On the Distortion Analyzer, set the INPUT switch to FLOAT.
5. Connect the equipment as shown in Figure 4-1. Note how the cable connects to the Distortion Analyzer's
input through the two adapters. The adapters reverse the outer and inner conductor connections t o the
cable.
8903E
DISTORTION ANALYZER
I
I
(NOTE THE
ORIENTATION
OF THE GROUND
TERMINAL.)
1
GROUND INDICATOR
4-5
Model 8903E
Performance Tests
PERFORMANCE TESTS
6. Set the ac calibrator to the level indicated in the table. (Use the high voltage amplifier as needed.) Using
the controller, key in and execute the Special Function and ratio commands indicated in the table below.
Now set the ac calibrator to the frequency indicated in the table. The right display of the Distortion
Analyzer should read within the limits indicated.
NOTE
If a controller is not being iiscd, follow the procediire of the Note in sfep 3.
Controller
Commands
OUTPUT 728;
"1.6SP 30R1"
Level (Vrms)
"1.7SP 15R1"
~
~~
Minimum
100 000
20 000
2 000
20
96
98
98
98
104
102
102
102
15
20
2 000
20 000
100 000
98
98
98
96
102
102
102
104
"1.8SP 1OR1
10
100 000
20 000
2 000
20
96
98
98
98
104
102
102
102
"1.9SP 7R1"
7
20
2 000
20 000
100 000
98
98
98
96
102
102
102
104
"1.1OSP 4.5R1"
4.5
100 000
20 000
2 000
20
96
98
98
98
104
102
102
102
30
Actual
Maximum
Frequency (Hz)
"
"1.11SP 3R1"
3.0
20
2 000
20 000
100 000
98
98
98
96
102
102
102
104
"1.12SP 1.5R1"
1.5
100 000
20 000
2 000
20
96
98
98
98
102
102
20
98
98
98
96
102
102
102
104
"1.13SP 1R1"
4-6
Ratio Limits ("A)
AC Calibrator
1.o
2 000
20 000
100 000
104
102
Model 8903E
Performance Tests
PERFORMANCE TESTS
Controller
Commands
OUTPUT 728:
"1.14SP 0.7R1"
Level (Vrms)
Frequency (Hr)
Minimum
0.7
100 000
20 000
2 000
20
96
98
98
98
104
102
102
102
"1.15SP 0.4541
0.45
20
2 000
20 000
100 000
98
98
98
96
102
102
102
104
"1.16SP 0.3R1"
0.30
100 000
20 000
2 000
20
96
98
98
98
104
102
102
102
"1.17SP 0.15R1"
0.15
20
2 000
20 000
100 000
98
98
98
96
102
102
102
104
"1.18SP 0.1R1"
0.10
100 000
20 000
2 000
20
96
98
98
98
104
102
"
AC Calibrator
Ratio Limits (%)
Actual
Maximum
102
102
"1.19SP 0.07R1"
0.07
20
2 000
20 000
100 000
98
98
98
96
102
"0.007Rl"
0.007
100 000
20 000
2 000
20
96
96
96
96
104
104
104
104
102
102
104
Low-Level, Low-Input AC Level Accuracy
7. On the Distortion Analyzer, press the LCL key and set RATIO off.
8. Replace the ac calibrator with the audio synthesizer. (Leave the adapters as they are.) Set the audio
sythesizer's level to approximately 7 mVrms as read on the Distortion Analyzer.
9. Set the audio synthesizer to the frequency indicated in the table below. For each setting, perform the
following procedure:
a. Press RATIO if it is on. Set the audio synthesizer to 7 mVrms as read on the Distortion Analyzer.
Press RATIO.
b. Decrease the level of the audio synthesizer by exactly 26 dB. Note the reading of the right display of
the Distortion Analyzer.
c. Multiply the reading on the right display by the entry in the table of step 6, which corresponds to the
4-7
Model 8903E
Performance Tests
PERFORMANCE TESTS
a c calibrator setting of 0.007 Vrms at the current frequency. Divide the result by 100. The computed
ratio should be within the limits indicated below. For example, if the reading in step b was 5.03%
and the corresponding reading of step 6 is 101.5%, the computed result is
5.03% x 101.5% = 5.11%o.
100%
4-8
Synthesizer
Frequency
(Hz)
20
2 000
20 000
100 000
Displayed
Reading of
Step b (YO)
Synthesizer
Frequency
(H4
100 000
20 000
2 000
20
Displayed
Reading of
Step b (YO)
Limits of Computed Result (YO)
Minimum
4.81
4.81
4.81
4.81
Actual
Maximum
5.21
5.21
5.21
5.21
Limits of Computed Result (YO)
Minimum
4.81
4.81
4.81
4.81
Actual
Maximum
5.21
5.21
5.21
5.21
Model 8903E
Performance Tests
PERFORMANCE TESTS
4-7. D C LEVEL ACCURACY PERFORMANCE TEST
SPECIFICATION:
I
Characteristic
DC LEVEL
Accuracy
I
Performance Limits
I
Conditions
k0.75% of reading
400 mV to 300V
f3 rnV
<400 mV
1
DESCRIPTION:
The output from a dc standard is applied to the input of the Distortion Analyzer and the voltage o n the display
is compared against the output from the standard. The procedure is run with the outer conductor of the input
connector grounded then with the inner conductor grounded and the signal applied to the (ungrounded) outer
conductor.
Voitagcs rip to 300 Va’c will be applitd to the DiftorfionAnalyztd~inpuf connecfor.
EQUIPMENT:
DC Standard.. . . . . . . . . . . . . . HP 740B, Datron 4000, or Fluke 893AR
DC Standard
Voltage (Vdc)
300
30
3
0.4
0.04
DC Voltage Limits (Vdc)
Minimum
Actual
Maximum
297.75
29.775
2.9775
0.397
0.037
302.25
30.225
3.0225
0.403
0.043
Low-Input DC Level Accuracy
4. On the Distortion Analyzer, set the INPUT switch to FLOAT.
5. Connect the equipment as shown in Figure 4-2. Note how the cable connects to the Distortion Analyzer’s
input through the two adapters. The adapters reverse the outer and inner conductor connections t o the
cable.
4-9
Model 8903E
Performance Tests
PERFORMANCE TESTS
8903E
DISTORTION ANALYZER
DC STANDARD
(NOTE THE
ORIENTATION
OF THE QROUND
TERYINAL.)
QROUND INDICATOR
6. Set the dc standard to give the output voltage indicated below. For each setting, the right display on the
Distortion Analyzer should read within the limits indicated.
DC Standard
Voltage (Vdc)
0.04
0.4
3
30
4- 10
DC Voltage Limits (Vdc)
Actual
Maximum
Minimum
0.037
0.043
0.397
0.403
I
I
2.9775
29.775
3.0225
30.225
Model 8903E
Performance Tests
PERFORMANCE TESTS
4-8. RESIDUAL DISTORTION AND NOISE PERFORMANCE TEST
SPECIFICATION:
Performance Limits
Characteristic
Conditions
DISTORTION AND SINAD
The higher of -80 dB
or 15pV
The higher of -70 dB
or 45 pV
The higher of -68 dB
or 45 uV
Residual Noise and
Distortion
20 Hz to POkHz;
80 kHz bandwidth
20 kHz to 50 kHz;
500 kHz bandwidth
50 kHz to 100 kHz;
500 kHz bandwidth
DESCRIPTION:
The output of a low-distortion audio oscillator is connected to the Distortion Analyzer’s input, and the combination ofdistortion and noise is measured at various frequencies and levels. The test measures the distortion
and noise ofthe oscilllator and analyzer simultaneously. If either instrument is out of specification, a known,
good oscillator or analyzer can be substituted to determine which instrument is at fault.
EQUIPMENT:
Audio Oscillator.. . . . . . . . . . . . . . . . . . . . . . , . . . . HP 339A or HP 8903B
PROCEDURE:
1. Switch the Distortion Analyzer off,then back on to initialize it. Set the INPUT switch to ground. Connect
the output of the audio oscillator to the Distortion Analyzer’s INPUT.
2. On the Distortion Analyzer, press DISTN. Set the audio oscillator frequency and level (open-circuit) and
the Distortion Analyzer’s LP FILTER as indicated below. For each setting, the right display should be
within the limits indicated.
r-~
LOW
Audio Oscillator
Frequency (Hz)
Level (V)
20
3.0
3.0
2.5
1.9
0.3
3.0
3.0
0.3
3.0
2.5
1.9
1 000
1 000
1 000
1 000
20 000
50 000
50 000
100 000
100 000
100 000
PASS
FILTER
80 kHz
80 kHz
80 kHz
80 kHz
80 kHz
80 kHz
Off
Off
Off
Off
Off
Lii its (%)
Actual
Maximum
0.01
0.01
0.01
0.01
0.01
0.01
0.03
0.03
0.04
0.04
0.04
4-1 1
Model 8903E
Performance Tests
PERFORMANCE TESTS
4-9. DISTORTION AND SINAD ACCURACY PERFORMANCE TEST
SPECIFICATION:
Performance Limits
Characteristic
Conditions
DISTORTION
I
Accuracy
SINAD
I
*l dB
i2dB
il dB
32 dB
Accuracy
20 Hz to 20 kHz
20 kHz to 100 kHz
20 Hz to 20 kHz
20 kHz to 100 kHz
DESCRIPTION:
A signal with a known distortion level is created artificially by summing the outputs from two audio oscillators
at the input of the Distortion Analyzer. The artifical distortion is then measured by the Distortion Analyzer.
To calibrate the distortion, the second oscillator is set to a harmonic of the low-distortion oscillator, the two
signals are set to a common reference level using an external voltmeter with a very flat frequency response,
then the level of the second oscillator is attenuated to obtain a precise ratio.
EQUIPMENT:
Audio Oscillator, Low-Distortion ............ HP 339A or H P 8903B
H P 3336C
Audio Oscillator. ......................................
True RMS Voltmeter ..................................
H P 3403C
PROCEDURE:
1. Switch the Distortion Analyzer
follows:'
OK then back on to initialize it. Set the Distortion
Analyzer controls as
INPUT switch ...............................
ground
DISTN
MEASUREMENT. ...........................
LOG LTN.. ....................................
LOG
2. Connect the equipment as shown in Figure 4-3. The output impedance of both oscillators should be
50n. Set the voltmeter to read ac volts. Set the output of the low-distortion oscillator to 6V into an open
circuit.
8903E
DISTORTION ANALYZER
1
TRUE
RMS VOLTMETER
INPUT
50 OHM
I
I
SECOND
AUDIO OSCILLATOR
AUDIO OSCILLATOR
FEEDTHROUGH
TERMINATION
Figlire 4-3. Disforfionand SINAD A ccitracy TtW Sefiip
4-12
I
Model 8903E
Performance Tests
PERFORMANCE TESTS
3. Set the oscillator frequencies as indicated below. For each frequency setting, perform the following procedure:
a. Set the second oscillator level to minimum. Note the level of the output of the low-distortion oscillator on the external voltmeter.
b. Set the low-distortion oscillator amplitude to OV. Adjust the second oscillator’s level for the same
reading as in step a.
c. Decrement (that is, attenuate) the second oscillator’s output level as indicated.
d. Set the low-distortion oscillator level to 6V. The display on the Distortion Analyzer should read
within the limits indicated.
Second Oscillator
Frequency (Hz)
Atten (dB)
Low-Distortion
Oscillator
Frequency (Hz)
25
25
Level (dB)
Maximum
-81 .o
-9.4
-79.0
2 000
50
60
70
80
2 000
2 000
2 000
2 000
2 000
2 000
2 000
-1 1.4
-21 .o
-31 .O
4 1 .O
-51 .O
-61 .O
-71 .O
-81 .o
-9.4
-19.0
-29.0
-39.0
49.0
-59.0
-69.0
-79.0
6 000
6 000
80
10
2 000
2 000
-81 .o
-1 1.4
-79.0
-9.4
8 000
8 000
10
80
2 000
2 000
-1 1.4
-81.0
-9.4
-79.0
10 000
10 000
80
10
2 000
2 000
-81 .o
-1 1.4
-79.0
-9.4
40 000
40 000
10
80
20 000
-1 1.4
-81 .o
-9.4
-79.0
50
50
4 000
4 000
4 000
4 000
4 000
4 000
4 000
4 000
10
80
10
20
30
40
Second Oscillator
Frequency (Hz)
200 000
200 000
300 000
300 000
Atten (dB)
10
60
60
10
20 000
Low-Distortion
Oscillator
Frequency (HI)
Level (dB)
Minimum
Actual
Maximum
loo 000
100 000
-1 2.4
-62.0
-58.0
100 000
100 000
-62.0
-12.4
-58.0
-8.4
-8.4
4-13
Model 8903E
Performance Tests
PERFORMANCE TESTS
4-10. FREQUENCY ACCURACY AND SENSITIVITY PERFORMANCE TEST
SPECIFICATION:
Characteristic
Performance Limits
Conditions
FREQUENCY
Measurement
Range
20 Hz to 150 kHz
Accuracy
f0.004% 3tl digit
Sensitivity
50 mV
5 mV
20 Hz to 100 kHz
AC level mode
Distortion and SINAD modes
Distortion and SINAD modes
AC level mode
DESCRIPTION:
The frequency of an audio synthesizer is measured at various levels with the Distortion Analyzer’s counter.
EQUIPMENT:
Audio Synthesizer
. . . . .. . . . . . . . . . . . . . . . . . . . . . . . . . . . . . . . HP 3336C
NOTE
The audio synthesizer's time base accuracy mirst be 4 ppm or b t w r .
Audio Synthesizer
Frequency (Hz)
Level (mV)
5
20
50
20
99 900
99 900
150 000
4-14
50
5
5
MEASUREMENT
Mode
AC LEVEL
DlSTN
DlSTN
AC LEVEL
AC LEVEL
Minimum
19.99
19.99
99 895
99 895
149 980
Frequency Limits (Hz)
Actual
Maximum
20.01
20.01
99 905
99 905
150 020
Model 8903E
Performance Tests
PERFORMANCE TESTS
4-1 1. AUDIO FILTERS PERFORMANCE TEST
SPECIFICATION:
Characteristic
Performance Limits
Conditions
AUDIO FILTERS
30 kHz Low-Pass Filter
3 dB Cutoff Frequency
30 kHz 3
2 kHz
80 kHz Low-Pass Filter
3 dB Cutoff Frequency
80 kHz
400 Hz High-pass Filter (Option 010 or 050)
3 dB Cutoff Frequency
CCITT Weighting Filter (Option 011 or 051)
Deviation from Ideal Response(')
CCIR Weighting Filter (Option 012 or 052)
Deviation from Ideal Response(2)
C-Message Weighting Filter (Option 013 or 053)
Deviation from Ideal Response(3)
CCIR/ARM Weighting Filter (Option 014 or 054)
Deviation from Ideal Response(4)
M kHz
400 Hz MO Hz
il dB
i0.2dB
32 dB
zt3 dB
20 to 55O,80% relative humidity
50 to 300 Hz
300 Hz to 3 kHz
800 Hz
3 to 3.5 kHz
3.5 to 5 kHz
3 2 dB
fl dB
f0.5dB
fO.l dB
f0.2dB
i 0 . 4 dB
il dB
f2 dB
20 t o 5 5 O , 8O% relative humidity
20 to 31.5 Hz
31.5 to 200 Hz
0.2to 6.3 kHz
6.3 kHt
6.3 to 7.1 kHz
7.1 t o 10 kHz
10 t o 20 kHz
20 t o 31.5 kHz
f O . 1 dB
ztl dB
20 to 55O, 80% relative humidity
1 kHz
60 Hz to 5 kHz
&l dB
i0.5 dB
i O . l dB
f0.2dB
k0.4 dB
zt1 dB
i2 dB
20 to 5 5 O , 80% relative humidity
31.5 to 200 Hz
200 Hz to 6.3 kHz
6.3 kHz
6.3 to 7.1 kHz
7.1 to 10 kHz
10 to 20 kHz
20 to 31.5 kHz
A2 dB
See the Internattonal Telegraph and Telephone Consulatlve Committee (CCITT), Fifth Plenary Assembly, 1972, Telephone Transmission
Quality, The International Telecommunication Union (1973), pp. 87-91. (CCITT Recommendation P53.)
2 1 See the International Radio Consultative Committee (CCIR), Recommendations and Reports of the CCIR, 1978, Vol. X, pp. 162-163.
(CCIR recommendation 409-3.)
3, See the Bell System Technical Reference 41009, May 1975.
'I See Dolby Laboratories Inc., Engineering Field Bulletin No. 19/4.
~
4-15
Performance Tests
Model 8903E
PERFORMANCE TESTS
I
Characteristic
“A” Weighting Filter (Option 015 or 055)
Deviation from Ideal Response15)
I
Performance Limits
fO.l dB
f0.5dB
fl dB
I
Conditions
20 to 55’, 80% relative humidity
1 kHz
20 Hz to 10 kHz
10 to 20 kHz
~~
DESCRIPTION:
The output of the Distortion Analyzer is connected to the input. At various frequencies, the ac level of the
output is measured with the audio filters in and out. The ratio of the two levels is the frequency response of
the filter at that frequency.
EQUIPMENT:
Audio Synthesizer .....................................
H P 3336C
Controller with HP-IB ............................
HP 85B Opt 007
PROCEDURE:
NOTE
The Distortion Analyzer’s HP-IB addrcss is assiimcd to he 728. All HP-IB commands
are given in BASIC.
1. Connect the HP-IB controller to the Distortion Analyzer. Key in and execute the following command:
OUTPUT 728;“41.OSP LO”
to initialize the instrument and set the 80 kHz LOW PASS FILTER off.
2. Set the Distortion Analyzer’s INPUT switch to ground. Connect the audio synthesizer to the Distortion
Analyzer’s INPUT. Press the LCL key then set LOG/LIN to LOG.
3. Set the audio synthesizer’s level to 2V into an open circuit and set its frequency as indicated below. For
each setting, perform the following procedure:
a. Set all filters OK Set RATIO off
b. Set RATIO on. Set in the filter as indicated below.
b. Note the dB ratio. If it is not between -3.01 and -2.99 dB, increment or decrement the audio
synthesizer’s frequency slightly until the indicated level is correct. The displayed frequency should
be within the limits indicated.
4-16
Model 8903E
Performance Tests
PERFORMANCE TESTS
initial SOURCE
Frequency
Setting (Hz)
High- Pass
or Low-Pass
Filter
400'
30 000
80 000
400 Hz HP
30 kHz LP
80 kHz LP
Frequency Limits (Hz)
Minimum
360
28 000
Actual
Maximum
440
32 000
84 000
76 000
4. Key in and execute the following command on the controller:
OUTPUT 728;"48.1SP"
to enable up-ranging of the output gain. Press LCL. Set the audio synthesizer's frequency as indicated
below in the table appropriate for the installed weighting filter. For each setting, perform the following
procedure:
a. Set all filters off. Set RATIO off.
b. Set RATIO on. Select the appropriate weighting filter. The displayed ratio should be within the limits
indicated.
Tahk for CCITT Weighting Filter (Option 011 or 051)
Frequency
(Hz)
50
100
200
300
500
800
1000
2000
3000
3500
5000
Ratio Limits (d
Minimum
-65.0
-43.0
-23.0
-11.6
-4.6
-0.2
0.0
-4.0
-6.6
-1 0.5
-39.0
Actual
Maximum
-61 .o
-39.0
-19.0
-9.6
-2.6
+0.2
+2.0
-2.0
-4.6
-6.5
-33.0
4-17
Model 8903E
Performance Tests
PERFORMANCE TESTS
Table for CCIR Weighting Filtcr (Option 012 or 052)
SOURCE
Frequency
IHzI
31.5
63
1 00
200
400
800
1 000
2 000
3 150
4 000
5 000
6 300
7 100
8 000
9 000
10 000
12 500
14 000
16 000
20 000
31 500
4-18
Ratio Limits (dB)
Minimum
-30.9
-24.9
-20.8
-14.3
-8.3
-2.4
-0.5
+5.1
+8.5
+10.0
+11.2
+12.1
+11.8
+11.0
+9.7
+7.7
-1 .o
-6.3
-1 2.7
-23.2
44.7
Actual
Maximum
-22.9
-1 8.8
-1 3.3
-7.3
-1.4
+0.5
+6.1
+9.5
+11.0
+12.2
+12.3
+12.2
+11.8
+10.5
+8.5
+1 .o
4.3
-1 0.7
-21.2
40.7
Model 8903E
Performance Tests
PERFORMANCE TESTS
Tablefor C-Message Wtighting Filter (Option 013 or 053)
SOURCE
Frequency
(Hz)
60
100
200
300
400
500
600
700
800
900
1000
1200
1300
1500
1800
2000
2500
2800
3000
3300
3500
4000
4500
5000
Ratio Limits (dB)
Minimum
-56.7
43.5
-26.0
-17.5
-1 2.4
-8.5
-5.7
-3.7
-2.5
-1.6
-0.1
-1.2
-1.5
-2.0
-2.3
-2.3
-2.4
-2.9
-3.5
-6.2
-8.6
-15.5
-22.5
-29.5
Actual
Maximum
-54.7
41.5
-24.0
-15.5
-1 0.4
-6.5
-3.7
-1.7
-0.5
+0.4
+0.1
+0.8
+0.5
0.0
-0.3
-0.3
-0.4
-0.9
-1.5
4.2
-6.6
-13.5
-20.5
-27.5
4-19
Model 8903E
Performance Tests
PERFORMANCE TESTS
Table for CCIR/ARM Wtighting Filter (Option 014 or 054)
SOURCE
Frequency
(W
31.5
63
100
200
400
800
1 000
2 000
3 150
4 000
5 000
6 300
7 100
8 000
9 000
10 000
12 500
14 000
16 000
20 000
31 500
4-20
Ratio Limits ((
~
~~
Minimum
-36.5
-30.5
-26.4
-1 9.9
-13.9
-8.0
-6.1
-0.5
+2.9
+4.4
+5.6
+6.5
+6.2
+5.4
+4.1
+2.1
-6.6
-11.9
-1 8.3
-28.8
-50.3
Actual
Maximu m
-34.5
-28.5
-24.4
-1 8.9
-12.9
-7.0
-5.1
+0.5
+3.9
+5.4
+6.6
+6.7
+6.6
+6.2
+4.9
+2.9
4.6
-9.9
-1 6.3
-26.8
-46.3
Model 8903E
Performance Tests
PERFORMANCE TESTS
SOURCE
Frequency
(Hz)
Ratio Limits (dB)
Minimum
20
25
31.5
40
50
63
80
100
125
160
200
250
31 5
400
500
630
800
1 000
1 250
1 600
2 000
2 500
3 150
4 000
5 000
6 300
8 000
10 000
12 500
16 000
20 000
I
-51 .O
-45.2
-39.9
-35.1
-30.7
-26.7
-23.0
-1 9.6
-1 6.6
-1 3.9
-11.5
-9.1
-7.1
-5.3
-3.7
-2.4
-1.3
-0.1
+0.1
+0.5
+0.7
+0.8
+0.7
+0.5
0.0
-0.6
-1.6
-3.0
-5.3
-7.6
-1 0.3
Actual
Maximum
-50.0
-44.2
-38.9
-34.1
-29.7
-25.7
-22.0
-1 8.6
-15.6
-12.9
-1 0.5
-8.1
-6.1
4.3
-2.7
-1.4
-0.3
+0.1
+1.1
+1.5
+1.7
+1.8
+1.7
+1.5
+1 .o
+0.4
-0.6
-2.0
-3.3
-5.6
-8.3
4-2 1
Performance Tests
Model 8903E
PERFORMANCE TESTS
4-12. INPUT IMPEDANCE PERFORMANCE TEST
SPECIFICATION:
I
Characteristic
I
Performance Limits
I
Conditions
I
GENERAL
I
Input Impedance
I
I
1OOkn *lo/o
Except dc level mode
1
DESCRIPTION:
An audio oscillator is connected to the Distortion Analyzer’s input, and a ratio reference is set. A known
impedance is then added in series with the input. The drop in level is a measure of the output or input
impedance. The test is repeated with the audio oscillator connected to the analyzer’s (ungrounded) outer
conductor.
NOTE
A n arrangcmcnt of !wo BNC-to-clip fead adapters (such as HP 8120-1292) and a makclo-malt>BNC adapfer (sirch as H P 1250-0216) provide a convenient way to insert f h e
series resistor wifhoirf sf ripping cables or soldering leads.
EQUIPMENT:
Audio Oscillator.. .........................
HP 8903B or HP 3336C
Dual Banana to BNC Adapter .........................
H P 101 10B
Dual Banana to BNC Adapter .......................
HP 1251-2277
Resistor, lOOkn .....................................
HP 0698-7497
PROCEDURE:
1. Switch the Distortion Analyzer off, then back on to initialize it. Set the INPUT switch to ground.
2. Set the audio oscillator to 3 Vrms at 100 Hz. Connect the audio oscillator’s output to the Distortion
Analyzer’s INPUT. Press RATIO.
3. Insert the lOOkn resistor in series with the center conductor of the audio oscillator’s output. The right
display should read between 49.90 and 50.40% if the audio oscillator has 600n output impedance, or
between 49.00 and 5 1.00% if the audio oscillator has 50n output impedance.
Display with 6000 Impedance: 49.90
Display with 50n Impedance: 49.00
50.40°/o
5 1.OO%
4. On the Distortion Analyzer, set the INPUT switch to FLOAT.
5. Connect the equipment as shown in Figure 4-4. Note how the cable connects to the Distortion Analyzer’s
input through the two adapters. The adapters reverse the outer and inner conductor connections to the
cable.
4-22
Model 8903E
Performance Tests
PERFORMANCE TESTS
8903E
DISTORTION ANALYZER
AUD IO
OSCILLATOR
(NOTE THE
ORIENTATION
OF THE QROUND
TERMINAL.)
1
QROUND INDICATOR
Figirrc 4-4. Inpirf Irnpcdancc Test Setiip
6. Press RATIO twice to establish a new reference.
7. Insert the lOOk0 resistor in series with the inner conductor of the audio oscillator’s output. The right
display should read between 49.90 and 50.40% if the audio oscillator has 6000 output impedance or
between 49.00 and 51.00% if the audio oscillator has 500 output impedance.
Display with 6000 Impedance: 49.90
Display with 500 Impedance: 49.00
50.40%
5 1.OO~/o
4-23
Model 8903E
Performance Tests
PERFORMANCE TESTS
4-13. COMMON-MODE REJECTION RATIO PERFORMANCE TEST
SPECIFICATION:
I
Characteristic
I
I
I
Performance Limits
Conditions
I
GENERAL
Common Mode Rejection
Ratio
I
I
>60 dB
Differential input
>50 dB
Differential input >2V;
I
>40 dB
<2V; 20
20
to 1000 Hz
to 1000 Hz
1 to 20 kHz
DESCRIPTION:
The output from an external audio oscillator is connected to both inner and outer conductors of the Distortion
Analyzer's input connector. The outer conductor is set t o float. The ac level of the common-mode input is
then measured for two different input ranges.
EQUIPMENT:
Audio Oscillator., .........................
HP 8903B or HP 3336C
Controller with HP-IB ............................
HP 85B Opt 007
Dual Banana to BNC Adapter .........................
HP lOllOB
8903E
DISTORTION ANALYZER
I
i
OUTPUT
I
1
AUDIO
OSCILLATOR
AUDIO
SOURCE
OUTPUT
CABLE
8903E INPUT
BNC CONNECTOR
&
GROUND
TERMINAL
BIND I NG
POST
\
BRA I OED
i
STANDARD
BNC MALE
OUTER
CONDUCTOR
Figiirti 4-5. Common-Mode Rqiection Ratio Tcw St>(icp
PROCEDURE
NOTE
The Distortion Analyzer's HP-IB addrtw is assitmcd to be 728. AN HP-113 commands
are given in BASIC.
1. Connect the HP-IB controller to the Distortion Analyzer. Key in and execute the following command:
OUTPUT 728; "41.OSP"
to initialize the instrument. Set the Distortion Analyzer's INPUT switch to FLOAT.
4-24
Model 8903E
Performance Tests
PERFORMANCE TESTS
2. Set the audio oscillator to 1V at 20 Hz.The output impedance of the oscillator should be 600n.
3. Connect the equipment as shown in Figure 4-5. Note the use of the dual-banana-to-BNC adapters to tie
the inner and outer conductors of the input connector together.
NOTE
dt>siripd,the connections can also he ma& using a variely of' adapkrs and jiimper
cables in place of the stripped RF coaxial cahltp.
Controller
Commands
OUTPUT 728;
"1.12SP"
"1.1SP"
Oscillator
Frequency
(Hz)
20
1 000
20 000
20 000
1 000
20
AC Level Limits (mV)
Actual
Maximum
1.o
1.o
10.0
10.0
3.2
3.2
4-25
Model 89033
Performance Tests
Table 4-1. Performance Test Record (1 of 10)
Hewlett-Packard Company
Model 8903E
Audio Analyzer
Tested by:
Serial Number
Date
-
Results
Para.
No.
Test Description
4-6.
AC LEVEL ACCURACY PERFORMANCE TEST
__
Minimum
Maximum
High-level, High-Input AC level Accuracy
Controller
Commands
OUTPUT 728;
(SP)
AC Calibrator
level
(Vrms)
Frequency
(Hz)
1.1
300
20
2 000
20 000
100 000
1.2
150
100 000
20 000
2 000
20
1.3
100
20
2 000
20 000
100 000
1.4
70
100 000
20 000
2 000
20
1.5
45
20
2 000
20 000
1.6
30
1.7
15
100 000
100 000
20 000
2 000
20
20
2 000
20 000
100 000
4-26
Actual
1.8
10
100 000
20 000
2 000
20
1.9
7
20
2 000
20 000
100 000
1.10
4.5
100 000
20 000
2 000
20
98%
98%
98%
96%
102%
102%
102%
104%
98%
98%
98%
96%
102%
102%
102%
104%
98%
98%
98%
96%
102%
102%
102%
104%
98%
98%
98%
96%
102%
102%
102%
104%
98%
98%
98%
96%
102%
102%
102%
104%
96%
98%
98%
98%
104%
102%
102%
102%
96%
98%
98%
98%
104%
102%
102%
102%
96%
98%
98%
98%
104%
102%
102%
102%
96%
98%
98%
98%
104%
102%
102%
102%
96%
98%
98%
98%
104%
102%
102%
102%
Model 89033
Performance Tests
Table 4-1. Performance Test Record (2 of 10)
Para.
No.
4-6.
(Cont’d)
Results
Test Description
Minimum
Actual
Maximum
AC LEVEL ACCURACY PERFORMANCE TEST (Cont‘d)
Hiah-Level, Hi! .Input AC Level Accuracy (Cont’d)
Controller
Commands
OUTPUT 728;
(SP)
AC Calibrator
Level
(Vrms)
Frequency
(Hz)
1.11
3.0
20
2 000
20 000
100 000
1.12
1.5
100 000
20 000
2 000
20
1.13
1.o
20
2 000
20 000
100 000
1.14
0.7
100 000
20 000
2 000
20
1.15
0.45
20
2 000
20 000
100 000
1.16
0.30
100 000
20 000
2 000
20
1.17
0.15
1.18
0.10
100 000
20 000
2 000
20
1.19
0.07
20
2 000
20 000
100 000
0.007
100 000
20 000
2 000
20
20
2 000
20 000
100 000
98%
98%
98%
96%
102%
102%
102%
104%
98%
98%
98%
96%
102%
102%
102%
104%
98%
98%
98%
96%
102%
102%
102%
104%
98%
98%
98%
96%
102%
102%
102%
104%
98%
98%
98%
96%
102%
102%
102%
104%
96%
98%
98%
98%
104%
102%
102%
102%
96%
98%
98%
98%
104%
102%
102%
102%
96%
98%
98%
98%
104%
102%
102%
102%
96%
98%
98%
98%
104%
102%
102%
102%
96%
98%
98%
98%
104%
102%
102%
102%
4-27
Model 89033
Performance Tests
Table 4-1. Performance Test Record (3 of 10)
Para.
Results
No.
Test Description
4-6.
Cont'd.
AC LEVEL ACCURACY PERFORMANCE TEST ICont'dl
Minimum
Maximum
High-Leve Low-Input AC Level Accuracy
Controller
Commands
OUTPUT 728;
(SP)
AC Calibrator
Level
(Vrms)
1.6
30
1.7
15
1.a
10
1.9
7
1.10
4.5
1.11
3.0
1.12
1.5
1.13
1.o
1.14
0.7
1.15
0.45
Frequency
(Hz)
100 000
20 000
2 000
20
20
2 000
20 000
100 000
100 000
20 000
2 000
20
20
2 000
20 000
100 000
100 000
20 000
2 000
20
20
2 000
20 000
100 000
100 000
20 000
2 000
20
20
2 000
20 000
100 000
96%
98%
98%
98%
98%
98%
98%
96%
96%
98%
98%
98%
102%
102%
102%
104%
104%
102%
102%
102%
102%
102%
102%
104%
96%
98%
98%
98%
104%
98%
98%
98%
96%
102%
102%
102%
96%
98%
98%
98%
98%
98%
98%
96%
96%
98%
98%
98%
20
2 000
20 000
98%
98%
98%
96%
20
104%
102%
102%
102%
98%
98%
98%
96%
100 000
20 000
2 000
100 000
4-28
Actual
102%
102%
102%
104%
104%
1 02%
102%
102%
1 02%
102%
102%
104%
104%
102%
1 02%
102%
102%
102%
102%
104%
Model 89033
Performance Tests
Table 4-1. Performance Test Record (4 of 10)
Results
Test Description
Minimum
Actual
Maximum
AC LEVEL ACCURACY PERFORMANCE TEST (Cont'dl
High-level, low-Input AC Level Accuracy (Cont'd)
Controller
Commands
OUTPUT 728;
(SP)
AC Calibrator
level
(Vrms)
0.30
1.16
0.15
1.17
1.18
0.1 0
1.19
0.07
0.007
Frequency
(Hz)
100 000
20 000
2 000
96%
98%
98%
98%
104%
102%
20
2 000
20 000
98%
98%
98%
96%
102%
102%
100 000
20 000
2 000
20
96%
98%
98%
98%
20
100 000
20
2 000
20 000
100 000
100 000
20 000
2 000
20
98%
98%
98%
96%
96%
98%
98%
98%
102%
102%
102%
104%
104%
102%
102%
102%
102%
102%
102%
104%
104%
102%
102%
102%
Displayed
Reading of
Step b (O/O)
Synthesizer
Frequency
(Hz)
AC level Accuracy
Low-level, low-lnp
96%
96%
96%
96%
20
2 000
20 000
100 000
I
low-Level, High-Input AC Level Accuracy
100 000
20 000
2 000
20
96%
96%
96%
96%
4-29
Model 89033
Performance Tests
Table 4-1. Performance Test Record (5 of 10)
Results
Test Description
I-b-7.I-
Minimum
Actual
Maximum
DC LEVEL ACCURACY PERFORMANCE TEST
High-Input DC-Level Accuracy
I
DC Standard Voltage
300 Vdc
30 Vdc
3 Vdc
0.4 Vdc
0.04 Vdc
297.75 Vdc
29.775 Vdc
2.9775 Vdc
0.397 Vdc
0.037 Vdc
302.25 Vdc
30.225 Vdc
3.0225 Vdc
0.403 Vdc
0.043 Vdc
0.054 Vdc
0.594 Vdc
2.9775 Vdc
29.775 Vdc
297.75 Vdc
0.043 Vdc
0.403 Vdc
3.0225 Vdc
30.225 Vdc
302.25 Vdc
~~
Low-Input DC-Level Accuracy
I
DC Standard Voltage
0.04 Vdc
0.4 Vdc
3 Vdc
30 Vdc
300 Vdc
1
4-8.
DISTORTION AND NOISE PERFORMANCE TEST
Audio Oscillator
LOW
PASS
FILTER
Frequency
(Hz)
20
1 000
1 000
1 000
1
000
20 000
50 000
50 000
100 000
100 000
100 000
4-30
3.0
3.0
2.5
1.9
0.3
3.0
3.0
0.3
3.0
2.5
1.9
80 kHz
80 kHz
80 kHz
80 kHz
80 kHz
80 kHz
Off
Off
Off
Off
Off
0.01~/0
0.01 %
0.01%
0.01 Yo
0.01Yo
0.01Yo
0.03%
0.03%
0.04%
0.04%
0.04%
Model 89033
Performance Tests
Table 4-1. Performance Test Record (6 of 10)
Para.
Results
Test Description
No.
-
Minimum
Actual
Maximum
4-9.
Second Oscillator
Frequency
(Hz)
Atten
(dB)
Readings in step 3
~
50
50
10
80
Low-Distortion
Oscillator
Frequency
(Hz)
25
25
-1 1.4 dB
-81.0 dB
-9.4 d B
-79.0 dB
10
20
30
40
50
60
70
2 000
2 000
2 000
2 000
2 000
2 000
2 000
2 000
-1 1.4 dB
-21.0 dB
-31.0 dB
-41.0 dB
-51.0 dB
-61.0 dB
-71.0 d B
-81.0 dB
-9.4 dB
-19.0 dB
-29.0 dB
-39.0 dB
-49.0 dB
-59.0 dB
-69.0 dB
-79.0 dB
6 000
6 000
80
10
2 000
2 000
-81.0 dB
-1 1.4 dB
-79.0 dB
-9.4 d B
8 000
8 000
10
80
2 000
2 000
-11.4 dB
-81.0 dB
-9.4 dB
-79.0 d B
10 000
10 000
80
10
2 000
2 000
-1 1.4 dB
-81.0 dB
-79.0 dB
-9.4 d B
40 000
40 000
10
80
20 000
20 000
-1 1.4 dB
-81.0 dB
-9.4 dB
-79.0 dB
4 000
4 000
4 000
4 000
4 000
4 000
4 000
4 000
80
Readings in step 4
200 000
200 000
10
60
100 000
100 000
-12.4 dB
-62.0 dB
-8.4 dB
-58.0 d B
300 000
300 000
60
100 000
100 000
-62.0 dB
-12.4 dB
-58.0 d B
-8.4 dB
10
4-31
Model 89033
Performance Tests
Table 4-1. Performance Test Record (7 of 10)
Para.
No.
4-10.
Results
Test Description
Minimum
Actual
Maximum
FREQUENCY ACCURACY AND SENSITIVITY
PERFORMANCE TEST
MEASUREMENT
Mode
AC LEVEL
DlSTN
DlSTN
AC LEVEL
AC LEVEL
4-11.
99 900
99 900
150 00
19.99
19.99
99 895
99 895
149 980
20.01
20.01
99 905
99 905
150 020
AUDIO FILTERS PERFORMANCE TEST
Initial SOURCE
Frequency Setting (Hz)
Filter
400'
30 000
80 000
400 Hz HP
30 kHz LP
80 kHz LP
'Option 010
360 Hz
28 000 Hz
76 000 Hz
440 Hz
32 000 Hz
84 000 Hz
-65.0 dB
-43.0 dB
-23.0 dB
-1 1.6 dB
-4.6 dB
-0.2 dB
0.0 dB
-4.0 dB
-6.6 d B
-10.5 dB
-39.0 dB
-61.0 dB
-39.0 dB
-19.0 dB
-9.6 dB
-2.6 dB
+0.2 dB
+2.0 dB
-2.0 dB
-4.6 dB
-6.5 dB
-33.0 dB
-30.9 dB
-24.9 dB
-20.8 d B
-14.3 d B
-8.3 d B
-2.4 dB
-0.5 dB
+5.1 d B
+8.5 dB
-28.9 dB
-22.9 dB
-18.8 d B
-13.3 dB
-7.3 dB
-1.4 dB
+0.5 dB
+6.1 dB
+9.5 dB
or 050
SOURCE Frequency (Hz)
CClTT Weighting Filter (Option 011 or 051)
50
100
200
300
500
800
1 000
2 000
3 000
3 500
5 000
CClR Weighting Filter (Option 012 or 052)
31.5
63
100
200
400
800
1000
2 000
3 150
4-32
Model 89033
Para.
No.
4-11
Cont'd)
Performance Tests
Table 4-1. Performance Test Record (8 of 10)
Test Description
Results
Minimum
Actual
Maximum
AUDIO FILTERS PERFORMANCE TEST (Cont'd)
CClR Weighting Filter (Option 012 or 052) (Cont'd)
4 000
5 000
6 300
7 100
8 000
9 000
10 000
12 500
14 000
16 000
20 000
31 500
+10.0
+11.2
+12.1
+11.8
+11.0
+9.7
+7.7
-1.0
-6.3
-12.7
-23.2
-44.7
dB
dB
dB
dB
dB
dB
dB
dB
dB
dB
dB
dB
+11 .O
+12.2
+12.3
+12.2
+11.8
+10.5
+8.5
+1.0
-4.3
-10.7
-21.2
-40.7
dB
dB
dB
dB
dB
dB
dB
dB
dB
dB
dB
dB
-56.7
-43.5
-26.0
-17.5
-12.4
-8.5
-5.7
-3.7
-2.5
-1.6
-0.1
-1.2
-1.5
-2.0
-2.3
-2.3
-2.4
-2.9
-3.5
-6.2
-54.7
-41.5
-24.0
-15.5
-10.4
-6.5
-3.7
-1.7
-0.5
+0.4
+0.1
-15.5
-22.5
-29.5
dB
dB
dB
dB
dB
dB
dB
dB
dB
dB
dB
dB
dB
dB
dB
dB
dB
dB
dB
dB
dB
dB
dB
dB
-0.3
-0.3
-0.4
-0.9
-1.5
-4.2
-6.6
-13.5
-20.5
-27.5
dB
dB
dB
dB
dB
dB
dB
dB
dB
dB
dB
dB
dB
dB
dB
dB
dB
dB
dB
dB
dB
dB
dB
dB
-36.5
-30.5
-26.4
-19.9
-13.9
-8.0
-6.1
dB
dB
dB
dB
dB
dB
dB
-34.5
-28.5
-24.4
-18.9
-12.9
-7.0
-5.1
dB
dB
dB
dB
dB
dB
dB
C-Message Weighting Filter (Option 013 or 053)
60
100
200
300
400
500
600
700
800
900
1 000
1 200
1 300
1 500
1 800
2 000
2 500
2 800
3 000
3 300
3 500
4 000
4 500
5 000
-8.6
+0.8
+0.5
0.0
CCIR/ARM Weighting Filter (Option 014 or 054)
31.5
63
100
200
400
-
800
1 000
I
4-33
Model 89033
Performance Tests
Table 4-1. Performance Test Record (9 of 10)
Para.
No.
4-11
(Cont‘d)
Results
Test Description
AUDIO FILTERS PERFORMANCE TEST (Cont’d)
Minimum
Actual
Maximum
~~~
SOURCE Frequency (Hz) (Cont’d)
CCIR/ARM Weighting Filter (Option 014
or 054) (Cont’d)
2 000
3 150
4 000
5 000
6 300
7 100
8 000
9 000
10 000
12500
14 000
16 000
20 000
31 500
dB
dB
dB
dB
dB
dB
dB
dB
dB
dB
dB
dB
dB
dB
+0.5 dB
+3.9 dB
+5.4 dB
+6.6 dB
+6.7 dB
+6.6 dB
+6.2 dB
C4.9 dB
+2.9 dB
-4.6 dB
-9.9 dB
-16.3 dB
-26.8 dB
-46.3 dB
-51.0 dB
-45.2 dB
-39.9 dB
-35.1 dB
-30.7 dB
-26.7 dB
-23.0 dB
-19.6 dB
-16.6 dB
-13.9 dB
-11.5 dB
-9.1 dB
-7.1 dB
-5.3 dB
-3.7 dB
-2.4 dB
-1.3 dB
-0.1 dB
+0.1 dB
+0.5 dB
+0.7 dB
+0.8 dB
+0.7 dB
+0.5 dB
0.0 dB
-0.6 dB
-1.6 dB
-3.0 dB
-5.3 dB
-7.6 dB
-10.3 dB
-50.0 dB
-44.2 dB
-38.9 dB
-34.1 dB
-29.7 dB
-25.7 dB
-22.0 dB
-18.6 dB
-15.6 dB
-12.9 dB
-10.5 dB
-8.1 dB
-6.1 dB
-4.3 dB
-2.7 dB
-1.4 dB
-0.3 dB
+0.1 dB
+1.1 dB
+1.5 dB
+1.7 dB
+1.8 dB
+1.7 dB
t1.5 dB
+1.0 dB
+0.4 dB
-0.6 dB
-2.0 dB
-3.3 dB
-5.6 dB
-8.3 dB
-0.5
+2.9
+4.4
+5.6
+6.5
+6.2
+5.4
+4.1
+2.1
-6.6
-11.9
-18.3
-28.8
-50.3
“A” Weighting Filter (Option 015 or 055)
20
25
31.5
40
50
63
80
100
125
160
200
250
315
400
500
630
800
1 000
1 250
1 600
2 000
2 500
3 150
4 000
5 000
6 300
8 000
10 000
12 500
16 000
20 000
4-34
Model 89033
Para.
No.
4-12.
Performance Tests
+
Table 4-1. Performance Test Record (10 of 10)
I
I
Test Description
Minimum
INPUT IMPEDANCE
PERFORMANCE TEST
High Input
Low Input
4-13.
49.00%
49.OO%
COMMON-MODE REJECTION RATIO
PERFORMANCE TEST
Controller Commands
OUTPUT 728;
Actual
Maximum
51 .OO%
51.00%
\
Oscillator Frequency
(SP)
(Hz)
1.12
20
1.1
Results
1mV
1 000
20 000
1 mV
10.0 mV
20 000
10.0 mV
3.2 mV
3.2 mV
1 000
20
4-35
Model 8903E
Adjustments
Section 5
ADJUSTMENTS
5-1. INTRODUCTION
This section contains adjustments and checks that assure peak performance o f the Distortion Analyzer. The
instrument should be readjusted after repair or failure to pass a performance test. Allow a 30 minute warm-up
prior to performing the adjustments. Removing the instrument top cover and the internal shield cover is the
only disassembly required for all adjustments.
To determine which performance tests and adjustments to perform after a repair, refer to paragraph 5-5,
Post -Repa ir Tesf s, A dji rst men 1s. and Chwks.
5-2. SAFETY CONSIDERATIONS
This section contains information, cautions, and warnings which must be followed for your protection and to
avoid damage to the equipment.
A djiistments describt.d in this stciion arc pcvjhrmcd wifhpower siipplicd lo fhc insfnimcwt
and with proftcfivc c0vcv-s rcvnowd. Mainfcnancc shoirld he pcv-formcd only by stv-vicc
fraincd pcrsonncl who arc a warc of thc hazard involwd Cfor cxampk, jirc and dccfrical
shock). W h c w maintenance can be perjormtid withoirf powc’r applicd. the powcr shoirld
he rcmoved.
5-3. EQUIPMENT REQUIRED
Most adjustment procedures contain a list of required test equipment. The test equipment is also identified by
callouts in the test setup diagrams, where included.
If substitutions must be made for the specified test equipment, refer to Table 1-3 in Section 1 o f this manual
for the minimum specifications. It is important that the test equipment meet the critical specifications listed in
the table if the Distortion Analyzer is to meet its performance requirements.
5-4. FACTORY-SELECTED COMPONENTS
Factory-selected components are identified o n the schematics and parts list by a n asterisk (*) which follows
the reference designator. The normal value or range of the components is shown. The Manual Changes supplement will provide updated information pertaining to the selected components. Table 5- 1 lists the reference
designator, the criteria used for selecting a particular value, the normal value range and the service sheet where
the component part is shown.
5-5. POST-REPAIR TESTS, ADJUSTMENTS, AND CHECKS
Table 5-2 lists the performance tests, adjustments and checks needed to calibrate or verify calibration of a
repaired assembly. The tests, adjustments and checks are classified by assembly repaired.
The table is also useful as a cross reference between performance tests and assemblies when the failure is a
specification that is slightly out of limits.
After all repairs, perform the Basic Fiinc-[ionul Cheeks (paragraph 3- 10) and the Inltv-nal R&rcnt.t> Freqircncy
A djirslment (paragraph 5-7). The Basic Functional Checks utilize automatic tuning and measurements which
exercise nearly every circuit in the instrument (except the Remote Inteface Assembly).
5- 1
Adjustments
Model
8903E
5-6. RELATED ADJUSTMENTS
T h e procedures in this section can be done in any order, but i t is advisable to check the time base reference
first.
Tuhk 5- I . Factory Sdccltd Components
1
Range of
Values
43 to 56 pF
Basis of
Selection
See Input Flatness Adjustment (paragraph 5-8).
A2C9 and A2C102
1
6.2 to 7.5 pF
See Input Flatness Adjustment (paragraph 5-8).
A4R143 and A4R144
6
147 kR to infinity
See Voltmeter Adjustment (paragraph 5-13 or 14).
Reference
Designator
A2C4 and A2C89
Service
Sheet
Assembly Repaired
A1 Keyboard and Display Assembly
A2 Input Amplifier Assembly
I
A3 Notch Filter Assembly
A4 Output Amplifier/Voltmeter
Assembly
A7 Latch Assembly
A8 Controller/Counter Assembly
Test, Adjustment, or Check
Power-Up Checks
Service Special Functions (Use 60.0 SPCL, Key Scan, and
exercise all keys.)
AC Level Accuracy Performance Test
DC Level Accuracy Performance Test
Distortion and Noise Performance Test
Audio Filters Performance Test
Common-Mode Rejection Ratio Performance Test
Input Flatness Adjustment
Common-Mode Rejection Adjustment
400 Hz High-Pass and Weighting Bandpass Filters Adjustment
Distortion and Noise Performance Test
Notch Filter Tune and Balance Adjustment
AC Level Accuracy Performance Test
DC Level Accuracy Performance Test
Distortion and Noise Performance Test
Distortion and SINAD Accuracy Performance Test
Voltmeter Adjustment
Basic Functional Checks
Frequency Accuracy and Sensitivity Performance Test
Power-Up Checks
Basic Functional Checks
Frequency Accuracy and Sensitivity Performance Test
Internal Reference Frequency Adjustment
Power-Up Checks
HP-IB Functional Checks
Power-Up Checks
A9 Remote Interface Assembly
A10 Remote Interface Connector
Assembly
Basic Functional Checks
A1 1 Series Regulator Socket
Power-Up Checks
Assembly
A1 2 Connector/Filter Assembly
A13 Power Supply and Mother Board
Assembly
A14 Line Power Module
These paragraphs are found in the HP 89036 Service Manual.
I
5-2
Ref. Para.
8-27*
8-23'
I
4-6
4-7
4-8
4-11
4-1 3
5-8
5-9
5-1 1
4-8
5-1 2
4-6
4-7
4-8
4-9
5-13 or 14
3-1 0
4-1 0
8-27'
3-1 0
4-1 0
5-7
8-27*
3-1 1
8-27*
3-1 0
8-27*
I
I
I
Model 8903E
Adjustments
ADJUSTMENTS
5-7. INTERNAL REFERENCE FREQUENCY ADJUSTMENT
Reference:
Service Sheet 15.
Description:
An oscilloscope, triggered by an external reference, is used to monitor the internal reference frequency while
it is adjusted.
Equipment:
Frequency Standard ..............................
House Standard
Oscilloscope ..........................................
HP 1740A
r
E0
0
won
ODUD
-
0
0
VERTICAL
INPUT
0
0
O
EXTERNAL
TR I W E R
OUTPUT
FREQUENCY
STANDARD
Procedure:
1. Allow the equipment to warm up for 15 minutes.
2. Connect the equipment as shown in Figure 5-1. (The figure shows the setup for house-standard
frequencies of 2 MHz or lower. If the frequency of the frequency standard is 5 or 10 MHz, reverse
the vertical input and external trigger connections on the oscilloscope.)
3. Set the oscilloscope’s vertical sensitivity to view the Distortion Analyzer’s time base reference (or
the frequency standard output). Set the horizontal scale for 0.1 ps per division. Set the oscilloscope
to trigger externally.
4. Adjust A8C27 for a waveform movement of 10 divisions per second or less. A totally non-metallic
adjustment tool is recommended.
NOTE
A movemtwf oJ the wavcfbrm lo [he right (or lty? if tht. oscilloscope conntxYion.s arc
rtwrscu‘) a[ a rule of’ one division pcr second mt~ans[hat [he Dislorfion A nalyzcr’s lime
ha.se.frcqiiency is low hy 0.I ppm.
5-3
Adjustments
Model 8903E
ADJUSTMENTS
5-8. INPUT FLATNESS ADJUSTMENT
Reference:
Service Sheet 1.
Description:
An ac calibrator is connected to the input of the Distortion Analyzer. The Distortion Analyzer is set to measure
ac level. The frequency of the calibrator is varied between 1, 40, and 100 kHz and the flatness adjusted is for
a constant level at all three frequencies. The procedure is repeated for two other input ranges. The entire
procedure is run with the outer conductor of the input connector grounded, then with the inner conductor
grounded and the signal applied to the (ungrounded) outer conductor.
Voltages up to 60 Vrms will he applied to the Distortion Analyzer's inpiit connector and
will be prtwnt on thc assembly being adjrislcd. Do not extend tht. assembly or probe its
circiiilry whcn high volfagc is applied to tho inpiit.
Equipment:
AC Calibrator.. ........... HP 745A or Datron 4200 or Fluke 5200A
Dual Banana to BNC Adapter .........................
HP 10110B
Dual Banana to BNC Adapter .......................
HP 1251-2277
-
-INPUT
UDUU
Bo
0
0.
wan-0
OUTPUT
AC
CAL I BRAT I OR
Figlire 5-2. High-Input Flatntw Adjirsrmenl Test Set iip
Procedure:
High-Input Flatness Adjustment
1. Set the ac calibrator to 1 kHz at 4 Vrms.
2. Connect the equipment as shown in Figure 5-2.
3. Switch the Distortion Analyzer off, then back on to initialize it. Set the INPUT switch to ground.
Set LP FILTER off.
4. The right display of the Distortion Analyzer should read between 3.9 and 4.1V. Check that the input
is on range 10 by pressing S (Shift) NOTCH TUNE S (Shift) NOTCH TUNE. The first two digits of
the left display should be 10. Press AC LEVEL. Press RATIO.
5. Set the ac calibrator frequency to 40 kHz. Adjust A2C3 (HIGH 12 DB) for a reading on the right
display between 99.70 and 100.3Yo.
5-4
Model 8903E
Adjustments
ADJUSTMENTS
6. Set the ac calibrator frequency to 100 kHz. Adjust A2C3 for a reading between 99.50 and 100.5%.
Repeat steps 5 and 6 as often as needed until the flatness at 40 kHz and 100 kHz is within the limits
given.
NOTE
I f fheJla(ners cannof hc adjii.yft>d.so fhuf fhs 40 kHz and 100 k H t wadings art’ hofh
within fhc givcw limits, chungc A2C4 as jofbrlows: IJ’fhc100 kHz wading is higher fhan
af 40 kHz, dwrt>asrA2C4 by approximately 10%. l j f h e 40 kHz reading is highcr fhan
that af 100 kHt, incwasc>A2C4 hy approximafdy 10%.
7. On the Distortion Analyzer, press RATIO to turn it OK
8. Set the ac calibrator frequency to 1 kHz and level to 15 Vrms.
9. The right display of the Distortion Analyzer should read between 14.7 and 15.3V. Check that the
input is on range 7 by pressing S (Shift) NOTCH TUNE S (Shift) NOTCH TUNE. The first digit of
the left display should be 7. Press AC LEVEL. Press RATIO.
10. Set the ac calibrator frequency to 40 kHz. Adjust A2CIO (HIGH 24 DB) for a reading on the right
display between 99.70 and 100.3%.
11. Set the ac calibrator frequency to 100 kHz. Adjust A2C10 for a reading between 99.50 and 100.5%.
Repeat steps 10 and 11 as often as needed until the flatness at 40 kHz and 100 kHz is within the
limits given.
NOTE
U t h e jlatncss cannot hc adjiisted .so that the 40 kHz and 100 kHz reading.%arc both
within thc givcn limifs, changc A2C9 as./i~llows:
IJ’fhc100 kHz reading is highcv- rhan
a f 40 kHz, dt.c.reast>A2C9 by approximuldy 1090. I f f h e40 kHz wading is higher rhan
that at 100 kHz, incrcase A2C9 by approximafdy 10%.
12. On the Distortion Analyzer, press RATIO to turn it off,
13. Set the ac calibrator frequency to 1 kHz and level to 60 Vrms.
14. The right display of the Distortion Analyzer should read between 58.8 and 61.2V. Check that the
input is on range 4 by pressing S (Shift) NOTCH TUNE S (Shift) NOTCH TUNE. The first digit of
the left display should be 4. Press AC LEVEL. Press RATIO.
15. Set the ac calibrator frequency to 40 kHz. Adjust A2C109 (HIGH 40 DB) for a reading on the right
display between 99.70 and 100.3°/o.
16. Set the ac calibrator frequency to 100 kHz. Adjust A2C109 for a reading between 99.50 and 100.5%.
Repeat steps 15 and 16 as often as needed until the flatness at 40 kHz and 100 kHz is within the
limits given.
5-5
Adjustments
Model 8903E
ADJUSTMENTS
Low-Input Flatness Adjustment
17. Set the ac calibrator to 1 kHz at 4 Vrms.
18. On the Distortion Analyzer, set the INPUT switch to FLOAT.
19. Connect the equipment as shown in Figure 5-3. Note how the cable connects to the Distortion
Analyzer's input through the two adapters. The adapters reverse the outer and inner conductor
connections to the cable.
8903E
DISTORTION ANALYZER
Bo
.
(NOTE THE
ORIENTATION
OF THE QROUND
TERMINAL.)
QROUND INDICATOR
Figitre 5-3. Low-Input F l a l n m Adjitstment Te..rtSetirp
20. Switch the Distortion Analyzer off,then back on to initialize it. Set LP FILTER off.
21. The right display of the Distortion Analyzer should read between 3.9 and 4.1V. Check that the input
is o n range 10 by pressing S (Shift) NOTCH TUNE S (Shift) NOTCH TUNE. The first two digits of
the left display should be 10. Press AC LEVEL. Press RATIO.
22. Set the ac calibrator frequency to 40 kHz. Adjust A2C90 (LOW 12 DB) for a reading on the right
display between 99.70 and 100.3%.
23. Set the ac calibrator frequency to 100 kHz. Adjust A2C90 for a reading between 99.50 and 1O0So/o.
Repeat steps 22 and 23 as often as needed until the flatness at 40 kHz and 100 kHz is within the
limits given.
NOTE
If'the.flatness cannot he adjirsted .so that thc 40 kHz and 100 k H t readings arc both
within Ihe given limits, change AZCH9 as Jollow.~:Ijthe 100 kHz reading is higher than
at 40 kHz, det.rt.ase A2C89 hy approximaldy 10%. Il'thc 40 kHz reading is higher lhan
that at 100 kHz, increase AZC89 by approximately IOYO.
24. On the Distortion Analyzer, press RATIO to turn it off.
25. Set the ac calibrator frequency to 1 kHz and level to 15 Vrms.
26. The right display of the Distortion Analyzer should read between 14.7 and 15.3V. Check that the
input is on range 7 by pressing S (Shift) NOTCH TUNE S (Shift) NOTCH TUNE. The first digit of
the left display should be 7. Press AC LEVEL. Press RATIO.
27. Set the ac calibrator frequency to 40 kHz. Adjust A2C110 (HIGH 24 DB) for a reading o n the right
display between 99.70 and 100.3%.
5-6
Model 8903E
Adjustments
ADJUSTMENTS
28. Set the ac calibrator frequency to 100 kHz. Adjust A2C110 for a reading between 99.50 and 100.5%.
Repeat steps 27 and 28 as oflen as needed until the flatness at 40 kHz and 100 kHz is within the
limits given.
NOTE
If the flatness
cannot he adjirstrd so that the 40 kHz and 100 kHz readings are both
within the givcn limirs, changc A2C102 as follows: I f the 100 kHz reading is highcr than
at 40 kHz, decrease A2Cl02 by approximately 10%. Ifthc 40 kHz reading is highcr than
that at IO0 kHz, increase A 2CI 02 by approximattly 1OOb.
29. On the Distortion Analyzer, press RATIO to turn it off.
30. Set the ac calibrator frequency to 1 kHz and level to 60 Vrms.
31. The right display of the Distortion Analyzer should read between 58.8 and 61.2V. Check that the
input is on range 4 by pressing S (Shift) NOTCH TUNE S (Shift) NOTCH TUNE. The first digit of
the left display should be 4. Press AC LEVEL. Press RATIO.
32. Set the ac calibrator frequency to 40 kHz. Adjust A2C110 (HIGH 40 DB) for a reading on the right
display between 99.70 and 100.3%.
33. Set the ac calibrator frequency to 100 kHz. Adjust A2CI 10 for a reading between 99.50 and 100.5%.
Repeat steps 32 and 33 as often as needed until the flatness at 40 kHz and 100 kHz is within the
limits given.
34. Perform the A C Levd A ccirracy Pc.rfbrmanc.c. TtW (paragraph 4-6).
5-7
Adjustments
Model 8903E
ADJUSTMENTS
5-9. COMMON-MODE REJECTION ADJUSTMENT
Reference:
Service Sheet 1.
Description:
An audio oscillator, set to 1 Vrms at 1 kHz, is connected to both the high and low (that is, the inner and outer
conductor) inputs of the Distortion Analyzer. The low input. is set to float. The common-mode, ac level is then
adjusted for minimurn response.
Equipment:
Audio Oscillator.. .........................
HP 8903B or HP 3336C
Dual Banana to BNC Adapter .........................
HP 10110B
8903E
DISTORTION ANALYZER
OUTPUT
Bo
AUDIO
OSCILLATOR
8903E INPUT
BNC CONNECTOR
&
STANDARD
BNC MALE
GROUND
TERUI NAL
BINDING
POST
\
BRAIDED
OUTER
CONDUCTOR
Fig1I re 5-4. Common-Mode Rcjt’c*lionA dji 1sl m cnl Tti.TI StY I ip
Procedure:
1. Switch the Distortion Analyzer off, then back on to initialize it. Set the Distortion Analyzer’s INPUT
switch t o FLOAT.
2. Set the audio oscillator to 1V at 1 kHz. The output impedance of the oscillator should be GOOR.
3. Connect the equipment as shown in Figure 5-4. Note how the cable center conductor and shield
are connected to the Distortion Analyzer INPUT connector and ground terminal.
NOTE
4. Adjust A2R43 (CM) for the minimum level on the right display, but less than 0.2 mV
5. Perform the Common-Modc Rujcx*lion Ratio PcJrformanccTcsl (paragraph 4-13).
5-8
Model 8903E
Adjustments
ADJUSTMENTS
5-10. INPUT DC OFFSET ADJUSTMENT
Reference:
Service Sheet 1.
Description:
With the Distortion Analyzer set to measure d c level and the input grounded, the d c offset is adjusted for a
display of OV.
Equipment:
Feedthrough Termination, 6000
. . . . . . . . . . . . . . . . . . . . . . . HP
11095A
Procedure:
1. Switch the Distortion Analyzer off,then back on to initialize it. Set the INPUT switch to ground.
Set MEASUREMENT to DC LEVEL.
2. Connect the 600a feedthrough (or a short circuit or a 50fl load) to the INPUT.
3. Adjust A2R44 (OFFSET) for a steady reading of -0.OOV on the right display.
5-9
Adjustments
Model 8903E
ADJUSTMENTS
5-1 1. 400 HZ HIGH-PASS AND WEIGHTING BANDPASS FILTERS ADJUSTMENT
Reference:
Service Sheet 2, 2A, and 2B.
Description:
An audio oscillator is connected to the input of the Distortion Analyzer. The oscillator is set to a specified
frequency and a level reference is set. The filter to be adjusted is then inserted and its gain is adjusted for a
level equal to the reference.
Equipment:
Audio Oscillator.. . . . . . . . . . . . . . . . . . . . . . . . . . H P 8903B or HP 3336C
Procedure:
NOTE
In the following procedirrcs, the lefl-most filter circiiil board is designated A2A I and the
righl-most board A2A2. Thc board locafion corresponds lo option series 010 and 050
resptct i vely.
1. Switch the Distortion Analyzer off,then back on to initialize it. Set the INPUT switch to ground.
2. Set the audio oscillator amplitude to 1 Vrms and connect its output to the Distortion Analyzer’s
INPUT.
3. Perform the following steps for each filter installed.
400 Hz High-Pass Filter (Option 010 or 050)
a. Set the weighting filter off, if on.Set RATIO off. Set the audio oscillator’s frequency to 2
kHz. Set RAT10 on.
b. Press HIGH PASS 400 Hz. Adjust A2AlR6 or A2A2R6 (400 HZ) for a reading between
99.60 and 99.80% on the right display.
c. Set the audio oscillator’s frequency to 1 kHz. The right display should read between 99.00
and 101.0%.
CCITT Weighting Filter (Option 011 or 051)
a. Set HIGH PASS 400 Hz or weighting filter off if on. Set the audio oscillator’s frequency
to 800 Hz. Set RATIO off. Set RATIO on.
b. Press CCITT WEIGHTING. Adjust A2AlR4 or A2A2R4 (CCITT) for a steady reading of
100.0% on the right display.
CCIR Weighting Filter (Option 012 or 052)
a. Set HIGH PASS 400 Hz or weighting filter off if on. Set the audio oscillator’s frequency
to 6300 Hz. Set RATIO off.Set RATIO on.
b. Press CCIR WEIGHTING. Adjust A2AlR7 or A2A2R7 (CCIR) for a steady reading of
407.4Oh ( 12.20 dB) on the right displny.
5-10
Model 8903E
Adjustments
ADJUSTMENTS
C-Message Weighting Filter (Option 013 or 053)
a. Set HIGH PASS 400 Hz or weighting filter off if on. Set the audio oscillator's frequency
to 1 kHz. Set RATIO off. Set RATIO on.
b. Press C-M ESSAGE WEIGHTING. Adjust A2A 1 R6 or A2A2R6 (CMSG) for a steady read-
ing of 100.0% on the right display.
CCIR/ARM Weighting Filter (Option 014 or 054)
a. Set HIGH PASS 400 Hz or weighting filter off if on. Set the audio oscillator's frequency
to 6300 Hz. Set RATIO off. Set RATIO on.
b. Press CCIR/ARM WEIGHTING. Adjust A2AlR7 or A2A2R7 (CCIR) for a steady reading
of 213.8% (6.6 dB) on the right display.
"A" Weighting Filter (Option 015
or 055)
a. Set HIGH PASS 400 Hz or weighting filter off if on. Set the audio oscillator's frequency
to 1 kHz. Set RATIO off. Set RATIO on.
b. Press "A" WEIGHTING. Adjust A2AlR3 or A2A2R3 (A-WTD) for a steady reading of
100.Oo/o on the right display.
4. Perform the Audio Filkw Perjorrnance Tcsr (paragraph 4-1 1).
5-1 1
Model 8903E
Adjustments
ADJUSTMENTS
5-12. NOTCH FILTER TUNE AND BALANCE ADJUSTMENT
Reference:
Service Sheet 4.
Description:
The Distortion Analyzer is set to measure the distortion from a clean audio oscillator. The output from the
notch filter is observed on an oscilloscope while the tuning and balance are adjusted for a minimum. The
measured distortion is also monitored on the amplitude display.
Equipment:
Audio Oscillator.. ..........................
HP 8903B or HP 339A
Oscilloscope ..........................................
HP 1740A
rn
OSCILLOSCOPE
0
8903E
DISTORTION ANALYZER
EXTERNAL
0
0
TRIQGER
YON I TOR
iaiaC.0
B
o E%O
-
e
0
INPUT
1
I
OUTPUT
Figlire 5-5. Nofch F i k r Tune and Balancv A djitsfmenf Test Setup
Procedure:
1. Switch the Distortion Analyzer off, then back on to initialize it. Set the INPUT switch to FLOAT.
Set MEASUREMENT to DISTN. Set LOG LIN to LOG.
2. Set the audio oscillator to 2.8V at 1 kHz. Connect the equipment as shown in Figure 5-5.
3. Set the oscilloscope to view the ac signal at the MONITOR output. Set the oscilloscope’s trigger to
external.
4. Adjust A3R62 (TUNE OFFSET) and A3R63 (BAL OFFSET) for minimum signal and noise o n the
oscilloscope display.
5. Observe the right display of the Distortion Analyzer. It should read -90 dB or less. Readjust the two
adjustments t o minimize the reading on the display which must be -90 dB or less.
NOTE
I f thc wading of’step 5 cannot hc hroiight within limit, it may btl that thc soiirctj has
exccssivc distortion.
5-12
Model 8903E
Adjustments
ADJUSTMENTS
5-13. VOLTMETER ADJUSTMENT (USING AN HP-IB CONTROLLER)
Reference:
Service Sheets 6 and 7.
Description:
The Distortion Analyzer is set to measure the ac level from an audio oscillator. The internal ac-to-dc converter
(as yet uncalibrated) produces a dc voltage that is read by the internal dc voltmeter and monitored by an
external dc voltmeter. The sensitivity of the internal dc voltmeter is adjusted so that the amplitude display of
the Distortion Analyzer agrees with the level measured by the external dc voltmeter.
The ac level from the audio oscillator is then monitored by an external ac voltmeter. The ac-to-dc converter is
adjusted so that the amplitude display of the Distortion Analyzer agrees with the level measured by the external
ac voltmeter at two different levels. Since there are two ac-to-dc converters, one true-rms responding and one
average responding, two separate adjustments are made.
NOTE
If an HP-IB conlroller is no1 avuiluhk, iisc [he nexl udjirslmcnl procediire, Voltmeter
Adjustment (Not Requiring an HP-IB Controller).
Equipment:
Audio Oscillator.. ..........................
HP 89038 or HP 339A
Controller with HP-IB ............................
HP 85B Opt 007
Digital Voltmeter.. ....................................
HP 3455A
A4TP1
(Dc OUT)
lm,
ODD0
INPUT
owma-0
no
8903E
DISTORTION ANALYZER
-
AUD IO
OSCILLATOR
(STEP 3 )
1
OUTPUT
TEE
INPUT
,
D I G I TAL
VOLTMETER
I
Figirrc 5-6. Vollmcler A djirblmzn 1 Tcsl Sclirp
Procedure:
NOTE
Thc Distortion A nalyzrr's HP-IB addrcss is a.wrmc.a' lo hc>728. AN HP-IB commands
arc>given in BA SIC.
1. Connect the HP-IB controller to the Distortion Analyzer. Key in and execute the following commands:
OUTPUT 728; "41.OSP 1.11SP 3.1SP"
OUTPUT 728; "49.3SP"
Adjustments
Model 8903E
ADJUSTMENTS
to initialize the instrument, set the input range to 3V, set the post-notch amplifier gain to 0 dB, and read
the output rms detector voltage directly.
NOTE
The above commands shoirld not he concatcnated. A short waiting period hctwetw them
is needed. If thc HP-IB commands are to be piit into a program, insert a 200 ms wait
betwcvn /he two oirtpirt statements.
2. Set the Distortion Analyzer’s INPUT switch to ground.
3. Set the audio oscillator to 3V at 1 kHz. Connect the equipment as shown in Figure 5-6. Connect
the voltmeter to A4TP1 (DC OUT).
4. Set the voltmeter to read dc volts. Adjust A4R125 (DC CAL) for a reading on the right display of the
Distortion Analyzer that is the same as the reading on the voltmeter (within d~0.5mV). (See Service
Sheet 7.)
5. Connect the voltmeter to the INPUT of the Distortion Analyzer as shown in Figure 5-6. Set the
voltmeter to read ac volts. On the Distortion Analyzer, press the LCL key, then set the MEASUREMENT mode to AC LEVEL.
6. Adjust A4R91 (RMS SCALE) for a reading on the right display of the of the Distortion Analyzer
that is the same as the reading on the ac voltmeter (within & I mV). (See Service Sheet 6,)
7. Set the audio oscillator level to 150 mV. On the Distortion Analyzer adjust A4R85 (RMS OFFSET)
for a reading o n the right display that is the same as the ac reading on the ac voltmeter (within k0.5
mV). (See Service Sheet 6.) If A4R85 does not have sufficient range, add or alter A4R143 or A4R144
as follows:
a. Unsolder A4R143 or A4R144, if present.
b. With a dc voltmeter, measure the voltage at the junction of A4R72 and A4C46.
c. If the voltage (ignoring polarity) is greater than 2 mV, compute R= lSOO/V, where V is the
voltage measured (in volts).
d. Select a resistor which has a standard value resistance nearest R. If the measured voltage is
negative, solder the new resistor in the location for A4R143; if positive, replace A4R144.
e. After a five-minute warm up, measure the voltage again which should be between -2 and
+2 mVdc.
f. Repeat the adjustment of A4R85.
8. Set the audio oscillator’s level to 3V. Repeat steps 6 through 8 until the right display of the Distortion
Analyzer and the ac voltmeter readings are the same within the limits stated in steps 6 and 7 for both
3V and 150 mV.
9. On the Distortion Analyzer, press AVG to select the average-responding detector. Set the audio
oscillator’s level to 3V.
5-14
Adjustments
Model 8903E
ADJUSTMENTS
10. Adjust A4R93 (AVG SCALE) for a reading on the right display of the Distortion Analyzer that is the
same as the reading on the a c voltmeter (within zk 1 mV). (See Service Sheet 6 . )
11. Set the audio oscillator’s level to 150 mV. On the Distortion Analyzer, adjust A4R149 (AVG OFFSET)
for a reading on the right display that is the same as the reading o n the ac voltmeter (within * O S
mV). (See Service Sheet 6.)
12. Set AMPTD to 3V. Repeat steps 10 through 12 until the right display of the Distortion Analyzer and
the a c voltmeter are the same within the limits stated in steps 10 and 11 for b0t.h 3V and 150 mV.
Adjustments
Model 8903E
ADJUSTMENTS
5-1 4. VOLTMETER ADJUSTMENT (NOT REQUIRING AN HP-IB CONTROLLER)
Reference:
Service Sheets 6 and 7.
Description:
The Distortion Analyzer is set to measure the ac level of an external audio oscillator. The a c signal at the
oscillator's output is monitored by an external ac voltmeter. The ac-to-dc converter is adjusted so that its
d c output agrees with the level measured by the external ac voltmeter at two different levels. Both the rmsresponding and average-responding ac-to-dc converters are calibrated. The internal ac-to-dc converter produces
a dc voltage that is read by the internal dc voltmeter and monitored by an external d c voltmeter. The sensitivity
of the internal d c voltmeter is adjusted so that the amplitude display of the Distortion Analyzer agrees with the
level measured by the external d c voltmeter.
NOTE
I f 'an HP-IB controllcr is availahkc, this adjirs~mc~n~
can bc simpl!fic~dusing thc prcvio1r.s
adj I r s1m m1 proced I ire, Vollm etcr A dji t slmenI (Using an HP-IB Coniroller).
Equipment:
HP 8903B or H P 339A
Audio Oscillator.. ..........................
H P 3468A
Digital Voltmeter (A) ..................................
HP 3455A
Digital Voltmeter (B) ..................................
NOTE
Voltmeter A is optional. I f one volrrnrler i.r i w d , conn(w it, as rt.qitirt.d, hrlwtvn the
poin1.s indiicarcd in (hc proc'c~/iirc~
and Figiirc 5-7. SCIil lo rcad dc volts whcw connccled
to A4TPI and ac volls whcw conncwcd lo the ICY at thc Dislorlion Analyzc.r's INPUT.
~1cp.s.
Record Ihc. rcadings jor comparison in s~rhscyiicv~l
Procedure:
1. Switch the Distortion Analyzer off,then back on to initialize it. Set the INPUT switch to ground.
2. Connect the equipment as shown in Figtire 5-7. Connect voltmeter B t o A4TPl (DC OUT) and set
it to measure dc volts. Set voltmeter A to measwe a c volts. Set the audio oscillator to 2.5 Vrms at 1
kHz.
A4TPl
I
IDC OUT)
.
INPUT
8903E
DISTORTION ANALYZER
1
5- 16
AUD I O
OSCILLATOR
1
I
1
D I Q lTAL
VOLTMETER A
I
VOLTMETER B
I
Model 8903E
Adjustments
ADJUSTMENTS
3. Press S (Shift) NOTCH TUNE S (Shift) NOTCH TUNE. The left display should read 11214.
NOTE
Do nof press any addifional kcys rinfil s k p 8. This display musf he prcwnf fhrurigh J f t p
7 in order lo prevenl instrirmcnl ranging.
4. Set the audio oscillator to 3 Vrms at 1 kHz.
5. Adjust A4R91 (RMS SCALE) for a reading on voltmeter B that is the same as the reading on voltmeter
A (within f l mV). (See Service Sheet 6.)
6. Set the audio oscillator amplitude to 150 mV. Adjust A4R85 (RMS OFFSET) for a reading on
voltmeter B that is the same as the reading on voltmeter A (within k0.5 mV). (See Service Sheet 6.)
If A4R85 does not have sufficient range, add or alter A4R143 o r A4R144 as follows:
a. Unsolder A4R143 or A4R144 if present.
b. With a d c voltmeter, measure the voltage at the junction of A4R72 and A4C46.
C. If the voltage (ignoring polarity) is greater than 2 mV, compute R= 1500/V, where V is the
voltage measured (in volts).
d. Select a resistor which has a standard value resistance nearest R. If the measured voltage is
negative, solder the new resistor in the location for A4R143; if positive, replace A4R144.
e. After a five-minute warm-up, measure the voltage again which should be between -2 and
+2 rnV dc.
f. Repeat the adjustment of A4R85.
7. Set the audio oscillator amplitude to 3V. Repeat steps 5 through 7 until the readings tor voltmeter
A and voltmeter B agree within the limits stated for both 3 V and 150 mV.
8. On the Distortion Analyzer, select the averaging detector. Set the audio oscillator amplitude to 2.5V
and key in S (Shift) NOTCH TUNE S (Shift) NOTCH TUNE. The left display should read 11214.
NOTE
Do not p r t x any addirionul kcys rrrilil slt’p 12. This display m i a l hci prcwnl through sfcp
11.
9. Set the audio oscillator amplitude t o 3V. Adjust A4R93 (AVG SCALE) for a reading o n voltmeter B
that is the same as the reading on voltmeter A (within f l mV). (See Service Sheet 6.)
10. Set the audio oscillator to 150 mV. Adjust A4R149 (AVG OFFSET) for a reading o n voltmeter B
that is the same as the reading on voltmeter A within f0.5 mV. (See Service Sheet 6 . )
11. Set the audio oscillator amplitude to 3V. Repeat steps 9 and 10 until the readings for voltmeter A
and voltmeter B agree within the limits stated for both 3V and 150 mV.
12. Press AC LEVEL. Set the audio oscillator to 3V at 1 kHz. Leave the Distortion Analyzer’s detector
in average.
13. Adjust AJR125 (DC CAL) until the right display of the Distortion Analyzer and voltmeter B agree
(within k0.5 mV).
5-17