1
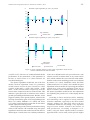
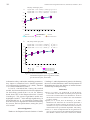
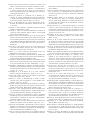
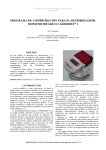
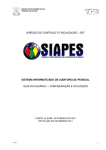
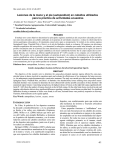
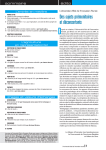
227
Cuban Journal of Agricultural Science, Volume 48, Number 3, 2014.
Growth curves of developing Siboney females from Cuba, up to 18
months old
Á.C. Alonso1, Bertha Chongo2, A. Zamora2, Verena Torres2, Aida C. Noda2 and F. Acosta1
Dirección Técnica Desarrollo, Empresa Pecuaria Genética “Camilo Cienfuegos”
Instituto de Ciencia Animal, Apartado Postal 24, San José de Las Lajas, Mayabeque
Email: [email protected]
1
2
Growth curves of 1,338 developing Siboney females from Cuba, between 0 and 18 months old, were modeled, in the period 2007-2009,
with weights recorded at 0, 4, 8, 12 and 18 months. Curves were divided according to birth season, into rainy and dry seasons. Database
was obtained from the information registered in SISCOP software for the studied years. Seven variants of regression models were tested
(linear, square linear, cubic linear, square logarithmic, logistic, Gompertz and Richards), for data analysis, and daily weight gains were
estimated through the method of square minimums. As statistical criteria for selecting the best adjusted model, the determination coefficient
(R2), parameters of models(α, β, γ, δ), mean square of error (MSE), standard error of models (E(α), E(β), E(γ)), E(δ)), model signification
and residue analysis were determined. For females born during rainy season, the R2 ranged between 0.94 and 0.97, while those born during
dry season, the (R2) ranged between 0.95 and 0.98. It can be concluded that the best adjusted model was the square logarithmic model, with
con R2 = 0.98 (born during dry season) and 0.96 (rainy season), with P < 0.001 in every case. The best increases were registered in animals
born during dry season and between years. The best performance was registered in 2007
Key words: mathematic models, growth curves, liveweight, bovines
Cattle production is vital for sustenance and food
safety of population, so that it can cover the requirements
of 91 g of daily proteins per capita (González 2009),
according to the gradual demand of animal origin
products, needed by the country. This demand could
be reached from efficient livestock production –under
efficient and profitable bases- (Benítez et al. 2009).
Statistics informed from 2005 to 2010 show a sustained
annual growth of milk production in Cuba (MINAG 2011).
The Siboney breed from Cuba (5/8 H - 3/8 C) is one of
the breeds used for these purposes because it has a wide
distribution in the island, with 43.6 % of the total dairy cattle
(Genética Nacional 2011), acceptable figures regarding
the growth rates, besides an early incorporation with good
levels of prolificacy (López 1983, López et al. 1986 and
Gregorich 1992). The developing cattle is a continuity
guarantee for keeping these productive increases.
Predicting and describing growth curves in bovines
helps to characterize production systems and animal
breeds. At the same time, it allows to provide useful
information for developing selection strategies (Ramírez
2007). Duarte (1975), Elías (1998), Oliveira (2000) and
Abreu et al. (2004) in South America, and Perotto et al.
(1997) and Mazzini (2001) in Europe have worked on
modeling growth of different breeds. In Cuba, studies
like those of Fernández (2004), focused on lactancy
curve modeling, and researches from Alonso (2009)
in female bovines, up to 18 months old, have allowed
to describe some factors that compromise the current
performance of this breed in formation.
This study had the objective of estimating growth
curves up to 18 months of age in Siboney females from
Cuba, starting with the control weighing carried out at
birth, at 4, 8, 12, and 18 months old, with the application
of linear and non linear regression models, for 2007-2009.
Materials and Methods
A total of 1,338 records of females born between
2007 and 2009, from Siboney breed of Cuba were used
in the U.E.B “Loma de Candelaria”, belonging to the
Empresa Pecuaria Genética “Camilo Cienfuegos”. These
records were obtained from a weighing gathered in the
SISCOP program (Caunedo 1992) during the 0, 4, 8, 12
and 18 months.
The data extracted from the PVV. sgh, where all the
weighings are located within the SISCOP databases,
were organized per each year in Microsoft Excel. As
a criterion for the statistical analysis per year, females
were divided according to the season of their birth: 784
calves in dry season (from November 1st to May 14th)
and 554 in rainy season (from May 15th to October 31st).
For analyzing and processing obtained data, four
models of linear regression and three non linear
regression models were tested. According to Ratkowsky
(1983), these models are the most used for estimating
animal behavior:
Linear models:
Linear: y = alfa + beta (age)
Square linear: y = alfa + beta (age ) + gamma (age )2
Cubic linear: y = alfa + beta (age ) + gamma (age )2
+ delta (age )3
Square logarithm: Log y = alfa + beta (age) + gamma
(age )2
Non-linear
Logistic: y=
alfa
1 + beta. exp[− gamma.((age
edad)])]
228
***
0.0029
0.97
***
305.85
-0.004
-0.003
ns
0.95
***
306.11
0.95
-0.03
0.01
***
-0.15
0.08
*
-0.0026
0.00004
***
MSE
306.68
R2
0.95
Sign
***
***
***
***
281.47
281.06
0.03
α
β
35.5
12.54
0.74
0.07
***
***
34.43
13.0
0.92
0.24
***
***
33.9
13.79
0.98
0.57
***
***
1.56
0.09
0.0028 0.0007
***
***
Rainy season
N=183
γ
δ
MSE
292.19
Out of the evaluated models (linear, square linear,
cubic linear, square logarithmic, logistic, Gompertz and
Richards), those of non linear regression were rejected
because they did not present a significant adjustment to LW.
Table 1, 2 and 3 show the results of the linear
regression analysis for each season during 2007-2009.
For a higher precision of the appropriate model in this
type of study, an analysis of the exactitude along with
the LW was made in each evaluated season per years,
between 2007 and 2009.
When comparing the performance models of LW
between seasons, during 2007, 2008 and 2009 (tables
1, 2, and 3), it was confirmed that all of them had a very
good adjustment due to their flexibility (Arias et al.
2010), with similar and high determination coefficients
(R2), which indicates a good precision in the estimates.
Besides, the use of linear models for describing growth
of females from this breed was positive. All models
differed (P < 0.001) in both seasons.
Values of R2 were the best adjusted data, with 0.97,
in the square logarithm for both seasons of 2007
Models estimating LW for females born in both
studied seasons of 2008 differed at P < 0.001. There were
low determination coefficients (0.94) in the linear and
square linear adjustments, and during the rainy season.
As in 2007, the square logarithmic model of both
seasons in which females were born was the best
adjusted, with R2 equals 0.96 during dry season and 0.97
during rainy season.
The same was confirmed in 2009 (P < 0.001) in the
models evaluated for both seasons (table 3). For the
females born during rainy season, the R2 were lower,
Table 1. Results of model adjustment for each season of female birth, 2007
Dry season
Model
N= 313
Parameters
α
β
γ
δ
R2
Linear
38.13
11.61
0.95
SE (±)
0.95
0.09
Parameter sign.
***
***
Square linear
34.13
13.34
-0.09
0.95
SE (±)
1.15
0.31
0.02
Parameter sign.
***
***
***
Cubic linear
33.49
13.34
-0.26
0.01
0.95
SE (±)
1.23
0.73
0.11
-0.004
Parameter sign.
***
***
*
ns
Square logarithmic
1.554
0.094
-0.003
0.97
SE (±)
0.003
0.001
0.00004
Parameter sign.
***
***
***
*
P
<
0.05
***P
<
0.001
Results and Discussion
Sign
***
Cuban Journal of Agricultural Science, Volume 48, Number 3, 2014
Gompertz: y = alfa. exp <-beta. exp [-gamma(edad)]>
Richards: y = <alfa.[1+beta. exp(-gamma.{edad})]>
where:
y: LW or DWG
age: age of the animal
alfa (α), beta (β), gamma (γ) and delta (δ): parameters
Estimations for the parameters were determined
by using the method of square minimums in the case
of linear regression and by the iterative method of
Marquardt (1963), for the non linear models (Logistic,
Gompertz and Richards).
The statistical criteria for selecting better adjusted
models were made according to indicators described
by Guerra et al. (2002 and 2003) and Fernández (2004):
1. Determination Coefficient (R2)
2. Parameters of models (α, β, γ, δ)
3. Mean square of error (MSE),
4. Standard error of model parameters SE(α),
SE(β), SE(γ), SE(δ)
5. Model signification
6. Residue analysis
Compiled information was processed by the statistical
package SPSS version 11.5.1 (2002).
Table 3. Results of model adjustment for each season of female birth, 2009
Dry season
Model
N= 260
Parameters
α
β
γ
δ
R2
Linear
36.61
11.84
0.96
SE (±)
0.85
0.08
Parameter sign.
***
***
Square linear
31.23
14.13
-0.13
0.97
SE (±)
1
0.26
0.01
Parameter sign.
***
***
***
Cubic linear
32.82
11.74
0.25
-0.01
0.97
SE (±)
1.05
0.62
0.09
0.033
Parameter sign.
***
***
**
***
Square logarithmic
1.53
0.1
-0.002
0.98
SE (±)
0.0033
0.0008
0.00004
Parameter sign.
***
***
***
** P < 0.01; *** P < 0.001
Table 2. Results of model adjustment for each season of female birth, 2008
Dry season
Model
N= 211
Parameters
α
β
γ
δ
R2
Linear
31.54
11.58
0.95
SE (±)
0.91
0.09
Parameter sign.
***
***
Square linear
32.91
10.99
0.03
0.95
SE (±)
1.12
0.09
0.02
Parameter sign.
***
***
*
Cubic linear
32.5
11.61
-0.06
0.003
0.95
SE (±)
1.2
0.7
0.1
0.003
Parameter sign.
***
***
ns
ns
Square logarithmic
1.53
0.09
0.002
0.96
SE (±)
0.003
0.001
0.00005
Parameter sign.
***
***
***
* P < 0.05 ***P < 0.001
***
303.1
***
185.79
***
***
268.92
0.0021
Sign
***
CMe
209.02
***
***
303.1
0.003
Sign
***
CMe
304.1
β
11.06
0.08
***
13.04
0.27
***
13.09
0.66
***
0.09
0.0008
***
α
β
33.29
12.39
0.94
0.09
***
***
32.24
12.83
1.17
0.31
***
***
30.47
15.5
1.24
0.73
***
***
1.53
0.1
0.0037 0.0009
***
***
α
37.1
0.87
***
32.38
1.05
***
32.34
1.12
***
1.54
0.003
***
0.0003
0.003
ns
-0.02
0.02
ns
-0.44
0.1
***
-0.0027
0.00005
***
0.02
0.003
***
Rainy season
N=165
γ
δ
-0.11
0.01
***
-0.12
0.09
ns
-0.002
0.00004
***
Rainy season
N=206
γ
δ
0.96
0.94
0.94
R2
0.94
0.97
0.95
0.94
R2
0.94
0.0042
407.68
412.49
CMe
412.9
0.0027
267.17
268.92
CMe
283.17
***
***
***
Sign
***
***
***
***
Sign
***
Cuban Journal of Agricultural Science, Volume 48, Number 3, 2014.
229
230
with 0.94 in all linear models, except in the square
logarithmic model.
As in the previous years, the square logarithmic
model, for both seasons of the year, had the best
adjustment, with values of R2 equals 0.98, in dry season,
and 0.96 in rainy season.
According to Fitzhungh and Taylor (1971), selecting
a specific model for describing growth will depend on
its ability for biological interpretation and on the data
adjustments and its requirements, regarding a computer
program. Although during all the studied years the linear
models had good adjustment of R2 and P < 0.001, it is
evident that the square logarithmic model was the best
adjusted for LW of Siboney females from Cuba, from
2007 to 2009. The highest determination coefficients
were found in this model, for all the years and seasons
in which females were born, with a performance of
R2 ≥ 0.96, mainly in 2007, for both seasons. These
coefficients coincide with those informed by Brody
(1945), cited by Fernández (1996), Molina et al. (1992)
and Robert-Granié et al. (2002) in bovine growth curves.
These authors consider that animal growth has a stage
of linear growth. However, the adjustment of this model
differs with the informed by Abreu et al. (2004), PeredaSolís et al. (2005), Agudelo et al. (2007), Malhado et al.
(2008) and Alonso (2009), who found a better adjustment
in non linear models during the growth-development
stage, with R2 ≥ 0.90. The previous data suggests further
studies on the estimation of growth curves in this breed,
with the use of other models.
For selecting the best adjusted model, the MSE is
another statistical criterion to be considered. The square
logarithmic model, for all years and seasons, had the
lowest values, between 0.0021 and 0.03, inferior to
those informed for the others. This allowed estimating,
with higher precision, the effects of studied factors and,
at the same time, selecting the best adjusted model for
the analyzed cases.
The lowest values of MSE were registered in the
group of animals born during rainy season, with 0.0029
and 0.0027, in 2007 and 2008, respectively. This
indicates that there was a lower variance of liveweight,
as the described by Freitas (2005), which explains the
variability of this model in all years for this season of
birth.
In addition, it can be considered, likewise, an
expression of the use of feeding systems according
to each growth stage and of the use of sustainable
alternatives in livestock production, using a proper
management of the grazing system during the ages in
which the bovine is more efficient for pasture intake
(Senra 2005 and Mejías 2008).
After adjusting the model, residues of the square
logarithmic model were calculated. They were
obtained from the comparison between LW observed
and LW calculated using the selected model, for
determining the existence of underestimation
Cuban Journal of Agricultural Science, Volume 48, Number 3, 2014
or overestimation of bovine LW (Fabens 1965).
Regarding the criteria for the precision analysis of the
estimations (residue analysis), figure 1a and b show
the graphic performance of residues. Variation range
of residues was between -0.1 and 0.1. The extreme
values mostly corresponded to 2009, for those born
during rainy season (-0.2 a 0.2). Figure 1 is essential to
know the general performance of residues, according
to Torres et al. (2012).
The best performance was shown by 2007. Female
calves born in the dry season had the highest amount of
residues, closed to -0.1 and 0.1.
For all the evaluated models, the α parameter
indicates estimation of weight gain value reached by
the animal (or the studied population), without being,
necessarily, the highest weight the animal can reach, but
the mean weight it gets when arriving to maturity, apart
from the seasonal variations (Brown and bandermer
1997, Abreu et al. 2004 and Agudelo et al. 2007).
The analysis of α parameter, obtained through the
square logarithmic model, shows that the highest value
ranged between 1.55 and 1.56 (P < 0.001) for both
seasons, every year. This is an indicator of development
for achieving a bovine asymptotic weight. When
comparing the estimations obtained from the four
models, the highest value was achieved by the linear
model and the females born in dry season (38.13 kg).
The lowest value corresponded to the square logarithmic
model (1.53 kg) in both seasons of 2009. Similar
results were achieved by Oliveira et al. (2000), but
in a narrower range. For the rest of the linear models
evaluated in both seasons, the values of this parameter
had a similar performance, between 31.5 and 37.1 kg, in
both birth seasons of the studied females. There was an
underestimation in the square logarithmic model from
α parameter.
According to Freitas (2005) and Noguera et al.
(2008), the β parameter does not have biological
interpretation, but it is important for modeling the
sigmoid curve from birth (t=0) to grown age (t→∞).
Likewise, Abreu et al. (2004) state that this parameter is
the integration factor that adjusts initial weight values,
generally related to birth weight (development degree of
the animal at birth for reaching the asymptotic weight).
Nevertheless, its importance is considered for modeling
the sigmoid curve, from birth to grown age, at 42 months
old (Torres et. al 2012).
Abreu et al. (2004) and Marques da Silva et al.
(2004) stated that γ is another important parameter for
the study. It represents the maturity rate of animals,
as a function between maximum growth rate and
adult weight of the animal (growth speed). Torres et
al. (2012) reported that animals with high values of γ
represent an early maturity regarding those animals
with similar initial weight. In the estimation of this
parameter, the contrary to the asymptotic weight
happened, with the estimations of considered models
231
Cuban Journal of Agricultural Science, Volume 48, Number 3, 2014.
ResiduesLogarítmo
square logarithm
dry season
Residuos
cuadráticoper
poryears,
años Época
poca lluvia
a
0.3
0.2
0.1
0.0
0
2
4
6
8
10
12
14
16
18
20
-0.1
-0.2
-0.3
-0.4
Edad
Age (meses)
(months)
Residue
2008
Residuo
2008
Residue2007
2007
Residuo
b
Residue
2009
Residuo
2009
Residues
logarithm
perpor
years,
Residuossquare
Logarítmo
cuadrático
añosrainy
Épocaseason
lluvia
0.3
0.2
0.1
0.0
0
2
4
6
8
10
12
14
16
18
20
-0.1
-0.2
-0.3
-0.4
Edad (meses)
Age (months)
Residue2007
2007
Residuo
Residue2008
2008
Residuo
Residue
2009
Residuo
2009
Figure 1a and b. Residue analysis of the square logarithmic model for the
seasons studied between 2007 and 2009.
(-0.0027 a 0.27). Oliveira et al. (2000) informed similar
performance in the estimations of this parameter in
bovines, as well as Torres et al. (2012) inform it for
crossbred Bufalypsos.
The square logarithmic model had, out of the four
models, the best adjustment values of γ parameter,
in both seasons and for all years, because its values
(-0.0027- 0.002 and P < 0.001) and (-0.0026 – 0.002
and P < 0.001) in both seasons, respectively, were the
lowest values compared to the rest of the models. This
indicates a good precision of variations in the relative
growth speed during both birth seasons. Besides, it also
suggests stability in the growth rhythm, related to the
favoring of mean daily gains of liveweight Marques da
Silva et al. (2004), Malhado et al. (2008) and Torres
et al. (2012) reported similar results but for non linear
models adjusted to animal growth.
When analyzing results of mean performance among
values of LW and the LW estimated using the square
logarithmic model for each studied season from 2007 to
2009 in figure 1 a and b, there was a similar performance
in the curve adjustment for each year and season, with
a better increase in females born in dry season and in
2007, which confirms the correct selection of the model.
Similar results when modeling growth were informed
by Guerra et al. (1993), Fernández (1996), Del Valle
(2000) and Guerra et al. (2003), who consider the good
adjustment of linear models for expressing the standard
growth curve of any living organism. There are no
reports of studies, in the consulted literature, in which
the square logarithmic model has the best adjustment
for explaining the growth curve of developing bovine
female.
According to Torres and Ortiz (2005), modeling
and simulating can be applied to many problems
related to ruminants, especially to the most studied
category: milking cow. This study refers to the use
of different models for describing a very important
stage of bovine female, related to the increase of
milk productions. According to Sampaio et al.
(2005), using the better adjusted model, stochastic
approximations can be made, which provide higher
232
Cuban Journal of Agricultural Science, Volume 48, Number 3, 2014
LW, dry
PV Época
pocoseason
lluviosaper
por years
años
a
Log LW 2007 =1.554 + 0.094(t) + (-0.003) (t)2 R2 =0.97 ***
Log LW 2008 = 1.53 + 0.09 (t) + (-0.002) (t)2 R2 =0.96 ***
Log LW 2009 = 1.53 + 0.1 (t) + (-0.002) (t)2
R2 =0.98 ***
3.0
2.5
PV
2.0
1.5
1.0
0.5
0.0
0
2
4
6
8
10
12
14
16
18
20
Age
Edad
PV 2007
LW
Estimated
2007
PV Estima
2007
LW
PV 2008
LW
Estimated
2008
LW
PV Estima
2008
LW
PV 2009
Estimated
2009
LW
PV Estima
2009
b
LW, rainy
season
per por
years
PV Época
lluviosa
años
Log LW 2007 = 1.56 + 0.09(t) + (-0.0026) (t)2
Log LW 2008 = 1.54 + 0.09 (t) + (-0.002) (t)2
Log LW 2009 = 1.53 + 0.1 (t) + (-0.0027) (t)2
3.0
R2 =0.97 ***
R2 =0.97 ***
R2 =0.96 ***
2.5
PV
2.0
1.5
1.0
0.5
0.0
0
2
4
6
8
Edad
10
Age
PV 2007
LW
PV 2008
LW
LW
PV 2009
12
14
16
18
20
Estimated
LW
PV Estima
20072007
Estimated
LW
PV Estima
20082008
Estimated
LW
PV Estima
20092009
Figure 2 a and b. Performance of LW (kg) and mean LW,
estimated through the square logarithmic model,
per seasons and years, 2007-2009
information safety, and besides modeling parameters,
they improve estimation levels. Similar arguments
were informed by Fernández et al. (2001), Fundora
et al. (2006) and Ramírez (2007).
It can be concluded that, among the studied
models, the linear models showed a better adjustment
for describing growth from 0 to 18, for Siboney
breed from Cuba, in the Empresa Pecuaria “Camilo
Cienfuegos”. The square logarithmic model was
highlighted, with R2 = 0.96 and high signification, in
the model and in α, β, γ, δ parameters evaluated. The
best increases were registered in animals born during
dry season. The best performance, among the years,
was in 2007.
Acknowledgements
Thanks to the Empresa Pecuaria Genética “Camilo
Cienfuegos”, and its department of genetics, for allowing
the access to their databases, and to the Department of
Biomathematics from the Institute of Animal Science
for their help in data processing.
References
Abreu, U. G., Cobuci, J. A., da Silva, M. V. G. B. & Sereno,
J. R. B. 2004. Uso de modelos no lineales para el ajuste de
la curva de crecimiento de bovinos Pantaneiros. Archivos
de Zootecnia. Año/vol. 53. Número 204. Universidad de
Cordova. España.
Agudelo, D. A., Ceron, M. F. & Restrepo, L. F. 2007.
Modelación de funciones de crecimiento aplicadas a
la producción animal. Informe Ocasional no 18. pdf.
Available on: http://www.mundoveterinario.net/nueva/
referencias/bovinos [Consulted: September 10th, 2007]
Alonso, A. C. 2009. Comportamiento de las ganancias en
peso vivo (de 0 a 18 meses de edad) del genotipo Siboney
de la EGPCC durante cuatro años consecutivos. Master
Cuban Journal of Agricultural Science, Volume 48, Number 3, 2014.
Thesis. Instituto de Ciencia Animal. La Habana. Cuba
Arias, Y., González-Peña, D., Montes, I. & Domínguez,
A. 2010. Estimación de la curva de crecimiento en
futuros sementales de la raza buffalypso. Rev. Ciencia y
Tecnología Ganadera. 4: 136
Benítez, D., Ricardo, Y., Viamonte, M. I., Romero, A.,
Guevara, O., Verena, T. Miranda, M., Guerra, J. & Olivera,
C. 2009. Technological alternatives for replacement cows
in the Cauto Valley. Cuban J. Agric. Sci. 43:351
Brown, W. & Bandermer, H. 1997 Aplicaciones de las
técnicas de simulación matemática. NIAES. Series No.
3: 173-188
Caunedo, J. 1992. Software SISCOP. Empresa Pecuaria
Genética “Niña Bonita”. Cuba
Del Valle, J. 2000. La multicolinealidad en modelos de
regresión lineal múltiple. Master Thesis. Universidad
Agraria de La Habana, Cuba
Duarte, F.A.M. 1975. Estudo da curva de crescimento de
animais da raça Nelore (Bos taurus indicus) através de
cinco modelos estocásticos. 284 f. Tese (Livre-Docência)
- Faculdade de Medicina de Ribeirão Preto, Universidade
de São perior de Agricultura de “Luiz de Queiroz”,
Piracicaba.
Elías, M.A. 1998. Análise de curvas de crescimento de
vacas das raças Nelore, Guzerá e Gir. 128 f. Dissertação
(Mestrado em Zootecnia) - Escola Su
Fabens, A. J. 1965. Properties and fitting of the von
Bertalanffy growth curve. Growth 29: 265
Fernández, L. 1996. Modelos que describen la dinámica de
los procesos biológicos en las ciencias. Tesis de Maestría.
Universidad Agraria de La Habana, Cuba
Fernández, L. 2004. Modelos estadísticos-matemáticos en el
análisis de la curva de lactancia y factores que la afectan
en el genotipo Siboney de Cuba. PhD Thesis. 113 pp.
Fernández, L., Menéndez, A., Guerra, V., & Suárez, M. 2001.
Estimation of the standard lactation curves of the Siboney
de Cuba breed for their use in lactation extensions. Cuban
J. Agric. Sci. 35: 93.
Fitzhungh, H. A. Jr. & Taylor, St. C. S. 1971. Genetics
analysis of degree of maturity. J. Anim Sci 33: 717
Freitas, A.R. 2005. Curvas de crescimento na produção
animal. Rev. Bras. Zoot. 34:786
Fundora, O., Torres, V., González, M. E., Noda, A. 2006.
Growth curve and liveweight in a river buffalo herd.
Cuban J. Agric. Sci. 40:401.
Gonzáles, S. 2009. Estimación de los parámetros, valores y
tendencias genéticas para los rasgos de crecimiento del
ganado Cebú cubano. PhD Thesis. CIMAG. Cuba
Gregorich, J. 1992. Comportamiento de la actividad estral
y la fertilidad en rebaños Siboney. Trabajo de Diploma.
Universidad de Granma. Bayamo, Granma, Cuba
Guerra, W., Cabrera A. & Fernández, L. 2002. Propuesta
metodológica para la selección de modelos estadísticos.
Aplicaciones a modelos de regresión. Monography.
UNAH. La Habana, Cuba. 35p.
Guerra, C.W. 2003. Criteria for the selection of statistical
models in scientific research Cuban J. Agric. Sci. 37:3
Guerra, W., De Calzadilla, J. & Del Valle, J. 1993. Aspectos
cualitativos-cuantitativos sobre modelos que describen la
dinámica de crecimiento en poblaciones. Monography.
Universidad Agraria de La Habana. 13 pp.
López, D. 1983. Caracterización de la población base de
un nuevo genotipo lechero tropical. El Siboney de Cuba.
233
PhD Thesis. Instituto Superior de Ciencias Agropecuarias
de La Habana.
López, D., Ponce de León, R. & Orrel, R. 1986. Características
del crecimiento y comportamiento reproductivo de
novillas de primer nivel inter-se 5/8H 3/8C. Memorias
ALPA 21: 12
Malhado, C.H.M., Ramos, A. A., Carneiro , P.L.S., Souza
J.C., Wechsler, F.S., Eler, J.P., Azevêdo, D.M.M.R. &
Sereno, J.R.B. 2008. Modelos no lineales para describir
el crecimiento de bufalinos de la raza Murrah. Archivos
de Zootecnia. 57: 498
Marques da Silva, N. A., Henrique de Aquino, L., Fonseca
e Silva, F., Ilson Gomes de Oliveira, A. 2004.Curvas de
crecimiento e influencia de factores no genéticos en las
tasas de crecimiento de bovinos de la raza Nerole. Ciênc.
Agrotec. Lavras. 28: 647
Marquardt, D. W. 1963. An algorithm for least square
estimation of non-linear paramet. J. Soc. Indust. Appl.
Math. 11: 431
Mazzini, A. R. A. 2001. Análise da curva de crescimento
de machos Hereford considerando heterogeneidade
de variâncias e autocorrelação dos erros. Dissertação
(Mestrado)-Universidade Federal de Lavras, Lavras. 94 p.
Mejías, R. A. 2008. Sistema para la producción de hembras
bovinas de reposición con asociación de gramíneas con
leguminosas. PhD Thesis. ICA.
MINAG, 2011. Balance productivo de los rebaños lecheros
en Cuba en el último quinquenio. Ciudad Habana, Cuba
Molina, A., Serrano, M.I., Burgos, A., Jiménez, J.M.,
Salado, F. M., Cabeza de Vaca, F., Espárrago, E. &
Rodero, A. 1992. Estimación de la curva de crecimiento
en vacuno retinto: aspectos prácticos para la tipificación
de pesos. Available on: http://dialnet.unirioja.es/servlet/
articulo279549. Consulted: February 1st, 2010
Noguera, R.R., Pereira, R.L. & Solarte, C. E. 2008.
Comparación de modelos no lineales para describir
curvas de crecimiento en cuyes (Cavia porcellus) desde
el nacimiento hasta la edad de sacrificio. Libestock Res.
Rural Devel. 20:5
Oliveira, H. N., Lôbo, R.B. & Pereira, C. S. 2000.
Comparação de modelos não-lineares para descrever
o crescimento de fêmeas da raça Guzerá. Pesquisa
Agropecuária Brasileira, Brasília. 35: 1843
Pereda-Solís, M.E., González-Muñoz, S., Arjona-Suárez, E.,
Bueno-Aguilar, G. & Mendoza-Martínez, G. 2005. Ajuste
de modelos de crecimiento y cálculo de requerimientos
nutricionales para bovinos Brahman en Tamaulipas,
México. Revista Agrociencia, 39:19
Perotto, D., Castanho, M. J. de P.; Cubas, A. C.; Rocha, J. L.;
Pinto, J. M. 1997. Efeitos genéticos sobre as estimativas
dos parâmetros das curvas de crescimento de fêmeas
bovinas Gir, Guzerá, Holandês x Gir e Holandês x Guzerá.
Revista Brasileira de Zootecnia. Viçosa. 26: 719
Ramírez, R. 2007. Modelación de curvas de crecimiento y
producción de leche en ganado bovino. Artículo en pdf.
Ratkowsky, D. A. 1983. Non-linear regression modeling.
Mercel dekker. New York. 297 p.
Robert-Granié, C., Heude, B. & Foulley, J.L. 2002. Modeling
the growth curve of Maine-Anjou beef cattle using
heteroskedastic random coefficients models. Genet. Sel.
Evol. 34: 423
Sampaio, I., Ferreira, W & Bastos, F. 2005. Selecting high
performance rabbits at early ages thought and stochastic
234
approach. J. Animal Prod. 10:81
Senra, A. 2005. Indices to monitor the efficiency and
sustainability of the grassland ecosystem in cattle rearing.
Cuban J. Agric. Sci. 39:13
SPSS. 2002. Software estadístico. Manual de usuario.
Versión 11.5.1. EUA. Sp.
Torres, V. & Ortiz, J. 2005. Application of modeling and
Cuban Journal of Agricultural Science, Volume 48, Number 3, 2014
simulation to the production and feeding of farm animals.
Cuban J. Agric. Sci. Volume 39. Special Number. ICA.
Havana.
Torres, V., Barbosa, I., Meyer, R., Noda, A. & Sarduy, L.
2012. Criteria of goodness of fit test in the selection
of non-linear models for the description of biological
performances. Cuban J. Agric. Sci. 46: 345
Received: April 19, 2014