1
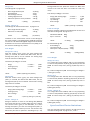
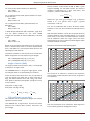
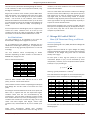
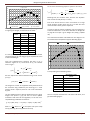
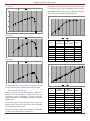
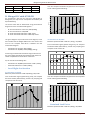
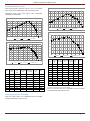
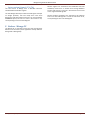
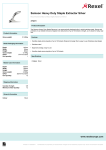
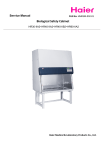
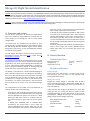
Mirage III Flight Model Identification
LICENSE: This document has been created by J.M. LANGERON / TOPOLO, (http://topolo.free.fr/). All the values used to model the
aircraft behavior have been computed by him, like all performance charts presented here, based on data provided by the people
mentioned in the CREDITS section. If you want to use these data, or part of it, please contact the author by personal message to
TOPOLO on check-six forum: (http://www.checksix-forums.com/).
CREDITS: I want to thanks particularly and Tom COOPER (ACIG.org) for his huge knowledge on military aerospace in general, the
history of these aircraft in particular, and the fact that he build the working group.
A. Purpose and scope.
-
The aim of this document is to identify the Flight Model,
that is Lift coefficient, Drag Coefficient et Thrust laws, for
some versions of the Mirage III, and for some specific
configurations.
The versions that are considered are the French air force
(Armée de l’Air, aka AdA) Mirage IIIC with ATAR-9B engine,
the AdA Mirage IIIE with ATAR-9C engine, the IAF (Israel)
Mirage IIICJ, early version, or late, retrofitted with ATAR-9C,
and the IAF (Israel) Nesher.
The IAF Mirage IIIC engine retrofit has been performed,
depending on sources, after 1974 (ACIG), or after 1971 (Le
Mirage IIICJ au combat)
The decision to include the late retrofitted version is lead
by the fact that this is the version that had to face late Mig21 (M, MF or bis), when original Mirage-IIIC faced Mig-21F
or F-13, and this flight model identification is the basis to
build a comparison between Mirage III and Mig-21M, MF
and bis (the only I have reliable performance data).
The Nesher is assumed to be a locally assembled Mirage-5,
with a definition equivalent to the Mirage-5F operated by
the French AdA (the Mirage-5F have been built as Mirage5J to be delivered to IAF, but due to embargo, has been
retrofitted to a configuration closer to AdA standard and
renamed 5F). The engine if the Nesher is also assumed to
be an ATAR-9C3 or C5, similar to the one fitted in MirageIIIE.
The configurations to be studied are all representative of
close air combat and are the following:
-
-
A Mirage IIIC with ATAR-9B operated by AdA (French
Air Force) by the end of the 60’s with 2 short range A/A
missiles (AIM-9B) with pylons and launchers, 2 DEFA
30mm guns with their rounds, no rocket but the rear
fuel tank that take its place and half of the internal
fuel.
A Mirage IIICJ retrofitted with an ATAR-9C when
operated by IAF around 1974: 2 short range A/A
missiles (AIM-9B because Shafrir Mk.2 data are not
known) with pylons and launchers, 2 DEFA 30mm guns
Friday, February 15, 2013 – rev.2
-
with their rounds, no rocket but the rear fuel tank that
take its place and half of the internal fuel.
A Mirage IIIE with ATAR-9C operated by AdA (French
Air Force) by the end of the 60’s with 2 short range A/A
missiles (R-550 Magic 1) with pylons and launchers, 2
DEFA 30mm guns with their rounds, no rocket but the
rear fuel tank that take its place and half of the internal
fuel (including leading edge fuel tanks that are optional
equipment).
A Nesher / Mirage 5F with ATAR-9C, operated by IAF in
1973: 2 short range A/A missiles (AIM-9B because
Shafrir Mk.2 data are not known) with pylons and
launchers.
B. Data Collection.
-
Dimensional Data.
Reference Area (S):
Wing Span (l) :
2
Aspect ratio (λ=l /S):
-
34.79 m
8.22 m
1.94
2
2
(374.5 ft )
Weight and Balance.
Empty Weight
Empty mean here: without fuel, or external loads, but all
the rest (pilot, guns and ammo, oil and required fluids,
empty optional fuel tanks).
Mirage III C and CJ
Mirage III-C empty weight is estimated from PL-P32-1
where take-off weight with 1 MATRA-530 (240kg with its
pylon) and 2 AIM-9 (240Kg with pylons and launchers), is
said to be 8,915 kg
If we supposed this weight being related to a plane with
empty gun bay (no rounds), but with full 2,580 L of fuel
(2,064 kg @ 0.8kg/l), we have, without fuel nor gun rounds,
but with pilot, a weight of 6,371 kg, if we remove the pilot
(95kg), we get an basic weight of 6,276 kg
-
Basic weight without pilot
Equipped Pilot
DEFA Guns 250rds
: 6,276 kg
: 95 kg
: 130 kg
TOTAL
(14,351 lbs)
: 6,501 kg
Page - 1
Mirage III Flight Model Identification
Mirage III E
From Mirage-IIIE at page PL-II-3
-
Basic weight without pilot
Equipped Pilot
Rear fuselage fuel tank
Leading edge fuel tank
DEFA Guns (Chassis canon) w 250rds
: 6,665 kg
: 95 kg
: 90 kg
: 150 kg
: 360 kg
TOTAL
(16,247 lbs)
: 7,360 kg
fuselage 465l fuel tank (electronic devices are fewer and
moved to the nose that does not include the radar any
more).
Fuel density of 0.8kg/l is assumed.
-
Nesher - Mirage 5F
From Mirage-5F “Manuel d’Utilisation” at page PL-II-3:
-
Basic weight with 95 kg pilot
DEFA Guns rounds (250)
: 6,780 kg
: 130 kg
TOTAL
(15,253 lbs)
: 6,910 kg
Comment: In the maintenance manual of the Mirage-5F
the empty weight is said 100kg lighter (6,680 kg) with pilot
and seat. As I’ve defined Mirage IIIE weight from its Manuel
d’Utilisation and not from its Maintenance one (GCB), I’ll do
the same for the Mirage-5F / Nesher.
Fuel Weight
Mirage III C and CJ
With the “Chassis canon” (guns), the front fuselage tank
(325 L) is removed, but without the SEPR rocket, the rear
fuselage tank (460 L) can be installed. The leading edge
tanks do not exists on Mirage III C.
Fuel density of 0.8kg/l is assumed.
-
Wings
Fuselage (main)
Rear Fuselage
TOTAL
: 2 x 545 L =
: 2 x 515 L =
:
1,090
1,030
460
: 2,580 L (2,064 kg or 4,556 lbs)
TOTAL
: 2 x 670 L =
: 2 x 515 L =
:
1,340
1,030
545
: 2,915 L (2,332 kg or 5,147 lbs)
Nesher - Mirage 5F
Mirage 5 definition is based on late Mirage IIIE (SN#546)
that implies the two 125 L leading edge tanks are installed.
The “Chassis canon” (guns) is not removable, so no front
fuselage tank (325 L), but the rear fuselage tank (545 L) is
installed as the SEPR rocket bay can’t be. The electronic bay
behind the pilot seat is replaced in the Mirage 5 by a Top
Friday, February 15, 2013 – rev.2
1,340
1,030
465
545
: 3,380 L (2,704 kg or 5,969 lbs)
Load-out Weight
Same for all Nesher, Mirage 5F and Mirage IIIC versions and
described in Mirage-IIIE at page PL-II-3
-
Sidewinder AIM-9B: 80kg
Pylon + launcher:
30kg
TOTAL
: 2 x 110kg
(220kg/486lbs)
For the AdA Mirage IIIE
R-5550 Magic-I
: 89 kg
Launcher type 40
: 39 kg
CES3 Pylon + Adpator (ADP4) : 36 kg
TOTAL
: 2 x 164kg
(328kg/724lbs)
Gross Weight.
Mirage III C & CJ
In a configuration with 2xAIM-9, GW can vary (depending
on internal fuel) between 8,785 kg (19,393 lbs) at take-off
(100% of internal fuel) and 6,721 kg (14,837 lbs) with no
fuel.
Mirage III E
In a configuration with 2xR-550, GW can vary (depending
on internal fuel) between 10,020 kg (22,119 lbs) at take-off
(100% of internal fuel) and 6,721 kg (14,837 lbs) with no
fuel.
So, Combat configuration (50% internal fuel) gross weight is
8,854 kg (19,545 lbs)
Fuel density of 0.8kg/l is assumed.
Wings (with leading edge)
Fuselage (main)
Rear Fuselage
TOTAL
: 2 x 670 L =
: 2 x 515 L =
:
:
So, Combat configuration (50% internal fuel) gross weight is
7,753 kg (17,115 lbs)
Mirage III E
With the “Chassis canon” (guns), the front fuselage tank
(325 L) is removed, but without the SEPR rocket, the rear
fuselage tank (545 L) can be installed. The two 125 L leading
edge tanks are installed.
-
Wings (with leading edge)
Fuselage (main)
Top Fuselage
Rear Fuselage
Nesher - Mirage 5F
In a configuration with 2xAIM-9, GW can vary (depending
on internal fuel) between 9,834 kg (21,709 lbs) at take-off
(100% of internal fuel) and 7,130 kg (15,740 lbs) with no
fuel.
So, Combat configuration (50% internal fuel) gross weight is
8,482 kg (18,724 lbs)
-
Speed and Load Factor limitations.
They are assumed to be the same for all AdA versions and
described in Mirage-IIIE at page PL-III-1, 2 and 3.
Page - 2
Mirage III Flight Model Identification
For clean aircraft, speed limitations are defined by:
IAS < 750Kts
Mach number < 2.0
For a configuration with R-550, speed limitations are equal
to the clean one:
IAS < 750Kts
Mach number < 2.0
For a configuration with AIM-9, speed limitations are
defined by:
IAS < 700Kts
Mach number < 2.0
In RAAF Mirage IIIO Manual (AAP 7213.003-1, page AL-31
5.3) the speed limitations for the same 2xAIM9
configuration (identified as SW for Sidewinder) is declared
to be:
-
IAS < 730Kts
Mach number < 2.0
Based on the assumption that limitations to be used by IAF
pilots in 1974 should be closer to an 1978’s Export Manual
than a AdA 1965’s one, I will keep the RAAF values for the
IAF Mirage III C with ATAR 9C.
We will consider a CoG location at 50% of MAC, a gross
weight of 9,000kg. For each Mach number, we read true
incidence corresponding to a given load factor, that
compute Cz value from load factor by:
Where M is the mass (gross weight) in kg, S reference
2
3
surface in m , ρ air volumic mass in kg/m , g gravity
2
acceleration = 9.81 m/s .
First set of computation will be done for Mach number
between 0.5 and 1.0, when possible two altitudes will be
used.
With load factor between 1 and 6, we can get Lift values for
incidence between 1.00 and 19.00 degrees, as all results
show clearly a strict linear correlation between incidence
and lift coefficient within this range, values have been
extrapolated up to a true incidence of 20.00 degrees (AoAS
of 33.33) and down to null lift.
Results are summarized in the following figure:
Cz(M=0.5)
-
Angle of attack (AoA)
Cz(M=0.8)
Cz(M=0.9)
Cz(M=1.0)
Cz(M=1.0)
0.8000
0.7000
Lift Coefficient (Cz)
GW < 9,500kg (20,971lbs), Ng in [-3.5;+6.7]
GW > 9,500kg (20,971lbs), Ng in [-2.7;+5.5]
Cz(M=0.7)
0.9000
Load factor limitations are the same for clean aircraft of for
AIM-9 configuration and only depend on gross weight:
-
Cz(M=0.6)
1.0000
0.6000
0.5000
0.4000
0.3000
0.2000
The Angle of Attack value (incidence, AoA), is not displayed
to the pilot in an angular value.
0.1000
0.0000
-5.00
The ADHEMAR device is using three lights (green, amber
and red) that switch on an off depending on incidence.
Values for which these events occur are not expressed in
True AoA angular value (deg), but in Sector AoA (also in
deg), the relation between “True AoA” (AoAT) and “Sector
AoA” (AoAS) is described in Mirage-IIIE at page PL-G-14. It’s
a linear relation:
0.00
5.00
10.00
15.00
20.00
True Incidence angle (deg)
The second set of measures is related to the supersonic
domain (Mach number between 1.05 and 2.0, using M=1.0
as a reference).
Cz(M=1.0)
Cz(M=1.05)
Cz(M=1.1)
Cz(M=1.2)
Cz(M=1.3)
Cz(M=1.5)
Cz(M=1.9)
Cz(M=2.0)
1.00
0.90
AoAS (AoAT = 0 deg) = 0 deg.
AoAS (AoAT = 18 deg) = 30 deg.
0.80
Lift Coefficient (Cz)
0.70
0.60
0.50
0.40
0.30
-
0.20
Lift coefficient versus AoA.
Lift coefficient will be computed for Mirage III-E and then
applied to all other variants.
From MIRAGE III-E, at page PL-G-13, we have the relation
between true incidence, Mach number, load factor and
gross weight.
Friday, February 15, 2013 – rev.2
0.10
0.00
-5.00
0.00
5.00
10.00
15.00
20.00
True Incidence angle (deg)
Then the last question to be answered is: what happen for
true incidence greater the 20 deg (AoAS of 33) ?
Page - 3
Mirage III Flight Model Identification
I do not have any document describing Mirage III behavior
in such a domain, so I will use a comparative method, using
the Mig-21 as reference.
Mig-21 lift at medium mach number (around M0.6 when
auto flaps device is not activated) laws seems to be quite
similar to the one of the Mirage III in the low incidence
domain : null lift close to null incidence, linear relation
between lift coefficient and incidence sector up to 28. From
an index incidence of 33 to 42, the Mig-21 lift coefficient at
M=0.6 increase from 0.811 to 0.955, corresponding to
+17.5%.
If we transpose that to the Mirage III, we can suppose that
increase the sector incidence from 33 to 42 (so true
incidence from 20 to 25.2 deg corresponding to +26%) will
also lead to an increase of the lift coefficient of +17.5%.
-
The AOA limitations to be followed by the pilot are
documented in Mirage-IIIE at page PL-III-1, 2 and 3.
For all configurations with 2xAIM-9 or 2xR-550, they are
identified as “amber light switching off”, so equivalent to a
Sector AoA of 25 deg. (generally equivalent to a True AoA
of 15 deg).
The True incidence values corresponding to Amber
extinction depending on Mach number are described in
MIRAGE III-E, at page PL-G-13.
Here are the extracted values:
AoAT
15.45
15.96
16.63
17.30
18.09
18.71
19.33
18.26
16.35
There are other factor that limit the incidence of a Mirage
III: first one is the elevon efficiency in low dynamic pressure
that prevent a/c to reach its maximum incidence at very
high flight level, the second being related to actuator
saturation at high dynamic pressure that prevent the a/c to
reach high incidence at high indicated speed, especially in
supersonic and low altitude domain.
Because these limitations are not easy to model and have
few impact on the [M0.2; M1.0] x [SL; FL350] domain that is
my main focus, they will not be taken into account to
compute A:C performances.
C. Mirage-III E with ATAR-9C
AoA limitations.
Mach
0.30
0.40
0.50
0.60
0.70
0.80
0.90
1.00
1.10
incidence, or 42 sector incidence. This is also assumed to be
the case for IAF Nesher.
AoAS
25.75
26.59
27.72
28.84
30.15
31.18
32.21
30.43
27.25
Limits for Mach number under 0.30 will be set to 15.45
(AoAT), and over 1.10 set to 16.35 AoAT.
These limitations will be used to compute flight envelope of
both Mirage III-C and III-E used in the French Air Force
(AdA).
According to discussion between Israel Air Force pilots and
Swiss ones, it appears that IAF has experienced higher
incidence values than the one recommended by the
manufacturer. The limit Sector Incidence has been moved
from Amber extinction up to 42 (corresponding to a true
incidence limit moved from 15-19 to 25.2 deg.) This is very
similar with what happen with Mig-21, where index
incidence limit, recommended as 28, can be moved up to
55.
-
Max A/B Thrust and Drag coefficient.
Seal level (1,000ft)
We start by Mirage III-E at 1,000ft, described in Mirage-IIIE
at page PL-A1.1
Diagram start from take-off at a gross weight of 9,145kg
and give speed (CAS) along time (s) and fuel spent (allowing
estimation of the weight along time with an indicated
density of 0.77 kg/L).
For each point in time, the true speed (V in m/s) and
2
acceleration (dV/dt in m/s ) can be estimated by linear
interpolation, and then, we can compute the Extra Specific
Power (Ps in m/s) according to:
2
Where g = gravity acceleration = 9.81 m/s .
Data extracted from this figure can be summarized by this
table (with Ps values converted in f/s and weight in lbs):
t (s)
CAS (Kts)
Ps (ft/s)
30
35
40
45
49
54
58
62
67
74
76
84
106
200
250
300
350
400
450
500
550
600
650
660
680
700
182
228
273
354
405
455
569
556
455
394
180
83
58
Fuel spent
(L)
133
156
178
200
222
250
279
306
338
386
400
450
600
Weight (lbs)
19,961
19,923
19,885
19,848
19,810
19,763
19,714
19,667
19,614
19,532
19,508
19,423
19,168
The extracted data are now smoothed and resample in the
following figure:
Under these assumptions, Mirage III-CJ incidence
limitations to be considered have to be 25.2 deg of true
Friday, February 15, 2013 – rev.2
Page - 4
Mirage III Flight Model Identification
So we reach the following equation system to be solved:
Ps (ft/s) / Mach
700
600
500
400
300
Meaning that, for all Mach value, we have one equation
with 3 values to find (Thrust, Cx0 and k)
200
100
0
0.30
0.40
0.50
Ps ft/s (extracted)
0.60
0.70
0.80
Ps ft/s (smoothed)
0.90
1.00
1.10
Ps ft/s (sampled)
Providing, for each Mach value, the corresponding Ps value
at a given gross weight, summarized in this table:
Ps ft/s
Est.
(sampled) Weight
0.30
175
19,961
0.40
238
19,916
0.50
310
19,870
0.60
392
19,800
0.70
500
19,763
0.80
575
19,702
0.90
510
19,593
1.00
320
19,532
1.10
0
19,168
It is now possible, for a given mach number to evaluate the
corresponding thrust and drag giving the expected Ps value
at the related weight.
Mach
From the simplified force equation (M mass in kg, S
2
reference surface in m , Thrust force in N, ρ air volumic
3
mass in kg/m :
Even if we assume that Cx0 and k are common to a large
range of Mach number (from 0 to 0.7), we will still have
more unknown values (2) than equations.
In order to get the missing conditions, we will analyze the
sustained load factor at sea level described in Mirage-IIIE
at page PL-A1.11 (for a gross weight of 8,175kg / 18,046
lbs)
The sustained load factor extracted from the diagram can
be smoothed and sampled through the following figure:
Extracted Load Factor
Smoothed Load Factor
8
7
6
5
4
3
2
1
0.40
0.50
0.60
0.70
0.80
0.90
1.00
1.10
Corresponding to the following values:
We can express the relation between Drag, thrust and Ps
(in m/s):
The drag force cannot be supposed exactly deduced form
the minimum drag coefficient (null lift drag) as a small
amount of lift is required, even for such a 1G acceleration
fly path.
The lift coefficient will be directly deduced from the gross
weight and speed in (f.2), lift due to thrust upward
orientation with AoA will be neglected, so we will use a
simplified Drag coefficient formulation:
Mach
0.40
0.50
0.60
0.70
0.80
0.90
1.00
Smoothed Load
Factor
3.19
4.18
5.18
6.10
6.97
7.26
5.90
We can compute sustained turn rate from load factor, and
get the following figure:
With
where
is the aspect ratio (here 1.94)
and (e) the wing efficiency (between 0 and 1)
Friday, February 15, 2013 – rev.2
Page - 5
Mirage III Flight Model Identification
Extracted Turn Rate
Last, we have to balance Thrust curve and null lift drag for
Mach number over 0.8 up to 1.10.
Smoothed Turn Rate
16.00
15.00
At the end of this iterative process, we have frozen:
14.00
-
13.00
12.00
The null lift Drag coefficient value along Mach from 0
to 1.10 : Cx0(Mach)
Zero lift Cx
11.00
0.0400
10.00
0.0350
9.00
8.00
0.0300
7.00
0.0250
6.00
0.0200
5.00
0.40
0.50
0.60
0.70
0.80
0.90
1.00
0.0150
1.10
0.0100
For each Mach number we get the following equations:
0.0050
0.0000
0.00
-
0.10
0.20
0.30
0.40
0.50
0.60
0.70
0.80
0.90
1.00
The relation between Lift and Drag coefficient
Mach number in [0.00;0.85]
Mach number in [0.90;1.10]
Focus on Mach number 0.6 and 0.7, with Sustained load
factor and Extra Specific Power, give 4 equations and allow
computation of the 4 unknown values:
-
-
The Thrust (Maximum A/B) values along Mach number
at sea level.
Cx0 = 0.02
k = 0.29
Thrust(M=0.6) = 16,000 lbs
Thrust(M=0.7) = 18,500 lbs
Seal level Full A/B Thrust
25000
20000
Thrust (lbs)
15000
Then we include all mach value equations (Ps and Ng) to
determine Thrust values and improve the Drag Coefficient
law for higher lift.
10000
5000
1.20
1.10
1.00
0.90
0.80
0.70
0.60
0.50
0.40
0.30
0.20
0.10
0.00
0
Mach
1.00
0.90
Then, in order to check the complete model with the values
extracted from the Manuals, we will compute Extra Specific
Power and Maximum sustained load factor and turn rate
using the non simplified equations:
0.80
0.70
0.60
Cz 0.50
0.40
0.30
0.20
(f.10)
0.10
0.00
0.00
0.05
0.10
0.15
0.20
0.25
0.30
0.35
0.40
0.45
Cx
7.00
(f.11)
6.00
Cz/Cx
5.00
Here are the graphics and tables that compare
performances forecasted by the model with the one
extracted from the manual (even if smoothed or sampled).
4.00
3.00
2.00
1.00
0.00
0.00
0.10
0.20
0.30
0.40
0.50
0.60
0.70
0.80
0.90
1.00
Cz
Friday, February 15, 2013 – rev.2
Page - 6
1.10
Mirage III Flight Model Identification
Acceleration
Sustained load factor and turn rate
Mach (document)
Extracted Load Factor
Mach (Computed)
Smoothed Load Factor
Computed Load Factor
8
1.20
1.00
7
0.80
6
0.60
5
0.40
4
0.20
3
0.00
0
10
20
30
40
50
60
70
80
time (s)
Mach
(document)
0.31
0.38
0.46
0.54
0.62
0.69
0.77
0.85
0.92
1.00
1.02
1.05
1.08
t (s)
0
5
10
15
19
24
28
32
37
44
46
54
76
2
1
Mach
(Computed)
0.31
0.39
0.46
0.54
0.61
0.70
0.77
0.84
0.92
1.00
1.01
1.05
1.09
0.40
Error
0.0%
0.6%
0.7%
1.5%
-2.0%
1.5%
0.4%
-0.8%
0.0%
-0.2%
-0.3%
1.2%
3.5%
0.50
0.60
0.70
Extracted Turn Rate
0.80
0.90
Smoothed Turn Rate
1.00
1.10
Computed Turn Rate
16.00
15.00
14.00
13.00
12.00
11.00
10.00
9.00
8.00
7.00
6.00
5.00
0.40
Extra Specific Power
0.50
0.60
Ps (ft/s) / Mach
Ps ft/s (extracted)
Ps ft/s (smoothed)
Ps ft/s (sampled)
Ps ft/s (computed @ 9,050kg)
Mach
700
600
500
400
300
200
100
0
0.30
Mach
0.30
0.40
0.50
0.60
0.70
0.80
0.90
1.00
0.40
0.50
0.60
Ps ft/s
(sampled from
Manual)
175
238
310
392
500
575
510
320
0.70
0.80
0.90
1.00
Ps ft/s
(computed
@ 9,050kg)
Error
176
235
306
387
494
565
505
300
0.7%
-1.1%
-1.4%
-1.3%
-1.2%
-1.7%
-1.0%
-6.2%
1.10
0.40
0.45
0.50
0.55
0.60
0.65
0.70
0.75
0.80
0.85
0.90
0.95
1.00
0.70
0.80
0.90
Turn
Rate
Load
Factor
(Forecast)
(Smoothed
Manual)
(Smoothed
Manual)
3.15
3.62
4.09
4.61
5.11
5.68
6.23
6.67
7.09
7.27
7.32
6.99
5.98
12.50
13.00
13.40
13.80
14.00
14.12
14.20
14.25
14.25
13.90
13.20
12.07
9.60
3.19
3.68
4.18
4.70
5.18
5.65
6.10
6.55
6.97
7.22
7.26
7.01
5.90
Turn
Rate
Load
Factor
(Forecast)
12.33
12.76
13.12
13.51
13.80
14.22
14.52
14.53
14.49
14.00
13.32
12.04
9.75
1.00
1.10
Error
(T)
Error
(Ng)
-1.3%
-1.8%
-2.1%
-2.1%
-1.4%
0.7%
2.2%
2.0%
1.7%
0.7%
0.9%
-0.2%
1.5%
-1.2%
-1.7%
-2.0%
-2.0%
-1.4%
0.7%
2.2%
1.9%
1.7%
0.7%
0.9%
-0.2%
1.5%
At 36,000ft
Thrust at 36,000ft and null lift Drag coefficient (Cx0) will be
determined using acceleration diagram from M0.9 to 2.0
described in Mirage-IIIE at page PL-A1.13 (for a gross
weight of 8,600kg at run start.
From this diagram we compute Extra specific power (Ps) in
the following table and curves:
Friday, February 15, 2013 – rev.2
Page - 7
Mirage III Flight Model Identification
16000
14000
12000
10000
8000
6000
4000
2000
2.40
2.30
2.20
2.10
2.00
1.90
1.80
1.70
1.60
1.50
1.40
1.30
1.20
1.10
1.00
0.90
0.80
0.70
0.60
0.50
0
0.40
18,985
18,918
18,830
18,708
18,595
18,487
18,361
18,220
18,084
17,944
17,752
17,455
0.30
160
150
130
140
162
185
207
229
250
265
215
120
18000
0.20
0.90
1.00
1.10
1.20
1.30
1.40
1.50
1.60
1.70
1.80
1.90
2.00
Full A/B Thrust
0.10
Est.
Weight
0.00
Ps ft/s
(sampled)
Thrust (lbs)
Mach
Mach
And this allows to simulate the acceleration run from M0.9
and to compare forecasted values with the one from the
manual:
Extracted
Ps (ft/s) / Mach
Sample
Computed
150
200
2.00
300
1.90
1.80
250
1.70
1.60
200
1.50
1.40
150
1.30
100
1.20
1.10
50
1.00
0.90
0
0
0.90
1.00
1.10
1.20
1.30
Ps ft/s (extracted)
1.40
1.50
1.60
Ps ft/s (smoothed)
1.70
1.80
1.90
50
100
250
300
2.00
Ps ft/s (sampled)
t (s)
We add, from sustained load factor diagram in Mirage-IIIE
at page PL-A1.11 (for a gross weight of 8,175kg / 18,046
lbs), that sustained load factor at M0.8 is around 1.9G, and
last we consider that thrust is constant for mach number
bellow 0.8.
The Null lift Drag coefficient variation along the complete
Mach range is chosen as:
Zero lift Cx
0.0400
0.0350
0.0300
0
15
30
45
60
75
90
105
120
135
150
165
180
Mach
Ps ft/s
Mach
(extracted)
(smoothed)
(Computed)
0.90
0.99
1.06
1.12
1.17
1.23
1.30
1.36
1.43
1.50
1.57
1.64
1.71
160
152
132
128
134
147
161
176
190
206
220
236
252
0.90
0.99
1.06
1.12
1.18
1.24
1.30
1.37
1.44
1.51
1.58
1.65
1.72
Error
0.0%
-0.1%
0.1%
0.4%
0.5%
0.6%
0.5%
0.5%
0.7%
0.6%
0.7%
0.8%
0.7%
0.0250
0.0200
Other altitudes.
Here, the Thrust curve will be determined using Sustained
load factor bellow at 10,000, 20,000 and 30,000ft.
0.0150
0.0100
0.0050
0.0000
0.00
0.20
0.40
0.60
0.80
1.00
1.20
1.40
1.60
1.80
2.00
2.20
The Thrust curve:
Friday, February 15, 2013 – rev.2
Page - 8
Mirage III Flight Model Identification
At 10,000ft
At 30,000ft
Extracted Load Factor
Smoothed Load Factor
Computed load Factor
Extracted Load Factor
8
Smoothed Load Factor
Computed load Factor
5.00
7
4.00
6
5
3.00
4
3
2.00
2
1
0.40
0.50
0.60
0.70
0.80
0.90
1.00
1.10
1.20
1.30
1.00
0.40 0.50 0.60 0.70 0.80 0.90 1.00 1.10 1.20 1.30 1.40 1.50 1.60 1.70 1.80 1.90 2.00 2.10
Extracted Turn Rate
Smoothed Turn Rate
Computed Turn Rate
Extracted Turn Rate
12.00
Smoothed Turn Rate
Computed Turn Rate
8.00
11.00
7.00
10.00
6.00
9.00
5.00
8.00
7.00
4.00
6.00
3.00
5.00
0.40
0.50
0.60
0.70
0.80
0.90
1.00
1.10
1.20
1.30
2.00
At 20,000ft
1.00
Extracted Load Factor
Smoothed Load Factor
Computed load Factor
5.00
0.00
0.40 0.50 0.60 0.70 0.80 0.90 1.00 1.10 1.20 1.30 1.40 1.50 1.60 1.70 1.80 1.90 2.00 2.10
4.00
Military Thrust
Military Thrust is computed to fit the sustained load factor
values described in Mirage-IIIE at page PL-A1.9 (for a gross
weight of 8,175kg / 18,046 lbs).
3.00
2.00
At Sea Level
Ng (Extracted)
Ng (Sampled)
1.00
0.40
0.50
0.60
0.70
0.80
0.90
Extracted Turn Rate
1.00
1.10
1.20
1.30
Smoothed Turn Rate
1.40
1.50
1.60
1.70
5.00
Computed Turn Rate
8.00
4.00
7.00
3.00
6.00
5.00
2.00
4.00
1.00
3.00
0.40
0.50
0.60
0.70
0.80
0.90
1.00
1.10
2.00
1.00
0.00
0.40
0.50
0.60
0.70
0.80
0.90
1.00
1.10
1.20
Friday, February 15, 2013 – rev.2
1.30
1.40
1.50
1.60
1.70
Page - 9
Mirage III Flight Model Identification
At 10,000ft
Ng (Extracted)
When Mach number is between 0.9 and 1.05, each AIM-9
or R-550 with its pylon and rail add 0.002 to the airplane Cx.
Ng (Sampled)
5.00
When Mach number is over 1.05, each AIM-9 or R-550 with
its pylon and rail add 0.00125 to the airplane Cx.
4.00
Seal Level acceleration from M0.32 with 2 AIM-9
1.10
1.00
3.00
0.90
0.80
Mach
2.00
0.70
0.60
0.50
1.00
0.40
0.50
0.60
0.70
0.80
0.90
1.00
1.10
0.40
0.30
30
At 20,000ft
40
50
60
70
80
90
100
110
120
Time (s)
Ng (Extracted)
Ng (Sampled)
Extracted
Computed
3.00
2.00
1.00
0.40
0.50
0.60
0.70
0.80
0.90
1.00
1.10
At 30,000ft
Ng (Extracted)
t (s)
Mach
(Extracted)
Mach
(Computed)
Error
30
40
50
60
70
80
90
100
0.32
0.46
0.61
0.77
0.92
1.00
1.02
1.02
0.32
0.47
0.62
0.78
0.93
1.00
1.03
1.03
0.0%
2.2%
1.1%
2.0%
1.2%
0.0%
1.1%
1.8%
Ng (Sampled)
3.00
Acceleration from M0.9 with 2 AIM-9 at 36,000ft
2.00
1.90
1.80
1.70
1.60
Mach
2.00
1.50
1.40
1.30
1.20
1.10
1.00
1.00
0.40
0.50
0.60
0.70
0.80
0.90
1.00
1.10
0.90
0
50
100
150
200
250
300
350
Time (s)
Extracted
For higher altitude the same variation along Mach number
is kept, maximum value is defined to fit maximum speed.
-
External loads Drag.
Definition of impact of external loads (here 2 AIM-9 or R550 with their rail and pylons) is deduced from Full A/B
acceleration figures in Mirage-IIIE at page PL-A3.1 for
1,000ft and PL-A3-13 at 36,000ft (related to the Sidewider
configuration).
The following figures show acceleration values comparison
between those read from manual and those forecasted
while applying the following rule:
When Mach number is under 0.9, each AIM-9 or R-550 with
its pylon and rail add 0.001 to the airplane Cx.
Friday, February 15, 2013 – rev.2
Computed
t (s)
Mach
(Extracted)
Mach
(Computed)
Erreur
0
15
30
45
60
75
90
105
120
135
0.90
0.99
1.05
1.10
1.15
1.20
1.24
1.29
1.34
1.39
0.90
0.97
1.03
1.09
1.13
1.18
1.23
1.28
1.33
1.38
-0.1%
-1.5%
-1.5%
-1.7%
-1.2%
-1.2%
-1.2%
-1.2%
-1.3%
-0.9%
Page - 10
Mirage III Flight Model Identification
150
165
180
1.44
1.49
1.54
1.43
1.48
1.53
Then we compute acceleration fly path from the computed
thrust and we get the following:
-0.9%
-0.9%
-1.2%
0 AA2
RL 1,000 AA2
Acceleration (Max Thrust AB)
90
D. Mirage-III C with ATAR-9B
80
All aerodynamic data will be kept from Mirage-IIIE to
Mirage-III C, we only have to recomputed Thrust data (Full
A/B and Military).
60
Time (s)
The thrust values will be determined using performances
diagram for clean aircraft from Mirage-III C :
70
50
40
30
20
-
PL-P2.1: Acceleration at sea level, GW=8,250kg
PL-P2.7: Acceleration at 36,000ft.
PL-P2.10: Sustained load factor at MIL Thrust
PL-P2.12: Sustained load factor at Max A/B Thrust
10
0
0.30
0.50
0.60
0.70
Acceleration at sea level, GW=9,145kg
Acceleration at 36,000ft, GW=8,600Kg (-545 kg)
0.90
1.00
1.10
1.20
Acceleration at 36,000ft
Measures performed with a GW of 7,705 kg / 17,000 lbs
From acceleration figure (Speed along time), we compute
the Excess Power (Extracted Ps), smooth it by sampling and
compute Thrust value to fit.
Extracted Ps(ft/s)
Concerning the Sustained Load factor diagram we will use
the gross-weight that allow the best fitting with the thrust
values computed from acceleration at sea level.
So, we assume for the Mirage III-C
Computed Ps (ft/s)
Sampled Ps(ft/s)
250
200
150
-
Acceleration at 36,000ft performed at a GW=7,705kg
Sustained load factor at a GW=7,600 kg
-
Level flight Acceleration
100
50
Acceleration at 1,000ft
Measures performed with a GW of 8,250 kg / 18,212 lbs
0
1.00
From acceleration figure (Speed along time), we compute
the Excess Power (Extracted Ps), smooth it by sampling and
compute Thrust value to fit.
1.10
1.20
1.30
1.40
Ps (Sample)
1.50
1.60
1.70
1.80
1.90
2.00
Then we compute acceleration fly path from the computed
thrust and we get the following:
36000 AA4
Ps Extracted (ft/s)
0.80
Mach
The gross weight is only known for the first diagram, so we
will consider that the weight differences is the same as the
one we can compute from M-III E between the two
acceleration diagram:
-
0.40
RL 36,000 AA4
36000 AA2
Acceleration (Max Thrust AB)
Ps Computed(ft/s)
180
600
165
150
135
500
120
Time (s)
105
400
90
75
60
300
45
30
15
200
0
0.90
1.00
1.10
1.20
1.30
1.40
1.50
1.60
1.70
1.80
1.90
2.00
Mach
100
0
0.30
0.40
0.50
0.60
0.70
0.80
Friday, February 15, 2013 – rev.2
0.90
1.00
1.10
1.20
Sustained Load Factor
Measures performed with a GW of 7,600 kg / 16,780 lbs
Page - 11
Mirage III Flight Model Identification
Sustained Load Factor at 0ft.
Here the sustained load factor and turn rate are computed
from thrust values deduced form SL acceleration path.
Sustained Load Factor
7
(Extracted values read from figures, then smoothed,
compared to computed):
6
Sustained Load Factor
4
5
8
3
7
2
6
1
5
0.50
0.60
0.70
0.80
Extracted
4
0.90
1.00
Sample Ng
1.10
1.20
1.30
1.20
1.30
Computed Ng
3
Sustained Turn Rate
2
12.00
1
0.50
0.60
0.70
Extracted
0.80
0.90
1.00
Sample Ng
1.10
1.20
10.00
Computed Ng
8.00
Sustained Turn Rate
6.00
16.00
14.00
4.00
12.00
10.00
2.00
8.00
0.00
6.00
0.50
0.60
0.70
Extracted
4.00
0.80
0.90
1.00
Sample Turn rate
1.10
Computed Turn Rate
2.00
0.00
0.50
0.60
0.70
Extracted
Mach
0.50
0.60
0.70
0.80
Sample Turn rate
0.90
1.00
1.10
1.20
Mach
Computed Turn Rate
Sample Sample Computed Computed Error
Ng
Turn rate
Ng
Turn Rate
Ng
Error
T
0.50
2.60
8.22
2.59
8.19
-0.27% -0.32%
0.60
3.40
9.27
3.41
9.31
0.39%
0.43%
Sample
Turn
rate
0.70
4.10
9.72
4.11
9.75
0.22%
0.24%
Sample
Ng
Computed
Ng
Computed
Turn Rate
Error
Ng
Error
T
0.80
4.90
10.26
4.91
10.30
0.30%
0.32%
0.90
5.70
10.67
5.70
10.67
-0.03% -0.03%
3.80
12.15
4.01
12.82
5.44%
5.46%
0.95
5.80
10.29
5.83
10.35
0.52%
0.54%
4.47%
1.00
5.50
9.26
5.51
9.27
0.15%
0.15%
2.42%
1.05
4.80
7.65
4.92
7.86
2.54%
2.66%
4.30
6.51
4.26
6.44
-1.03% -1.09%
4.60
5.30
12.40
12.32
4.81
5.44
12.96
12.62
4.61%
2.68%
0.80
6.40
13.10
6.38
13.01
-0.32%
-0.67%
1.10
0.90
7.50
13.69
7.53
13.70
0.39%
0.05%
1.15
4.00
5.76
4.04
5.83
1.08%
1.20
2.80
3.73
2.72
3.60
-2.95% -3.38%
0.95
7.50
12.97
7.45
12.83
-0.68%
-1.04%
1.00
6.50
10.65
6.39
10.43
-1.63%
-2.01%
1.05
5.80
9.02
5.89
9.13
1.53%
1.23%
1.10
3.50
5.05
4.12
6.00
17.61%
18.64%
1.15%
Sustained load factor at 20,000ft
Here, the thrust values are computed to fit the sampled
sustained load factor and turn rate.
Sustained Load factor at 10,000ft
Here, the thrust values are computed to fit the sampled
sustained load factor and turn rate.
Friday, February 15, 2013 – rev.2
Page - 12
Mirage III Flight Model Identification
Sustained Load Factor
Sustained Load Factor
4.5
3.5
4
3
3.5
2.5
3
2.5
2
2
1.5
1.5
1
1
0.50
0.60
0.70
0.80
0.90
Extracted
1.00
1.10
1.20
Sample Ng
1.30
1.40
1.50
1.60
0.60
0.70
0.80
0.90
Computed Ng
1.00
1.10
1.20
Extracted
1.30
1.40
1.50
Sample Ng
1.60
1.70
1.80
1.90
2.00
1.80
1.90
2.00
Computed Ng
Sustained Turn Rate
Sustained Turn Rate
7.00
9.00
8.00
6.00
7.00
5.00
6.00
4.00
5.00
3.00
4.00
3.00
2.00
2.00
1.00
1.00
0.00
0.60
0.00
0.50
0.60
0.70
0.80
Extracted
0.90
1.00
1.10
1.20
Sample Turn rate
1.30
1.40
1.50
0.80
0.90
1.00
1.10
1.20
1.30
1.40
Sample Turn rate
1.50
1.60
1.70
Computed Turn Rate
Computed Turn Rate
Mach
Mach
0.70
Extracted
1.60
Sample Sample Computed Computed
Ng
Turn rate
Ng
Turn Rate
Error
Ng
Error
T
Sample Sample Computed Computed
Ng
Turn rate
Ng
Turn Rate
Error
Ng
Error
T
0.60
1.50
3.45
1.50
3.46
0.11%
0.20%
2.05
4.74
2.05
4.74
0.05%
0.07%
0.50
1.75
5.11
1.76
5.14
0.46%
0.68%
0.70
0.60
2.35
6.30
2.36
6.33
0.37%
0.45%
0.80
2.65
5.69
2.65
5.69
0.06%
0.07%
3.10
6.04
3.09
6.02
-0.29%
-0.32%
0.70
3.00
7.19
3.00
7.18
-0.14% -0.16%
0.90
0.80
3.65
7.80
3.66
7.82
0.14%
0.15%
0.95
3.10
5.73
3.08
5.69
-0.52%
-0.59%
0.90
4.20
8.06
4.21
8.08
0.28%
0.29%
1.00
2.95
5.15
2.94
5.12
-0.43%
-0.49%
0.95
4.15
7.54
4.18
7.59
0.60%
0.64%
1.05
3.02
5.03
3.02
5.03
-0.07%
-0.08%
-0.20% -0.21%
1.10
3.07
4.89
3.08
4.92
0.45%
0.50%
3.10
4.73
3.08
4.70
-0.52%
-0.59%
-0.59%
1.00
4.00
6.89
3.99
6.87
1.05
4.10
6.73
4.12
6.78
0.58%
0.62%
1.15
1.10
4.15
6.51
4.15
6.51
-0.10% -0.11%
1.20
3.10
4.53
3.08
4.51
-0.52%
-0.62% -0.66%
1.30
3.10
4.18
3.11
4.20
0.42%
0.47%
3.10
3.89
3.10
3.88
-0.05%
-0.06%
0.12%
1.15
4.12
6.18
4.09
6.14
1.20
4.00
5.74
3.96
5.67
-1.12% -1.19%
1.40
1.30
3.20
4.16
3.14
4.08
-1.80% -2.00%
1.50
3.00
3.50
3.00
3.50
0.11%
1.45%
1.60
2.30
2.40
2.38
2.50
3.51%
4.31%
1.70
1.70
1.50
1.66
1.45
-2.19%
-3.36%
1.80
1.30
0.86
1.30
0.85
-0.26%
-0.64%
1.40
2.00
2.20
2.03
2.24
1.93%
Sustained load factor at 30,000ft
Here, the thrust values are computed to fit the sampled
sustained load factor and turn rate.
E. Mirage-III CJ
-
Early version (up to 1971/74)
The Mirage-IIICJ early version keeps all data from Mirage-III
C except its AoA limitations that are no more related to
ADHEMAR system, but set to a value in AoA sector of 42,
corresponding to 25.2 true AoA degrees.
Friday, February 15, 2013 – rev.2
Page - 13
Mirage III Flight Model Identification
The late version of Mirage III-CJ is describes airframes
retrofitted with ATAR-9C3 engines.
Nesher engines are assumed to be ATAR-9C3 and then
ATAR-9C5, but there is no known thrust change between
the two sub versions, to thrust is assumed to be the same
as the regular AdA Mirage-IIIE.
The late Mirage-IIICJ keeps all data from Mirage-III E except
its weight (airframe, fuel and loads) that come from
Mirage-III C and AoA limitations that are no more related to
ADHEMAR system, but set to a value in AoA sector or 42,
corresponding to 25.2 true AoA degrees.
Nesher Incidence limitations are supposed to be identical
to the one of the Mirage-IIICJ: a value in AoA sector of 42,
corresponding to 25.2 true AoA degrees.
-
Late version (from 1971/74)
F. Nesher - Mirage-5F
The Mirage 5F is assumed to have the same aerodynamic
definition as the others (same hypothesis already made for
Mirage-IIIC vs Mirage-IIIE).
Friday, February 15, 2013 – rev.2
Page - 14
Mirage III Flight Model Identification
G. Appendix and Figures.
-
Standard Atmosphere.
h
(ft)
0
5,000
10,000
15,000
20,000
25,000
30,000
35,000
40,000
45,000
50,000
55,000
60,000
65,000
70,000
75,000
80,000
85,000
90,000
95,000
100,000
-
A(z)
(M=1 ft/s)
1116.45
1097.09
1077.39
1057.32
1036.86
1015.98
994.67
972.9
968.08
968.08
968.08
968.08
968.08
968.08
968.08
968.08
968.08
968.08
968.08
968.08
968.08
rho(z)
3
slug / ft
0.0023769
0.0020481
0.0017553
0.0014957
0.0012665
0.0010652
0.0008894
0.0007366
0.0005851
0.0004601
0.0003618
0.0002846
0.0002238
0.000176
0.0001384
0.0001089
8.554E-05
6.653E-05
5.15E-05
4.011E-05
3.138E-05
M=1
(m/s TAS)
340.29
334.39
328.39
322.27
316.03
309.67
303.18
296.54
295.07
295.07
295.07
295.07
295.07
295.07
295.07
295.07
295.07
295.07
295.07
295.07
295.07
Corrected Air Speed (CAS).
CAS
(Mach / ft)
0
5,000
10,000
15,000
20,000
25,000
30,000
35,000
40,000
45,000
50,000
55,000
60,000
65,000
70,000
75,000
80,000
85,000
90,000
95,000
100,000
0.00
0.50
1.00
1.25
1.50
2.00
3.00
0
0
0
0
0
0
0
0
0
0
0
0
0
0
0
0
0
0
0
0
0
330
305
275
250
230
205
185
165
145
130
115
105
93
83
75
66
60
54
48
42
40
660
610
555
520
475
430
390
350
315
280
250
220
195
174
157
139
126
114
101
89
83
825
760
700
640
585
525
475
435
400
360
325
285
255
227
205
182
165
149
133
116
108
1000
920
840
775
710
640
585
525
475
440
390
350
320
285
257
229
207
186
166
146
136
1325
1225
1125
1025
950
865
790
720
650
590
535
475
425
386
342
304
274
248
221
194
181
1975
1835
1695
1525
1430
1315
1200
1110
1000
890
825
725
635
565
510
454
410
370
330
290
270
Friday, February 15, 2013 – rev.2
Page - 15
Mirage III Flight Model Identification
H. Bibliography.
-
st
ROYAL AUSTRALIAN AIR FORCE FLIGHT MANUAL MIRAGE IIIO AND IIID (AAP 7213.003-1, 1 June 1978), from www.flightmanuals-on-cd.com LTD.
MANUEL D’UTILISATION AVION MIRAGE III E – PLANCHES (, Edition Avril 1965).
Computed Performance charts : NATOPS_FLIGHT_MANUAL-Mirage-IIICJ
Computed Performance charts : NATOPS_FLIGHT_MANUAL-Mirage-IIICJ
Computed Performance charts : NATOPS_FLIGHT_MANUAL-Mirage-IIIE
Computed Performance charts : NATOPS_FLIGHT_MANUAL-Mirage-5F/Nesher
Friday, February 15, 2013 – rev.2
Page - 16
Mirage III Flight Model Identification
Table of Contents
A.
Purpose and scope. ..................................................................................................................................................................... 1
B.
Data Collection. ........................................................................................................................................................................... 1
-
Dimensional Data. .................................................................................................................................................................. 1
-
Weight and Balance. .............................................................................................................................................................. 1
Empty Weight ............................................................................................................................................................................. 1
Fuel Weight ................................................................................................................................................................................. 2
Load-out Weight ......................................................................................................................................................................... 2
Gross Weight. .............................................................................................................................................................................. 2
-
Speed and Load Factor limitations......................................................................................................................................... 2
-
Angle of attack (AoA) ............................................................................................................................................................. 3
-
Lift coefficient versus AoA. .................................................................................................................................................... 3
-
AoA limitations. ..................................................................................................................................................................... 4
C.
Mirage-III E with ATAR-9C ........................................................................................................................................................... 4
-
Max A/B Thrust and Drag coefficient. .................................................................................................................................... 4
Seal level (1,000ft) ...................................................................................................................................................................... 4
At 36,000ft .................................................................................................................................................................................. 7
Other altitudes. ........................................................................................................................................................................... 8
Military Thrust ............................................................................................................................................................................ 9
D.
External loads Drag. ............................................................................................................................................................. 10
Mirage-III C with ATAR-9B ......................................................................................................................................................... 11
-
Level flight Acceleration ...................................................................................................................................................... 11
Acceleration at 1,000ft ............................................................................................................................................................. 11
Acceleration at 36,000ft ........................................................................................................................................................... 11
-
Sustained Load Factor .......................................................................................................................................................... 11
Sustained Load Factor at 0ft. .................................................................................................................................................... 12
Sustained Load factor at 10,000ft ............................................................................................................................................. 12
Sustained load factor at 20,000ft.............................................................................................................................................. 12
Sustained load factor at 30,000ft.............................................................................................................................................. 13
E.
Mirage-III CJ .............................................................................................................................................................................. 13
-
Early version (up to 1971/74) .............................................................................................................................................. 13
-
Late version (from 1971/74) ................................................................................................................................................ 14
F.
Nesher - Mirage-5F ................................................................................................................................................................... 14
G.
Appendix and Figures. ............................................................................................................................................................... 15
H.
-
Standard Atmosphere. ......................................................................................................................................................... 15
-
Corrected Air Speed (CAS). .................................................................................................................................................. 15
Bibliography. ............................................................................................................................................................................. 16
Friday, February 15, 2013 – rev.2
Page - 17