1
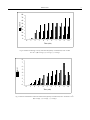
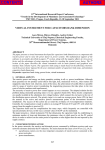
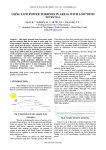
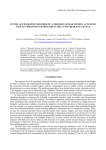
THE PUBLISHING HOUSE
OF THE ROMANIAN ACADEMY
PROCEEDINGS OF THE ROMANIAN ACADEMY, Series A,
Volume 8, Number 3/2007, pp. 000–000
ULTRASONIC METHOD TO DETERMINE THE PHENOMENA INSIDE A CONTINOUS
CHANGING SYSTEM
Mihaela PICU
“Dunarea de Jos” Galati University, e-mail: [email protected]
Abstract. This work studies the way in which ultrasonic waves can detect the development of a
continuous changing system, knowing that wave propagation is non-destructive and does not modify
with the crossed system. These changes influence a lot the measurable parameters of ultrasounds. The
variation of both velocity and attenuation coefficient were studied during ultrasounds propagation,
while crossing a system which passes from liquid to gel. As an application for this phenomenon, the
optimum conditions for milk coagulation were determined; this is very important in food industry.
Ultrasounds velocity and attenuation measurements were made depending on the temperature (150C,
250C, 350C) and concentration of CaCl2 solution 40% added to the system (0.10g/l, 0.15g/l, 0.12g/l).
Key words: Ultrasound, Velocity, Attenuation coefficient, Coagulation, Gel.
1. INTRODUCTION AND THEORY
Ultrasounds reflect on any discontinuity, which exists in an environment, leading to differences of
measurable parameters. [7]
The scalar wave equation, that governs wave propagation phenomena in ideal liquids, is given by:
⎛ ∂ 2ψ ∂ 2ψ ∂ 2ψ ⎞
⎜
⎟
= v ⎜ 2 + 2 + 2 ⎟ = v2 Δψ
∂y
∂z ⎠
⎝ ∂x
∂t 2
∂ 2ψ
2
(1)
where: ψ is the wave function, usually describing displacements and v is propagation velocity.
Only longitudinal waves propagate in fluids. Their propagation velocity vl is given by:
v2l = 1/ρβ
(2)
where β is the compressing coefficient given by de β=1/γp (γ adiabatic coefficient, p pressure) and ρ density.
But not all the liquids can be approximated as ideal. In these liquids, attenuation phenomena must be
taken into account. The attenuation coefficient (α) is a sum between the absorption coefficient (αa) which is
proportional with the wave frequency and does not depend on the scattered size in the environment and the
dispersion coefficient (αd), or scatter coefficient, which depends on frequency and also on the size of the
scatterings:
α = αa + αd
(3)
The α coefficient depends on the nature of the environment, but also on the wave type or wave length,
but it can be considered, as a first approximation, as constant for an environment and for a wave with given
characteristics.
If the relaxation is neglected, the absorption coefficient is:
αa =
ω2 τ
2 v ( 1 + ω2 τ 2 )
(4)
Mihaela PICU
2
where: ω is pulsation, τ is relaxation time and v is the wave propagation velocity.
If the wave frequency is much lower then the relaxation frequency ω2τ2<<1, the attenuation constant
will be:
αa =
ω2 τ
2v
(5)
In the case of very low density, the absorption coefficient is regarded as a sum of parameters given by
separate phenomena, as viscosity, conductivity and radiation:
α = αvisc + αcond + αrad
(6)
8 π2 f 2η
αvisc =
3 ρ v3
(7)
⎛ χ −1 ⎞ q
⎟⎟
αcond = ⎜⎜
⎝ χ ⎠ 2v
(8)
where:
where: f is the wave frequency, η is viscosity, χ is the conductivity coefficient and q is given by Newton’s
law:
T-T1 = (T0-T1)⋅e-qt
(9)
where: (T-T1) is the temperature excess at the t moment and (T0-T1) is the temperature excess at the moment
t0.
Practically only the first two parameters in equation (6) are taken in consideration for the linear
processes.
For high frequencies, when the wave length is much higher than the scatterers diameter (λ<< d), the
attenuation takes place on each scatterer, and the attenuation coefficient is proportional with the square
frequency.
If λ ≅ d, the ultrasounds are attenuated by the interferences of different scatterers and the attenuation is
mainly given by the absorption processes.
When λ >> d, the ultrasounds are diffused by small particles which form the propagation environment
and the attenuation is given by the thermal conduction, case in which the attenuation coefficient is
proportional with biquadrate frequency [11].
It can be said that the size of the attenuation coefficient can give information regarding the physical
characteristics of the environment, which leads to a development of new ultrasounds measuring, and control
methods.
This work refers to an ultrasonic method to observe the gel formation with the application in the milk
coagulation process, bound for the milk industry, the research laboratories from this field, etc.
This phenomenon is the result of casein limited proteolysis. The chymosine action develops in two
stages: the first stage is enzymatic and the second is coagulation. In the second stage, only after the physicochemical transformations of the micelles, which lead to the formation of a three-dimensional network, the
aggregation begins [2], [4], [8], [9].
In the purpose of determining the final moment of milk coagulation some methods are known:
• visual observation method, which consists in taking of samples and in establishing with the naked eye
the coagulation moment; this method depends on the visual capacity of the person who makes the
determinations, so, it is extremely subjective [1], [3], [10].
• physical methods (electronic scanning, viscosity determination and electrocynetical phenomena,
particles counting, optical methods); these methods imply a long time of study, during which the system
changes, they cannot be adapted on line in the technological flow so, the results have distortions
sometimes [5], [6].
3
Ultrasonic method to determine the phenomena inside continuous changing system
•
viscoelastimeterical and manometerical methods, which permit observing of the evolution of the system
reological properties by taking of samples; by using these methods, the results are different (they depend on
authors and on techniques used) because they are expressed in arbitrary units [10], [12].
Ultrasonic methods eliminate these disadvantages because it permits the establishing, with accuracy, of
the final moment of milk coagulation - this moment being very important for the milk products quality [8].
2. MATERIAL AND METHODS
This method is based on the measurements, with an ultrasonic installation (Fig. 1), of ultrasonic
parameters: ultrasonic velocity-v(m/s) and attenuation coefficient-α(dB/m), during their propagation through
the milk: the transducer (2) is mounted on the tank's wall (1), which is connected to the flaw detector (4) with
a coaxial cable (3). On the screen (5) all the ultrasonic interest parameters can be read. From the
interpretation of these values, it is possible to determine all of the phases of the milk coagulation. Next, it will
be observed the variation of velocity and attenuation coefficient of ultrasonic waves during the milk
coagulation process [10].
Fig. 1 Experimental set-up for ultrasonic velocity and attenuation coefficient determination
for oversee the milk coagulation process
3. RESULTS
3.1 Influence of the temperature on the milk coagulation process
In the experiments 5ml pepsin solution 1% in 250ml of milk are used. For each sample, the 0.20g/l of
40% CaCl2 solution is added. The ultrasonic velocity (Fig. 2) and attenuation coefficient (Fig. 3) are
measured at 150C, 250C and 350C.
The ultrasonic velocity is bigger for the milk coagulation at the T=350C (Fig. 2). The slope of the curve
is bigger in the first minutes. This fact indicates the aggregate formation – distinctive phenomenon of the gel.
In the first 30s, the system does not suffer important modifications (δ(Δv) =3m/s). In this first stage, only one
fraction of the casein molecule is hydrolyzed, so the phenomenon begins after 30s. After this moment, the
ultrasonic velocity begins to increase, this indicates that the system begins the transformations and the first
micelles appear. The transformations continue on the 7min period therefore in this period the coagulation
process occurs. From the 8 min, the velocity variation is abrupt, thus in only one minute, the ultrasonic
velocity increases with 15,5m/s. This lead out of one’s initial curve is associated with the first contraction of
the three-dimensional network apparition. This phenomenon precedes the beginning of syneresis.
The attenuation coefficient has an important increase during the whole period of the micelles
apparition (Fig. 3). This behaviour is in a concordance with the phenomenon of transforming the fluid state
into the gel state. The abrupt decreasing of the attenuation coefficient coincides with the increasing of the
ultrasonic velocity, therefore the modification of the system structure is pointed out.
Mihaela PICU
4
For the 250C and 150C temperatures, the ultrasonic velocity increases very slowly (δ(Δv) =25,4m/s,
respectively δ(Δv) =11,1m/s in 10min). Also, the variation of the attenuation coefficient is less significant
(δ(Δα) =1,16dB/m, respectively δ(Δα) =0,23dB/m in 10min), therefore it is confirmed the fact that the
system has not modified its structure. In conclusion, Table 1 presents the time of the apparition of the first
micelles.
Table 1 Time of the apparition of the
first micelles versus temperature
T (0C)
t (min)
15
2
25
1.5
35
0.5
Table 2 Time of the apparition of the first
micelles versus CaCl2 concentration
Solution 40% CaCl2 (g/l)
t (min)
0.10
4
0.15
1
0.20
0.5
3.2 Influence of CaCl2 concentration on the milk coagulation process
In the experiments 5ml pepsin solution 1% in 250ml of milk are used. The temperature of the samples
is constant T=350C. The ultrasonic velocity (Fig. 4) and attenuation coefficient (Fig. 5) for the different
quantities (0.10g/l, 0.15g/l and 0.20g/l) of 40% CaCl2 solution are measured. From Fig. 4 it can be observed
that the ultrasonic velocity is bigger during the milk coagulation with the add of 0.20g/l CaCl2 solution
concentration, compared to the samples with 0.15g/l and 0.10g/l CaCl2 solutions.
If for the sample with 0.20g/l CaCl2 solution, the velocity attains a bearing after 6min (therefore the
system attains an equilibrium), for the sample with 0.15g/l and respectively 0.10g/l CaCl2 solution, the
variations are δ(Δv) =41m/s, respectively δ(Δv) =14m/s in 10min, that is the merely the beginning of the
micelles formation. The same conclusions derive also from the variation of the attenuation coefficient (Fig.
5). In conclusion, Table 2 presents the time for the first micelles apparition.
4. CONCLUSIONS
The ultrasonic propagation through the system is influenced by its state, therefore the ultrasonic
parameters (ultrasonic velocity and attenuation coefficient) are in direct relation with the gel formation. Until
the beginning of milk coagulation, the ultrasonic velocity is constant.
With the appearance of the first micelles, the ultrasonic velocity increases. This increasing is important
until the system attain an equilibrium that is until the gel’s three-dimensional network becomes stable. The
constant ultrasonic velocity observes this fact. This indicates the end of the milk coagulation.
After these two essential stages, other two phenomena can be observed owed to the coagulant enzymes:
the stage of general proteolysis and the syneresis stage (which is a physico-chemical phenomenon that
manifests by the contraction of the gel and by the whey elimination).
The syneresis phenomenon is also observed by the sudden decrease of the attenuation coefficient, after
the velocity attains a bearing. This behaviour is due to the apparition of two phases: the gel phase and the
liquid phase, which determine the ultrasonic velocity modification.
During the coagulation period, the ultrasonic absorption increases because of the liquid mechanical
modulus increase. The attenuation coefficient increases proportionally with the shape, the size and the
number of the micelles, because the main factor of the attenuation is the scatters.
This method is very precise and rapid, excludes the subjectivism, and does not determine the
denaturation phenomena of the examined product. In this case it is not necessary the taking of the samples
during the whole process period.
This method is not noxious for the staff that accomplishes the determinations and may be adapted on
line in the technological flow.
Ultrasonic method to determine the phenomena inside continuous changing system
80
70
v) (m/s)
60
50
40
30
20
10
0
0
1
2
3
4
5
6
7
8
9
10
Time (min)
Fig.2 Variation of ultrasonic velocity with time and temperature for milk with 0.20g/l of 40% CaCl2 solution
(■) T=150C; (≡) T=250C; ( ) T=350C.
For T=350C, the dependence of ultrasonic velocity versus time is gives by:
δ(Δv)(t) = 0.1704 t3-3.8065t2+30.766t-33.409 (where R2 = 0.9497)
6
5
) (dB/m)
5
4
3
2
1
0
0
1
2
3
4
5
6
7
8
9
10
Time (min)
Fig. 3 Variation of attenuation coefficient with time and temperature for milk with 0.20g/l of 40% CaCl2 solution
(■) T=150C; (≡) T=250C; ( ) T=350C.
0
For T=35 C, the dependence of attenuation coefficient versus time is gives by:
δ(Δα)(t) = -0.0143t3+0.157t2+0.3137t-0.5606 (where R2 = 0.9671)
Mihaela PICU
6
80
70
v)(m/s)
60
50
40
30
20
10
0
0
1
2
3
4
5
6
7
8
9
10
Time (min)
Fig. 4 Variation of ultrasonic velocity with time and quantity of solution 40% CaCl2 in milk
at T=350C. (■) c=0.10g/l; (≡) c=0.15g/l; ( ) c=0.20g/l.
8
7
(m/s)
6
5
4
3
2
1
0
0
1
2
3
4
5
6
7
8
9
10
Time (min)
Fig. 5 Variation of attenuation coefficient with time and quantity of solution 40% CaCl2 in milk at T=350C.
(■) c=0.10g/l; (≡) c=0.15g/l; ( ) c=0.20g/l.
7
Ultrasonic method to determine the phenomena inside continuous changing system
5. REFERENCES
1.
BUCKIN, V., KUDRYASHOV, E., Ultrasonic shear wave rheology of weak particle gels, Adv. Colloid Interface Sci. 89–90,
pp.401–422, 2001.
2. DEVOLD, T. G., BROVOLD, M.J., LANGSRUD, T., VEGARUD, G.E., Size of native and heated casein micelles, content of
protein and minerals in milk from Norwegian Red Cattle—Effect of milk protein polymorphism and different feeding regimes,
Int. Dairy J. 10, pp.313–323, 2000.
3. GOULDEN, J.D.S., PHIPPS, L.W., Factors affecting the fat globule size during the homogenization of milk and cream, J. Dairy
Sci., 31, pp.195-200, 1194
4. JENNESS, R., WALSTRA, P., Dairy Chemistry and Phisics,pp.88-89, John Wiley and Sons, New York, 1984
5. KUDRYASHOV, E., SMYTH, C., DUFFY, G., BUCKIN, V., Ultrasonic high-resolution and shear wave measurements in
food colloids: Monitoring of gelatinization processes and detection of pathogens, Progr. Colloid Polymer Sci. 115, pp.287–294,
2000.
6. LEHMANN, L., BUCKIN, V., Determination of the Heat Stability Profiles of Concentrated Milk and Milk Ingredients Using
High Resolution Ultrasonic Spectroscopy, J. Dairy Sci. Lehmann and Buckin 88, pp.3121, 2005.
7. LEIGHTON, T.G., The acoustical field, Academic Press, London, 1994
8. McCLEMENTS, D.J, Developments of ultrasound in the study of foods, Trends Food Sci. Tech., 4, pp.190-206, 1991
9. MULVIHILL, D.M., KINSELLA, J.E., Gelation of β-lactoglobulin: effects of sodium chloride and calcium chloride on the
rheological and structural properties of gels, J. Food Sci., 53, pp.231-236, 1998
10. NASSAR, G., NONGAILLARD, B., NOEL, Y., Monitoring of milk gelation using a low-frequency ultrasonic technique, J.
Food Eng. 48, pp.351–359, 2001.
11. PICU, M., Defectoscopie ultrasonică, Cap.4, Ed. Academica, Galaţi, România, 1999
12. WANG, C.H., DAMODARAN, S., Thermal gelation of globular proteins: weight-average molecular weight dependence of gel
strenght, J. Agric. Food Chem., 38, pp.1157-1164, 1994
Received August 24, 2007