1
EDK Profiling User
Guide
A Guide to Profiling in EDK
UG448 April 19, 2010
Xilinx is disclosing this user guide, manual, release note, and/or specification (the "Documentation") to you solely for use in the development
of designs to operate with Xilinx hardware devices. You may not reproduce, distribute, republish, download, display, post, or transmit the
Documentation in any form or by any means including, but not limited to, electronic, mechanical, photocopying, recording, or otherwise,
without the prior written consent of Xilinx. Xilinx expressly disclaims any liability arising out of your use of the Documentation. Xilinx reserves
the right, at its sole discretion, to change the Documentation without notice at any time. Xilinx assumes no obligation to correct any errors
contained in the Documentation, or to advise you of any corrections or updates. Xilinx expressly disclaims any liability in connection with
technical support or assistance that may be provided to you in connection with the Information.
THE DOCUMENTATION IS DISCLOSED TO YOU “AS-IS” WITH NO WARRANTY OF ANY KIND. XILINX MAKES NO OTHER
WARRANTIES, WHETHER EXPRESS, IMPLIED, OR STATUTORY, REGARDING THE DOCUMENTATION, INCLUDING ANY
WARRANTIES OF MERCHANTABILITY, FITNESS FOR A PARTICULAR PURPOSE, OR NONINFRINGEMENT OF THIRD-PARTY
RIGHTS. IN NO EVENT WILL XILINX BE LIABLE FOR ANY CONSEQUENTIAL, INDIRECT, EXEMPLARY, SPECIAL, OR INCIDENTAL
DAMAGES, INCLUDING ANY LOSS OF DATA OR LOST PROFITS, ARISING FROM YOUR USE OF THE DOCUMENTATION.
© 2010 Xilinx, Inc. XILINX, the Xilinx logo, Virtex, Spartan, ISE, and other designated brands included herein are trademarks of Xilinx in the
United States and other countries. All other trademarks are the property of their respective owners.
The following table shows the revision history for this document.
Date
Version
09/05/2007
1.0
Initial Xilinx Release for EDK 9.2i.
01/14/2008
2.0
EDK 10.1 release.
04/15/2009
3.0
EDK 11.1 release.
12/02/2009
3.1
EDK 11.2 release.
04/19/2010
4.0
EDK 12.1 release.
EDK Profiling User Guide
Revision
www.xilinx.com
UG448 April 19, 2010
Preface
About This Guide
This user guide provides information about profiling software running on embedded
systems built with the Xilinx® Embedded Development Kit (EDK). Profiling is softwareintrusive, and is based on the GNU gprof tool. This document details how profiling
works, how to set up the hardware and software systems to perform profiling, and how to
view the resulting profile data.
The contents of this guide include:
•
Chapter 1, “Introduction”
•
Chapter 2, “Using SDK for Profiling in EDK”
•
Appendix A, “Profiling Restrictions”
•
Appendix B, “Glossary”
Additional Resources
The SDK Help contains detailed instructions for using the Xilinx Software Development
Kit (SDK). To access the SDK Help, do one of the following:
•
In Windows, select Start > All Programs > Xilinx ISE 12 > EDK > Documentation >
SDK Help Contents.
•
In your EDK installation directory, navigate to \doc\usenglish\SDK_doc and
open index.html.
To find additional EDK documentation, see the Xilinx EDK Documentation Web site at:
http://www.xilinx.com/ise/embedded/edk_docs.htm
To search the Answer Database for silicon, software, and IP questions and answers, or to
create a technical support WebCase, see the Xilinx Support Web site at:
http://www.xilinx.com/support
EDK Profiling User Guide
UG448 April 19, 2010
www.xilinx.com
3
Preface: About This Guide
Conventions
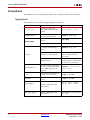
This document uses the following conventions. An example illustrates each convention.
Typographical
This document uses the following typographical conventions:
Convention
Meaning or Use
Courier font
Messages, prompts, and
program files that the system
displays
speed grade: - 100
Courier bold
Literal commands that you enter
in a syntactical statement
ngdbuild design_name
Commands that you select from
a menu
File > Open
Keyboard shortcuts
Ctrl+C
Variables in a syntax statement
for which you must supply
values
ngdbuild design_name
References to other manuals
See the Embedded System Tools
Reference Manual for more
information.
Emphasis in text
If a wire is drawn so that it
overlaps the pin of a symbol, the
two nets are not connected.
An optional entry or parameter.
However, in bus specifications,
such as bus[7:0], they are
required.
ngdbuild [option_name]
design_name
A list of items from which you
must choose one or more
lowpwr ={on|off}
Separates items in a list of
choices
lowpwr ={on|off}
Vertical ellipsis
.
.
.
Repetitive material that has
been omitted
IOB #1: Name = QOUT’
IOB #2: Name = CLKIN’
.
.
.
Horizontal ellipsis . . .
Repetitive material that has
been omitted
allow block block_name loc1
loc2 ... locn;
Helvetica bold
Italic font
Square brackets
Braces
[ ]
{ }
Vertical bar
4
Example
|
www.xilinx.com
EDK Profiling User Guide
UG448 April 19, 2010
Conventions
Online Document
The following conventions are used in this document:
Convention
EDK Profiling User Guide
UG448 April 19, 2010
Meaning or Use
Example
See the section “Additional
Resources” for details.
Blue text
Cross-reference link to a location
in the current document
Red text
Cross-reference link to a location
in another document
See Figure 2-5 in the Embedded
System Tools Reference Manual.
Blue, underlined text
Hyperlink to a Website (URL)
Go to http://www.xilinx.com
for the latest speed files.
www.xilinx.com
Refer to “Title Formats” in
Chapter 1 for details.
5
Preface: About This Guide
6
www.xilinx.com
EDK Profiling User Guide
UG448 April 19, 2010
Table of Contents
Preface: About This Guide
Additional Resources . . . . . . . . . . . . . . . . . . . . . . . . . . . . . . . . . . . . . . . . . . . . . . . . . . . . . . . . 3
Conventions . . . . . . . . . . . . . . . . . . . . . . . . . . . . . . . . . . . . . . . . . . . . . . . . . . . . . . . . . . . . . . . . . 4
Typographical . . . . . . . . . . . . . . . . . . . . . . . . . . . . . . . . . . . . . . . . . . . . . . . . . . . . . . . . . . . . . 4
Online Document . . . . . . . . . . . . . . . . . . . . . . . . . . . . . . . . . . . . . . . . . . . . . . . . . . . . . . . . . . 5
Chapter 1: Introduction
Profiling with GNU gprof . . . . . . . . . . . . . . . . . . . . . . . . . . . . . . . . . . . . . . . . . . . . . . . . . . . . 9
How Profiling Works . . . . . . . . . . . . . . . . . . . . . . . . . . . . . . . . . . . . . . . . . . . . . . . . . . . . . . . . 9
Chapter 2: Using SDK for Profiling in EDK
Setting Up the Hardware for Profiling . . . . . . . . . . . . . . . . . . . . . . . . . . . . . . . . . . . . . . . 11
Building Applications with Profile Information . . . . . . . . . . . . . . . . . . . . . . . . . . . . . 11
Enabling Profiling in the BSP . . . . . . . . . . . . . . . . . . . . . . . . . . . . . . . . . . . . . . . . . . . . . . .
Compiling the BSP with the -pg Option . . . . . . . . . . . . . . . . . . . . . . . . . . . . . . . . . . . . . .
Enabling the Profiling Timer in Your Application Code . . . . . . . . . . . . . . . . . . . . . . . .
Compiling the Application with the -pg Option . . . . . . . . . . . . . . . . . . . . . . . . . . . . . . .
12
13
14
15
Generating Profile Data . . . . . . . . . . . . . . . . . . . . . . . . . . . . . . . . . . . . . . . . . . . . . . . . . . . . . 16
Sampling Frequency . . . . . . . . . . . . . . . . . . . . . . . . . . . . . . . . . . . . . . . . . . . . . . . . . . . . . . 17
Bin Size . . . . . . . . . . . . . . . . . . . . . . . . . . . . . . . . . . . . . . . . . . . . . . . . . . . . . . . . . . . . . . . . . 17
Profile Memory . . . . . . . . . . . . . . . . . . . . . . . . . . . . . . . . . . . . . . . . . . . . . . . . . . . . . . . . . . . 17
Viewing Profile Data . . . . . . . . . . . . . . . . . . . . . . . . . . . . . . . . . . . . . . . . . . . . . . . . . . . . . . . . 18
Appendix A: Profiling Restrictions
Appendix B: Glossary
EDK Profiling User Guide
UG448 April 19, 2010
www.xilinx.com
7
8
www.xilinx.com
EDK Profiling User Guide
UG448 April 19, 2010
Chapter 1
Introduction
The Xilinx® Embedded Development Kit (EDK) is a suite of tools and IP that enables you
to design a complete embedded processor system for implementation in a Xilinx Field
Programmable Gate Array (FPGA) device.
This user guide provides information about profiling software running on embedded
systems built with EDK. Profiling is software-intrusive, and is based on the GNU gprof
tool. This document details how profiling works, how to set up the hardware and software
systems to perform profiling, and how to view the resulting profile data.
For additional documentation on Profiling, refer to “Additional Resources,” page 3.
Profiling with GNU gprof
Profiling a program with GNU gprof provides two kinds of information that you can use
to optimize the program:
•
A histogram with which you can identify the functions in the program that take up
the most execution time
•
A call graph that shows what functions called which other functions, and how many
times
For additional information about GNU gprof, refer to
http://sourceware.org/binutils/docs-2.18/gprof/index.html.
How Profiling Works
The execution flow of the program is altered to obtain the data needed for gprof.
Consequently, this method of profiling is considered “software-intrusive.”
The program flow is altered in two ways:
•
To obtain histogram data, the program is periodically interrupted to obtain a sample
of its program counter location. This user-defined interval is usually measured in
milliseconds. The program counter location helps identify which function was being
executed at that particular sample. Taking multiple samples over a long interval of a
few seconds helps identify which functions execute for the longest time in the
program.
•
To obtain the call graph information, the compiler annotates every function call to
store the caller and callee information in a data structure.
EDK Profiling User Guide
UG448 April 19, 2010
www.xilinx.com
9
Chapter 1: Introduction
The steps involved in profiling are as follows:
1.
Compile and link the program for profiling by adding the -pg switch to the gcc
compiler command line.
2.
Run the program to generate profile data.
3.
Process the profile data obtained from gprof.
These steps are explained in more detail in Chapter 2, “Using SDK for Profiling in EDK.”
10
www.xilinx.com
EDK Profiling User Guide
UG448 April 19, 2010
Chapter 2
Using SDK for Profiling in EDK
This chapter explains the steps involved in profiling an application in EDK. The following
sections are included:
•
“Setting Up the Hardware for Profiling”
•
“Building Applications with Profile Information”
•
“Generating Profile Data”
Setting Up the Hardware for Profiling
To profile a software application, you must have a timer device present and accessible from
the processor that is running the program. The profiling process periodically interrupts the
processor to identify what section of the code is running.
Xilinx profiling libraries that provide the profile interrupt handler support the xps_timer
core. When you run profiling on PowerPC® processors, you can also use the internal
Programmable Interrupt Timer (PIT). Etiher the xps_timer or PIT must be available for
exclusive use by the profile libraries. The timer interrupt signal is connected to the
processor either directly or through an interrupt controller.
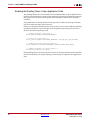
Building Applications with Profile Information
Building an application for profiling involves the following steps:
1.
Enable software intrusive profiling in the board support package (BSP).
Refer to “Enabling Profiling in the BSP,” page 12.
2.
Compile the BSP with the -pg option enabled.
Refer to “Compiling the BSP with the -pg Option,” page 13.
3.
Make sure that the application code enables the profile timer interrupt. Refer to
“Enabling the Profiling Timer in Your Application Code,” page 14.
4.
Compile the application with the -pg flag.
Refer to “Compiling the Application with the -pg Option,” page 15.
EDK Profiling User Guide
UG448 April 19, 2010
www.xilinx.com
11
Chapter 2: Using SDK for Profiling in EDK
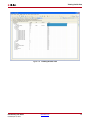
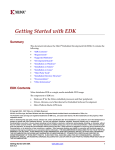
Enabling Profiling in the BSP
The first step in building an application for profiling is to enable the profile libraries in the
BSP. Only applications built using the standalone BSP can be profiled. To enable profiling
libraries in this BSP:
1.
Open the Software Platform Settings dialog box.
2.
Click standalone to configure the parameters for the standalone OS.
3.
For the enable_sw_intrusive_profiling option, set the Value column to true.
4.
For MicroBlaze processor based designs, you must also specify the timer to be used for
profiling.
Refer to Figure 2-1, which displays a correctly configured BSP.
X-Ref Target - Figure 2-1
Figure 2-1:
12
BSP with Profiling Enabled
www.xilinx.com
EDK Profiling User Guide
UG448 April 19, 2010
Building Applications with Profile Information
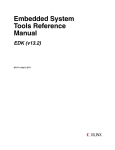
Compiling the BSP with the -pg Option
After enabling profiling libraries on the BSP, you must set the -pg compiler option. To do
this:
1.
Click the cpu driver to open the driver configuration page.
2.
Add -pg to the Value column for the extra_compiler_flags option.
Refer to Figure 2-2, which displays the Software Platform Settings dialog box with these
options.
X-Ref Target - Figure 2-2
Figure 2-2:
EDK Profiling User Guide
UG448 April 19, 2010
BSP with -pg Compiler Option
www.xilinx.com
13
Chapter 2: Using SDK for Profiling in EDK
Enabling the Profiling Timer in Your Application Code
The profiling libraries that are included with the standalone BSP set up the profile timer to
generate periodic interrupts. You must also modify the application to enable the interrupts
in the processor and ensure that the profile timer interrupt is enabled in the interrupt
controller.
If the profile timer is directly connected to the processor without an interrupt controller,
you must enable interrupts in the processor.
If there is an interrupt controller present in the system, you must also enable the interrupt
controller and allow it to pass interrupts from the profile timer to the processor. This is
shown in the following example code.
/* enable interrupt controller */
XIntc_mMasterEnable(SYSINTC_BASEADDR);
/* service all interrupts */
XIntc_SetIntrSvcOption(SYSINTC_BASEADDR, XIN_SVC_ALL_ISRS_OPTION);
/* enable the profile timer interrupt */
XIntc_mEnableIntr(SYSINTC_BASEADDR, PROFILE_TIMER_INTR_MASK);
/* enable interrupts in the processor */
microblaze_enable_interrupts();
If the profiling timer is the only entity that connects to the input of the interrupt controller,
the tool automatically sets up the interrupt, and no change is required in the application
code.
14
www.xilinx.com
EDK Profiling User Guide
UG448 April 19, 2010
Building Applications with Profile Information
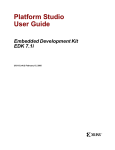
Compiling the Application with the -pg Option
Finally, you must compile the application with the -pg flag enabled. To do this:
1.
In the Properties dialog box for the application, open the Settings page for the build.
2.
In the Tool Settings tab, select the Profiling category for the compiler.
3.
Click to select the Enable Profiling (-pg) check box.
Refer to Figure 2-3, which displays the Properties dialog box and the related settings.
X-Ref Target - Figure 2-3
Figure 2-3:
EDK Profiling User Guide
UG448 April 19, 2010
Properties Dialog Box with Profiling Enabled
www.xilinx.com
15
Chapter 2: Using SDK for Profiling in EDK
Generating Profile Data
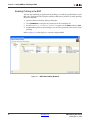
After compiling the application for profiling, you must run it once to obtain profile data.
Start by creating a new run configuration in SDK:
1.
In SDK, select Run > Run to open the Run dialog box.
2.
In the Profiler tab:
3.
a.
Select the Enable Profiling check box.
b.
Type values for the three profiling parameters. These are described in more detail
in the following sections.
Save this configuration and run the application using the profile you created.
Figure 2-4 displays a Run Configuration with profiling enabled. The following sections
describe the attributes shown here: Sampling Frequency, Bin Size, and Profile Memory.
X-Ref Target - Figure 2-4
Figure 2-4:
16
Run Configuration with Profiling Enabled
www.xilinx.com
EDK Profiling User Guide
UG448 April 19, 2010
Generating Profile Data
Sampling Frequency
The sampling frequency determines the frequency at which timer interrupts are generated.
When you set a higher frequency, more samples are obtained. This provides more accuracy
but is highly software-intrusive because of the number of interrupts. More calls are
inserted to collect data.
Bin Size
The program text region is divided into multiple bins. When a program is interrupted
because of the sampling frequency, the bin size determines how accurate the PC location is
in the sample.
When you set a smaller bin size, the program text region is divided into a large number of
small bins. This allows a more accurate sample because profile data can be attributed to a
specific area of the text region. For example, if you set the bin size to 4 bytes, you can
narrow down the specific instruction at which the program execution occurred to four
bytes of the text region. The disadvantage to using a smaller bin size is that it requires a
large number of bins to cover the entire text region, so a large amount of memory space is
required for storing profile data.
When you set a larger bin size, the program text region is divided into a small number of
large bins. This requires less memory space for storing profile data. However, it is much
more difficult to identify specific text regions for the sample because of the larger bin size.
For example, if you set the bin size to 40 bytes, you can only determine that the program
was executing instructions between x and x+40 on each profile interrupt.
Profile Memory
The profile memory parameter indicates where in memory the profile data must be stored.
This memory needs to lie outside the program memory area (including the text, data, heap
and stack) and should not be overwritten.
EDK Profiling User Guide
UG448 April 19, 2010
www.xilinx.com
17
Chapter 2: Using SDK for Profiling in EDK
Viewing Profile Data
Once the program reaches exit and completes execution) or when you click the Stop
button is to stop the program, SDK automatically downloads the profile data and stores it
in a file called gmon.out. The Profiling Results Saved dialog box displays this
information.
The gmon.out file also becomes visible in the project explorer view, in the Debug or
Release folder. To view the profile results, double-click the gmon.out file. SDK opens a
dialog box requesting that you specify the ELF file associated with the profile information.
By default, the ELF file points to the correct ELF file used to generate the profile
information.
X-Ref Target - Figure 2-5
Figure 2-5:
Specifying the ELF File Used with the Profile Information
Click OK to view the profile results. The results open in a separate view at the bottom of
the gprof tab, as shown in Figure 2-6. The results view comprises the following columns:
18
•
Name (location) indicates the name of the function and the file in which it resides.
•
Samples indicates the number of times the profile timer interrupt handler noticed
that the program was currently executing the corresponding function.
•
Calls indicates the number of calls made to the corresponding function.
•
Time/Call indicates the time per function call invocation.
•
% Time indicates the time spent executing this function as a percentage of total
execution time.
www.xilinx.com
EDK Profiling User Guide
UG448 April 19, 2010
Viewing Profile Data
X-Ref Target - Figure 2-6
Figure 2-6:
EDK Profiling User Guide
UG448 April 19, 2010
Profiling Results View
www.xilinx.com
19
Chapter 2: Using SDK for Profiling in EDK
20
www.xilinx.com
EDK Profiling User Guide
UG448 April 19, 2010
Appendix A
Profiling Restrictions
The following restrictions apply when profiling in EDK:
•
Profiling does not measure the time spent in interrupt handlers because interrupt
handlers typically disable further interrupts from occurring. Therefore, it is
impossible for profiling interrupts to occur when the program is executing an
interrupt handler.
•
Profiling can only be done with the standalone platform; it cannot be done in the
presence of an OS. This is because the profiling libraries are only available in the
standalone BSP.
•
Recursive functions are not supported.
•
If the timer is directly connected to the processor (for example, when there is no
interrupt controller), the software application requires additional setup to support
profiling.
•
The call graph for functions inside C and Math libraries (libc and libm) are not
generated because these libraries are not compiled with the -pg compiler profiling
option.
•
Ensure that memory used for collecting profile data is not used by any other function
in the application.
•
If you are using a custom linker script for a PowerPC® processor, it must include
a.vectors section. This is because profiling is based on interrupts, and using
interrupts requires a .vectors section.
•
Profiling cannot be done while debugging. Enable profiling only when selecting the
Run configuration in SDK.
EDK Profiling User Guide
UG448 April 19, 2010
www.xilinx.com
21
Appendix A: Profiling Restrictions
22
www.xilinx.com
EDK Profiling User Guide
UG448 April 19, 2010
Appendix B
Glossary
B
BBD file
Black Box Definition file. The BBD file lists the netlist files used by a
peripheral.
BFL
Bus Functional Language.
BFM
Bus Functional Model.
BIT File
Xilinx® Integrated Software Environment (ISE®) Bitstream file.
BitInit
The Bitstream Initializer tool. It initializes the instruction memory of
processors on the FPGA and stores the instruction memory in
blockRAMs in the FPGA.
block RAM (BRAM)
A block of random access memory built into a device, as distinguished
from distributed, LUT based random access memory.
BMM file
Block Memory Map file. A BMM file is a text file that has syntactic
descriptions of how individual block RAMs constitute a contiguous
logical data space. Data2MEM uses BMM files to direct the translation
of data into the proper initialization form. Because a BMM file is a text
file, it is directly editable.
EDK Profiling User Guide
UG448 April 19, 2010
www.xilinx.com
23
Appendix B: Glossary
BSB
Base System Builder. A wizard for creating a complete design in Xilinx
Platform Studio (XPS). BSB is also the file type used in the Base System
Builder.
BSP
See Standalone BSP.
C
CDMAC
Communications Direct Memory Access Controller.
D
DCM
Digital Clock Manager
DCR
Device Control Register.
DLMB
Data-side Local Memory Bus. See also: LMB.
DMA
Direct Memory Access.
DOPB
Data-side On-chip Peripheral Bus. See also: OPB.
DRC
Design Rule Check.
DSPLB
Data-side Processor Local Bus. See also: ISPLB.
24
www.xilinx.com
EDK Profiling User Guide
UG448 April 19, 2010
E
EDIF file
Electronic Data Interchange Format file. An industry standard file
format for specifying a design netlist.
EDK
Xilinx Embedded Development Kit.
ELF file
Executable and Linkable Format file.
EMC
External Memory Controller.
EST
Embedded System Tools.
F
FATfs (XilFATfs)
LibXil FATFile System. The XilFATfs file system access library
provides read/write access to files stored on a Xilinx SystemACE
CompactFlash or IBM microdrive device.
FPGA
Field Programmable Gate Array.
FSL
MicroBlaze™ Fast Simplex Link. Unidirectional point-to-point data
streaming interfaces ideal for hardware acceleration. The MicroBlaze
processor has FSL interfaces directly to the processor.
G
GDB
GNU Debugger.
GPIO
General Purpose Input and Output. A 32-bit peripheral that attaches
to the on-chip peripheral bus.
EDK Profiling User Guide
UG448 April 19, 2010
www.xilinx.com
25
Appendix B: Glossary
H
Hardware Platform
Xilinx FPGA technology allows you to customize the hardware logic
in your processor subsystem. Such customization is not possible using
standard off-the-shelf microprocessor or controller chips. Hardware
platform is a term that describes the flexible, embedded processing
subsystem you are creating with Xilinx technology for your
application needs.
HDL
Hardware Description Language.
I
IBA
Integrated Bus Analyzer.
IDE
Integrated Design Environment.
ILA
Integrated Logic Analyzer.
ILMB
Instruction-side Local Memory Bus. See also: LMB.
IOPB
Instruction-side On-chip Peripheral Bus. See also: OPB.
IPIC
Intellectual Property Interconnect.
IPIF
Intellectual Property Interface.
ISA
Instruction Set Architecture. The ISA describes how aspects of the
processor (including the instruction set, registers, interrupts,
exceptions, and addresses) are visible to the programmer.
ISC
Interrupt Source Controller.
26
www.xilinx.com
EDK Profiling User Guide
UG448 April 19, 2010
ISE
Xilinx ISE Project Navigator project file.
ISPLB
Instruction-side Peripheral Logical Bus. See also: DSPLB.
ISS
Instruction Set Simulator.
J
JTAG
Joint Test Action Group.
L
Libgen
Library Generator sub-component of the Xilinx Platform Studio
technology.
LMB
Local Memory Bus. A low latency synchronous bus primarily used to
access on-chip block RAM. The MicroBlaze processor contains an
instruction LMB bus and a data LMB bus.
M
MDD file
Microprocessor Driver Description file.
MDM
Microprocessor Debug Module.
MFS
LibXil Memory File System. The MFS provides user capability to
manage program memory in the form of file handles.
MHS file
Microprocessor Hardware Specification file. The MHS file defines the
configuration of the embedded processor system including
buses,peripherals, processors, connectivity, and address space.
EDK Profiling User Guide
UG448 April 19, 2010
www.xilinx.com
27
Appendix B: Glossary
MLD file
Microprocessor Library Definition file.
MOST®
Media Oriented Systems Transport. A developing standard in
automotive network devices.
MPD file
Microprocessor Peripheral Definition file. The MPD file contains all of
the available ports and hardware parameters for a peripheral.
MSS file
Microprocessor Software Specification file.
N
NCF file
Netlist Constraints file.
NGC file
The NGC file is a netlist file that contains both logical design data and
constraints. This file replaces both EDIF and NCF files.
NGD file
Native Generic Database file. The NGD file is a netlist file that
represents the entire design.
NGO File
A Xilinx-specific format binary file containing a logical description of
the design in terms of its original components and hierarchy.
NPI
Native Port Interface.
O
OCM
On Chip Memory.
OPB
On-chip Peripheral Bus.
28
www.xilinx.com
EDK Profiling User Guide
UG448 April 19, 2010
P
PACE
Pinout and Area Constraints Editor.
PAO file
Peripheral Analyze Order file. The PAO file defines the ordered list of
HDL files needed for synthesis and simulation.
PBD file
Processor Block Diagram file.
Platgen
Hardware Platform Generator sub-component of the Platform Studio
technology.
PLB
Processor Local Bus.
PROM
Programmable ROM.
PSF
Platform Specification Format. The specification for the set of data
files that drive the EDK tools.
S
SDF file
Standard Data Format file. A data format that uses fields of fixed
length to transfer data between multiple programs.
SDK
Software Development Kit.
Simgen
The Simulation Generator sub-component of the Platform Studio
technology.
Software Platform
A software platform is a collection of software drivers and, optionally,
the operating system on which to build your application. Because of
the fluid nature of the hardware platform and the rich Xilinx and
Xilinx third-party partner support, you may create several software
platforms for each of your hardware platforms.
EDK Profiling User Guide
UG448 April 19, 2010
www.xilinx.com
29
Appendix B: Glossary
SPI
Serial Peripheral Interface.
Standard C Libraries
EDK libraries and device drivers provide standard C library functions,
as well as functions to access peripherals. Libgen automatically
configures the EDK libraries for every project based on the MSS file.
Standalone BSP
Standalone Board Support Package. A set of software modules that
access processor-specific functions. The Standalone BSP is designed
for use when an application accesses board or processor features
directly (without an intervening OS layer).
SVF File
Serial Vector Format file.
U
UART
Universal Asynchronous Receiver-Transmitter.
UCF
User Constraints File.
V
VHDL
VHSIC Hardware Description Language.
X
XBD File
Xilinx Board Definition file.
XCL
Xilinx CacheLink. A high performance external memory cache
interface available on the MicroBlaze processor.
Xilkernel
The Xilinx Embedded Kernel, shipped with EDK. A small, extremely
modular and configurable RTOS for the Xilinx embedded software
platform.
30
www.xilinx.com
EDK Profiling User Guide
UG448 April 19, 2010
XMD
Xilinx Microprocessor Debugger.
XMP File
Xilinx Microprocessor Project file. This is the top-level project file for
an EDK design.
XPS
Xilinx Platform Studio. The GUI environment in which you can
perform the develop your embedded design.
XST
Xilinx Synthesis Technology.
Z
ZBT
Zero Bus Turnaround™.
EDK Profiling User Guide
UG448 April 19, 2010
www.xilinx.com
31
Appendix B: Glossary
32
www.xilinx.com
EDK Profiling User Guide
UG448 April 19, 2010