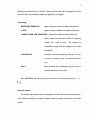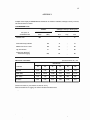
1
User's manual for TIMRET: a microcomputer
software for silviculture investment return analysis
by
W.J. Ondro and W. Marshall
1993
Department of Natural Resources Canada (Forestry)
Canadian Forestry Service
Northwest Region
Northern Forestry Centre
December 1993
Ondro, W.J.; W. Marshall, 1993. User's manual for TIMRET: microcomputer software for
silviculture investment return analysis; Department of Natural Resources Canada
(Forestry), Can. For. Serv., Northwest Region, North. For. Cent., Edmonton, Canada.
Abstract
This manual describes the usage of a micro-computer software package, TIMRET, which
was develo ped to aid the forest manager in evaluating profitability of silvicultural investments.
Returns from a range of investment scenarios, e.g., forest renewal, cleaning, spacing, thinning,
release, fertilization and tree improvements - can be calculated and compared by using any of the
following criteria: 1) internal rate of return, 2) present net worth, 3) profitability index and 4)
benefit/cost ratio. TIMRET calculates returns from treatment costs, and benefits such as increased
yield, size premiums, logging cost reductions and product from trees removed by treatment. The
output of the financial analysis can be presented in a tabular and/or graphical form. Examples of
these inputs and examples of TIMRET calculations are provided.
TABLE OF CONTENTS
Page
Abstract . .... ... .... ........ .. . . . .. .. . . . . . . . . . ... ... . .. . .. .. .. . ..
.
Introduction .. . . . . ... . . . . . . . . . . . . . . . . . . . . . . . . . . . ... . .. . ......... ...
Starting TIMRET . ..... . . .. . . . . . . . . . .. . . . . . . . . . .. . ... . .. . .... .. ... .
Tenninology
.
.
2
.... ... .... ....... ... ... .. ... .... ... .. ... .. .... ..
2
.
Management Scenario Analysis . .
Marginal Analyses . .' . . . . . . . . . .
Starting and Ending Analysis Cases
Year Markers . . . .. ..... .. . ..
.
.
.
.
.
.
.
.
.
.
.
.
.
.
.
.
.
.
.
.
....
. . ..
.. . .
. .. .
.
.
.
. ..
.. .
...
.. .
.
.
.
.
..
..
..
..
.
.
..
..
. .
..
.
.
.
.
.
.
.
.. ........ .. ....... ....
. . . . . . . . . . . .. . . . . . . . . . .
. . . . . . . . . . . . . .. . . . . . . . .
................. ......
.
.
.
.
.
.
.
.
.
. ..
.
.
.
.
.
.
.
.
.
.
.
.
.
.
.
.
.
.
.
.
.
.
.
.
.
.
.
.
.
.
.
.
.
.
.
.
.
.
.
.
.
.
.
.
.
.
.
.
.
.
.
.
2
3
3
3
4
.
Title
.
CostslBenefits . . . . . . . . . . . . . . . . . . . . . . . . . . . . . . . . . . . . . . . . . . . . . . . . .
Timing of Treatments
.
Economic Parameters . . . . . . . . . . . . . . . . . . . . . . . . . . . . . . . . . . . . . . . . . . . .
.
.
.... ... ... .... ... .. .. ... ..... . ... ... ..... .... ... .....
Financial Analyses.
Entering Data
.
.
.
.
.
.
.
.
.
.
.
.
.
.
.
.
.
.
.
.
.
.
.
.
.
.
.
.
.
.
.
.
.
.
.
.
.
.
.
.
.
.
.
.
.
.
.
.
.
.
.
.
.
.
.
.
.
4
4
4
4
.
.
.
Editing Data
Typeover
Edit Mode
.
.
.
.
.
.
.
.
.
.
.
.
.
.
.
.
.
.
.
.
.
.
.
.
.
.
.
.
.
.
.
.
.
.
.
.
.
.
.
.
.
.
.
.
.
.
.
.
.
.
.
.
.
.
.
5
.
.
.
.
.
.
.
.
.
.
.
.
.
.
.
.
.
.
.
.
.
.
.
.
.
.
.
.
.
.
.
.
.
.
.
.
.
.
.
.
.
.
.
.
.
.
.
.
.
.
.
.
.
.
.
5
.
.
.
.
.
.
.
.
.
.
.
.
.
.
.
.
.
.
.
.
.
.
.
.
.
.
.
.
.
.
.
.
.
.
.
.
.
.
.
.
.
.
.
.
.
.
.
.
.
.
.
.
.
.
5
.
.
.
.
.
.
.
.
.
.
.
.
.
.
.
.
.
.
.
.
.
.
.
.
.
.
.
.
.
.
.
.
.
.
.
.
.
.
.
.
.
.
5
.
.
.
.
.
.
.
.
.
.
.
.
.
.
.
.
.
.
.
.
.
.
.
.
.
.
.
.
.
.
.
.
.
.
.
.
.
.
.
.
.
6
.
.
.
.
.
.
.
.
.
.
.
.
.
.
.
.
.
.
.
.
.
.
.
.
.
.
.
.
.
.
.
.
.
.
.
.
.
.
.
Treatment
Description
.
Present value ($/ha)
.
.
First year
...................................... ....... ... ..
Last year
.
.
Step year
.
.
.
.
.
.
.
.
.
.
.
.
.
.
.
.
.
.
.
.
.
.
.
.
.
.
.
.
.
.
.
.
.
.
.
.
.
.
.
.
.
.
.
.
.
.
.
.
.
.
.
.
.
.
.
.
.
.
.
.
.
.
.
.
.
.
.
.
.
.
.
.
.
.
.
.
.
.
.
.
.
.
.
.
.
.
.
.
.
.
.
.
.
.
.
.
.
.
.
.
.
.
.
.
.
.
.
.
.
.
.
.
.
.
.
6
6
.
.
.
.
.
.
.
.
.
.
.
6
.
.
.
.
.
.
.
.
.
.
6
Economic Parame ters . . . . . . . . . . . . . . . . . . . . . . . . . . . . . . . . . . . . . . . . . . . . . . . . 6
Discount Rates
6
Inflation Rates ...................................................6
Discounting
7
Cash Flows
.
: : ; . . . . , . . . . ." . . . . . . . . . . . . . . . . . . . .
7
.
Activity List
.
.
.
.
.
.
.
.
.
.
.
.
.
.
.
.
.
.
.
.
.
.
.
.
.
.
.
.
.
.
.
.
.
.
.
.
.
.
.
.
.
.
.
.
.
.
.
.
.
.
.
.
.
.
.
.
.
.
.
.
.
.
.
.
.
.
.
.
.
.
.
.
.
.
.
.
.
.
.
.
.
.
.
.
.
.
.
.
.
.
.
.
.
.
.
.
.
.
.
.
.
.
.
.
.
.
.
.
.
.
.
.
.
.
.
.
.
.
.
.
.
.
.
.
.
.
.
.
.
.
.
.
.
.
.
.
.
.
.
.
.
.
.
.
.
.
.
.
.
.
.
.
.
.
.
.
.
.
.
.
.
.
.
.
.
.
.
.
.
.
.
.
.
.
.
7
7
Financial Analysis Results
Tabular Presentation
.
7
Internal Rate of Return (IRR)
.
8
Present Net Worth (PNW)
.
8
Profitability Index (PI)
8
Benefit/Cost Ratio (B/C) . . . . . . . . . . . . . . . . . . . . . . . . . .. . . . . . .. . . . . . . . . . . 8
.
.
.
.
.
.
.
.
.
.
.
.
.
.
.
.
.
.
.
.
.
.
.
.
.
.
.
.
.
.
.
.
.
.
.
.
.
.
.
.
.
.
.
.
.
.
.
.
.
.
.
.
.
.
.
.
.
.
.
.
.
.
.
.
.
.
.
.
.
.
.
11
.
.
.
.
.
.
.
.
.
.
.
.
.
.
.
.
.
.
.
.
.
.
.
.
.
.
.
.
.
.
.
.
.
.
.
.
.
.
.
.
.
.
.
.
.
.
.
.
.
.
.
.
.
.
.
.
.
.
.
.
.
.
.
.
.
.
.
.
.
.
.
.
.
.
.
.
.
.
.
.
.
.
.
.
.
.
.
.
.
.
.
.
.
.
.
.
.
.
.
.
.
.
Graphical Output
.
.
.
.
.
.
.
.
.
.
.
.
.
.
.
.
.
.
.
.
.
..
.
.
.
.
.
.
.
.
.
.
.
.
.
.
.
.
.
.
.
..
.
.
.
.
. 8
.
9
Solutions to Unique Problems
Too many Cash Flows
Long Investment Periods
.
.
.
.
.
.
.
.
.
.
.
.
.
.
.
.
.
.
.
.
.
.
.
.
.
.
.
.
.
.
.
.
.
.
.
.
.
.
.
.
.
.
.
.
.
.
.
.
.
.
.
.
.
.
.
.
.
.
.
.
.
.
.
.
.
.
.
.
.
.
.
.
.
..
.
.
.
.
.
.
.
.
9
9
.
.
SavelLoadlDelete . . . . . . . . . . . . . . . . . . . . . . . . . . . . . . . . . . . . . . . . . . . . . . . . ..
10
Saving the Current Case . . . . . . . . . . . . . . . . . . . . . . . . . . . . . . . . . . . . . . . . .
Retrieving a Case
.
..
.
.
".
.
.
.
.
.
.
.
.
.
.
10
10
.
.
.
.
.
.
.
.
.
.
10
.
.
.
.
.
.
Advice W hen Using TIMRET .
.
.
.
.
.
.
.
.
.
.
.
.
.
.
.
.
.
.
.
.
.
.
.
.
.
.
.
.
.
.
.
.
.
.
.
.
.
.
.
.
.
.
.
.
.
.
.
.
.
.
.
.
.
.
.
.
.
.
Distinguishing Cases from Worksheets
10
Making Backups
. . . . . . . . .. . . . . . . . . . . . . . . . . . . . . . . . . . . . . . . . . . . . . . . 01
Verifying Inputs
. ..
. ....... . . ..
..
11
.
.
.
.
.
.
.
.
.
.
.
.
.
.
.
.
.
.
.
.
.
.
.
.
.
.
.
.
.
.
.
.
.
.
.
.
.
.
.
.
.
.
.
.
.
."
.
Additional Information
Acknowledgments
.
.
.
.
.
.
.
.
.
.
.
.
.
.
.
.
.
.
.
.
.
.
.
.
.
.
.
.
.
.
.
.
.
.
.
.
.
.
.
.
.
.
.
.
.
.
.
.
.
.
.
.
.
.
.
.
.
.
.
.
.
.
.
.
.
.
.
.
.
.
.
.
.
.
.
.
.
.
.
.
.
.
.
.
.
.
.
.
.
.
.
.
.
.
.
.
.
.
.
.
.
.
.
.
.
.
.
.
.
.
.
.
.
.
11
.
1
List of Suggested Readings . . . . . . . . . . . . . . . . . . . . . . . . . . . . . . . . . . . . . . . . . . . . 13
.
APPENDICES
APPENDIX I.
Definition of Terms
.
.
.
.
.
.
.
.
..
.
.
.
.
.
.
. . .
.
.
.
.
..
.
.
..
.
.
.
.
.
.
.
.
.
.
.
.
.
.
.
.
.
APPENDIX 2.
Computer screen of TIMRET financial information on treatment
costlbenefit. stand age at activity or harvest and financial returns
at rotation
.
.
.
.
.
.
.
.
.
.
.
.
.
.
.
.
.
.
.
.
.
.
.
.
.
.
.
.
.
.
.
.
.
.
.
.
.
APPENDIX 3.
Output from TIMRET showing profitability analysis of lodgepole pine
thinning at three different financial criteria .
APPENDIX 4.
TIMRET Quick Reference
.
.
.
.
.
.
.
.
.
.
111
.
.
.
.
.
.
.
.
.
.
.
.
.
.
.
.
.
.
.
.
.
.
.
.
.
.
.
.
.
.
.
.
.
..
.
(j
17
.
.
.
.
.
.
.
.
.
.
I
.
.
.
.
.
.
.
.
.
.
0
Introduction
In today's increasingly complex decision environment, the forest manager needs a simple,
quick
"user-friendly" and flexible financial analysis software to help make decisions about
possible forest management scenarios. TIMRET, a recently developed forestry investment analysis
software package, is a tool intended to meet this need. TlMRET is an acronym for TIMber
RETurns. This software package can be run on any mM
-
compatible personal computer which
has a 3.1 or higher version of the DOS-based LOTUS 123 spreadsheet package.
Inputs to the program specify management scenarios and discount rates. The former may
include: forest fertilization, spacing, thinning, release, tree improvement and wetland drainage.
The program can calculate returns for any management practice which brings improved (changed)
timber benefits, such as increased stem wood yields, log size premiums, logging cost reductions
from harvesting bigger trees and products from trees removed by treatments (Appendix I). The
analyst can choosee the selected steps (computer runs), such as cost and benefits, into individual
cases (files), that may be saved on disk, retrieved, and modified for further analysis. TIMRET
enables the analyst to compute cash flow from investments before income taxes for six discount
rates. Summary of result can be displayed and viewed on the screen, and/or printed. TIMRET
can calculate financial returns per hectare, a stand, or a whole forest. Each case is defined by a
series of steps that specify costs and revenues. Net revenues are generated from these steps, and
are subsequently used to calculate financial returns.
Starting TIMRET
To start TIMRET, insert the 51,4 inch TIMRET floppy diskette with the example attached.
The program can be run on a 286, 386 or 486 SX or DX mM compatible personal computer with
Lotus version 3.1+ installed. Ensure that the directory containing Lotus 123 is included in the
Path statement in the Autoexec.bat file (Le., path=C:\123R3). Type a:tima [enter] [enter]
2
[enter], if your 51,4 inch drive is "called a". Upon execution, a title screen will appear for a short
time after which the preloaded example (see Appendix 2) will appear.
Terminology
REVENUES (BENEFITS)
-
appear as positive number on display and printouts;
COSTS
-
appear as negative numbers on display and printouts;
TIMBER YIELD AND DEPLETION - expressed in dollars per hectare ($lha). All
,
timber volumes are converted to m3lha for computing
volumes for a stand or forest.
The volumes are
multiplied by market value of stumpage (in m3 or fbm)
and entered;
CASH FWWS
-
assumed to occur at the beginning of the year. So costs
or revenues, occurring in year 1 are discounted for one
year.
DATA
-
Steps describing forest management practices may be
specified and entered in any order.
Press <RETURN> key after every entry, cursor control is done by the arrow keys. � f-
Financial Analyses
The software can compute returns for management scenarios that include several treatments,
or can evaluate profitability of a specific treatment, either for a portion of a rotation, or the whole
rotation.
3
Management Scenario Analysis:
Most fmancial analyses are done to find out treatment
profitability for a stand, or an entire foe
r st. In order to analyze various management scenarios,
the analyst should specify all management activities or practices from the start to the end of the
rotation. Results of the analyses will reflect the returns for the treatment(s) cost and their timing.
Marginal Analysis:
These determine the effect of an additional treatment, such as better
site preparation, thinning, or more fertilizer on wood yield. Financial returns are based on cash
flow differences between a stand that received the extra treatment and the one that did not.
Starting and Ending Analysis Cases: A
typical forest investment starts with the
establishment of a new stand, or a forest, but TIMRET may begin or end at any specified time.
Often, the startingpoint is a major ex penditure or treatment. The analyst need to identify the first
and last investment activity. Beginning activities include site clearing, site preparation, natural
regeneration and planting. Some intermediate treatments such as cleaning, spacing, thinning or
fertilizing may be beginning activities for other investments. Ending activities are usually final
harvests and timber disposal.
Year Markers: TIMRET sets the base year for the investment at the first specified activity.
All cash flows are discounted back to this. If an earlier base year is desired add a null activity,
e. g. , (C/B
=
0) to set it.
Entering Data
An analysis requires four data groups which must be entered to identify and define a case.
The data entry order is arbitrary. For data input ex ample see Appendix 2. To add an entry, move'
to an empty row of the editing area and type in information for each of the following:
Title: It contains description of cost or benefit. To enter a title, move cursor to the left most
column (A) and type it.
4
CostslBenefits: It describes and gives numerical values to treatment costs, yields, products,
and prices. To enter a cost/benefit, type the negative cost value into the cost column (B) or the
positive benefit value into the benefit column (C).
Timing of Treatments: After entering description and numerical values of the cost or
benefit, the timing of the treatment must be specified. The first year of the treatment is entered
in the first year column (D) and the last year of the treatment is entered in the last year column
(F). The number of years between treatments is specified in the step year column (E).
Economic Parameters: These
are
the discount rates and inflation rate. Default values
are
provided upon initial execution of TIMRET macro. To modify the economic parameters, execute
the Calculate macro (AIt-C) to get the Calculate menu. Choose Inflation to modify the inflation
rate or Discount to modify one of the discount rates. The new values are entered at the top of the
screen. To restore default discount rates, execute the Calculate macro, then choose Discount, and
then choose Default.
Editing Data
Data error checking is performed upon an attempt to calculate financial criteria. If an error
occurs or information simply requires change, editing will be desired. There are two ways to edit
data.
Typeover: One way of editing is to move the cursor over the cell that needs to be changed
and type in an new value. This is done while in the default typeover mode, known as a READY
mode. (See mode indicator at top right comer of screen).
5
Edit mode: This is through entering the EDIT mode. This mode is useful when the analyst
wishes to avoid retyping the contents of the entire cell. To edit data using this method, move the
cursor over the cell that requires editing and press the F2 key. (See mode indicator change to
E DIT). The current value of the cell will appear at the top of the screen for editing. Use arrow
keys to remove characters, and backspace or delete keys to delete characters. All other character
keystrokes will cause that particular character to be inserted at the position of the cursor. Press
ENTER when satisfied, and the mode will once again be in the READY mode. Press ESC any
time during editing to abort the edit. '
Treatment
Specify activities which
are
expressed in costs and benefits for the investment. The speed
and reliability of the analysis depends on how activities are entered and specified. Erroneous
specification of activities will produce wrong analyses.
TIMRET checks for and alerts the user to obvious entry errors, such as a positive cost or
negative benefit, but cannot check for treatments cost, e.g., $400lha for thinning is as valid as
$4O/ha.
The analyst may enter up to 100 transactions per case.
Description: This is a 30 character description of the costlbenefit being entered, e.g., market
value of increased yield. Enter a description which defines the entire investment costlbenefit and
return flow pattern.
Present Value ($/ha): Enter this value of costlbenefit in units of $/ha. A cost is entered
as a negative number, benefit as a positive number. Because TIMRET allows unrestricted input
for the description of the costlbenefit, it cannot determine whether a transaction should be a cost
or a benefit; so it is important to enter the present value with the correct sign, but the program
does check for this type of error.
6
First Year; Relative to year 0 in which the costlbenefit occurs. This is a required input for
all costslbenefit analysis.
Last Year; Relative to year 0, in which the costlbenefit occurs. The actual number for the
last year must equal or greater than that in the first year. If the last year is equal to the first year,
the costs and benefits incurred in the latter will also apply to the former year.
Step Year; Is the number of years between each occurrence of the costlbenefit. This is
entered only if the costlbenefit occurs more than once. If the costlbenefit occurs in a single year,
the field should be set to 1.
First, last and step years are expressed as stand age at renewal, treatment and harvest.
TIMRET establishes the base year as the earliest year, the year with the smallest number. Length
of investment, i.e., the difference between the first and last year, may not exceed 200 years.
Economic Parameters
Discount Rates are annual rates in percent and may be real (without inflation) or nominal
(with inflation) values.
Inflation Rate is the average annual rate in percent expected over the life of the investment.
Use an inflation rate of 0% for analyses done in (real or constant) dollar terms.
Discounting:
All cash flows are treated as if they occur at the beginning of the year.
Therefore, costs and revenues that occur in year
1
are discounted for one year, i.e., to the
beginning of year O.
Cash Flows: Each activity is expanded into one or more cash flows. A cost or revenue
amount is calculated for the first year and repeated every step year until the last year. If the first
year is the same as the last year, only one cash flow is computed.
No cash flows will be
computed for years beyond the last specified for the transaction. The extended cash flow amount
is computed where N is the number of years from the base year of the activity.
7
Activity List
A list of costlbenefit activities is displayed, at all times except when displaying a graph or
calculating financial criteria. Several activities are displayed at once, but the user can scroll
through all of them by using the arrow keys and the Page Up and Page Down keys. A full screen
activity list can be obtained by executing the Window macro (Alt-W) to eliminate the results
window. Simply reexecute the Window macro to restore the results window.
A complete activity list can be printed by executing the Print macro (Alt-P), choosing Text
from the menu, and typing in the number of lines that need to be printed.
Financial Analysis Results
Tabular Presentation
Financial returns are computed (Appendix 2) after executing the Calculate macro (Alt-C) and
selecting the Calculate option. Within a few seconds the results will be displayed in the financial
analysis section of the screen.
The four flDancial criteria are shown for the six discount rates selected.
Internal Rate of Return (IRR) is the discount rate which equates discounted costs and
revenues. IRR is the return on investment if all immediate revenues are reinvested in the project.
IRR is not affected by the discount rate, but is shown in each column for convenience. If the IRR
can not be determined then ERR, i.e., displaying error will be shown.
Present Net Worth (pNW) is discounted benefits less discounted costs. A positive value
indicates return exceeding the discount rate.
BenefiUCost Ratio (B/C) is the present value of the benefits divided by the present value
of the costs. A value greater than 1.0 indicates that the discounted benefits exceed costs.
8
Profitability Index (PI) is the present net worth divided by treatment cost; used to rank
investment in an order of profitability.
Graphical Output
The built-in graphic capability of the Lotus
123
version
3.1
TIMRET package allows
instantaneous on screen display of calculated fmancial criteria and a printed hard copy (Figure I,
Appendix
3).
This feature is also available on other distributed fmancial analysis software
packages, such as FIDME PC or QUICK SIT..VER software packages. To display a graph on the
screen, execute the Graph macro (Alt-G), choose the fmancial criteria to graph, and then choose
the style of graph. Hit any key to return to editing. To print the graph most recently plotted,
execute the Print macro (Alt-P) and choose Current graph from the menu.
Solution to Unique Problems
Too Many Cash Flows: Long investment cases may result in more than 100 cash flows,
which must be reduced to conduct the analysis. An excessive number of cash flows can occur
from including several annual costs, such as management fees, and leases in the transactions. One
solution is to combine similar activities within a year, e.g. all activities with the same tax
treatment. Another option is to combine costs or revenues, spread over several years into fewer
payments, e.g., instead of annual management fee, apply double amount every second year. This
will have only a minor effect on the outcome.
Long Investment Periods: If it extends beyond 200 years. Although this is unlikely to
occur, one solution would be to arbitrarily reduce the investment length to
200
years by
compressing cash flows into a shorter period. The present value (after discounting) of costs or
revenues, that occur in the distant future is very small, so the effect on the outcome is small. A
dollar received in
200
years is worth less than 0.1 cents today after discounting at 5 percent.
9
SaveJLoad Delete
TIMRET allows the analyst to save and load cases from a data disk. To savelload cases
using a floppy disk, it is a good idea to first change the working directory to the floppy drive.
This is accomplished by executing the File macro (Alt-F) and choosing Directory from the menu.
At the prompt, enter in the new working directory to be the path of one of the floppy disks (e.g.,
A:B:).
Saving the Current Case: Execute the File macro (A1t-F), choose Save from the menu, and
type a filename that identifies the case. If this file already exists, the analyst will be presented with
another menu with three options, Cancel, Replace, and Backup. Choose Cancel to abort the save
operation, Replace to write over the old file, and Backup if the old file is still needed.
Retrieving a Case: Execute the File macro (AIt-F), choose Retrieve from the menu and
type in the filename of the case to be retrieved.
Advice When Using TIMRET
Distinguishing Cases from Worksheets: There is no way to distinguish a saved TIMRET
case from a regular Lotus worksheet. To avoid error and confusion, save all TIMRET cases on
separate data disk or in a separate directory.
Making Backups: As a precaution, one should make a backup copy of the TIMRET disks upon
receipt for safe storage. These programs are not copy protected or copyrighted. Do not use the
original program and data disks, except to make additional copies.
Always Verify Inputs: Look out for some of the following common errors that can be
made when using this program.
10
- important treatments left out, especially costs;
- errors in data;
- number of years exceeds 200;
- relative year values are not correctly calculated.
Additional Information
TIMRET Quick reference (Appendix 4) may help in this software operation.
TIMRET was developed at Department of Natural Resources Canada (Canadian Forest
Service), Northern Forestry Centre by:
William J. Ondro, (Senior
Research Economist, Department of Natural Resources
Canada,
Canadian Forestry Service, who developed the original program concept, design, directed the
work, and wrote the documentation.
Wade Marshall, (Computer Analyst, Consultant of Department of Natural Resources Canada
performed all program design
and coding of
TIMRET, and
also
helped to write the
documentation.
Your comments, and suggestions on TIMRET are encouraged and welcome. Please contact:
William
J. Ondro
Department of Natural Resources Canada
Canadian Forest Service
Northwest Region, Northern Forestry Centre
5320 - 122 Street
Edmonton, Alberta
T 6H 3S5
Tel.: (403) 435-7203
or
(403) 435-72 10
Neither Department of Natural Resources Canada, (Canadian Forest Service), Northwest
Region, Northern Forestry Centre nor the authors warrant this program in any way. Department
of Natural Resources Canada will not be held liable for damages of any kind that may result from
the use of this software. AU efforts have been taken to ensure that this software performs as
II
described.
TIMRET is within the public domain and may be copied without restriction. Trade names
are mentioned for information purposes only.
Their use does not constitute an endorsement by
Department of Natural Resources Canada (Canadian Forest Service), Northwest Region nor the
authors.
Acknowledgments
The authors thank D. MacIsaac, Department of Natural Resources Canada, Canadian Forest
Service, Edmonton, Alberta for providing useful review comments ..
12
List of Suggested Readings
Anderson, FJ. 1979. Ontario reforestation policy benefits and costs.
Can. Pub. Policy 3(1):
336-347.
Alemdag, I.S.; Honer, T.G. 1973. Relationships between breast-height and stump diameter for
eleven tree species from eastern Canada. Environ. Can., Can. For. Serv., For. Manage. Inst.,
Ottawa, Ont. Inf. Rep. FMR-X-149. 14 p.
Brumelle, S.L.; Carley, J.S.; Vertinsky, I.B.; Wehrung, D.A.
1988.
Evaluating silvicultural
investments: An analytical framework. FEPA Research Unit, Univ. Brit. Col., Vancouver,
British Columbia, Working Paper 116.
Buongiorno, J.; Giless, J.K. 1987. Forest management and economics. MacMillan Publishing
Company Ltd., New York, N.Y.
Cassler, G.L.; B.L. Anderson; Aplin, R.D. 1984. Capital investment analysis using discounted
cash flows. Grid Publishing, Inc. Columbus, Ohio.
Fraser, T.; Tustin, J.R.; Szumidlo, Z. 1977. Financial evaluation of forestry projects. New
Zealand Forest Service, Wellington, N.S., Inf. Ser. 75.
Gittinger, J.P. 1982. Economic analysis of agricultural projects. 2nd edition. The John Hopkins
University Press, Baltimore and London.
Gregerson, H.M.; Contreras, A.H.
1979.
Economic analysis of forestry projects. Food and
Agric. Organiz. of the United Nations, Rome. FAO Forestry Paper 17.
Gunter, J.E.; Haney, H.L. 1984. Essentials of forest investment analysis. Oregon State Univ.
Book Stores Inc., Corvalis, Oregon.
Hawkins, CJ.; Pearce, D.W.. 1971. Capital investment appraisal. The MacMillan Press Ltd.
London and Basingstoke.
Hannula, O. 1971. The effect of average stand diameter on tree length logging cost. Pulp Pap.
Mag. Can., 72(2):96-100.
13
Heaps, T.; Pratt, B. 1988. The social discount rate for silvicultural investments. FRDA Report
prepared for B.C. Ministry of Forests. Victoria, British Columbia.
Honer, T.G.
1967.
Standard volume tables and merchantable conversion factors for the
commercial tree species of central and eastern Canada. Can. Dep. For. Rural Dev., For., Inf.
Rep. FMR-X-5.
Johnstone, W.D. 1976. Variable-<iensity yield tables for natural stands of lodgepole pine in
Alberta. Fish. Environ. Can., Can. For. Serv., Ottawa, Ont., For. Tech. Rep. 20. 110 p.
Ondro, W.J.; Constantino, L.F. 1990: Financial returns from fertilizing 70-year-old lodgepole
pine near Hinton, Alberta. For. Chron. 66(3): 287-292.
Ondro, W.J. 1990. Benefits, costs and profitability of pre commercial thinning of three lodgepole
pine stands in Alberta. For. Can., North. For. Cent., Edmonton, Alta., Unpubl. rep.
Row, C.; Kaiser, H.F.; Sessions, J. 1981. Discount rate for long-term Forest Service Investments.
J. For. 179(6):367-369.
Sudgen, R.; Williams, A.H.
1978.
Principles of practical cost-benefit analysis.
Oxford
University Press.
Vasievich, J.M.; Frebis, R.; Wiethe, R.W. 1984. Quick Silver. The Forestry Investment Analysis
Program, Version 2.0 PC. Developed by U.S. Dep. Agric., For. Serv., the Southeastern Center
for Forest Economic Research (SCFER), Triangle Park, North Carolina, U.S.A. November
1984.
14
APPENDIX 1
DEFINITION OF TERMS
Increased wood yield is the difference between total (merchantable) volume in treated and
untreated (control) stands at rotation age. Market value of increased yield is the volume of
increased wood yield multiplied by the market value of stumpage.
MARKET VALUE OF PRODUCTS FROM TREES REMOVED BY TREATMENT
Trees removed by treatment is the total (merchantable) stem volume used for various products.
Their market value is the volume of trees removed multiplied by market value of stumpage.
15
APPENDIX 2
Computer screen display of TIMRET financial information on: treatment costlbenefit, stand age at activity or harvest,
and financial returns at rotation
COSTIBENEFIT DATA:
Treatment
Stand age at activity or harvest (year)
Description of
Cost
Benefit
costslbenefits items
($lha)
($lha)
Treatment Cost
First
-400
Step'
Last
25
25
Trees Removed by treatment
220
25
25
Market Value of Incr. Yield
680
60
60
65
60
60
880
60
60
Log Size Premium
Logging Cost Reduction'
Conventional logging
Specified inflation rate
FINANCIAL ANALYSIS:
=
0%
Discount rate
Criterion
3%
4%
5%
6%
8%
10%
6.49
6.49
6.49
6.49
6.49
6.49
397.50
231.80
1 1 4.60
31.42
-70.09
-122.18
BIC (ratio)
1.99
1.58
1.29
1.08
0.82
0.69
PI (ratio)
0.99
0.58
0.29
0.08
-0.18
-0.31
IRR (%)
PNW ($lha)
'Denotes the number of years between first and last activity.
'Dentoes the difference in logging cost between untreated and treated stands.
15
APPENDIX 2
Computer screen display of TIMRET financial information on: treatment costlbenefit, stand age at activity or harvest,
and financial returns at rotation
COSTIBENEFIT DATA:
Stand age at activity or harvest (year)
Treatment
Description of
Cost
Benefit
costslbenefits items
($lha)
($lha)
Treatment Cost
First
-400
Step'
Last
25
25
Trees Removed by treatment
220
25
25
Market Value of Incr. Yield
680
60
60
65
60
60
880
60
60
Log Size Premium
Logging Cost Reduction'
Conventional logging
FINANCIAL ANALYSIS:
Specified inflation rate
=
0%
Discount rate
Criterion
3%
4%
5%
6%
8%
1 0%
6.49
6.49
6.49
6.49
6.49
6.49
397.50
23 1 .80
114.60
31.42
-70.09
-122.18
BIC (ratio)
1.99
1.58
1 .29
1.08
0.82
0.69
PI (ratio)
0.99
0.58
0.29
0.08
-0.18
-0.31
IRR (%)
PNW ($lha)
'Denotes the number of years between first and last activity.
'Dentoes the difference in logging cost between untreated and treated stands.
16
APPENDIX 3
Figure I . Output from TIMRET showing profitability analysis of lodgepole thinning at three
different financial criteria.
a) Present net worth
b) Benefit/cost ratio
c) Profitability index
"'"
a)
....
.....
�
lDO
i•
'"
c
�
•
'00
j
.� L-
�
__
�
5
'
H
�
____________________________________
.1.5
,b)
.
. .
�
u
c
�«0
i
�
c'
�
�..�
•
. .
•
,
•
,.
c)
j
: ,.s.
�
�
�
::.
t-t»».;yJ
o� UUIIJ
I
\0
17
APPENDIX 4
TIMRET QUICK REFERENCE
The basics of using TIMRET
TIMRET is a Lotus 123 Worksheet equipped with a number of macros to help the user work
efficiently. All macros are executed by using an Alt-detter key> combination. In order to run
a macro, the Alt key must be held down while the letter key is pressed. All macros described
below can also be accessed through the use of a main menu. (AIt-M)
The macros also take advantage of Lotus-style menus which appear at the top of the screen. To
use a Lotus menu, move the highlighted cursor over the menu choice and hit the Enter key or
simply type the first letter of the menu choice.
To edit blocks of data in the editing area, it is encouraged that the user use the Lotus 123
commands of Copy, Move, and Range Erase. Do not use Worksheet Delete Row or Worksheet
Insert Row. Other useful features available in Lotus 123 are the F2 key (edit an entry), and the
FlO key (redisplay graph). Please refer to your Lotus 123 manual for more information on these
and other editing commands.
The TIMRET macros
AIt-C (Calculate)
When the user adds, deletes, or edits new data, the results in the bottom window will not change.
In -order to see the results of changes made, this macro must be used.
18
AIt·F (File)
This macro is used to bring a case into memory from disk or to save the current edited data to
disk. Using this macro, the user can save the current case to disk, retrieve a case from disk into
memory, or change the working directory. Only files previously saved with TIMRET can be
loaded in without error.
AIt·G (Graph)
This macro allows the user to graph PNW, H/C, or PI versus the discount rate. The macro will
prompt the user for the type of data and style of graph desired. Once chosen, the graph will be
displayed on the screen. Hit any key to return editing.
AIt·P (Print)
This macro is used for printing either the edited data and results or a graph of one of the
economic statistics. Once the user has specified what to print, the macro will pause and tell the
user to ready the printer. Once the printer is ready, the user should hit a key to send the selected
output to the printer.
Alt·W (Window)
The economic results normally appear in a window at the bottom of the screen. If full screen
editing is desired, execute this macro eliminate the window. Simply execute the macro again to
reestablish the window.
Alt·X (eXit)
Exits the user from TIMRET as well as Lotus 1 23. The user shouldmade sure that he has saved
your data with Alt-F before exiting.