1
««»
Research Branch
Technical Bulletin 1 993-1 3E
Agroecological
Resource Area
Databases for
the Prairies:
User's
Manual
Centre for Land
and Biological Resources Research
Centre de recherches sur
les
terres et les ressources biologiques
Canada
Cover illustration
The images represent
the Research Branch's objective:
improve the long-term competitiveness of the Canadian
agri-food sector through the development and transfer of new
to
technologies.
Designed by Research Program Service.
Illustration
Les dessins
de
la
couverture
de la Direction generale de la
ameliorer la competitivite a long terme du secteur
agro-alimentaire canadien grace a la mise au point et au transfert
de nouvelles technologies.
recherche
illustrent I'objectif
:
Conception par
®
le
Service aiix
programmes de recherches.
Agroecological Resource Area
Databases for the Prairies:
User's
Manual
V. Kirkwood, A. Bootsma, R. de Jong, J. Dumanski,
J.C. Hiley, E.G. Huffman, A. Moore, C. Onofrei,
W.W.
Pettapiece, B. Vigier
Tec±inical Bulletin
1993-13E
Centre for Land and Biological Resources Research
Research Branch, Agriculture Canada
1993
Copies of
this publication are available
from:
Centre for Land and Biological Resources Research
Research Branch, Agriculture Canada
Central Experimental
Farm
Ottawa, Ontario
KIA 0C6
Published by Cartographic Design and Reproduction Unit
Centre for Land and Biological Resources Reseeirch
CLBRR Contribution No. 93-17
© Minister of Supply
Cat. No.
and Services 1993
A54-8/1993-13E
ISBN 0-662-21007-7
Table of Contents
v
Abstract /Resume
Preface
vi
1.0
Introduction
2.0
Data
Files Associated
2.1
Basic Climate Data
1
with the Agroecological Resource Area
Maps
6
Climate Indices
Daily Climatic Data from Atmospheric Environment Service Data
2.4
Economic Data from the Census of Agriculture
2.5
Forage Aridity Index
2.6
Land Use Data from the Census of Agriculture
2.7 Simulated Wheat Yields
2.8
General Soil and Landform Information
2.9
Soil Cross Tabulation Link into Soil Names and Soil Layer Files
2.10 Soil Temperature File
2.11 Wheat Stress Data
2.2
2.3
References
Appendix
5
7
8
9
10
11
12
13
14
15
16
19
A
21
List of Figures
Figure
1.
Agroecological Resource Area
Map
of Alberta
2
Figure
2.
Agroecological Resource Area
Map
of Saskatchewan
3
Figure
3.
Agroecological Resource Area
Map
of Manitoba
4
List of
Table
1.
Data
Files Associated
Tables
with the Agroecological Resource Area
m
Maps
5
Digitized by tine Internet Arciiive
in
Agriculture
2012
witin
funding from
and Agri-Food Canada - Agriculture
et
Agroalimentaire
http://archive.org/details/agroecologicalre9313kirk
Canada
Abstract
Data files associated with the Agroecological Resource Area (ARA) maps for the
Canadian Prairies include compiled data on soil and landform, regional climate, soil
moisture conditions, simulated wheat yields imder dryland conditions, and farm
economics and land use information from the Census of Agriculture. The data are stored
within an ARC/IMFO Geographic Information System (GIS).
Agroecological Resource Areas (ARAs) are biophysically homogenous units at a scale of
1:2 million, based on ecoclimatic zonation, landform and soil characteristics. These units
can be used to study agricultural systems, land use, conservation, and the impacts of
various management and socio-economic practices. They are a convenient planning unit
upon which
to develop databases for use in agricultural research.
ARA maps
Saskatchewan and Manitoba, and the associated
data files, currently reside in an ARC /INFO GIS which is part of the Canada Soil
Information System (CanSIS).
The
digitized
for Alberta,
Resume
Les fichiers de donnees associees a la representation cartographique de Zones de
Ressources Agroecologiques (ZRA) des provinces des Prairies comprennent des donnees
pedologiques, geomorphologiques et climatiques ainsi que des donnees d'eau dans le sol,
des simulations de rendements de ble en conditions arides, et de I'information sur
I'utilisation des terres et I'economie a I'echelle de la ferme du Recensement de
I'Agriculture. Ce Systeme d'lnformation Geographique (SIG) regroupe plusieurs bases
de donnees qui sont accessibles par ARC /INFO.
Les Zones de Ressources Agroecologiques (ZRA) sont des unites cartographiques
comportant des caracteres biophysiques homogenes rapportees a une echelle de
1:2,000,000. Ces zones sont delimitees par des facteurs particuliers de pedologie, de
formes de terrain et d'eco-climat. Ces unites peuvent etre utilisees pour la planification
d'etudes sur la situation agricole, la conservation et I'utilisation des terres et I'impact de
divers systemes de regie et de politiques socio-economiques.
Des cartes numeriques ZRA sont disponibles pour I'Alberta, la Saskatchewan et le
Manitoba et leurs bases de donnees correspondantes, en systeme SIG, actionnees par
ARC /INFO font aussi partie du Systeme d'lnformation sur les Sols au Canada (SISCan).
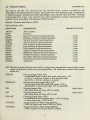
Preface
Many people have taken part in the development of the data files associated with the
Agroecological Resource Area maps. The following is a list of the various data files, and
the names of the people who developed them:
(CLIMBAS.DAT) - A. Bootsma
Climate Indices (CLIMIND.DAT) - A. Bootsma
Daily Climatic Data (DAILY.DAT) - A. Bootsma
Basic Climate Data
Economic Data (ECONOMICS.DAT)
-
Huffman, J.C. Hiley, V. Kirkwood
A. Bootsma
Huffman, J.C. Hiley, V. Kirkwood
E.C.
Forage Aridity Index (FORARID.DAT) Land Use Data (LANDUSE.DAT) - E.C.
Simulated Wheat Yields (SIMYLDWH.DAT) - C. Onofrei
General Soil and Landform Information (SOILBASE.DAT) — W.W. Pettapiece
Soil Cross Tabulation Link (SOILLINK.DAT) - R.G. Eilers, G.A. Padbury,
J.
Tajek, V.
Temperature File (SOILTEMP.DAT) - A. Bootsma
Wheat Stress Data (WHTSTRESS.DAT) - R. de Jong
Soil
VI
Kirkwood
Introduction
1.0
The Agroecological Resource Area maps were developed
to provide biophysically
units at a scale of 1:2 million w^hich can be used to study agriculture, land use
homogenous
and conservation.
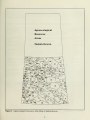
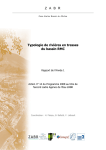
These Agroecological Resource Areas (ARAs) represent areas of generally similar agricultural
potential, and are based on ecoclimatic zonation, landform and soil characteristics (Figure 1).
The
ARAs have
served as a convenient planning unit upon which to develop data for use in
It is the purpose of this report to document the types of information stored
agricultural research.
in these data files.
The
digitized
ARA maps for Alberta, Saskatchew^an and Manitoba, and the associated data files,
ARC /INFO Geographic Information System (GIS). This GIS is part of the
currently reside in an
Canadian
Soil
Information System (CanSIS). The
common linking factor, or key, between all
the
data files is the combined ARA number and province designation. ARA numbers are
unique wdthin provinces. The addition of the province code makes the key unique country-wide.
There is also a linkage, through the soil series code, to the Soil Names File and Soil Layer File,
ARA
which are stored
in the National Soil DataBase.
Data can be exported from these files in Arc Export or ASCII format, along with appropriate
documentation. Requests to obtain these data should be addressed to:
Dr. J. Dumanski, Research Scientist,
Centre for Land and Biological Resources Research,
Research Branch, Agriculture Canada,
Central Exp)erimental Farm, Building 74,
Ottawa, Ontario,
Canada,
The
ARA maps
KIA 0C6
can be obtained in electronic or hard copy format by contacting:
Head, CanSIS,
Centre for Land and Biological Resources Research,
Research Branch, Agriculture Canada,
Central Experimental Farm, Neatby Building,
Ottawa, Ontario
Canada,
KIA 0C6
file
Agroecological
Resource
Areas
Alberta
Figure 1 Agroecological Resource Area
Map
of Alberta
Agroecological
Resource
Areas
Saskatchewan
^
.
P^-^^^^ii2^^^n
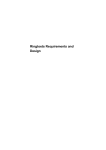
Figure 2 Agroecological Resource Area
Map
48 (
^--r^^^{\
of Saskatchewan
Agroecological
Resource
Areas
Manitoba
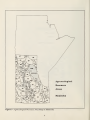
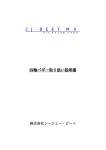
Figure 3 Agroecological Resource Area
Map
of Manitoba
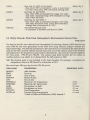
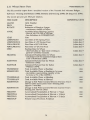
2.0
Data Files Associated with the Agroecological Resource Area
Maps
into two broad categories: measured or derived physical values which
can be used as input to various models; and the output from several crop, soil moisture and
The data can be grouped
climate
models (Table
Table 1 Data
Data File
Files
1).
Associated with the Agroecological Resource Area
Name
Maps
Data Type
Description
CLIMBAS.DAT
Basic Climate Data based on 1951-80 normals,
reported as average monthly values
Derived
CLIMIND.DAT
Climate indices derived from the 1951-80 normals
Derived
DAILY.DAT
Daily cUmate data, 1955-1985
Measured
ECONOMICS.DAT
Economic
Measured
1981
&
data.
Census of Agriculture,
1986
FORARID.DAT
Forage Aridity Index, 1965-1985
Modelled
LANDUSE.DAT
Crop proportions. Census of Agriculture,
Measured
1981
&
1986
SIMYLDWH.DAT
Output from
SOILBASE.DAT
General
SOILLINK.DAT
Cross tabulation link into Soil
Layer files
SOILIEMP.DAT
Soil
WHTSTRESS.DAT
Wheat
soil
PIXMOD wheat model
Modelled
and landform information
Names and
Derived
Soil
temperature data by month
stress data
using Versatile Soil Moisture
Measured
Modelled
Modelled
Budget
Data file and variable names appear in this manual in the form in which they must be used
during an ARC /INFO retrieval request. The ordering of the variables within each data file is
the same as will appear on the computer screen during an ARC /INFO retrieval request.
CLIMBAS.DAT
Basic Climate Data
2.1
This data
file
contains monthly values for a
number
of basic climate variables, which were
derived from Atmospheric Environment Service (AES) station normals data (1951-1980) using
and expert knowledge. Solar radiation data are
a combination of Thiessen polygon routines
based on a 100 km grid database of 1951-1980 climatic normals data. Vapour pressure and wind
are from a 1941-1970 100 km grid.
Items from this
desired.
file
are retrieved
by choosing the appropriate variable number, and
The variable numbers are as
the
months
follows:
VARIABLE
NUMBER
REPORTING UNITS
VARIABLE
Maximum Air Temperature
Minimum Air Temperature
2
3
4
Mean
Mean
Mean
5
Rainfall
0.1
mm
6
Snowfall
0.1
cm
7
Total Precipitation
0.1
mm
8
Solar Radiation at Surface
9
Vapour Pressure
Mean Wind Speed
10
Daily
Daily
Daily Temperature
o.i°c
0.01
MJ/mVday
0.01
at 10
m or 33
12
Extreme
Extreme
Maximum Temperature
Minimum Temperature
13
Number
of
11
o.rc
o.rc
ft.
height
Days with Rain
m/sec
O.rc
O.rc
0.1 day
N.B. The decimal point is not included in the data; therefore, for example, a
maximum air temperature shown as 100 should be interpreted as 10.0.
One
record per
ARA
per variable.
NAME
ARANO
ARA Number
PROV
VAR
Variable
JANV
Variable Value for January
FEBV
Variable Value for February
ITEM
DESCRIPTION
Province
Number
as explained above
MARV
Variable Value for
APRV
Variable Value for April
March
MAYV
Variable Value for
JUNV
Variable Value for June
JULV
AUGV
Variable Value for July
Variable Value for August
SEPV
Variable Value for September
OCTV
Variable Value for October
NOW
DECV
May
Variable Value for
November
Variable Value for
December
mb
0.01
mean
daily
22.
CLIMIND.DAT
Climate Indices
The data in this file were derived from the 1951-80 climate normals provided by the
Atmospheric Environment Service (AES). AES station data were adjusted using a combination
of Thiessen polygon routines and expert knowledge to provide one value per ARA. Potential
evapotranspiration values were derived from daily temperature normals interpolated from
monthly values using Baier and Robertson (1965) formula 1.
Reference:
One
Bootsma and Boisvert
record per
ITEM
(1991).
ARA.
NAME
REPORTING UNITS
DESCRIPTION
ARANO
ARA Number
PROV
Province
January Potential Evapotranspiration
February Potential Evapotranspiration
March Potential Evapotranspiration
April Potential Evapotranspiration
May Potential Evapotranspiration
June Potential Evapotranspiration
July Potential Evapotranspiration
August Potential Evapotranspiration
September Potential Evapotranspiration
October Potential Evapotranspiration
November Potential Evapotranspiration
December Potential Evapotranspiration
JANPE
FEBPE
MARPE
APRPE
MAYPE
JUNPE
JULPE
AUGPE
SEPPE
OCTPE
NOVPE
DECPE
YEARPE
Annual PE
.1
,1
.1
,1
.1
.1
.1
.1
.1
.1
.1
.1
.1
mm
mm
mm
mm
mm
mm
mm
mm
mm
mm
mm
mm
mm
N.B. The following are based on mean daily air temperature, interpolated from monthly normal
values using Brooks (1943) sine wave interpolation. All values are rounded to the nearest
whole
GDD>5C
unit.
Growing Degree Days >5°C
-
YRGDD>5C
Growing Season
-
GSE
Start
date
mean
daily air temp. <5°C in
fall
accumiilated from time mean temp. >15°C in spring
to time mean temp. <15°C in fall
Com Heat Uruts
(CHUEl)
com; from CHUS to CHUEl
Accumulated Com Heat Units (CHUE2)
- CHU for grain com from CHUS to CHUE2
CHU for
Julian
day #
Julian
day #
daily air temp. >5°C in spring
Accumulated
-
ACCCHU2
mean
Growing Degree Days >15°C
-
ACCCHUl
date
Growing Season End
-
GDD>15C
Growing Degree Days >5°C
accumulated from date mean daily temp. >5°C in
spring (GSS) to date mean temp. <5°C in fall (GSE)
Seasonal
-
GSS
accumulated from 10 days after mean daily temp. >5°C
or Apr. 1, whichever is later, to date of mean temp,
min. <5°C or Oct 31, whichever is earlier
silage
CHUS
Start date for
CHU accumulation
Julian
when CHU accumulation starts as determined
by when mean temp. >9°C (estimated seeding date)
End Date for ACCCHUl
- Day when CHU accumulation for silage com ends;
date mean minimum temp. <5°C (estimated average
-
CHUEl
date of
JuHan day #
first fall frost)
End Date for ACCCHU 2
Day when CHU accumulation for grain com ends;
date mean minimum temp. <3.6°C (first estimated
CHUE2
day #
Date
Julian
day #
-
average date of occurrence of -2°C)
TTLPTU
Total Photo-thermal Units
as calculated in Bootsma
-
2.3
and Boisvert
(1991)
Daily Climatic Data from Atmospheric Environment Service Data
DAILY.DAT
The data
were derived from Atmospheric Environment Station (AES) data for the
ARA level using Thiessen polygon routines and
expert knowledge. The stations represented in this data file are not necessarily the same as those
used for the basic monthly climate normals data, since not all the stations used in the Normals
calculations have the long-term records used for the Daily file. The records in this file represent
two time series: 1955-65 and 1966-85. The stations used differ between the two series, as
weather stations were added to or deleted from the AES system in 1965.
in this
file
years 1955-85, and were generalized to the
N.B. The decimal point is not included in the data; therefore, for example, a
temperature shown as 250 should be interpreted as 25.0.
One
record per
ITEM
NAME
ARA per
day
for the
maximum
1955-85 period.
REPORTING UNITS
DESCRIPTION
ARANO
ARA Number
PROV
YEAR
RAIN
Province
Year of data
Month of data
Day of data
Maximum Air Temperature
Minimum Air Temperature
Precipitation as Rain
SNOW
Precipitation as
PPTNTTL
Total Precipitation
0.1
POTEVAP
Potential Evapotranspiration
- based on Baier and Robertson (1965) formula 1
0.1
MONTH
DAY
TEMPMAX
TEMPMIN
air
Snow
o.rc
o.rc
0.1
mm
0.1
cm
mm
mm
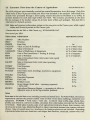
ECONOMICS.DAT
Economic Data from the Census of Agriculture
2.4
The ARA polygons were manually overlaid on census Enumeration Area (EA) maps. Only EAs
which were at least 70 percent within one ARA were included in the analysis. Individual farm
records were processed through a farm typing routine discussed in Huffman et al. (1992), to
produce statistics for each farm type within each ARA. The economic parameters in this data
file are averages of the median values for all farm types within each polygon. This data file is
valid only for dryland systems.
N.B. Sales and expenses information pertain to the year prior to the Census year, while capital
values and livestock pertain to the Census year.
•
Denotes data
One
for the 1981 or
record per
ITEM
NAME
1986 Census,
e.g.,
ECONOMICS81.DAT.
ARA.
REPORTING UNITS
DEFINITION
ARANO
ARA Number
PROV
Province
FMSIZE
Farm
VALLND
Value of Land & Buildings
Value of Livestock
Value of Machinery & Equipment
Cost of Fuel (machinery + heating
VALLIV
VALMACH
FUEL
PERT
SALINV
ha
Size
as
as
as
&
drying)
Cost of Fertilizer
Sales to Investment Ratio
investment)
SALEXP
as
as
% of total value
% of total value
% of total value
% of expenses
% of expenses
(total sales /total capital
Sales to Expenses Ratio (total sales /operating
expenses)
TOTEXP
TOTSALES
Total Expenses
$
Total Sales
$
TVALHA
Total Value (land, buildings, machinery, equipment,
$/ha
$/ha
$/ha
$/ha
$/ha
livestock)
TSALHA
EXPHA
FUELHA
FERTHA
Total Sales
Operating Expenses
Fuel Costs
Fertilizer
Costs
GMARHA
Gross Margin
-^ farm size)
REGION
Agricultural Resource Region — a grouping of ARAs to
represent areas of similar agroclimatic potential.
((total sales
-
operating expenses)
$/ha
Notes
Farm size is the total farm area, including owned and rented land. For Total Value, the Census
respondents estimate the present market value of their owned land, buildings, machinery and
equipment. TVALHA = Total value -r farm size. Livestock value (cattle, pigs, sheep, bees,
poultry and others) is a derived variable, calculated from information provided on the number
of livestock.
Total sales includes sales of
agricultural products, shares
from tenants, cash
Marketing Board or Agency payments, income from custom work and
rebates. Sales of capital items (e.g., machinery) or forest products are not included. Operating
expenses includes cash rent, share rent, cash wages, feed, fertilizer, chemicals, custom work, fuel.
advances
for stored crops.
all
and other niiscellaneous expenses. It does not include livestock purchases,
telephone and postage, professional services, insurance. Marketing Board fees,
repairs, electricity
veterinary
bills,
taxes, interest
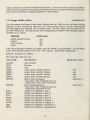
2.5
payments, mortgage payments nor depreciation.
Forage Aridity Index
FORARID.DAT
contains the Forage Aridity Index (Shields and Sly, 1984) for four soil water holding
capacities. It also contains the start and end of the growing season, and the Accumulated
This
file
Growing Degree-days (AGDD) >5°C to selected dates. The file contains data for each year for
the 1965-1985 period. The soil textures and corresponding Available Water Holding Capacity
(AWHC)
are as follows:
AWHC
IHXTURE
SAND, SANDY
LOAM
(mm)
100
150
200
250
LOAM
CLAY LOAM
CLAY
AWHC
the soil is Solonized Solonetz or Organic, then the
index, water holding capacity of the soil = field capacity
If
Reference:
One
De Jong
record per
ITEM
NAME
ARA
Year
Province
Aridity Index
Aridity Index
Aridity Index
Aridity Index
JUNl
JUN15
AUGl
AUG15
SEPl
SEP15
(AWHC
(AWHC
(AWHC
(AWHC
mm
mm
mm
mm
100mm)
150mm)
200mm)
250mm)
Growing Season
5 day *weighted mean air
temperature >5.5° C and stays above
End of Growing Season
- Day when 5 day "^weighted mean air
temperature goes below 5.5°C
Start of
-
MAYl
MAY15
point.
REPORTING UNFTS
DESCRIPTION
PROV
YEAR
GROWE
not applicable. For the aridity
per year.
ARA Number
GROWS
is
permanent wilting
et al. (1991a).
ARANO
ARIDl
ARID2
ARID3
ARID4
-
Julian
day #
Julian
day #
Day when
AGDD ft-om GROWS to May 1
AGDD ft-om GROWS to May 15
AGDD ft-om GROWS to June 1
AGDD ft-om GROWS to June 15
AGDD ft-om GROWS to August 1
AGDD ft-om GROWS to August 15
AGDD from GROWS to September
AGDD from GROWS to September
10
1
15
AGDD from GROWS to October 1
AGDD from GROWS to October 15
AGDD from GROWS to November 1
AGDD from GROWS to GROWE
OCTl
OCT15
NOVl
GROWSTTL
AGDD are
N.B. All
*
mean
weighted
for
reported to the nearest whole number.
—
day n = -!^
"'^
"
"^^
"*^
16
where T
mean
is
daily air temperature.
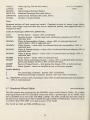
Land Use Data from the Census of Agriculture
2.6
•LANDUSE.DAT
was developed from the same EA overlay onto the ARA polygons as was used
Economic data file. The landuse data are based on an average of the mean values
farm types within each polygon. Only dryland systems are included in this data file.
A land
use
file
to develop the
of
all
Reference:
Huffman
et al. (1992).
* Denotes data for the 1981 or 1986 census year,
crop year.
One
record
ITEM
p)er
NAME
e.g.,
LANDUSE81.DAT. The
data pertains to the current
ARA
REPORTING UNITS
DEFINITION
ARANO
ARA Number
PROV
CROP%
Province
Cropland
as a
PASTURE
Pasture
as a
OATG
BUCK
CORNE
CORNG
Oats for Grain
Grain Corn
PEAS
Field Peas
SUGARS
SUNF
FCROP
Sugar Beets
% of Farmland
% of Farmland
as a % of Cropland
as a % of Cropland
as a % of Cropland
as a % of Cropland
as a % of Cropland
as a % of Cropland
as a % of Cropland
as a % of Cropland
Buckwheat
Ensilage
Com
Sunflowers
Other Field Crops, e.g., beans,
seed and sod (1981 only)
ALFAL
FORAGE
BARLEY
CEFEED
Cereal
OILSEED
Oilseeds
SMRFAL
Summerfallow
SPECL^L
Specialty Crops,
millet,
canary
Alfalfa (1981 only)
Forage Crops
Barley
Used
as Feeds
e.g.,
% of Cropland
as a % of Cropland
as a % of Cropland
as a % of Cropland
as a % of Cropland
as a % of Cropland
as a % of Cropland
as a
vegetables, berries
11
and
fruit
WHEAT
Wheat
CATTLE
REGION
DFMTYPE
SDFMTYPE
Cattle
NFARM
Ehirum and winter)
(spring,
as a
%
of Cropland
#/ha
Agroecological Resource Region
Dominant Farmtype (See codes, below)
Subdominant Farmtype (See codes, below)
Number of Farms Studied
Notes
land owned and rented. Cropland includes all annual crops, fallow,
other forage crops and tame hay, but not improved pasture, other improved land, or
Farmland includes
alfalfa,
unimproved
Codes
for
all
land.
Farmtypes (DFMTYPE, SDFMTYPE)
—
PAST
Pasture System
DOMSP
Specialty System
cultivated land
DOMWS
DOMWW
& Summerfallow System ~ wheat >50% of cultivated land and
summerfallow >20% of cultivated land
Wheat System - wheat >50% of cultivated land and summerfallow <20% of
DOMWO
Wheat
pasture
-
>70%
of farmland
special crops (com, sunflowers, potatoes, etc.)
>10%
of
Wheat
cultivated land
& Oilseeds System - wheat >30% of cultivated
land and oilseeds
>20%
of
cultivated land
DOMWB
Wheat
&
- wheat >30%
Barley System
of cultivated land
and barley >20% of
cultivated land
DOMES
DOMBF
Barley System
DOMFF
Feeds
MIXED
Mixed System ~ farms not
-
barley
>25%
of cultivated land
Barley, Feeds and Forages System ~ barley >25% of cultivated land, and feed
grains plus forages are 25% to 50% of cultivated land
&
Forages System
-
feed grains plus forages
classified in
>50%
of cultivated land
any of the above systems
System Modifier
Low
percentage of pasture: pasture <20% of farmland
Moderate percentage of pasture: pasture >20% and <70% of farmland
e.g.,
05DOMWS = pastiire <20% of farmland, wheat >50% of cultivated land, and summerfallow
>20%
of cultivated land.
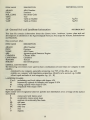
2.7
Simulated Wheat Yields
This
file
contains data generated
major agricultural
soils
were
SIMYLDWH.DAT
by the
PIXMOD wheat model
identified within each
(Onofrei (1986)). Up to three
for the model. Each
ARA to provide input
code (SOIL_CODE). The SOIL_CODE also pro\'ides a link to
the Soil
Soil Layer files available through CanSIS (see SOILLINK). Thirty-one years
of weather data (1955-1985) were used as input to the model.
by
Names and
soil is identified
One
record per
its soil
series
ARA per SOIL_CODE
per year.
12
11
hM NAME
REPORTING UNITS
DESCRIPTION
ARANO
ARA Number
PROV
Province
SOIL_CODE
Soil Series
Code
YEAR
Year
YLDS
YLDF
Yield on Stubble
kg /ha
kg /ha
Yield on Fallow
soilbasedat
General Soil and Landform Information
2.8
contains information about the climate index, landform, texture class and soil
development as identified on the Agroecological Resource Area maps for Alberta, Saskatchewan
This data
file
and Manitoba.
One
record per
ARA.
NAME
ITEM
DESCRIPTION
ARANO
ARA Number
PROV
Province
NAME
ARA Name
ARR
CLIMINDX
Agroecological Resource Region
Climate Index
LANDFORM
Landform
TEXTURE
SOILDEV
Texture
Soil
Development
GENERAL CONVENTIONS
The following conventions were used
to
show combinations
of
more than one category
in each
variable:
-
dominantly one category, generally occupying over 70% of the ARA, e.g., [A]
mainly one category with significant proportions (20-40%) of a second, e.g., [A(B)]
about equal amounts of two categories, e.g., [A - B].
LANDFORM CLASSES
U or L
H
M
S
undulating and level plains with slopes <5%
or hillands with slopes 5-15%
rolling uplands with slopes 5-15%
steeplands with slopes >15%
hummocky uplands
TEXTURE CLASSES
Eight classes were recognized, based on particle size distribution of an average of the surface
and
subsoil.
S
coarse sand and loamy sand
SL
L
moderately coarse sandy loam
medium to moderately fine loam
SIL
silt
CL
clay
loam
loam
SIC
silty clay
C
clay
O
organic
13
DEVELOPMENT CLASSES
Brown Chemozemic
BR
DB
Dark Brown Chemozemic
SOIL
Chemozemic
BL
Black
DG
Dark Gray Chemozemic
SS
SO
GL
Solodized Solonetz
Solods and Solonetzic intergrades
Gray Luvisol
DG
Dark Gray Luvisolic
BS
Brimisolic
RE
Regosolic
GY
Gleysolic
O
Organic
R
Rock
AGRO-CLIMATE CLASSES
Slight Moisture Limitation
2A
3A
Moderate Moisture Limitation
2H
3H
4H
5H
Slight Heat Limitation
Moderate Heat Limitation
Severe Heat Limitation
Very Severe Heat Limitation
Moderate Limitation means
to less than
15%
that
one of the major cereal crops (wheat, barley, canola)
Very Severe Limitation
is
essentially
Soil Cross Tabulation
This cross tabulation
which
is
file
30%
of the cultivated area
beyond arable
is
in annual cereals for grain.
agriculture.
Link into Soil Names and Soil Layer Files
SOILUNK.DAT
provides the link between the
ARA polygons
and the
stored in the National Soil Data Base. For the purpose of running the
Soil
One
Soil Inventory
Map
record per soil code per
ITEM
NAME
Attribute Files for Alberta, Saskatchewan
soils in
each
and Manitoba.
REPORTING UNITS
DESCRIPTION
ARA Number
PROV
Province
SOIL.CODE
SOILCULTPER
Soil Series
Code
Percent of Cultivated Area Represented by
Named
SOILPOLYPER
File,
ARA.
ARANO
ARACULTPER
Layer
PIXMOD wheat
model, the output of which is in the data file SIMYLDWH, up to three agricultural
ARA polygon were chosen to provide soil layer data for input to this model.
Reference:
limited
of the crop area.
Severe Limitation means that less than
2.9
is
Soil
Percent of
Percent of
ARA
ARA
Cultivated
Represented by
Named
Soil
%
%
%
14
I
Soil
2.10
Temperature
soiltemp.dat
File
were derived from ARA monthly normals data (1951-1980) and consist of
an estimation of average monthly soil temperatures at 10 cm and 50 cm depth, and other derived
The data
in this file
soil climatic
Reference:
One
parameters.
Ouellet (1973).
record per
ITEM
ARA
NAME
per depth.
REPORTING UNFTS
DESCRIPTION
ARANO
ARA Number
PROV
DEPTH
Province
Depth
cm
JAN
MAR
January Soil Temperature
February Soil Temperature
March Soil Temperature
APR
April Soil Temperature
MAY
May
°C
°C
°c
°c
°c
°c
°c
°c
°c
°c
°c
°c
°c
°c
FEB
D>15C
Temperature
June Soil Temperature
July Soil Temperature
August Soil Temperature
September Soil Temperature
October Soil Temperature
November Soil Temperature
December Soil Temperature
Mean Annual Soil Temperature
Mean Summer Soil Temperature (June, July, Aug.)
Average Seasonal Degree Days >5°C
Average Seasonal Degree Days >15°C
Average Number of Days Soil Temperature >5°C
Average Number of Days Soil Temperature >15°C
SLCLIMCLSr
Soil
SLCLIMCLS2*
Soil
JUN
JUL
AUG
SEP
OCT
NOV
DEC
MATEMP
MSTEMP
DD>5C
DD>15C
D>5C
Soil
Climate Class 1
Climate Class 2
The Soil Climate Class is from Clayton et al. (1977). If SLCLIMCLS2 is not
is between two classes expressed in SLCLIMCLSl and SLCLIMCLS2.
*
Class Definition
0.0
no
class defined
1.0
Arctic
2.0
Subarctic
3.0
Cold to moderately cold Cryoboreal
Moderately cold Cryoboreal
Cool to moderately cool Boreal
Cool Boreal
Moderately cool Boreal
Mild to moderately warm Mesic
Mild Mesic
Moderately warm Mesic
Thermic
Hyperthermic
3.1
4.0
4.1
4.2
5.0
5.1
5.2
6.0
7.0
days
days
15
0.0,
then the
soil
temperature
Wheat
2.11
This
file
WHTSTRESS.DAT
Data
contains output from a modified version of the Versatile Soil Moisture Budget.
References:
One
Stress
De Jong and Bootsma
record per year per
NAME
ARANO
ITEM
PROV
ROTATE
AWHC
ARA
(1988);
Bootsma and De Jong
(1988);
De Jong
et al. (1991).
per rotation.
REPORTING UNITS
DESCRIPTION
ARA Number
Province
Indication of Rotation System
- continuous, stubble or fallow
Available Water Holding Capacity
One of 100, 150, 200 or 250
- See definitions in FORARID.DAT.
mm
-
YEAR
Year
LDSPRFROST
Last Date of 0°C Spring Frost
LDSPRFROST-2
Last Date of -2°C Spring Frost
FDFALFROSTO
FDFALFROST-2
SEED
First
Date of 0°C
day
Julian day
Julian day
Julian day
Julian
Fall Frost
Date of -2°C Fall Frost
Seeding Date for Wheat
- observed data on "date when seeding
general" (Statistics Canada)
First
is
#
#
#
#
Julian
day #
Julian
day #
HEADING
Calculated Heading Date for Wheat
- calculated with the biometeorological time
scale of Robertson (1968)
HARVWHT
Calculated Harvest Date for
Wheat
Julian
day #
HARVBAR
Robertson (1968)
Calculated Harvest Date for barley
Julian
day #
-
-
WilUams
(1974).
TTLH20SEED
H20SEED1ZN
Total Available Water at Seeding
TTLH20HEAD
TTLH20HARV
Water at Heading
Total Available Water at Harvest
Change in Soil Water Content Between Previous Year's
Harvest Date and Current Year's Seeding Date
(approx. 9 months)
Change in Soil Water Content Between Current Year's
Seeding and Harvest Dates
Accumulated Precipitation at Harvest + 7 days
Accumulated Precipitation at Harvest + 14 days
Accumulated Precipitation at Harvest + 21 days
Present Crop (W=wheat, F=fallow)
H20DIFHTOS
H20DIFSTOH
PRECIPH7
PRECIPH14
PRECIPH21
PRESCROP
Total Available Water at Seeding in 1st zone
- (Available water-holding capacity of the
1st zone is 5% of the AWHC.)
Total Available
16
mm
mm
mm
mm
mm
mm
mm
mm
mm
N.B. The following data pertain to the time period from the previous
year's harvest to the current year's seeding date.
ACCPRECIP
ACCPRESNOW
POTEVAP
ACTEVAP
RUNOFFRS
ACTDRAIN
ACCSRUN
ACCSINFIL
ACCSBLOWN
Accumulated
Accumulated
Accumulated
Accumulated
Accumulated
Accumulated
Accumulated
Accumulated
Accumulated
Precipitation (rain +
Precipitation
snow)
(snow only)
Potential Evapotranspiration
Actual Evapotranspiration
Runoff (rain + snow)
Drainage
Snow Runoff
Snow Infiltration
Amount of Snow Blown Away
mm
mm
mm
mm
mm
mm
mm
mm
mm
N.B. The following data pertain to the time period from the current
year's seeding date to the current year's harvest date.
ACCPRECIPR
ACCPOTEVAP
ACCACTEVAP
ACCRUNOFFR
ACCDRAINR
ACCSTRESS
ACCSTRESSJSD
PRECIPFAL
PERPREFAL
WTHRnLE
N.B.
Accumulated
Accumulated
Accumulated
Accumulated
Accumulated
Accumulated
Accumulated
Precipitation (rain only)
Potential Evapotranspiration
Actual Evapotranspiration
Runoff
Drainage
Stress (1
-
ACTEVAP /POTEVAP)
Stress Jointing to Soft
Dough
During Previous Fallow Year
Percent of Precipitation Retained During Fallow Period
Name of Weather File (AGMET) For Internal Use Only
Precipitation
PRECIPFAL and PERPREFAL
mm
mm
mm
mm
mm
variables contain
17
no data
for fallow rotation.
mm
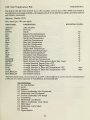
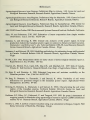
References
Agroecological Resource Area /Regions, Preliminary Map for Alberta. 1992. Centre for Land and
Biological Resources Research, Research Branch, Agriculture Canada, Ottawa.
Agroecological Resource Area/Regions, Preliminary Map for Manitoba. 1992. Centre for
and Biological Resources Research, Research Branch, Agriculture Canada, Ottawa.
Land
Agroecological Resource Area /Regions, Preliminary Map for Saskatchewan. 1992. Centre for
Land and Biological Resources Research, Research Branch, Agriculture Canada, Ottawa.
ARC/INFO Users Guides. ESRI Environmental Systems Research Institute. Redlands, California.
Baier,
W. and Robertson, G.W.
observations. Can.
J.
1965. Estimation of latent evaporation
Soil Sci.
from simple weather
45:276-284.
Bootsma, A. and De Jong, R. 1988. Climate risk analyses of the prairie region. In Crop
production risks in the Canadian prairie region in relation to climate and land resources.
Ehomanski, J. and Kirkwood, V. eds. Technical Bulletin 1988-5E, Land Resource Research
Centre, Research Branch, Agriculture Canada, Ottawa. 58 pp.
Bootsma, A. and Boisvert, J.B. 1991. Modelling methodology for estimating forage yield potential
in Canada. Technical Bulletin 1990-50. Research Branch, Agriculture Canada, Ottawa.
33 pp.
Brooks, C.E.P. 1943. Interpolation tables for daily values of meteorological elements. Quart.
Royal Meteorol. Soc. 69 (300). 160-162.
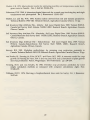
Clayton,
J.S.,
Volume
Ehrlich, W.A.,
n.
Cann, D.B., Day, J.H., and Marshall, LB. 1977. Soils of Canada,
Research Branch, Can. Dept. of Agriculture, Ottawa. 239 pp.
Soil Inventory.
De
Jong, R.
De
Jong, R., Bootsma, A., Dumanski,
and Bootsma, A. 1988. Estimated long-term
Canadian prairies. Can. J. Soil Sci. 68:307-321.
deficiencies for
Management. 20
De
J.
soil
moisture variability on the
and Samuel, K. 1991a. Variability of soil water
perennial forages in the Canadian prairie region. Agricultural Water
(1991).
J.
87-100.
Jong, R., Bootsma, A., Dumanski,
and Samuel, K. 1991b. Characterizing the
soil water
regime of the Canadian prairies. Technical Bulletin 1991-130, Centre for Land and
Biological Resources Research, Research Branch, Agriculture Canada, Ottawa.
J.
Huffman, E.C, Hiley, J.C, Kirkwood, V. and Toogood, K.E. 1992. (In press.) Assessment of
cropping systems in Manitoba using agroecological resource regions. CLBRR contribution
number 92-19. Research Branch, Agriculture Canada, Ottawa. 53 pp.
A method of land evaluation using crop simulation techniques. Unpubl.
University of Manitoba, Winnipeg. 314 pp.
Onofrei, C. 1986.
thesis.
19
PhD
Ouellet, C.E. 1973. Macrcx:limatic
model
grass cover in Canada. Can.
for estimating
monthly
temperatures under short-
soil
Soil Sci. 53:263-274.
J.
Robertson, G.W. 1968. A biometeorological time scale for a cereal crop involving day and night
temperatures and photoperiod. Int. J. Biometeorol. 12:191-223.
Shields, J.A.
and
W.K.
Sly,
1984. Aridity indices derived from soil
and
climatic parameters.
Technical Bulletin 1984-14E. Research Branch, Agriculture Canada, Ottawa. 18 pp.
Map
Soil Inventory
Canada
Soil
Layer Digital Data. 1989. Version 89.09.01.
Alberta. NSDB, LRRC, Research Branch, Agriculture Canada,
Atti-ibute File
Survey
Staff,
-
Alberta:
Soil
Ottawa, Canada.
Map
Manitoba: Soil Layer Digital Data. 1989. Version 89.09.01.
Canada-Manitoba Soil Survey Staff. NSDB, LRRC, Research Branch, Agriculture Canada,
Ottawa, Canada.
Soil Inventory
Map
Atti-ibute File
-
Saskatchewan:
89.04.14. Canada-Saskatchewan Soil Survey
Agriculture Canada, Ottawa, Canada.
Soil Inventory
Stewart, R.B.
1981.
Attribute File
-
Modeling methodology
for
Soil
Staff.
Layer Digital Data. 1989. Version
NSDB, LRRC, Research Branch,
assessing crop production potentials in
Canada. Technical Bulletin 1983-12E. Research Branch, Agriculture Canada, Ottawa. 29 pp.
H., Penning de Vries, W.W.T., and Drees, M.E. 1982. A summary model for crop
growth. In Penning de Vries, F.W.T. and van Laar, H.H. (eds.). Simulation of plant growth
and crop production. Pudoc, Wageningen. The Netherlands, pp. 234-249.
van Keulen,
and van Keulen, H. 1986. Potential crop production prediction by some
simple calculation methods as compared with computer simulations. Agric. Syst.
Versteeg, N.M.
19:249-272.
Williams, G.D.V. 1974. Deriving a biophotothermal time scale for barley.
18:57-69.
20
Int.
J.
Biometeor.
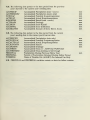
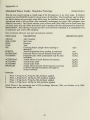
Appendix
A
Simulated Wheat Yields: Manitoba Prototype
PIXPROTO.DAT
This file was created during an initial stage of the development of the ARA maps. It contains
output from the PIXMOD model for the province of Manitoba. The boundaries used to define
the ARAs during this prototype stage differ from the finalized version (the boundaries in the
agricultural areas of the province were essentially unchanged, but more ARA polygons were
added in the north). The climate stations, years of data used (1964-1983), and in some cases, the
soil series used, may also differ from those used to produce the files documented in section 2.7,
SIMYLDWHT. Nevertheless, because this file was extensively validated, it is considered to be
an important part of the ARA database.
One
record per
ITEM
ARA
NAME
per year per
soil
code per scenario.
REPORTING UNITS
DESCRIPTION
ARANO
ARA Number
SOIL_CODE
Soil
SCEN
YEAR
Scenario
Year
GSL
Growing Season Length (from seeding
Code
days
to
maturity)
mm
PPTNTTL
Toted Precipitation (from seeding to maturity)
POTPRODAG
POTGRNBU
Potential
Potential
radiation)
bu/ha
ACTPRODAG
ACTGRNKG
ACTGRNBU
Actual Above Ground Biomass Production
Actual Grain Yield
Actual Grain Yield
Actual Above Ground Net Production Lost
to Severe Climatic Conditions (drought or
excess moisture)
kg /ha
kg /ha
bu/ha
kg /ha
PRODLOSS
Above Ground Biomass Production
Grain Yield (constrained only by solar
Oue
kg /ha
Scenarios
1
2
3
4
Fmax
Fmax
Fmax
Fmax
=
=
=
=
where Fmax
20 kg/ha/h, 75 kg /ha NO3 fertilizer applied
20 kg/ha/h, 150 kg /ha NO3 fertilizer applied
30 kg/ha/h, 75 kg /ha NO3 fertilizer applied
30 kg/ha/h, 150 kg /ha NO3 fertilizer applied
is
the
maximum
rate of
CO2 exchange
Versteeg and van Keulen, 1986).
21
(Stewart, 1981;
van Keulen
et al, 1982;