1
MANUAL Page 46
Membrane-2000 Response-2000 Triax-2000 Shell-2000
SECTION IV: Analysis and Interpretation
4-1 General Information
All programs in this manual operate in a similar way. The results of the analysis
are dynamically updated on the screen as the user changes the load level. Using this
method of fast information presentation, it becomes possible to quickly see what is
predicted to be happening to the concrete and find errors. It has been found that this not
only increases confidence in the results, but also adds to the users understanding of the
behaviour of reinforced concrete. The presentation of the results also challenges the user
to explain any strange or unexpected result. This too enhances the users understanding of
reinforced concrete. This contrasts with some computer programs for structural analysis
that attempt to remove the engineer from the process resulting in less understanding from
the use of the program rather than more.
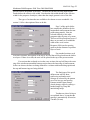
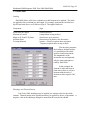
Membrane-2000 and Triax-2000 perform their analysis immediately and let the
user observe the results. Response-2000 and Shell-2000, due to longer execution times,
update the screen as new results are obtained and let the user watch the results as they
arrive. The different screens of data presentation are available from the “view” menu in
the programs or, more conveniently, through the toolbar.
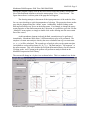
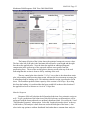
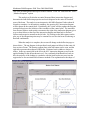
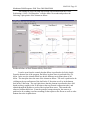
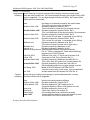
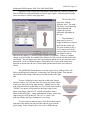
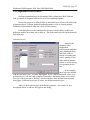
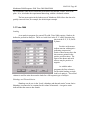
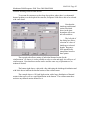
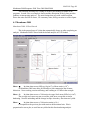
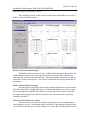
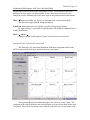
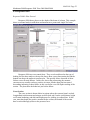
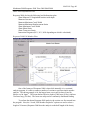
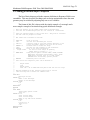
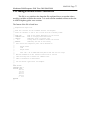
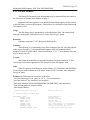
The default data presentation mode in the programs is a screen with 9 graphs on
it. This manual will concentrate on that "9-plot” view. The program also has a mode to
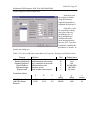
allow the same plots to be shown individually. For Triax-2000 and Membrane-2000, the
plots in the 9-plot mode are generally full load-deformation plots. For Response-2000
and Shell-2000, the plots represent one load stage showing the value of the variable over
the depth of the element. An additional page is available that provide load-deformation
plots for the latter programs.
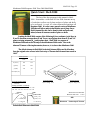
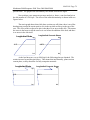
Moment-Y - Curvature
1500.0
900.0
285
Load Factor
1200.0
Y
X
600.0
SE7
fc'= 41.8 MPa
fy (x-steel) = 492 MPa
fy (y-steel) = 479 MPa
X: 2 layers of 20M @ 72 mm
Y: 2 layers of 10M @ 72 mm
300.0
0.0
0.0
2.0
4.0
Curvature-Y (rad/km)
6.0
8.0
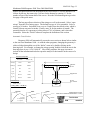
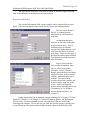
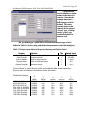
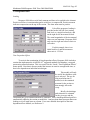
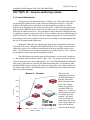
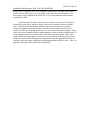
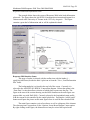
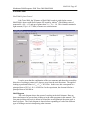
The large loaddeformation plots have
an additional feature in
that they allow other
plots to be pasted onto
them. The example
shown was generated
with Shell-2000 in a
minute or so. It shows a
shell element subjected
to in-plane shear and
moment. The initial
cracks are flexural in
nature and as the cracks
reach a larger depth, the
slope of the momentcurvature plots changes