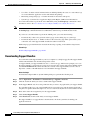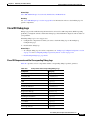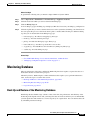
1
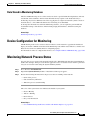
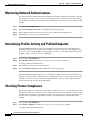
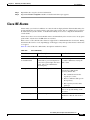
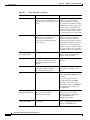
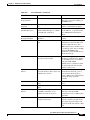
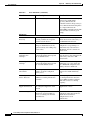
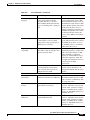
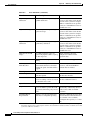
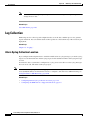
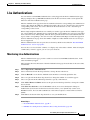
CH A P T E R
26
Monitoring and Troubleshooting
The Operations tab on the Cisco Identity Services Engine (ISE) home page, also known as the dashboard,
provides integrated monitoring, reporting, alerting, and troubleshooting, all from one centralized
location.
This chapter describes monitoring and troubleshooting functions and tasks and contains the following
sections:
Note
•
Monitoring and Troubleshooting Service in Cisco ISE, page 26-1
•
Device Configuration for Monitoring, page 26-3
•
Cisco ISE Alarms, page 26-5
•
Troubleshooting Network Access Issues, page 26-17
•
Obtaining Additional Troubleshooting Information, page 26-25
•
Monitoring Database, page 26-29
For a list of inherent known issues and workarounds associated with monitoring and troubleshooting,
refer to the Release Notes for the Cisco Identity Services Engine, Release 1.2.
Monitoring and Troubleshooting Service in Cisco ISE
The Monitoring and troubleshooting service is a comprehensive identity solution for all Cisco ISE
run-time services and uses the following components:
•
Monitoring—Provides a real-time presentation of meaningful data representing the state of access
activities on a network. This insight allows you to easily interpret and affect operational conditions.
•
Troubleshooting—Provides contextual guidance for resolving access issues on networks. You can
then address user concerns and provide a resolution in a timely manner.
•
Reporting—Provides a catalog of standard reports that you can use to analyze trends and monitor
system performance and network activities. You can customize reports in various ways and save t
for future use.
Cisco Identity Services Engine User Guide, Release 1.2
OL-26134-01
26-1
Chapter 26
Monitoring and Troubleshooting
Monitoring and Troubleshooting Service in Cisco ISE
Cisco ISE Dashboard
The Cisco ISE dashboard, or home page, is the landing page that appears after you log in to the Cisco
ISE administration console. The dashboard is a centralized management console consisting of metric
meters along the top of the window, with dashlets below.
Dashboard’s real-time data provides an at-a-glance status of the devices and users that are accessing your
network as well as the system health overview.
Note
You must have Adobe Flash Player installed on the Administration node to be able to view the dashlets
and metric meters on the dashboard.
The dashboard shows the activity on the Network Privilege Framework (NPF), and provides detailed
information on the various components.
The NPF is composed of the three tiers outlined in Table 26-1.
Table 26-1
NPF Tiers
Tier
Specifications
1
Access control based on identity using 802.1x, MAC authentication bypass (MAB), the
Cisco ISE Profiler service
2
Access control based on identity using 802.1x, MAB, Profiler, guest provisioning of the
Network Admission Control (NAC) manager, central web authentication
3
Access control based on identity and posture using 802.1x, MAB, Profiler, guest
provisioning of the NAC manager, central web authentication
NPF authentication and authorization generates a flow of events. The events from the different sources
are then collected by Cisco ISE monitoring and troubleshooting tools and summarized. You can view the
authentication and authorization results on the dashboard or choose to run any number of reports. For
more information, see Chapter 27, “Reporting.”
The NPF authentication and authorization event flow uses the following process:
1.
NAD performs an authorization or flex authorization.
2.
An unknown agentless identity is profiled with web authorization.
3.
RADIUS server authenticates and authorizes the identity.
4.
Authorization is provisioned for the identity at the port.
5.
Unauthorized endpoint traffic is dropped.
User Roles and Permissions for Monitoring and Troubleshooting Capabilities
Monitoring and troubleshooting capabilities are associated with default user roles. The tasks you are
allowed to perform are directly related to your assigned user role. For more information on the user roles
and their assigned permissions, see Cisco ISE Admin Groups, Access Levels, Permissions, and
Restrictions.
Cisco Identity Services Engine User Guide, Release 1.2
26-2
OL-26134-01
Chapter 26
Monitoring and Troubleshooting
Device Configuration for Monitoring
Data Stored in Monitoring Database
The Cisco ISE monitoring service collects and stores data in a specialized monitoring database. The rate
and amount of data utilized to monitor network functions may require a node dedicated solely to
monitoring. If your Cisco ISE network collects logging data at a high rate from Policy Service nodes or
network devices, a Cisco ISE node dedicated to monitoring is recommended.
To manage the information stored in the Monitoring database, you are required to perform full and
incremental backups of the database. This includes purging unwanted data, and then restoring the
database.
Related Topic
Monitoring Database, page 26-29
Device Configuration for Monitoring
The Monitoring node receives and uses data from devices on the network to populate the dashboard
display. To enable communication between the Monitoring node and the network devices, switches and
Network Access Devices (NADs) must be configured properly.
For information on how to configure these devices, see Configure NADs for ISE Monitoring, page G-40
Monitoring Network Process Status
You can view process status for the network from the Cisco ISE dashboard using the System Summary
dashlet. For example, when processes like the application server or database fail, an alarm is generated
and you can view the results using the System Summary dashlet.
Step 1
Go to the Cisco ISE Dashboard.
Step 2
Expand the System Summary dashlet. A detailed real-time report appears.
Step 3
Review the following information for the processes that are running on the network:
•
Name of the process
•
CPU and memory utilization
•
Time since process started running
The color of the system status icon indicates the health of your system:
•
Green = Healthy
•
Yellow = Warning
•
Red = Critical
•
Gray = No information
Related Topics
•
Cisco ISE Monitoring Dashlets Not Visible with Internet Explorer 8, page G-15
Cisco Identity Services Engine User Guide, Release 1.2
OL-26134-01
26-3
Chapter 26
Monitoring and Troubleshooting
Monitoring Network Authentications
Monitoring Network Authentications
You can view the passed and failed network authentications from the Authentications dashlet. It provides
data on the user or type of device, location, and the identity group to which the user or device belongs.
The sparklines along the top of the dashlet represent distribution over the last 24 hours and the last 60
minutes.
Step 1
Go to the Cisco ISE Dashboard.
Step 2
Expand the Authentications dashlet. A detailed real-time report appears.
Step 3
Review the information for the users or devices that are authenticated on the network:
Step 4
Expand the data categories for more information.
Determining Profiler Activity and Profiled Endpoints
The Profiled Endpoint dashlet focuses on the endpoints on the network that have matched profiles,
providing profile data for each endpoint. For example, the statistics allow you to determine the type of
device, its location, and its IP address. The sparklines along the top of the dashlet represent the peak
endpoint activity over the last 24 hours or 60 minutes.
Step 1
Go to the Cisco ISE Dashboard.
Step 2
In the Profiler Activity dashlet, hover your cursor over a stack bar or sparkline.
A tooltip provides detailed information.
Step 3
Expand the data categories for more information.
Step 4
Expand the Profiler Activity dashlet. A detailed real-time report appears.
The Profiled Endpoint dashlet represents the total number of endpoints that have been profiled on the
network for the last 24 hours, including those that are unknown. It is not a representation of how many
endpoints are currently active on the network. Sparkline metrics at the top of the dashlet show time
specific values for the last 24 hours and 60 minutes.
Checking Posture Compliance
The Posture Compliance dashlet provides information on the users who are accessing the network and
whether they meet posture compliance. Data is shown on the devices that are currently connected to the
network. The stack bars show noncompliance statistics that are arranged according to operating system
and other criteria. Sparklines represent the percentage of compliant versus noncompliant posture
attempts.
Step 1
Go to the Cisco ISE Dashboard.
Step 2
In the Posture Compliance dashlet, hover your cursor over a stack bar or sparkline.
A tooltip provides detailed information.
Cisco Identity Services Engine User Guide, Release 1.2
26-4
OL-26134-01
Chapter 26
Monitoring and Troubleshooting
Cisco ISE Alarms
Step 3
Expand the data categories for more information.
Step 4
Expand the Posture Compliance dashlet. A detailed real-time report appears.
Cisco ISE Alarms
Alarms notify you of critical conditions on a network and are displayed in the Alarms dashlet. They also
provide information on system activities, such as data purge events. You can configure how you want to
be notified about system activities, or disable them entirely. You can also configure the threshold for
certain alarms.
Alarms do not have an associated schedule and are sent immediately after an event occurs. At any given
point in time, only the latest 15,000 alarms are retained.
If the event re-occurs, then the same alarms are suppressed for a minimum duration of two hours. During
the time that the event re-occurs, depending up on the trigger, it may take up to three hours for the alarms
to re-appear.
Table 26-2 lists all the Cisco ISE alarms, descriptions and their resolution.
Table 26-2
Cisco ISE Alarms
Alarm Name
Alarm Description
Administrative and Operational Audit Management
Alarm Resolution
Administrator account
Locked/Disabled
Administrator account is locked or
disabled due to password expiration
or incorrect login attempts. For more
details, refer to the administrator
password policy.
Administrator password can be reset
by another administrator using the
GUI or CLI.
Backup Failed
The ISE backup operation failed.
Check the network connectivity
between Cisco ISE and the
repository. Ensure that:
•
The credentials used for the
repository is correct.
•
There is sufficient disk space in
the repository.
•
The repository user has write
privileges.
CA Server is down
CA server is down.
Check to make sure that the CA
services are up and running on the
CA server.
CA Server is Up
CA server is up.
A notification to inform the
administrator that the CA server is
up.
Cisco Identity Services Engine User Guide, Release 1.2
OL-26134-01
26-5
Chapter 26
Monitoring and Troubleshooting
Cisco ISE Alarms
Table 26-2
Cisco ISE Alarms (continued)
Alarm Name
Alarm Description
Alarm Resolution
Certificate Expiration
This certificate will expire soon.
When it expires, Cisco ISE may fail to
establish secure communication with
clients.
Replace the certificate. For a trust
certificate, contact the issuing
Certificate Authority (CA). For a
CA-signed local certificate, generate
a CSR and have the CA create a new
certificate. For a self-signed local
certificate, use Cisco ISE to extend
the expiration date. You can delete
the certificate if it is no longer used.
Certificate Expired
This certificate has expired. Cisco
ISE may fail to establish secure
communication with clients.
Node-to-node communication may
also be affected.
Replace the certificate. For a trust
certificate, contact the issuing
Certificate Authority (CA). For a
CA-signed local certificate, generate
a CSR and have the CA create a new
certificate. For a self-signed local
certificate, use Cisco ISE to extend
the expiration date. You can delete
the certificate if it is no longer used.
Certificate Request
Forwarding Failed
Certificate request forwarding failed. Make sure that the certification
request coming in matches with
attributes from the sender.
Configuration Changed Cisco ISE configuration is updated.
This alarm is not triggered for any
configuration change in users and
endpoints.
Check if the configuration change is
expected.
CRL Retrieval Failed
Ensure that the download URL is
correct and is available for the
service.
Unable to retrieve CRL from the
server. This could occur if the
specified CRL is unavailable.
DNS Resolution Failure DNS resolution failed on the node.
Check if the DNS server configured
by the command ip name-server is
reachable.
If you get the alarm as 'DNS
Resolution failed for CNAME
<hostname of the node>', then
ensure that you create CNAME RR
along with the A record for each
Cisco ISE node.
External MDM Server
API Version Mismatch
External MDM server API version
does not match with what is
configured in Cisco ISE.
Ensure that the MDM server API
version is the same as what is
configured in Cisco ISE. Update
Cisco ISE MDM server
configuration if needed.
External MDM Server
Connection Failure
Connection to the external MDM
server failed.
Ensure that the MDM server is up
and Cisco ISE-MDM API service is
running on the MDM server.
Cisco Identity Services Engine User Guide, Release 1.2
26-6
OL-26134-01
Chapter 26
Monitoring and Troubleshooting
Cisco ISE Alarms
Table 26-2
Cisco ISE Alarms (continued)
Alarm Name
Alarm Description
Alarm Resolution
External MDM Server
Response Error
External MDM Server response error. Ensure that the Cisco ISE-MDM
API service is properly running on
the MDM server.
Firmware Update
Required
A firmware update is required on this Contact Cisco Technical Assistance
host.
Center to obtain firmware update
Insufficient Virtual
Machine Resources
Virtual Machine (VM) resources such Ensure that a minimum requirements
as CPU, RAM, Disk Space, or IOPS for the VM host, as specified in the
are insufficient on this host.
Cisco ISE Hardware Installation
Guide.
No Configuration
Backup Scheduled
No Cisco ISE configuration backup is Create a schedule for configuration
scheduled.
backup.
NTP Service Failure
The NTP service is down on this
node.
This could be because there is a large
time difference between NTP server
and Cisco ISE node( more than
1000s). Ensure that your NTP server
is working properly and use the ntp
server <servername> CLI
command to restart the NTP service
and fix the time gap.
NTP Sync Failure
All the NTP servers configured on
this node are unreachable.
Execute show ntp command from
the CLI for troubleshooting. Ensure
that the NTP servers are reachable
from Cisco ISE. If NTP
authentication is configured, ensure
that the key ID and value matches
with that of the server.
Operations DB Purge
Failed
Unable to purge older data from the
Check the Data Purging Audit report
operations database. This could occur and ensure that the used_space is
if M&T nodes are busy.
lesser than the threshold_space.
Login to M&T nodes using CLI and
perform the purge operation
manually.
Patch Failure
A patch process has failed on the
server.
Patch Success
A patch process has succeeded on the —
server,
Re-install the patch process on the
server.
Profiler SNMP Request Either the SNMP request timed out or Ensure that SNMP is running on the
Failure
the SNMP community or user
NAD and verify that SNMP
authentication data is incorrect.
configuration on Cisco ISE matches
with NAD.
Replication Failed
The secondary node failed to consume Login to the Cisco ISE GUI and
the replicated message.
perform a manual syncup from the
deployment page. De-register and
register back the affected Cisco ISE
node.
Cisco Identity Services Engine User Guide, Release 1.2
OL-26134-01
26-7
Chapter 26
Monitoring and Troubleshooting
Cisco ISE Alarms
Table 26-2
Cisco ISE Alarms (continued)
Alarm Name
Alarm Description
Alarm Resolution
Restore Failed
Cisco ISE restore operation failed.
Ensure the network connectivity
between Cisco ISE and the
repository. Ensure that the
credentials used for the repository is
correct. Ensure that the backup file is
not corrupted. Execute the
reset-config command from the CLI
and restore the last known good
backup.
ISE Services
Authentication
Inactivity
Cisco ISE policy service nodes are not Check the ISE/NAD configuration.
receiving authentication requests
Check the network connectivity of
from the network devices.
the ISE/NAD infrastructure.
COA Failed
Network device has denied the
Change of Authorization (CoA)
request issued by Cisco ISE policy
service nodes.
Ensure that the network device is
configured to accept Change of
Authorization (CoA) from Cisco
ISE. Ensure if CoA is issued on a
valid session.
Excessive
Authentication
Attempts 1
Cisco ISE policy service nodes are
experiencing higher than expected
rate of authentications.
Check the re-auth timer in the
network devices. Check the network
connectivity of the Cisco ISE
infrastructure.
Excessive Failed
Attempts 1
Cisco ISE policy service nodes are
experiencing higher than expected
rate of failed authentications.
Check the authentication steps to
identify the root cause. Check the
Cisco ISE/NAD configuration for
identity and secret mismatch.
Identity Store
Unavailable
Cisco ISE policy service nodes are
unable to reach the configured
identity stores.
Check the network connectivity
between Cisco ISE and identity
store.
Misconfigured Network Cisco ISE has detected too many
Device Detected
RADIUS accounting information
from NAS
Too many duplicate RADIUS
accounting information has been
sent to ISE from NAS. Configure
NAS with accurate accounting
frequency.
Misconfigured
Supplicant Detected
Cisco ISE has detected
mis-configured supplicant on the
network
Ensure that the configuration on
Supplicant is correct.
No Accounting Start
Cisco ISE policy service nodes have
authorized a session but did not
receive accounting start from the
network device.
Ensure that RADIUS accounting is
configured on the network device.
Check the network device
configuration for local
authorization.
Cisco Identity Services Engine User Guide, Release 1.2
26-8
OL-26134-01
Chapter 26
Monitoring and Troubleshooting
Cisco ISE Alarms
Table 26-2
Cisco ISE Alarms (continued)
Alarm Name
Alarm Description
Alarm Resolution
RADIUS Request
Dropped
The authentication/accounting
request from a NAD is silently
discarded. This may occur due to
unknown NAD, mismatched shared
secrets, or invalid packet content per
RFC.
Check that the NAD/AAA client has
a valid configuration in Cisco ISE.
Check whether the shared secrets on
the NAD/AAA client and Cisco ISE
matches. Ensure that the AAA client
and the network device, have no
hardware problems or problems with
RADIUS compatibility. Also ensure
that the network that connects the
device to Cisco ISE has no hardware
problems.
SGACL Drops
Secure Group Access (SGACL) drops
occurred. This occurs if an SGA
capable device drops packets due to
SGACL policy violations.
Run the RBACL drop summary
report and review the source causing
the SGACL drops. Issue a CoA to
the offending source to reauthorize
or disconnect the session.
Supplicant stopped
responding
Verify that the supplicant is
Cisco ISE sent last message to the
client 120 seconds ago but there is no configured properly to conduct a full
EAP conversation with Cisco ISE.
response from the client.
Verify that NAS is configured
properly to transfer EAP messages
to/from the supplicant. Verify that
the supplicant or NAS does not have
a short timeout for EAP
conversation.
Unknown NAD
Cisco ISE policy service nodes are
receiving authentication requests
from a network device that is not
configured in Cisco ISE.
Check if the network device is a
genuine request and add it to the
configuration. Ensure that the secret
matches.
System Health
Health Status
Unavailable
The monitoring node has not received Ensure that Cisco ISE nodes are up
health status from the Cisco ISE node. and running. Ensure that Cisco ISE
nodes are able to communicate with
the monitoring nodes.
High Authentication
Latency
Cisco ISE system is experiencing
high authentication latency.
Check if the system has sufficient
resources. Check the actual amount
of work on the system for example,
number of authentications, profiler
activity etc. Add additional server to
distribute the load.
High Disk I/O
Utilization
Cisco ISE system is experiencing
high disk I/O utilization.
Check if the system has sufficient
resources. Check the actual amount
of work on the system for example,
number of authentications, profiler
activity etc. Add additional server to
distribute the load.
Cisco Identity Services Engine User Guide, Release 1.2
OL-26134-01
26-9
Chapter 26
Monitoring and Troubleshooting
Cisco ISE Alarms
Table 26-2
Cisco ISE Alarms (continued)
Alarm Name
Alarm Description
Alarm Resolution
High Disk Space
Utilization
Cisco ISE system is experiencing
high disk utilization.
Check if the system has sufficient
resources. Check the actual amount
of work on the system for example,
number of authentications, profiler
activity etc. Add additional server to
distribute the load.
High Load Average
Cisco ISE system is experiencing
high load average.
Check if the system has sufficient
resources. Check the actual amount
of work on the system for example,
number of authentications, profiler
activity etc. Add additional server to
distribute the load.
High Memory
Utilization
Cisco ISE system is experiencing
high memory utilization.
Check if the system has sufficient
resources. Check the actual amount
of work on the system for example,
number of authentications, profiler
activity etc. Add additional server to
distribute the load.
High Operations DB
Usage
Cisco ISE monitoring nodes are
Check and reduce the purge
experiencing higher volume of syslog configuration window for the
operations data.
data than expected.
Process Down
One of the Cisco ISE processes is not Restart the Cisco ISE application.
running.
Profiler Queue Size
Limit Reached
The ISE Profiler queue size limit has
been reached. Events received after
reaching the queue size limit will be
dropped.
Check if the system has sufficient
resources, and ensure EndPoint
attribute filter is enabled.
License Expiration
License installed on the Cisco ISE
nodes has expired.
Contact Cisco Accounts team to
purchase new licenses.
License Violation
Cisco ISE nodes have detected that
Contact Cisco Accounts team to
you are exceeding or about to exceed purchase additional licenses.
the allowed license count.
Licensing
System Error
Log Collection Error
Cisco ISE monitoring collector
process is unable to persist the audit
logs generated from the policy service
nodes.
This will not impact the actual
functionality of the Policy Service
nodes. Contact TAC for further
resolution.
Scheduled Report
Export Failure
Unable to copy the exported report
(CSV file) to configured repository.
Verify the configured repository. If it
has been deleted, add it back. If it is
not available or not reachable,
reconfigure the repository to a valid
one.
1. Once the threshold is met, the Excessive Authentication Attempts and Excessive Failed Attempts alarms are triggered.
The numbers displayed next to the Description column are the total number of authentications that are authenticated or failed
against Cisco ISE in last 15 minutes.
Cisco Identity Services Engine User Guide, Release 1.2
26-10
OL-26134-01
Chapter 26
Monitoring and Troubleshooting
Cisco ISE Alarms
Alarms are not triggered when you add users or endpoints to Cisco ISE.
After you upgrade from a previous Cisco ISE release to Cisco ISE, release 1.2, rules that you created in
the previous release and alarms in alarms inbox will be deleted.
Related Topics
•
Enabling and Configuring Alarms, page 26-11
•
Configuring Remote Syslog Collection Locations, page 12-4
•
Configuring the SMTP Server to Support Notifications, page 6-5
Enabling and Configuring Alarms
You can enable or disable Cisco ISE alarms and configure alarm notification behavior to notify you of
critical conditions. For certain alarms you can configure thresholds like maximum failed attempts for
Excessive Failed Attempts alarm or maximum disk utilization for High Disk Utilization alarm.
Step 1
Choose Administration > System > Settings > Alarm Settings.
Step 2
Select an alarm from the list of default alarms and click Edit.
Step 3
Select Enable or Disable.
Step 4
Configure alarm threshold if applicable.
Step 5
Click Submit.
Related Topics
•
Cisco ISE Alarms, page 26-5
•
Configuring the SMTP Server to Support Notifications, page 6-5
Monitoring Alarms
Cisco ISE provides system alarms which notify you whenever any critical system condition occurs.
Alarms that are generated by Cisco ISE are displayed in the Alarm dashlet. These notifications
automatically appear in the alarm dashlet.
The Alarm dashlet displays a list of recent alarms, which you can select from to view the alarm details.
You can also receive notification of alarms through e-mail and syslog messages.
Step 1
Go to the Cisco ISE Dashboard.
Step 2
Click on an alarm in the Alarms dashlet. A new window opens with the alarm details and a suggested
action.
Step 3
Click Refresh to refresh the alarms.
Step 4
Click Acknowledge to acknowledge selected alarms. You can select the alarms by clicking the check
box available prior to the timestamp. This reduces the alarm counters (number of times an alarm is
raised) when marked as read.
Step 5
Click the Details link corresponding to the alarm that you select. A new window opens with the details
corresponding to the alarm that you select.
Cisco Identity Services Engine User Guide, Release 1.2
OL-26134-01
26-11
Chapter 26
Monitoring and Troubleshooting
Log Collection
The Details link corresponding to the previous alarms that were generated prior to persona
change shows no data.
Note
Related Topics
Cisco ISE Alarms, page 26-5
Log Collection
Monitoring services collect log and configuration data, store the data, and then process it to generate
reports and alarms. You can view the details of the logs that are collected from any of the servers in your
deployment.
Related Topic
Chapter 12, “Logging.”
Alarm Syslog Collection Location
If you configure monitoring functions to send alarm notifications as syslog messages, you need a syslog
target to receive the notification. Alarm syslog targets are the destinations where alarm syslog messages
are sent.
You must also have a system that is configured as a syslog server to be able to receive syslog messages.
You can create, edit, and delete alarm syslog targets.
Note
Cisco ISE monitoring requires that the logging-source interface configuration use the network access
server (NAS) IP address. For information on how to configure a switch for Cisco ISE monitoring, see
Configure NADs for ISE Monitoring, page G-40.
Related Topics
•
Configuring Remote Syslog Collection Locations, page 12-4
•
Configuring the SMTP Server to Support Notifications, page 6-5
Cisco Identity Services Engine User Guide, Release 1.2
26-12
OL-26134-01
Chapter 26
Monitoring and Troubleshooting
Live Authentications
Live Authentications
You can monitor recent RADIUS authentications as they happen from the Live Authentications page.
The page displays the top 10 RADIUS authentications in the last 24 hours. This section explains the
functions of the Live Authentications page.
The Live Authentications page shows the live authentication entries corresponding to the authentication
events as they happen. In addition to authentication entries, this page also shows the live session entries
corresponding to the events. You can also drill-down the desired session to view a detailed report
corresponding to that session.
When a single endpoint authenticates successfully, two entries appear in the Live Authentications page:
one corresponding to the authentication record and another corresponding to the session record (pulled
from session live view). Subsequently, when the device performs another successful authentication, the
repeat counter corresponding to the session record is incremented. The Repeat Counter that appears in
the Live Authentications page shows the number of duplicate radius authentication success messages
that are suppressed.
The Live Authentication data categories that are shown by default are described in “Recent RADIUS
Authentications” section on page B-1.
You can choose to view all of the columns, or to display only selected data columns. After selecting the
columns that you want to appear, you can save your selections.
Monitoring Live Authentications
The Live Authentications page provides a tabular account of recent RADIUS authentications, in the
order in which they happen.
The last update shown at the bottom of the Live Authentications page shows the date of the server, time,
and timezone.
Step 1
Choose Operations > Authentications.
Step 2
Select a time interval from the drop-down list to change the data refresh rate.
Step 3
Click the Refresh icon on the Live Authentications menu bar to manually update the data.
Step 4
Choose an option from the Show drop-down list to change the number of records that appear.
Step 5
Choose an option from the within drop-down list to specify a time interval,
Step 6
Click Add or Remove Columns and choose the options from the drop-down list to change the columns
that are shown.
Step 7
Click Show Live Sessions to view live RADIUS sessions. You can use the dynamic Change of
Authorization (CoA) feature for the Live Sessions that allows you to dynamically control active
RADIUS sessions. You can send reauthenticate or disconnect requests to a Network Access Device
(NAD).
Step 8
Click Save at the bottom of the drop-down list to save your modifications.
Related Topics
•
Recent RADIUS Authentications, page B-1
•
RADIUS Accounting Packets (Attributes) Not Coming from Switch, page G-6
Cisco Identity Services Engine User Guide, Release 1.2
OL-26134-01
26-13
Chapter 26
Monitoring and Troubleshooting
Global Search for Endpoints
•
RADIUS Server Error Message Entries Appearing in Cisco ISE, page G-19
•
RADIUS Server Connectivity Issues (No Error Message Entries Appearing in Cisco ISE),
page G-20
•
Cisco ISE Active RADIUS Sessions, page 27-4
•
Changing Authorization for RADIUS Sessions, page 27-5
Global Search for Endpoints
You can use the global search box available at the top of the Cisco ISE home page to search for
endpoints. You can use any of the following criteria to search for an endpoint:
•
User name
•
MAC Address
•
IP Address
•
Authorization Profile
•
Endpoint Profile
•
Failure Reason
•
Identity Group
•
Identity Store
•
Network Device name
•
Network Device Type
•
Operating System
•
Posture Status
•
Location
•
Security Group
•
User Type
You should enter at least three characters for any of the search criteria in the Search field to display data.
The search result provides a detailed and at-a-glance information about the current status of the endpoint,
which you can use for troubleshooting. Search results display only the top 25 entries. It is recommended
to use filters to narrow down the results.
Figure 26-1 shows an example of the search result.
Cisco Identity Services Engine User Guide, Release 1.2
26-14
OL-26134-01
Chapter 26
Monitoring and Troubleshooting
Session Trace for an Endpoint
Figure 26-1
Search Result For Endpoints
You can use any of the properties in the left panel to filter the results. You can also click on any endpoint
to see more detailed information about the endpoint, such as:
•
Session trace
•
Authentication details
•
Accounting details
•
Posture details
•
Profiler details
•
Client Provisioning details
•
Guest accounting and activity
Related Topic
Session Trace for an Endpoint, page 26-15
Session Trace for an Endpoint
You can use the global search box available at the top of the Cisco ISE home page to get session
information for a particular endpoint. When you search with a criteria, you get a list of endpoints. Click
on any of these endpoints to see the session trace information for that endpoint. Figure 26-2 shows an
example of the session trace information displayed for an endpoint.
Note
The dataset used for search is based on Endpoint ID as indexes. Therefore, when authentication occurs,
it is mandatory to have Endpoint IDs for the endpoints for those authentications to include them in the
search result set.
Cisco Identity Services Engine User Guide, Release 1.2
OL-26134-01
26-15
Chapter 26
Monitoring and Troubleshooting
Session Trace for an Endpoint
Figure 26-2
Session Trace of an Endpoint
You can use the clickable timeline at the top to see major authorization transitions. You can also export
the results in .csv format by clicking the Export Results button. The report gets downloaded to your
browser.
You can click on the Endpoint Details link to see more authentication, accounting, and profiler
information for a particular endpoint. Figure 26-3 shows an example of endpoint details information
displayed for an endpoint.
Cisco Identity Services Engine User Guide, Release 1.2
26-16
OL-26134-01
Chapter 26
Monitoring and Troubleshooting
Troubleshooting Network Access Issues
Figure 26-3
Endpoint Details
Session Removal from the Directory
Sessions are cleaned from the session directory on the Monitoring and Troubleshooting node as follows:
•
Terminated sessions are cleaned 15 minutes after termination.
•
If there is authentication but no accounting, then such sessions are cleared after one hour.
•
All inactive sessions are cleaned after seven days.
Related Topic
Global Search for Endpoints, page 26-14
Troubleshooting Network Access Issues
You can troubleshoot network access for a specific user, device, or search criteria based on attributes that
are related to the authentication requests. You do this by running an Authentication Summary report.
Step 1
Choose Operations > Reports > Authentication Summary Report.
Step 2
Filter the report for Failure Reasons.
Cisco Identity Services Engine User Guide, Release 1.2
OL-26134-01
26-17
Chapter 26
Monitoring and Troubleshooting
Diagnostic Troubleshooting Tools
Step 3
Review the data in the Authentication by Failure Reasons section of the report to troubleshoot your
network access problem.
Note
As the Authentication Summary report collects and displays the latest data corresponding to
failed or passed authentications, the contents of the report appear after a delay of a few minutes.
Related Topics
•
Troubleshooting Unexpected RADIUS Authentication Results, page 26-18
•
Running and Viewing Reports, page 27-2
Diagnostic Troubleshooting Tools
Diagnostic tools help you diagnose and troubleshoot problems on a Cisco ISE network and provide a
detailed instructions on how to resolve problems. You can use these tools to troubleshoot authentications
and evaluate the configuration of any network device on your network, including Security Group Access
devices.
This section describes diagnostic procedures and contains the following topics:
•
Troubleshooting Unexpected RADIUS Authentication Results, page 26-18
•
Executing IOS Show Commands to Check Configuration, page 26-19
•
Troubleshooting Network Device Configuration Issues, page 26-20
•
Troubleshooting Endpoint Posture Failure, page 26-20
•
Using TCP Dump to Monitor Network Traffic, page 26-21
•
Saving a TCP Dump File, page 26-22
•
Comparing Unexpected SGACL for an Endpoint or User, page 26-22
•
Troubleshooting Connectivity Issues in an SGA-Enabled Network with SXP-IP Mappings,
page 26-23
•
Troubleshooting Connectivity Issues in an SGA-Enabled Network with IP-SGT Mappings,
page 26-24
•
Troubleshooting Connectivity Issues in an SGA-Enabled Network by Comparing Device SGT
Mappings, page 26-24
Troubleshooting Unexpected RADIUS Authentication Results
This tool allows you to search and select a RADIUS authentication for troubleshooting when there is an
unexpected authentication result. You might use this tool if you expected an authentication to pass, but
it failed or if you expected a user to have a certain level of privileges, and the user did not have those
privileges.
•
Searching RADIUS authentications based on Username, Endpoint ID, Network Access Service
(NAS) IP address, and reasons for authentication failure for troubleshooting, Cisco ISE displays
authentications only for the system (current) date.
Cisco Identity Services Engine User Guide, Release 1.2
26-18
OL-26134-01
Chapter 26
Monitoring and Troubleshooting
Diagnostic Troubleshooting Tools
•
Searching RADIUS authentications based on NAS Port for troubleshooting, Cisco ISE displays all
NAS Port values since the beginning of the previous month to the current date.
Note
When searching RADIUS authentications based on NAS IP address and Endpoint ID fields, a search is
first performed in the operational database, and then in the configuration database.
Step 1
Choose Operations > Troubleshoot > Diagnostic Tools > General Tools > RADIUS Authentication
Troubleshooting.
Step 2
Specify the search criteria in the fields as needed.
Step 3
Click Search to display the RADIUS authentications that match your search criteria.
Step 4
Select a RADIUS authentication record from the table, and click Troubleshoot.
Step 5
Click User Input Required, modify the fields as needed, and then click Submit.
Step 6
Click Done.
Step 7
Click Show Results Summary after the troubleshooting is complete.
Step 8
To view a diagnosis, the steps to resolve the problem, and a troubleshooting summary, click Done.
Related Topics
•
RADIUS Authentication Troubleshooting Settings, page B-4
•
Progress Details Settings, page B-10
•
Results Summary, page B-11
•
RADIUS Accounting Packets (Attributes) Not Coming from Switch, page G-6
•
RADIUS Server Error Message Entries Appearing in Cisco ISE, page G-19
•
RADIUS Server Connectivity Issues (No Error Message Entries Appearing in Cisco ISE),
page G-20
Executing IOS Show Commands to Check Configuration
The Execute Network Device Command diagnostic tool allows you to run the show command on any
network device. The results are exactly what you would see on a console, and can be used to identify
problems in the configuration of the device. You can use it when you suspect that the configuration is
wrong, you want to validate it , or if you are just curious about how it is configured.
Step 1
Choose Operations > Troubleshoot > Diagnostic Tools > General Tools > Execute Network Device
Command.
Step 2
Enter the information in the appropriate fields.
Step 3
Click Run to execute the command on the specified network device.
Step 4
Click User Input Required, and modify the fields as necessary.
Step 5
Click Submit to run the command on the network device, and view the output.
Cisco Identity Services Engine User Guide, Release 1.2
OL-26134-01
26-19
Chapter 26
Monitoring and Troubleshooting
Diagnostic Troubleshooting Tools
Related Topics
•
Execute Network Device Command Settings, page B-5
•
Progress Details Settings, page B-10
•
Results Summary, page B-11
Troubleshooting Network Device Configuration Issues
You can use this diagnostic tool to evaluate the configuration of a network device and identify any
configuration problems. The Expert Troubleshooter compares the configuration of the device with the
standard configuration.
Step 1
Choose Operations > Troubleshoot > Diagnostic Tools > General Tools > Evaluate Configuration
Validator.
Step 2
Enter the Network Device IP address of the device whose configuration you want to evaluate, and specify
other fields as necessary.
Step 3
Select the configuration options to compare against the recommended template.
Step 4
Click Run.
Step 5
Click User Input Required, and modify the fields as necessary.
Step 6
Check the check boxes next to the interfaces that you want to analyze, and click Submit.
Step 7
Click Show Results Summary.
Related Topics
•
Evaluate Configuration Validator Settings, page B-5
•
Progress Details Settings, page B-10
•
Results Summary, page B-11
Troubleshooting Endpoint Posture Failure
The Posture Troubleshooting tool helps you find the cause of a posture-check failure to identify the
following:
•
Which endpoints were successful in posture and which were not.
•
If an endpoint failed in posture, what steps failed in the posture process.
•
Which mandatory and optional checks passed and failed.
You determine this information by filtering requests based on parameters, such as username, MAC
address, and posture status.
Step 1
Choose Operations > Troubleshoot > Diagnostic Tools > General Tools > Posture Troubleshooting.
Step 2
Enter the information in the appropriate fields.
Step 3
Click Search.
Cisco Identity Services Engine User Guide, Release 1.2
26-20
OL-26134-01
Chapter 26
Monitoring and Troubleshooting
TCP Dump Utility to Validate the Incoming Traffic
Step 4
To find an explanation and determine a resolution for an event, select the event in the list and click
Troubleshoot.
Related Topics
•
Posture Troubleshooting Settings, page B-6
•
Progress Details Settings, page B-10
•
Results Summary, page B-11
TCP Dump Utility to Validate the Incoming Traffic
This is a tool to sniff the packet, when you want to examine that the expected packet really reached a
node. For example, when there is no incoming authentication or log indicated in the report, you may
suspect that there is no incoming traffic or that the incoming traffic cannot reach Cisco ISE. In such
cases, you can run this tool to validate.
This section shows you how to use the TCP Dump feature, and covers the following topics:
Caution
•
Using TCP Dump to Monitor Network Traffic, page 26-21
•
Saving a TCP Dump File, page 26-22
Starting a TCP Dump automatically deletes a previous dump file. To save a previous dump file, perform
the Saving a TCP Dump File, page 26-22 before you begin a new TCP Dump session.
Using TCP Dump to Monitor Network Traffic
You can configure the TCP Dump options and then collect data from the network traffic to help you
troubleshooting a network issue.
Before You Begin
•
The Network Interface drop-down list in the TCP Dump page displays only the network interface
cards (NICs) that have an IPv4 or IPv6 address configured. By default, all NICs are connected on a
VMware, and therefore, NICs are configured with an IPv6 address and displayed in the Network
Interface drop-down list.
•
You must have Adobe Flash Player installed on the Cisco ISE administration node to be able to view
the tcpdump file.
Step 1
Choose Operations > Troubleshoot > Diagnostic Tools > General Tools > TCP Dump.
Step 2
Choose a Host Name as the source for the TCP Dump utility. Inline Posture nodes are not supported.
Step 3
Choose a Network Interface to monitor from the drop-down list.
Step 4
Set Promiscuous Mode by clicking the radio button to On or Off. The default is On.
Promiscuous mode is the default packet sniffing mode in which the network interface passes all traffic
to the system’s CPU. We recommend that you leave it set to On.
Cisco Identity Services Engine User Guide, Release 1.2
OL-26134-01
26-21
Chapter 26
Monitoring and Troubleshooting
TCP Dump Utility to Validate the Incoming Traffic
Step 5
In the Filter text box, enter a boolean expression on which to filter.
Standard tcpdump filter expressions are supported, such as the following:
host 10.0.2.1 and port 1812
Step 6
Click Start to begin monitoring the network.
Step 7
Click Stop when you have collected a sufficient amount of data, or wait for the process to conclude
automatically after accumulating the maximum number of packets which is 500,000.
Related Topics
•
TCP Dump Settings, page B-7
•
Saving a TCP Dump File, page 26-22
•
Policy Service Node Not Passing Traffic, page G-7
Saving a TCP Dump File
You can save a TCP dump file to use for troubleshooting purposes.
Before You Begin
You should have successfully completed Using TCP Dump to Monitor Network Traffic, page 26-21.
Step 1
Choose Operations > Troubleshoot > Diagnostic Tools > General Tools > TCP Dump.
Step 2
Choose a Format from the drop-down list. Human Readable is the default.
Step 3
Click Download, navigate to the desired location, and then click Save.
Step 4
To get rid of the previous dump file without saving it first, click Delete.
You can also access TCPdump through the Cisco ISE CLI. For more information, refer to the Cisco
Identity Services Engine CLI Reference Guide, Release 1.2.
Comparing Unexpected SGACL for an Endpoint or User
For devices that are enabled with the Security Group Access solution, an SGACL is assigned for every
source and destination SGT pair based on the egress policy matrix that is configured in Cisco ISE. You
can use this tool when there is an unexpected SGACL for an endpoint or a user.
Step 1
Choose Operations > Troubleshoot > Diagnostic Tools > Security Group Access Tools > Egress
(SGACL) Policy.
Step 2
Enter the Network Device IP address of the Security Group Access device whose SGACL policy you
want to compare.
Step 3
Click Run.
Step 4
Click User Input Required and modify the fields as necessary.
Cisco Identity Services Engine User Guide, Release 1.2
26-22
OL-26134-01
Chapter 26
Monitoring and Troubleshooting
TCP Dump Utility to Validate the Incoming Traffic
Step 5
Click Submit.
Step 6
Click Show Results Summary to view the diagnosis and suggested resolution steps.
Related Topics
•
Progress Details Settings, page B-10
•
Results Summary, page B-11
Egress Policy Diagnostic Flow
The egress policy diagnostic tool uses the following process for its comparison:
1.
Connects to the device with the IP address that you provided, and obtains the access control lists
(ACLs) for each source and destination SGT pair.
2.
Checks the egress policy that is configured in Cisco ISE and obtains the ACLs for each source and
destination SGT pair.
3.
Compares the SGACL policy that is obtained from the network device with the SGACL policy that
is obtained from Cisco ISE.
4.
Displays the source and destination SGT pair if there is a mismatch. Also, displays the matching
entries as additional information.
Troubleshooting Connectivity Issues in an SGA-Enabled Network with SXP-IP
Mappings
In a deployment where Security Exchange Protocol (SXP) is used and an endpoint or a user cannot reach
a network resource, this tool validates the IP address and SGT mapping to see that the right IP address
and SGT binding is established.
Security Group Access devices communicate with their peers and learn their SGT values. The SXP-IP
Mappings diagnostic tool connects to the device whose IP address you provide and lists the IP addresses
of the peer devices and SGT values. You must select one or more of the device peers. This tool connects
to each of the peers that you select, and it obtains their SGT values to verify that these values are the
same as the values that it accessed earlier.
Step 1
Choose Operations > Troubleshoot > Diagnostic Tools > Security Group Access Tools > SXP-IP
Mappings.
Step 2
Enter the network device IP address of the network device, and click Select.
Step 3
Click Run, and then click User Input Required and modify the necessary fields.
The Expert Troubleshooter retrieves Security Group Access SXP connections from the network device
and again prompts you to select the peer SXP devices.
Step 4
Click User Input Required, and enter the necessary information.
Step 5
Check the check box of the peer SXP devices for which you want to compare SXP mappings, and enter
the common connection parameters.
Step 6
Click Submit.
Cisco Identity Services Engine User Guide, Release 1.2
OL-26134-01
26-23
Chapter 26
Monitoring and Troubleshooting
TCP Dump Utility to Validate the Incoming Traffic
Step 7
Click Show Results Summary to view the diagnosis and resolution steps.
Related Topics
•
SXP-IP Mappings, page B-8
Troubleshooting Connectivity Issues in an SGA-Enabled Network with IP-SGT
Mappings
For devices that are enabled with the Security Group Access solution, each user is assigned an SGT value
through RADIUS authentication. When an endpoint or a user cannot reach a network resource, this tool
validates the IP address and SGT mapping to see that the right IP address and SGT binding is established.
The IP User SGT diagnostic tool connects to the network device (with the IP address that you provide)
and obtains a list of all IP-SGT assignments on the network device. It then checks the RADIUS
authentication and accounting records for each IP-SGT pair to find out the IP-SGT-User value that is
assigned most recently. Finally, it displays the IP-SGT pairs in a tabular format, and identifies whether
the SGT values that were most recently assigned and those that are on the device are the same or
different.
Step 1
Choose Operations > Troubleshoot > Diagnostic Tools > Security Group Access Tools > IP User
SGT.
Step 2
Enter the information in the fields as needed.
Step 3
Click Run. You are prompted for additional input.
Step 4
Click User Input Required, modify the fields as necessary, and then click Submit.
Step 5
Click Show Results Summary to view the diagnosis and resolution steps.
Related Topics
•
IP User SGT, page B-9
•
Progress Details Settings, page B-10
•
Results Summary, page B-11
Troubleshooting Connectivity Issues in an SGA-Enabled Network by
Comparing Device SGT Mappings
For devices that are enabled with the Security Group Access solution, each network device is assigned
an SGT value through RADIUS authentication. The Device SGT diagnostic tool connects to the network
device (with the IP address that you provide) and obtains the network device SGT value. It then checks
the RADIUS authentication records to determine the SGT value that was assigned most recently. Finally,
it displays the Device-SGT pairs in a tabular format, and identifies whether the SGT values are the same
or different.
Cisco Identity Services Engine User Guide, Release 1.2
26-24
OL-26134-01
Chapter 26
Monitoring and Troubleshooting
Obtaining Additional Troubleshooting Information
Step 1
Choose Operations > Troubleshoot > Diagnostic Tools > Security Group Access Tools > Device
SGT.
Step 2
Enter the information in the fields as needed.
The default port number for Telnet is 23 and SSH is 22.
Step 3
Click Run.
Step 4
Click Show Results Summary to view the results of the device SGT comparison.
Related Topics
Device SGT Settings, page B-9
Obtaining Additional Troubleshooting Information
Cisco ISE allows you to download support and troubleshooting information from the Admin portal. You
can use the support bundle to prepare diagnostic information for the Cisco Technical Assistance Center
(TAC) to troubleshoot problems with Cisco ISE.
Note
The support bundles and debug logs provide advanced troubleshooting information for TAC and are
difficult to interpret. You can use the various reports and troubleshooting tools that Cisco ISE provides
to diagnose and troubleshoot issues that you are facing in your network. See “Troubleshooting Network
Access Issues” section on page 26-17 for more information.
This section contains the following topics:
•
Cisco ISE Support Bundle, page 26-25
•
Cisco ISE Debug Logs, page 26-27
Cisco ISE Support Bundle
You can configure the logs that you want to be part of your support bundle. For example, you can
configure logs from a particular service to be part of your debug logs. See the “Debug Log Configuration
Options” section on page 12-7 for more information.
The logs that you can download are categorized as follows:
•
Full configuration database—The Cisco ISE configuration database is downloaded in a
human-readable XML format. When you are trying to troubleshoot issues, you can import this
database configuration in another Cisco ISE node to recreate the scenario.
•
Debug logs—Captures bootstrap, application configuration, run-time, deployment, public key
infrastructure (PKI) information and monitoring and reporting.
Debug logs provide troubleshooting information for specific Cisco ISE components. See the “Cisco
ISE Debug Logs” section on page 26-27 for more information. To enable debug logs, see
Chapter 12, “Logging”. If you do not enable the debug logs, all the informational messages (INFO)
will be included in the support bundle.
•
Local logs—Contains syslog messages from the various processes that run on Cisco ISE.
Cisco Identity Services Engine User Guide, Release 1.2
OL-26134-01
26-25
Chapter 26
Monitoring and Troubleshooting
Obtaining Additional Troubleshooting Information
•
Core files—Contains critical information that would help identify the cause of a crash. These logs
are created when the application crashes and includes heap dumps.
•
Monitoring and reporting logs—Contains information about alerts and reports.
•
System logs—Contains Cisco Application Deployment Engine (ADE)-related information.
You can download these logs from the Cisco ISE CLI by using the backup-logs command. For more
information, refer to the Cisco Identity Services Engine CLI Reference Guide, Release 1.2.
Note
For Inline Posture nodes, you cannot download the support bundle from the Admin portal. You must use
the backup-logs command from the Cisco ISE CLI to download logs for Inline Posture nodes.
If you choose to download these logs from the Admin portal, you can do the following:
•
Download only a subset of logs based on the log type such as debug logs or system logs.
•
Download only the latest “n” number of files for the selected log type. This option allows you to
control the size of the support bundle and the time taken for download.
Monitoring logs provide information about the monitoring, reporting, and troubleshooting features.
Related Topic
Downloading Support Bundles, page 26-26
Downloading Support Bundles
You can download the support bundle to your local computer as a simple tar.gpg file. The support bundle
will be named with the date and time stamps in the format
ise-support-bundle_ise-support-bundle-mm-dd-yyyy-hh-mm.tar.gpg. The browser prompts you to save
the support bundle to an appropriate location. You can extract the content of the support bundle and the
view the README.TXT file, which describes the contents of the support bundle, as well as how to
import the contents of the ISE database if it is included in the support bundle.
Before You Begin
You must have Super Admin or System Admin privileges to perform the following task.
Step 1
Choose Operations > Troubleshoot > Download Logs > Appliance node list.
Step 2
Click the node from which you want to download the support bundles.
Step 3
In the Support Bundle tab, choose the parameters that you want to be populated in your support bundle.
If you include all the logs, your support bundle will be excessively large and the download will take a
long time. To optimize the download process, choose to download only the most recent n number of files.
Step 4
Enter and re-enter the encryption key for the support bundle.
Step 5
Click Create Support Bundle.
Step 6
Click Download to download the newly-created support bundle.
The support bundle is a tar.gpg file that is downloaded to the client system that is running your
application browser.
Cisco Identity Services Engine User Guide, Release 1.2
26-26
OL-26134-01
Chapter 26
Monitoring and Troubleshooting
Obtaining Additional Troubleshooting Information
Related Topic
Cisco ISE Admin Groups, Access Levels, Permissions, and Restrictions
Next Step:
See “Cisco ISE Debug Logs” section on page 26-27 for information on how to obtain debug logs for
specific components.
Cisco ISE Debug Logs
Debug logs provide troubleshooting information for various Cisco ISE components. While reporting
problems, you might be asked to enable these debug logs and send them for diagnosis and resolution of
your problems.
Obtaining debug logs is a two-step process:
1.
Configure the components for which you want to obtain the debug logs on the Debug Log
Configuration page.
2.
Download the debug logs.
Related Topics
•
To configure debug logs for various components, see “Debug Log Configuration Options” section
on page 12-7 and “Configuring Debug Log Severity Levels” section on page 12-7
•
Downloading Debug Logs, page 26-28
Cisco ISE Components and the Corresponding Debug Logs
Table 26-3 provides a list of components and the corresponding debug logs that it generates.
Table 26-3
Components and Corresponding Debug Logs
Component
Debug Log
Active Directory
ad_agent.log
CacheTracker
ise-tracking.log
Entity Definition Framework (EDF)
ise-edf.log
JMS
ise-psc.log
License
ise-psc.log
NotificationTracker
ise-tracking.log
Replication-Deployment
replication.log
Replication-JGroup
replication.log
ReplicationTracker
ise-tracking.log
RuleEngine-Attributes
ise-psc.log
RuleEngine-Policy-IDGroups
ise-psc.log
accessfilter
ise-psc.log
admin-infra
ise-psc.log
boot-starp wizard
ise-psc.log
Cisco Identity Services Engine User Guide, Release 1.2
OL-26134-01
26-27
Chapter 26
Monitoring and Troubleshooting
Obtaining Additional Troubleshooting Information
Table 26-3
Components and Corresponding Debug Logs (continued)
Component
Debug Log
cisco-mnt
ise-psc.log
client
ise-psc.log
cpm-clustering
ise-psc.log
cpm-mnt
ise-psc.log
epm-pdp
ise-psc.log
epm-pip
ise-psc.log
eps
ise-psc.log
ers
ise-psc.log
guest
ise-psc.log
guestauth
ise-psc.log
guestportal
ise-psc.log
identity-store-AD
ise-psc.log
infrastructure
ise-psc.log
mdm
ise-psc.log
mdm-pip
ise-psc.log
mnt-alarm
mnt-alarm.log
mnt-report
mnt-report.log
mydevices
ise-psc.log
nsf
ise-psc.log
nsf-session
ise-psc.log
org-apache
ise-psc.log
org-apache-cxf
ise-psc.log
org-apache-digester
ise-psc.log
posture
ise-psc.log
profiler
profiler.log
provisioning
ise-psc.log
prrt-JNI
ise-prrt.log
runtime-AAA
prrt.log
runtime-config
prrt.log
runtime-logging
prrt.log
sponsorportal
ise-psc.log
swiss
ise-psc.log
Downloading Debug Logs
You can use this process to download and save a debug log file.
Cisco Identity Services Engine User Guide, Release 1.2
26-28
OL-26134-01
Chapter 26
Monitoring and Troubleshooting
Monitoring Database
Before You Begin
To perform the following task, you must be a Super Admin or System Admin.
Step 1
Choose Operations > Troubleshoot > Download Logs > Appliance node list.
Step 2
Click the node from which you want to download the debug logs.
Step 3
Click the Debug Logs tab.
A list of debug log types and debug logs is displayed. This list is based on your debug log configuration.
Step 4
Click the log file that you want to download and save it to the system that is running your client browser.
You can repeat this process to download other log files as needed. The following are additional debug
logs that you can download from the Debug Logs page:
•
isebootstrap.log—Provides bootstrapping log messages
•
monit.log—Provides watchdog messages
•
pki.log—Provides the third-party crypto library logs
•
iseLocalStore.log—Provides logs about the local store files
•
ad_agent.log—Provides Microsoft Active Directory third-party library logs
•
catalina.log—Provides third-party logs
Related Topic
•
Cisco ISE Admin Groups, Access Levels, Permissions, and Restrictions
•
“Debug Log Configuration Options” section on page 12-7
Monitoring Database
The rate and amount of data that is utilized by Monitoring functions requires a separate database on a
dedicated node that is used for these purposes.
Like Policy Service, Monitoring has a dedicated database that requires you to perform maintenance
tasks, such as the topics covered in this section:
•
Back Up and Restore of the Monitoring Database, page 26-29
•
Monitoring Database Purge, page 26-30
•
Log Collection, page 26-12
Back Up and Restore of the Monitoring Database
Monitoring database handles large volumes of data. Over time, the performance and efficiency of the
monitoring node depends on how well you manage that data. To increase efficiency, we recommend that
you back up the data and transfer it to a remote repository on a regular basis. You can automate this task
by scheduling automatic backups.
Cisco Identity Services Engine User Guide, Release 1.2
OL-26134-01
26-29
Chapter 26
Monitoring and Troubleshooting
Monitoring Database
Note
You should not perform a backup when a purge operation is in progress. If you start a backup during a
purge operation, the purge operation stops or fails.
If you register a secondary Monitoring node, we recommend that you first back up the primary
Monitoring node and then restore the data to the new secondary Monitoring node. This ensures that the
history of the primary Monitoring node is in sync with the new secondary node as new changes are
replicated.
Related Topics
•
Performing an On-Demand Backup, page 13-4
•
Scheduling a Backup, page 13-5
•
Data Restoration Guidelines, page 13-7
•
Restoration of Monitoring Database, page 13-10
Monitoring Database Purge
The purging process allows you to manage the size of the Monitoring database by specifying the number
of months to retain data during a purge. The default is three months. This value is utilized when the disk
space usage threshold for purging (percentage of disk space) is met. For this option, each month consists
of 30 days. A default of three months equals 90 days.
Related Topics
•
Guidelines for Purging the Monitoring Database, page 26-30
•
Purging Older Monitoring Data, page 26-30
Guidelines for Purging the Monitoring Database
The following are some guidelines to follow relating to monitoring database disk usage:
•
If the Monitoring database disk usage is greater than 80 percent of the threshold setting, critical
alarm is generated indicating that the database size has exceeded the allocated disk size. If the disk
usage is greater than 90 percent another alarm is generated.
A purge process runs, creating a status history report that you can view by choosing Operations >
Reports > Deployment Status > Data Purging Audit. An information (INFO) alarm is generated
when the purge completes.
•
Purging is also based on the percentage of consumed disk space for the database. When the
consumed disk space for the monitoring database is equal to or exceeds the threshold (the default is
80 percent), the purge process starts. This process deletes only the last seven days of monitoring
data, irrespective of what is configured in the Admin portal. It will continue this process in a loop
until the disk space is below 80 percent. Purging always checks the Monitoring database disk space
limit before proceeding.
Purging Older Monitoring Data
The purging process allows you to manage the size of the Monitoring database.
Cisco Identity Services Engine User Guide, Release 1.2
26-30
OL-26134-01
Chapter 26
Monitoring and Troubleshooting
Monitoring Database
Before You Begin
To perform the following task, you must be a Super Admin or System Admin.
Step 1
Choose Administration > System > Maintenance > Data Purging.
Step 2
Specify the time period in months, for which the data will be retained. All the data prior to the specified
time period will be purged. For this option, each month consists of 30 days. The default of three months
equals 90 days.
Note
If the configured retention period is less than the existing retention thresholds corresponding to
the diagnostics data, then the configured value overrides the existing threshold values. For
example, if you configure the retention period as 3 days and this value is less than the existing
thresholds in the diagnostics tables (for example, a default of 5 days), then data is purged
according to the value that you configure (3 days) in this page.
Step 3
Click Submit.
Step 4
Verify the success of the data purge by viewing the Data Purging Audit report.
Related Topic
Cisco ISE Admin Groups, Access Levels, Permissions, and Restrictions
Next Steps
Proceed with one of the of the following tasks:
•
Log Collection, page 26-12
•
Performing an On-Demand Backup, page 13-4
Cisco Identity Services Engine User Guide, Release 1.2
OL-26134-01
26-31
Chapter 26
Monitoring and Troubleshooting
Monitoring Database
Cisco Identity Services Engine User Guide, Release 1.2
26-32
OL-26134-01