1
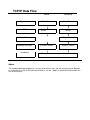
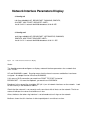
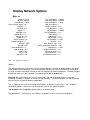
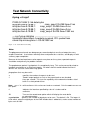
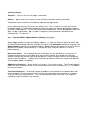
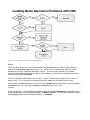
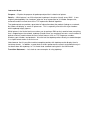
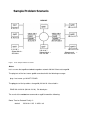
Unit 9. Troubleshooting
What This Unit Is About
This unit describes debugging tips, problem areas of hardware and
software, and diagnostic commands and tools available for
understanding problem areas in networking.
What You Should Be Able To Do
After completing this unit, students should be able to:
• Describe debugging alternatives
• Document network and system configuration
• Use tools to diagnose TCP/IP problems.
How You Will Check Your Progress
Accountability:
• Checkpoint questions
• Exercises
Objectives ______________________
After completing this unit, students should be able to:
• Describe debugging alternatives
• Document network and system configuration
• Use tools to diagnose TCP/IP problems
Figure
9-1. Objectives
Notes:
Instructor Notes:
Purpose — Set the students' expectation level for the lecture.
Details — Three general topics in this module:
• debugging methodology
• documenting system and network configuration
• debugging tools
Discuss the level of detail for this lecture. Each of the lectures could last for a day. In fact,
classes exist on these topics. Our focus is to identify some of the issues and commands involved
with networking.
Everything is intended to be taught at an introductory level. The flow of the unit is to first discuss
the importance of having a problem resolution methodology in place which needs to include a
picture of the network topology and information on system configuration. All this should be
documented when the systems and network are running smoothly. The first set of commands that
will be covered are those that can be used to document the system. The next set can be used to
aid in debugging. The unit will end with a brief review of what steps to take to isolate the problem
of two systems unable to communicate with each other.
Transition Statement — Let's begin our discussion of using a debugging methodology.
Debugging Networks
1. Work from a picture
2. Use a methodology
3. What are your assumptions?
Figure
9-2. Debugging Networks
Notes:
Diagram the network topology so you can clearly identify the components involved. Collect such
information as IP addresses and network masks.
Be methodical in solving the problem. Work through the protocols from bottom to top hardware to
networking, to application. Identify what works and what specifically will not.
Many times the problem can be identified when you examine your assumptions. Wha has
changed? What used to work or works now? What values are tables really set to? Eliminate
variables one by one.
Try to answer some basic questions to help identify the scope and nature of the problems.
These questions include :
• Is it just this machine?
• Is it intermittent or continuous?
• Is it just this subnet or several subnets connected to a router?
• Is it all services or just one service, for example NFS?
• Was the network changed in any way
• Was this machine changed in any way ?
• Was it working before?
• Are the gateways operating ?
Instructor Notes:
Purpose — Discuss general strategies at debugging networks.
Details — This page can actually be the point of discussion for many minutes. It is a collection of
hints and common sense advice—some learned the hard way.
Spend some time discussing the value of using a picture in debugging a network. Using a picture
allows you to identify the topology involved. In addition, it helps to correctly identify the
components involved— both hardware, software, IP address, etc. Finally, working with a picture
can help eliminate confusion between the end-user/problem reporter, and the netadministrator/problem solver. Any stories can be helpful—like the bridge testers that were putting
an experimental bridge on two Ethernet segments. Unfortunately they had some confusion on the
segments and connected both interfaces to the same segment. Better example—Not realizing
bridges and routers are in the topology between client and server.
It is important to be methodical in debugging a problem. The reason is to be efficient. Most of us
want to wing it and just quickly solve it. Example: guessing a number between 1 and 1000.
Sporadic guessing can take forever.
• Possible methodologies:
a) What is the most embarrassing/obvious cause of error? Machine off, cable
disconnected, bad cable, connector. Something just changed. PC just added and there
are now broadcast storms.
b) What can you check and correct the easiest or quickest? ping can tell you quickly if
you have basic connectivity to the box.
c) Climb protocol stack from the bottom when debugging. Can I do Xwindow, if my cable is
broken? My NFS mounts will always fail as long as my routing table is in error.
• Assumptions: Where do you assume most network problems occur? Hardware failure,
software bugs, configuration. My experience is that most problems are not software bugs but
configuration errors. Your assumptions will point you to where you put your attention, and if the
problem is not discovered quickly, where you may want to look next — at your assumptions.
• You deal with two basic problems—set up or maintenance.
• With maintenance you are trying to find out what has changed. Example: End-user report,
"Nothing has changed, but now it does not work". But we assume a deterministic system —
"Given A,B,C, then D will always occur." On networks, tracking change is difficult because
sometimes you do not control all the pieces or even track all the pieces at the same time. We
have seen in the exercises that one of the biggest challenges is keeping in sync with other
systems.
The key is to use common sense coupled with a methodical approach to isolating the problem.
Discussion Items — How helpful were the drawings of the exercise topology in doing the labs this
week?
If I can reach all of the systems on my network but not on another, where might the problem lie?
Check the routing tables.
What if all the systems on an Ethernet segment suddenly stop being able to
communicate? Check the cabling.
What should I look for if I can telnet to a system using the IP address but not the host name?
Check name resolution (either /etc/hosts, NIS or DNS).
Transition Statement — A very helpful methodology already mentioned is to use the TCP/IP
layers, and starting at the bottom, work your way up until the problem has been isolated. Let's
quickly review how the data flows.
TCP/IP Data Flow
Send
Receive
Application
Write Buffer
Read Buffer
TCP
Socket Send
Buffer
Socket Receive
Buffer
IP
Network Interface
Hardware
Figure
IP Input Queue
Transmit Queue
Transport
Receive Queue
Medium
9-3. TCP/IP Data Flow
Notes:
The standard debugging approach is to start at the lowest layer, the one everything else depends
on, and work your way up testing and checking as you go. ping is a good command to begin the
test of connectivity.
Instructor Notes:
Purpose — Describe the approach of starting with the physical layer and working your way up to
the application level.
Details — You may wish to begin this discussion with a brief review of how the data flows from
application to application. The diagram is created from a slightly different perspective than the one
used in the concept unit. From this perspective, data is written from the application to a write
buffer. System memory is used for this. If the message is small it is then copied to a socket send
buffer (either TCP or UDP depending on what the application requested). The port number of the
sending application is included here along with the port number of the receiving application which
was requested by the sending application. TCP segments the data stream and adds its control
information and passes it to IP. IP adds its information including the correct IP source and
destination addresses, checks the arp table and puts it in the transmit queue of the network
interface. It then gets taken from the transmit queue and put on the wire after the appropriate
network interface control information is added.
The destination machine receives the message from the transport medium and puts it in the
receive queue. Once the network interface has completed its check it passes to the IP input queue
where IP will put the datastream back together if it had to be fragmented at the sending side (UDP
transport protocol doesn't break up large datastreams, IP has to do this). When complete, the
datastream is copied to the socket receive buffer and the application notified. The data is then put
in the application read buffer. All the buffer and the IP input queue use system memory, a
potentially limited resource. The transmit and receive queues use memory on the adapters. There
are many places along the way where a message can be delayed or lost. That is why it is a good
idea to use this layered approach to isolating a problem starting from what every other layer
depends on, the hardware layer.
Transition Statement — Before going into the individual commands that can be used to isolate
network related problems, let's look at a roadmap of what role these commands play in the problem
determination process.
Overview of Troubleshooting Commands
AlX
Specific
Figure
UNIX
TCP/IP
Document
System
Iscfg, Isdev,
Isattr
Document
Network
Isattr
Isdev
ifconfig
no
Problem
Determination
iptrace
errpt
ping, ifconfig
arp
tcpdump
netstat
Tuning
Isdev
no
ifconfig
9-4. Overview of Troubleshooting Commands
Notes:
The above table shows the various commands we will cover in this unit. Some are available
only on AlX systems, others are available across UNIX systems running TCP/IP.
Instructor Notes:
Purpose — Provide an overview of what commands we will cover and for what purpose they
can be used.
Details — Since the unit tends to be a collection of commands students often lose sight of the big
picture — what we are trying to accomplish with these commands. This overview can be used to
put the various commands into perspective of how they can be used. The discussion starts with
how to document the system using the Iscfg, Isdev, Isattr, ifconfig and no commands. Then we
will move into the commands that help in problem determination and isolation. Since some of
these commands can aid in several areas be sure to mention those already covered, like ifconfig
and no, in the appropriate places. There will be only one foil for each command, except netstat
which we'll show a foil for each of several options, so feel free to refer back to previously covered
commands when you are discussing the new area such as problem determination and tuning.
Transition Statement — In order to begin problem determination at the hardware layer, a good
picture of the hardware in the network and its configuration when it is working is important to have.
Let's look at some commands to help capture this information.
List System Configuration Information
# Iscfg
INSTALLED RESOURCE LIST
+ sysplanar0
00-00
+ proc0
00-00
+ mem0
00-0D
+ fd0
00-00-0D-00
+ siokta0
00-00-0K
+ tok0
00-06
CPU Pianar
Processor
64MB Memory Card
Diskette Drive
Keyboard/Tablets Adapter
Token-Ring High Performance
Adapter
# Iscfg -I tok0 -v
DEVICE LOCATION
DESCRIPTION
tok0
00-03
Token-Ring High-Performance Adapter
(8fc8)
Network Address.. ................... 10005AA89C93
Displayable Message .............. TOKEN RING
EC Level ..................................C24551
FRU Number ............................ 002F9380
Manufacturer ............................ VEN0CLT96G
Part Number..............................074F8653
Serial Number .......................... 201195
ROS Level and ID.. .................. 0000
Loadable microcode level......... 00
Figure
9-5. List System Configuration Information
Notes:
Iscfg without any parameters will list the name, location, and brief description of each device that
your system knows about.
Iscfg -v -I tok0 will display vital product data for a particular device, (note that the output from
the first command has been edited slightly for readability.)
Instructor Notes:
Purpose — Introduce the use of the Iscfg command.
Details — Iscfg can quickly show all the devices, especially network adapters, installed in the
system. You do not even have to remember any parameters. It is an AlX-unique command.
Example, do I have one or two network cards? What slots are they in?
-v displays vital product data. It shows very detailed information like hardware address, serial
numbers for inventories, etc. in the MCA systems. On PCI-based systems it displays only the
hardware address of the adapter.
Additional Information — A plus or minus in front of a device indicates that the device has either
been added ( + ) or deleted (-) from the Diagnostic Test List. An * indicates diagnostic support is
not available, which is the case on the PCI-based RISC systems.
Transition Statement — A similar command that shows devices and their locations is Isdev. This
command can show not only configured devices but also ones that can be configured (predefined).
Let's see how this command works.
List Device Information
Figure
# Isdev -C -c if
lo0 Available en0
Available
et0
Defined
Loopback Network Interface Standard
Ethernet Network Interface IEEE 802.3
Ethernet Network Interface
# Isdev -C -c adapter
fda0 Available 00-00-00-0D
siokta0 Available 00-00-0K
sa0
Available 00-00-S1
sa1
Available 00-00-S2
gda0 Available 00-04
scsi0 Available 00-08
ent0 Available 00-03
sic0 Available 00-00
sioma0 Available 00-00-0M
ppa0 Available 00-00-SP
tok0 Available 00-07
Standard I/O Diskette Adapter
Keyboard/Tablet Adapter
Standard I/O Serial Portl
Standard I/O Serial Port2
Color Graphics Display Adapter
SCSI I/O Controller
Ethernet High-Performance LAN Adapter (8efs)
Serial Optical Link Chip
Mouse Adapter
Standard I/O Parallel Port Adapter
Token-Ring High-Performance Adapter (8fc8)
9-6. List Device Information
Notes:
These two displays simply show how you can use the Isdev command to list out the interfaces
and adapters configured on your system. Our interest in these displays is with the network
interfaces and adapters.
The -C flag lists information about a device that is in the Customized Devices Object Class. The
default information that is displayed is name, status, location, and description. The Isdev
command used with the -P option shows devices that can be configured.
The -c <class> flag specifies a device class name. This flag can be used to restrict output to
devices in a specified class, such as adapter, disk, printer, etc.
Instructor Notes:
Purpose — Introduce the use of the Isdev command.
Details — Isdev shows which adapters are configured (AVAILABLE) and which are not
(DEFINED).
Explain the difference between ent0 and en0 or et0 (adapter vs protocol interface). Also, discuss
how the numbers correlate between adapter and interface.
Some times cfgmgr will mark a card as missing if cards are moved around.
The output shown in the visual is from a classical RISC System/6000. PCI-based systems
have a different description for many of it's adapters.
Additional Information — The -H option used with the Isdev command is useful because it
provides headings over the columns. The command: Isdev -P if will show all the predefined
network interfaces, those that can be used on the RISC System/6000 and Power 4/5.
Transition Statement — A useful command for more specific information on a particular
device or network interface is the Isattr command.
List Device Attributes
# Isattr -E -H -I en0
attribute
mtu
remmtu
netaddr
state
arp
netmask
security
authority
broadcast
netaddr6
alias6
prefixlen
value
1500
576
9.19.98.1
up
on
255.255.255.0
none
alias4
Figure
description
user settable
Maximum IP Packet Size for This Device
Maximum IP Packet Size for REMOTE
Internet Address
Current Interface Status
Address Resolution Protocol (ARP)
Subnet Mask
Security Level
Authorized Users
Broadcast Address
N/A
N/A
N/A
N/A
True
Networks True
True
True
True
True
True
True
True
True
True
True
True
9-7. List Device Attributes
Notes:
The Isattr command displays information about the attributes of a given device or kind of device,
as well as some of the possible values for a device on the system.
This example shows how the Isattr command can be used for checking on the LAN adapters. The
-E flag is used to display effective values (valid only for customized devices specified with the -I
flag). The -I <name> specifies the device logical name in the Customized Device Object Class
whose attribute names or attribute values are to be displayed.
Instructor Notes:
Purpose — Introduce the use of Isattr.
Details — Isattr is the AlX command for showing how a device or network interface is configured,
ifconfig is more universal but shows a little bit different informaton.
The -E option shows the effective values. The -I option will display the device logical name.
Additional Information — To change these attributes, use the chdev command.
The following output is the result of running the Isattr command against a token-ring network
interface:
mtu
mtu_4
mtu_16
remmtu
1492
1492
1492
576
netaddr
state
arp
allcast
hwloop
netmask
security
authority
broadcast
netaddr6
alias6
prefixlen
alias4
9.19.115.86
up
on
on
off
255.255.240.0
none
Maximum IP Packet Size for This Device
Maximum IP Packet Size for This Device
Maximum IP Packet Size for This Device
Maximum IP Packet Size for REMOTE
Networks
Internet Address
Current Interface Status
Address Resolution Protocol (ARP)
Confine Broadcast to Local Token-Ring
Enable Hardware Loopback Mode
Subnet Mask
Security Level
Authorized User
Broadcast Address
N/A
N/A
N/A
N/A
True
True
True
True
True
True
True
True
True
True
True
True
True
True
True
True
True
You can use the Isattr command on a physical device as well such as tokO. The output from this
command is useful when configuring multiple adapters on a PCI-based system. Following is a
sample from an MCA system using Isattr -I tokO -E
bus_intr_lvl
intr_priority
xmt_que_size
bus_io_addr
dmajvl
dma_bus_mem
3
3
60
0x86a0
5
0x302000
ring_speed
attn_mac
beacon_mac
use_alt_addr
16
no
no
no
alt_addr
0x
Bus interrupt level
Interrupt priority
TRANSMIT queue size
Bus I/O address
DMA arbitration level
Address of bus memory used for
DMA
RING speed
Receive ATTENTION MAC frame
Receive BEACON MAC frame
Enable ALTERNATE TOKEN RING
address
ALTERNATE TOKEN RING
address
False
False
True
False
False
False
True
True
True
True
True
To see the difference, the following is the same command executed on a PCI-based system:
intr_level
intr_priority
bios_addr
9
3
0xcc000
xmt_que_size
busJo_addr
shared_mem_addr
shared_memjeng
96
0xa20
0xd0000
0x8000
ring_speed
attn_mac
16
no
beacon_mac
no
use_alt_addr
no
alt_addr
0x
Bus interrupt level
Interrupt priority
Address of bus memory
used for Bios
TRANSMIT queue size
Bus I/O address
Bus memory address
Width of shared bus
memory
RING speed
Receive ATTENTION
MAC frame
Receive BEACON MAC
frame
Enable ALTERNATE
TOKEN RING address
ALTERNATE TOKEN
RING address
True
False
True
True
True
True
True
True
True
True
True
True
Transition Statement — The information provided by the Isattr command for netaddr, state,
trailers, netmasks, and broadcast can also be displayed with the ifconfig command. Let's take
a look at its format.
Network Interface Parameters Display
# ifconfig tr0
tr0: flags=80a0043<UP, BROADCAST, RUNNING, SIMPLEX,
ALLCAST, MULTICAST, GROUPRT, 64BIT>
inet 9.19.42.11 netmask 0xffffff00 broadcast 9.19.42.255
# ifconfig en0
en0: flags=e08063<UP, BROADCAST, NOTRAILERS, RUNNING,
SIMPLEX, MULTICAST,GROUPRT,64BIT>
inet 9.19.111.1 netmask 0xffffff00 broadcast 9.19.111.255
Figure
9-8. Network Interface Parameters Display
Notes:
The ifconfig command configures or displays network interface parameters for a network that
uses TCP/IP.
UP and RUNNING is good. Running means that the kernel resources and buffers have been
assigned. An adapter can be UP but not RUNNING.
If this were a SLIP connection you would see POINT TO POINT instead of
BROADCAST. If it were the loopback, you would see LOOPBACK.
Broadcast in the second line should be 255 (all 1s) on all network interfaces on the network. Look
for consistency in the broadcast address.
Check that the netmask is set correctly and is consistent with all hosts on the network. The 0x on
netmask indicates the values that follow are in hex.
Allcast indicates the token-ring interface is set to broadcast to all rings on the network.
Multicast shows that this interface is able to participate in a multicast session.
Instructor Notes:
Purpose — Discuss the output of the ifconfig command.
Details — ifconfig can be used to configure TCP/IP interfaces from the command line. Once
configured, using ifconfig with an interface name will display the state of the interface. It is a
common UNIX command unlike the three previously covered commands which are AlX only.
Cover the student notes for the output and how to evaluate it.
The subnet mask is shown in hex. ffffff00 equals 255.255.255.0.
Any user can use the ifconfig command to query an interface, however, only root or a member of
the system group can use ifconfig to modify the configuration of the interfaces.
Transition Statement — A useful command to use to document the various network options in
effect on your system is the no command. Let's see what information it provides.
Display Network Options
#no -a
thewall = 5112
sb_max =65536
somaxconn = 1024
clean_partial_conns = 0
rtojow = 1
rto_high =64
rtojimit = 7
rtojength = 13
arptab_bsiz = 7
arptab_nb = 25
arpqsize = 1
Route_expire = 0
subnetsarelocal = 1
maxttl = 255
Ipfragttl = 60
ipsendredirects = 1
ipforwarding = 0
udpjtl = 30
tcp_ttl = 60
arpt_killc = 20
Figure
tcp_sendspace :
tcp_recvspace :
udp_sendspace :
udp_recvspace :
nonlocsrcroute =
tcp_keepintvl :
tcp_keepidle :
rfc1122addrchk =
bcastping :
udpcksum =
tcp_mssdflt =
tcp_keepinit =
rfc1323 =
pmt_default_age :
pmtu_rediscoverJntervaI :
ipqmaxlen =
ipignoreredirects =
ipsrcroutesend =
Ipsrcrouterecv =
ipsrcrouteforward =
=16384
=16384
= 9216
=
41920
=
0
= 150
=14400
=0
=1
=1
= 512
= 150
=0
=0
= 30
= 100
=0
=1
=0
=1
9-9. Display Network Options
Notes:
The no command sets or displays current network options in the kernel depending on the option
used. When making changes, this command only operates on the current running system and
must be run again after each startup or after the network has been configured. To make changes
permanent, they must be included in the /etc/rc.net or /etc/rc.bsdnet file.
Warning: Be careful when you use this command. The no command performs no range
checking; therefore, it accepts all values for the variables. If used incorrectly, the no command
can cause your system to become inoperable.
The -a option prints a list of all configurable options and their current values. The -o option
followed by option = New Value will change the value of the specified option.
no -d option sets the option variable back to its default state.
See Appendix E, " Summary of "no" Options" on page E-1 for a summary of no options.
Instructor Notes:
Purpose — Describe the use of the no command to configure and display the kernel's network
options.
Details — The no command is useful to document current network settings as well as aid in
problem determination and tuning.
Most of AlX is designed so that tuning is not necessary by the system administrator-especially
compared to other UNIX operating systems. The network is an exception, because networking
varies so much from system to system in its impact on system resources.
The important values at this point to focus on are thewall and ipforwarding.
Some call no a patch program because it allows you to look into the kernel and vary values. See
Appendix E, " Summary of "no" Options" on page E-1 for information on the no options.
Transition Statement — Now that you have a pretty good picture of your system configuration, a
good command to use first in isolating network problems is the ping command.
Test Network Connectivity
# ping -c 5 sys1
PING (9.19.98.1): 56 data bytes
icmp_seq=0 ttl=255 time=2 ms
64 bytes from 9.19.98.1:
icmp_seq=1 ttl=255 time=2 ms
64 bytes from 9.19.98.1:
icmp_seq=2 ttl=255 time=2 ms
64 bytes from 9.19.98.1:
64 bytes from 9.19.98.1:
icmp_seq=4 ttl=225 tlme=1392 ms
— sys1 ping statistics ---------------------------------------------5 packets transmitted, 4 packets received, 20% packet loss
round-trip min/avg/max = 2/345/1392 ms
Figure
9-10. Test Network Connectivity
Notes:
The ping command sends one datagram per second and prints one line of output for every
response received. It calculates round trip times and packet loss statistics, and displays a brief
summary upon completion.
Because of the load continuous echo requests can place on the system, repeated requests
should be used primarily for problem isolation.
The gap between packet 2 and packet 4 is exceptionally long. This can be caused by a bad or
improper termination on an Ethernet network. On token-ring this would indicate that not all
devices are set to the same token-ring speed.
ping options that may be useful :
-c
specifies the number of requests to be sent
-f
"floods" output packets as fast as they come back or one hundred
times per second. This tests the capability of the network to handle a lot of
traffic in a short period of time.
Note: use –f & -s with caution as this can be very hard on a network. Only the root user can use
this option
-i
-R
Indicates the interface specified by a.b.c.d. is to be used for
multicasts
Turns on the record route option which will display the route buffer
on returned packets.
-s packetsize
Specifies the number of data bytes to be sent. The default is 56. The largest is
8184 which, when the eight bytes of the ICMP header data is added to it, makes a total number of
bytes sent of 8192.
Instructor Notes:
Purpose — Identify the different information the ping command can give you as to what is
occurring on the LAN.
Details — One of the difficulties of network debugging is not being able to see what is occurring on
the wire/network, ping gives a surprising amount of information. Review how it is simply forming a
packet every second that is passed to the target and echoed back.
Issuing the ping command verifies that the bottom half of the protocol stack is correctly
configured for both machines, and that the network is intact in between. This is commonly
used to start debugging.
Each packet is sequenced. The output can show the reliability of the network—are packets being
lost? Once the command is ended, it will show the number of packets lost. Lost packets can be
bad cabling. With token-ring, a station connecting to the network at the wrong speed can cause all
systems on the net to have problems, depending on the MAU being used.
The time parameter will vary from device to device. RISC to RISC over token-ring or Ethernet will
be about two milliseconds. Other devices and systems may be slower, even at their best.
Become familiar with what is a normal response time, when pinging other devices, so that you can
determine abnormal conditions.
The statistics on minimum, average, and maximum response time are significant. Ideal is to have
little spread between minimum and maximum times. In addition, the average is best when close to
the minimum.
Additional Information — Error messages returned from ping can also be a valuable source of
information when first beginning to isolate a problem. For example the message :
ping: host name xxx not found
could indicate a potential problem with name resolution.
The message
ping: sendto: A route to the remote host is not available
indicates the routing table doesn't know where to send the packet in order to reach its destination.
Use netstat -r to check the routing table.
The message
ping: sendto: A message for a socket data transfer is too long
could indicate a problem with the mtu size. Use netstat -i to check the interface statistics.
Even when the response you get is no message such as
ping sandboxl (9.19.110.1): 56 data bytes
this still can be helpful. What this tells you is that name resolution is working, the system found a
route on which to send the packet, however the packet is either hung up on an intermediate router
or the destination machine is not responding properly (turned off, doesn't have a route back, etc.).
The problem most likely does not exist on the sending machine but on the receiving machine or
somewhere in-between.
Transition Statement — When experiencing connectivity problems, it is a good idea to check for
potential problems with address resolution. The arp command is used for this.
Check Address Resolution
# arp -a
sys2 (9.19.98.2) at 8:0:20:1:9f:4a (published)
sys5 (9.19.98.5) at (incomplete)
sys3 (9.19.98.3) at 10:0:5a:a8:3a:1f [token ring]
?
Figure
(9.19.98.1) at (incomplete)
9-11. Check Address Resolution
Notes:
Dynamic entries are added on the fly during the course of normal IP traffic on a physical network.
Infrequently used mappings added in this fashion have a short lifetime in the ARP table. After 20
minutes without reference to the entry, it is then purged from the table.
Published entries in the ARP table are entries that turn that host into an ARP server. Normally, a
host replies only to requests for its own IP address, but if it has published entries, then it replies for
multiple IP addresses for which it has a published entry.
The incomplete entry indicates a host did not respond to an ARP request. Incomplete entries are
deleted after three minutes.
Instructor Notes:
Purpose — Discuss the use of the arp -a command.
Details — arp -a shows the systems on the LAN that have been recently contacted.
Incomplete entries show hosts that did not repond to the arp request.
Hosts publishing the entry will answer for another host. This is used for a system that cannot
respond to arp or is isolated from broadcast packets by a piece of network partitioning hardware
that filters out broadcasts. For an entry to be marked "published" it has to be added via either the
arp -s or arp -f commands. arp -s creates an arp entry from parameters provided on the
command line. The format is :
arp -s Type HostName AdapterAddress [Route] [temp] [pub]
Where Type specifies the type of hardware address, i.e., ether for Ethernet, 802.3 for 802.3, fddi
for Fiber Distributed Data Interface, and 802.5 for token-ring; HostName specifies the remote host;
AdapterAddress specifies the hardware address; Route specifies the token-ring or FDDI route as
defined in the header; temp indicates it is a temporary entry; and pub specifies it is to be a
published entry.
Discussion Items — For a network with lots of Xstations or non- AlX devices, sometimes it is
intriguing to do a ping net_id (9.19.98.0) to see who will respond. Then dump the arp cache.
Another situation that can be interesting to diagnose is where multiple machines are configured
with the same IP address. Looking at the arp cache on different machines should show different
IP to hardware address mappings.
Additional Information — Some entries may show a ? for the host name. The IP and hardware
addresses were received, but the system cannot do reverse name resolution on it; i.e., IP address
to name translation.
Transition Statement — A common source of problems encountered in the network deals with
name resolution. There are three facilities that can be used to do name resolution in a network.
They are DNS, NIS, and /etc/hosts. Let's start by looking at DNS since that is the required
method for name resolution in the Internet.
Isolating Name Resolution Problems with DNS
Figure
9-12. Isolating Name Resolution Problems With DNS
Notes:
The first step is to check for the existence of the /etc/resolv.conf file. A quick way to do this is
with the Is -I /etc/resolv.conf command. If this system was not meant to be a part of a DNS
environment, this file should be removed if it exists. If it exists and it shouldn't, all network
services will be impacted waiting on DNS to time out before a name gets resolved by some other
method, either NIS or /etc/hosts.
If this file should exist but it does not, create it. The file should only be empty if this system is a
name server. If it is not, the file should contain the IP addresses of nearby name servers.
If the system is supposed to be a name server, the named daemon should be running. Use Issrc s named to see if it is running and startsrc -s named to start it if it is not
running.
If name resolution is still not working, check the setup of the /etc/named.boot file and look at the
active database by issuing the command kill -2 <PID of named >. A useful command for isolating
and debugging DNS name resolution problems is nslookup.
Instructor Notes:
Purpose — Review potential problems when using DNS as a name server.
Details — Name resolution problems can masquerade as many other problems due to the
messages and symptoms shown. For example, in remote printing you may get a message of
"permission" denied when a client system tries to establish connections to the server. The
authentication file lists a host name, however, what gets passed to the server over the network is
the IP address which then has to be resolved to a host name and then a match sought in the
authentication file. If the match is not exact, you get the "permission denied" message. Also, slow
response on a telnet or ftp session may simply be a DNS lookup timing out due to an improperly
configured /etc/resolv.conf file.
Additional Information — Other useful techniques include:
• using the "-d" option of named to increase the information written to the syslog.
• issuing the "kill -2" to named to cause it to dump its virtual memory zone information.
• using nslookup to query name servers.
Transition Statement — A very useful tool in doing problem determination is the netstat
command. Let's take a look at a few of the uses of netstat. starting with netstat -i
Display Network Interface Information
# netstat -in
Name Mtu
lo0
lo0
lo0
en1
en1
tr1
tr1
Figure
Network
16896 Link#1
16896 127
16896 ::1
1500 link#2
1500 9.19.109
1492 link#3
1492 9.19.112
Address
127.0.0.1
2.60.8c.2f.b5.a5
9.19.109.4
10.0.5a.a8.3a.1f
9.19.112.7
Ipkts
lerrs
178
0
178
0
178
0
1768 0
1768 0
75039 0
75039 0
Opkts Oerrs Coll
180
180
180
1861
1861
8854
8854
0
0
0
0
0
0
0
0
0
0
0
0
0
0
9-13. Display Network Interface Information
Notes:
The interface display format provides a table of cumulative statistics for input and output errors and
collisions as well as total packets transferred. It also shows the interface name (if name resolution
is being used) and address along with the network address and hardware address of the related
adapter. Another important value listed on this report is the maximum transmission unit (mtu) for
the interface. This is the largest size packet this interface will handle.
Note: The collision count for Ethernet is not supported under AlX.
If the Oerrs column is greater than 1 % of Opkts, the send queue size for that interface may need
to be increased. If lerrs is greater than 1% of Ipkts, then memory may be a problem.
The transmit queue size can be changed via SMIT or the chdev command. The mtu size can be
changed by the ifconfig or chdev commands or through SMIT.
Instructor Notes:
Purpose — Describe the use of netstat -i.
Details — Input errors (Ierrs) can be caused by malformed packets (damaged by electrical problems)
bad checksums (may indicate a host has a network interface problem and is sending
corrupted packets, or cable is damaged)
insufficient buffer space in device driver.
Output errors (Oerrs) can be caused by a fault in the local host connection to the network
prolonged collisions These errors
should be investigated.
When operating through a bridge, the default value of 1500 for Ethernet mtu should be changed to
1492. The maximum mtu size for 4mbps token-ring is 4096, for 16 mbps it is 17,792, and for
Ethernet it is 1500 bytes.
To change the transmit queue through SMIT you need to change the communication device
(adapter) itself. The fastpath is SMIT chgtok.
The chdev command syntax is:
chdev -I <adpter_name> -a xmt_que_size = < new value >
Additional Information — Many of the netstat commands we will be covering have counters that
are cumulative. There is an undocumented option that will reset these counters for better analysis.
That option is the -Z option.
Another useful option to netstat is "-a" which produces a list of active connections and open ports.
Transition Statement — As you may recall, netstat -r displays the kernel routing table.
Display Routing Table
# netstat -rn
Routing tables
Destination Gateway
Flags Refs Use
Route Tree for Protocol Family 2 (Internet):
default
9.19.98.1 UG 2 1931
9.19.98/24
9.19.98.2 U
2 1931
127/8
127.0.0.1 U
0 184
if
tr1
tr1
lo0
Route Tree for Protocol Family 24 (Internet v6):
::1
::1
UH 0 0
lo0
Figure
PMTU Exp Groups
-
-
16896 -
9-14. Display Routing Table
Notes:
The netstat -r command displays the kernel routing table. It shows the destination, either
network or host, the gateway used in forwarding packets, and the status of the route as indicated
by the "Flags" column. Flags are:
U
H
G
D
M
Up
Route is to a host rather than a network
Route is to a gateway
Route was created dynamically by a redirect
Route was modified by a redirect
The "Refs" column shows the current number of active uses of the route.
The "Use" column gives a count of the number of packets sent using that route.
The "Interface" column identifies the network interface being used for the specified route.
Instructor Notes:
Purpose — Review the output of the netstat -rn command.
Details — The netstat -r command shows the routes listed in the kernel routing table. With the
addition of the -n option, the routes are shown by the IP address. If the -n option is not used, the
IP address will be resolved to a host name, if possible. If there is a problem with name resolution
the output could look right but in reality the wrong IP address is being referenced. Thus, it is
usually a good idea to include the -n option when using this command in troubleshooting problems.
The "Refs" column shows the current number of active uses for the route. Connectionoriented protocols hold onto a single route for the duration of the connection whereas
connectionless protocols obtain a route each time they send something, even to the same
destination. Thus, depending on the type of network activity on a system, this number could
fluctuate or stay relatively constant.
Transition Statement — netstat can be used to monitor activity on a specific interface.
Monitor State of an Interface
# netstat -I tr1 2
input
packets
75048
1
0
0
0
0
0
0
0
0
Figure
(tri)
errs
0
0
0
0
0
0
0
0
0
0
packets
2818
0
0
0
0
0
0
0
0
0
output
errs
0
0
0
0
0
0
0
0
0
0
colls
0
0
0
0
0
0
0
0
0
0
input
packets
795963
6
7
4
5
9
3
7
6
4
errs
0
0
0
0
0
0
0
0
0
0
(Total)
packets
11855
0
0
0
0
0
0
0
0
0
output
errs
0
0
0
0
0
0
0
0
0
0
colls
0
0
0
0
0
0
0
0
0
0
9-15. Monitor State of an Interface
Notes:
The netstat -I <network interface> <interval> displays the state of the configured interface as it
is being monitored for traffic across that interface. The interval variable displays how frequently to
display the information. It shows both input and output traffic along with errors and collisions.
Instructor Notes:
Purpose — To show how to use netstat to monitor network traffic on an interface.
Details — The output information is similar to that provided by netstat -i however netstat -i shows
a summary of statistics for all interfaces on a system, whereas netstat -I shows the activity as it is
occurring on a specific interface.
Transition Statement — netstat can also be used to show device driver statistics.
Display Device Driver Statistics
# netstat -v
TOKEN-RING STATISTICS (tok1):
Device Type: Token-Ring High-Performance Adapter (8fc8)
Hardware Address: 10:00:5a:a8:3a:1 f
Elapsed Time: 7 days 22 hours 56 minutes 6 seconds
Figure
Transmit Statistics:
Receive Statistics:
Packets: 2817
Bytes: 2702128
Interrupts: 2784
Transmit Errors: 0
Packets Dropped: 0
Max Packets on S/W Transmit Queue: 10
S/W Transmit Queue Overflow: 0
Current S/W+H/W Transmit Queue Length:
Packets: 75045
Bytes: 7077104
Interrupts: 75038
Receive Errors: 0
Packets Dropped: 0
Bad Packets: 0
9-16. Display Device Driver Statistics
Notes:
The output from netstat -v shows the statistics about each device driver being used.
The important information that can be obtained from this command is if there is any value in the
S/W Transmit Queue Overflow which would indicate a need for a larger transmit queue size. To
increase the transmit queue use SMIT on the chdev command. Before making the change be
sure to bring down the interface. This can be done with the ifconfig <interface> down
command. Once the change has been made, bring it back up.
The output shown above is only a portion of the output generated with this command.
Instructor Notes:
Purpose — Show the use of netstat to see device driver statistics.
Details — The device driver has buffers built into it to handle bursts of network traffic. These
buffers are used to queue up transmit and receive requests on the network waiting for handling by
IP (on the receive side) and the device (on the transmit side). If you have more traffic than the
buffers can handle, packets will get dropped. The size of the transmit queue is configurable. On
ISA and MCA Ethernet adapters, the transmit queue size is configurable from 20 - 150. On the
ISA token-ring the value ranges from 96-160 and on the MCA token-ring the value ranges from
32-160. If the "Max Packets on S/W Transmit Queue" gets close to the configured size, you may
need to increase the number of queues.
Values in the Transmit Errors and Receive Errors fields could indicate a hardware problem.
Looking further at the General Statistics (not shown on the visual) can give some indication if the
problem is hardware related on this machine or on the network (Line Errors).
Additional Information — It is also possible to get the same information with the entstat,
tokstat, fddistat and and atmstat commands.
Transition Statement — The next useful option with netstat is the one that displays memory
information.
Display Network Memory Usage
#netstat -m
27 mbufs in use:
16 mbuf cluster pages in use
70 Kbytes allocated to mbufs
0 requests for mbufs denied
0 calls to protocol drain routines
Figure
9-17. Display Network Memory Usage
Notes:
The key piece of information in the output from this command is requests for mbufs denied. If
this value is greater than 0 it is because the system cannot provide any more memory for
network activity. Increase the value of "thewall".
Instructor Notes:
Purpose — To show where to look for memory problems with the the netstat -m command.
Details — The output on this visual is by no means complete. It only shows the first part of the
output which holds the information regarding memory denied. This is the most critical piece of
information. The rest of the output lists kernel malloc statistics which has less information for
students at this stage of the game.
Transition Statement — The last option we will look at with netstat is the one that will show the
number of transmitted, received, and dropped packets.
Display Dropped Packets
# netstat -D
Source
Ipkts
Opkts
Idrops
Odrops
ent dev0
0
0
0
0
tok_dev0
36356
252
0
0
Device Total
36356
252
0
0
ent_dd0
tok_dd0
0
36356
0
252
0
0
0
0
Drivers Total
36356
252
0
0
.
.
.
Figure
9-18. Display Dropped Packets
Notes:
The -D option of netstat displays the number of packets received (Ipkts), transmitted (Opkts) and
dropped (Idrops, Odrops) in the communications subsystem.
The important information seen here are the dropped packets particularly with the device drivers
(dd). If packets are being dropped at the device driver you may want to increase the queue size
on the device driver.
Instructor Notes:
Purpose — Show important information from the netstat -D command.
Details — The output from netstat -D includes more than what is shown. The important area
of discussion is dropped packets on the device driver. Other information included in the output
of this command relates to transmitted, received, and dropped packets for the daemons,
protocols, network interface and NFS. Whenever a value does not apply an N/A is listed in the
output.
Transition Statement — If you are still unable to isolate the problem using the previously
covered commands, a trace of network activity may be needed. The iptrace daemon can be
used to do this.
Trace Packets with the iptrace Daemon
• Records internet packets received from configured
interfaces
• Can be started as a command or under control of
SRC
• Can be stopped either with the kill or stopsrc
command
• Binary output sent to logfile specified at startup
• ipreport command used to format the trace file for
viewing
Figure
9-19. Trace Packets With the iptrace Daemon
Notes:
The iptrace daemon records Internet packets received from configured interfaces. The
options provide a filter so the daemon only traces those packets meeting the filtering criteria.
Packets are traced only between the local host on which the iptrace daemon is invoked and
the remote hosts unless promiscuous mode is specified.
Output will be logged to the file named with the command. The ipreport command is then used to
format the file for review.
The trace facility can be started by either executing iptrace as a command or by starting the
daemon using startsrc -s iptrace. In order to stop iptrace, if it was started as a command then
use the kill command. If it was started as a daemon use stopsrc -s iptrace.
Instructor Notes:
Purpose — Discuss the use of iptrace to trace network traffic.
Details — Sometimes the only way to determine what is happening on a network is to run a
trace. In addition, this is a valuable way to view how protocols work together.
The trace will capture a lot of information as trace captures traffic coming in and going out a
particular port. It does not capture all traffic on the network unless promiscuous mode is specified.
The trace logs the collected information into the file specified when starting the trace. This file
grows rapidly. Because of this, you will want to specify as many parameters as possible to
prevent the capture of unwanted information.
Transition Statement — iptrace has a variety of parameters that can be used to filter out
unwanted information in order to focus on a specific activity. Let's see what some of these are.
iptrace Examples
# iptrace -b -d sys4 -s sys3 /tmp/telnet.trace
# startsrc -s iptrace -a "-i en0 /home/team01/iptrace.log"
# iptrace -e /tmp/iptrace.log
Figure
9-20. iptrace Examples
Notes:
The first example starts iptrace as a command and says to trace all activity destined to interface
sys4 from interface sys3 in both directions and put the output in /tmp/telnet.trace. The second
example says to trace all activity on the en0 interface placing the output in /home/team01
/iptrace.log.
The third example starts iptrace in promiscuous mode. This allows the iptrace daemon to record
all packets on the attached network. The -d option records packets headed for the destination
host; -s records packets coming from the source network interface; and the -b indicates to record
traffic in both directions, coming and going. Additional options that can be used include :
-a
do not include ARP packets
-i
specifies an interface
-P
specifies a protocol like TCP or IP
-p
specifies a port like telnet or ftp (or a port number can be used)
-e
specifies to trace packets in promiscuous mode (all traffic on the network the
interface can see)
Instructor Notes:
Purpose — Show examples of using the options with iptrace to specify what
information is needed.
Details — There is an undocumented option of iptrace that will allow it to run in the foreground,
thus making it easier to stop when you are finished gathering the data. Use iptrace -t with the
other options you need for data collection in order to run it in the foreground.
Additional Information — When gathering information about a problem it is always good to
check the system error log to see if any error against the facilities you are using have been
logged. A complete discussion of error logging is outside the scope of this course. However, if
students ask, the error information can be accessed via the SMIT fastpath smit errpt or the
command: errpt -a.
Promiscuous mode tracing works only if the network adpater supports it. Most Ethernet cards
do but many Token-Ring cards do not.
Transition Statement — All the data captured in the world does no good if it can't be read. The
ipreport command is used to convert the binary information captured by iptrace into human
readable form. Let's see how this works.
View a Trace Report
# ipreport -n -s /tmp/telnet.trace > /tmp/report1
# pg /tmp/report1
Packet Number 25
TOK: ===( 66 bytes transmitted on interface tr1 )==== 12:59:09.031174400
TOK: 802.5 packet
TOK: 802.5 MAC header:
TOK: access control field = 0, frame control field = 40
TOK: [ src = 10:00:5a:a8:3a:1f, dst = 10:00:5a:c9:38:3dJ
TOK: 802.2 LLC header
TOK: dsap aa, ssap aa, Ctrl 3, proto 0:0:0, type 800 (IP)
IP:
<SRC= 9.19.109.4 >
IP:
<DST = 9.19.111.2 >
IP:
ip_v=4, ip_hl=20, ip_tos=0, ip_len=44, ip„id=15770, ip_off=0
IP:
ip_ttl=60, ip_sum=5306, ip_p = 6 (TCP)
TCP:
<source port=1064, destination port=23(te!net) >
TCP:
th_seq=987b2601, th_ack=0
TCP:
th_off=6, flags<SYN>
TCP:
th_win=16384, th_sum=a746, th_urp=0
TCP: 00000000
020405ac
I. . . .
Figure
9-21. View a Trace Report
Notes:
ipreport generates a trace report from a specified trace file originally created by the
iptrace daemon into human-readable form. The iptrace daemon must be stopped
before the ipreport command can be executed.
There are several options that can be used with ipreport. The more commonly used are:
-n
Show the packet number at the top of the packet output.
-s
Show the protocol to which the information relates at the beginning of each
line of output
-e
Generate the report in EBCDIC format. (The default is ASCII.)
Instructor Notes:
Purpose — Discuss the formatting of the trace collected by iptrace.
Details — The iptrace daemon must be stopped before the ipreport command can be
successfully run. ipreport reads the binary packet information and formats it based on the options
supplied with the command.
Tell your students that the key to reading this information is to be able to focus on the valuable
information and ignore the rest. Some hints that may help:
• If using Xwindows, make a large window on the screen to see the whole packet on one screen.
• Notice the packet number and whether it is coming in or going out the interface.
• Notice which interface is involved.
• Look for the hardware and IP addresses involved along with the source and target to see who
is involved in the conversation represented by the packet.
• Look to see what the packet is doing, either by the protocol and port involved or what is shown
in the data field. It helps to know what was being executed across the network during the
trace to correlate it to the activity seen in the formatted packet.
The visual shows an example of a single packet. It will be very helpful to students to go over
some of the more critical information provided in this packet. If you have a data projector
connected to a terminal in the classroom, you may wish to do a brief iptrace session for arp or
ping and then show the output of ipreport on the screen.
If you use the packet shown on the previous page be sure to point out :
• The src and dst hardware address shown under the TOK protocol
• The SRC and DST ip addresses shown under the IP protocol
• The ip_ttl of 60 seconds in the IP protocol
• The source port and destination port in the TCP protocol
• The th_seq number, flags, and th_win in the TCP protocol
This packet shows the beginning of a telnet session where the source is attempting to set up a
TCP connection with the destination by sending the SYN.
This packet has no readable data in it as it is the beginning of the three-way handshake
to start a telnet session.
Transition Statement — Let's consider another tool for tracing packets.
tcpdump
•Alternative IP packet tracing tool to iptrace
• Interactive and more convenient
• Less comprehensive output
•Writes trace to standard output ~ formatted or hex
• Sophisticated filtering
Figure
9-22. tcpdump
Notes:
A packet tracing tool found on many different UNIX systems is tcpdump. It operates in an
interactive mode which makes it more convenient to use for brief diagnostic sessions. However,
its output is not as comprehensive and detailed as iptrace's. Rather than writing to a trace file which
must then be formatted, tcpdump writes it output directly to standard output. In the default output
format, the most salient packet fields are displayed, although it's also possible to get a complete
hex dump of each packet.
A sophisticated set of filters is available in tcpdump, to allow tracing a subset of the information
flowing on a network. It's possible for example to filter by host name, address and port number.
Instructor Notes:
Purpose — Explain the purpose of tcpdump and position it relataive to iptrace.
Details — While iptrace is an AlX unique tool, tcpdump is found on virtually every UNIX. It was
originally developed by Van Jacobson, who was also responsible for VJ header compression,
traceroute and the current form of the TCP exponential backoff algorithm.
The tcpdump tool can provide a great deal of information about the packets flowing on a network,
but it does not display as much as iptrace can. This is especially true of the link-layer headers
which tcpdump largely ignores.
While iptrace is the kind of tool to use when you (or perhaps IBM service) need to know everything
that is happening on the network, tcpdump is better when you need only to trace a small number of
packets and only need to know the most salient features such as TCP sequence numbers,
windows, port numbers and protocols. Also the fact that tcpdump writes directly to standard output
in a simple format makes it easier to use.
Note however that it's possible to collect complete packets with tcpdump and to display them in
hex dump format. In addition, a great deal of serious performance research and network analysis
has been done with tcpdump, as it is the de facto standard tracing tool in the UNIX world.
Transition Statement — Let's look at some examples of using tcpdump.
tcpdump Examples
Figure
•
tcpdump -N -I -i en0
•
tcpdump -x -l
•
tcpdump -I -s 1000 ip host 9.180.107.61
•
tcpdump -n -i tr0 proto icmp
9-23. tcpdump Examples
Notes:
This chart shows several examples of using tcpdump:
• tcpdump -N -I -i en0
This traces all packets visible on interface en0 (-i en0), displaying host names
with only the first part of the domain name (- N) (e.g. display sysl .ibm.com as
sys1). It also writes its output in real time, without buffering (- I), an option that
is usually desirable.
• tcpdump -x -I
This displays packets in hex format. Because an interface is not specified, the
first active one is chosen.
• tcpdump -I -s 1000 ip host 9.180.107.61
This displays packets visible on the default interface, but only those to or from
the host 9.180.107.61. It also captures the first 1000 bytes of each packet (-s
1000), an option that is desirable when information is needed beyond the first
80 bytes of each packet.
• tcpdump -n -i tr0 ip proto icmp
Trace ICMP packets only. Hosts are identified by address and not name.
Instructor Notes:
Purpose — Show the students how to use tcpdump by example.
Details — Here are some additional features of tcpdump:
• It's possible to write the raw packet trace to a file, e.g. 'tcpdump -wTracefile'. This can later be
formatted using tcpdump, for example with the command ´tcpdump -N -rTracefile´.
• Direction of flow can be specified in filter expressions, for example 'tcpdump -I dst host fred'
collects only those packets destined for the host fred, while 'tcpdump -I src host fred' collects
those from fred.
• Complex logic can be specified with tcpdump filter expressions, including 'and', 'or' and 'not'.
• It's possible to test arbitrary packet fields with filter expressions, using the syntax:
proto [ expr : size ]
Here 'proto' can be ip, arp, rarp, tcp or icmp. 'expr' gives an offset into the protocol's portion of
the packet and 'size' a length for comparison. For example:
tcpdump \(icmp[0] !=8 and icmp[0] !=0\) eliminates
ICMP Echo and Echo Reply packets.
Additional Information — It is important to specify the -I option to ensure that the trace
information is written to the screen in real time. Without this option, the trace output is buffered,
sometimes for a significant period of time. The tcpdump command normally runs in promiscuous
mode if the adapter supports it. In some cases, the -p flag can turn off promiscuous mode, but the
normal way to select the desired trace output is to use filter expressions such as those shown in
the last two examples in the chart.
Transition Statement — Now let's see an example of tcpdump's output.
Instructor Notes:
Purpose — Show an example of tcpdump output and explain the important features.
Details — The format of tcpdump output varies considerably depending on the type of packets
being displayed. The portion up to the first colon is common since it is primarily IP-level
information. After that, the format shows whatever is appropriate for the type of packet. Thus for
DNS packets, the information includes the name queried and the number of answer, name server
and authority records in the packet. For ICMP packets, the type of ICMP request is displayed
along with details appropriate to that request type. The best way to see the possibilities is to let
tcpdump run for a while on a network and look at the various types of packets collected. For this
purpose, an Ethernet interface is useful since they are normally promiscous.
In many cases, it's necessary to use the '-s' option to get a good idea of the contents of the packet.
For example, with DNS packets, the default packet capture size will not be large en0ugh to include
the name being queried, but with (e.g.) '-s 300' en0ugh will be captured for tcpdump to give a
complete display.
Transition Statement — To see how some of these tools can be used in solving a problem,
let's take a look at what steps you might take to isolate a communication problem.
Sample Problem Scenario
135.9.19.5
201.64.23.8
201.64.23.9
5.10.10.3
135.9.19.7
Subnet Mask =
255.255.0.0
Subnet Mask =
255.0.0.0
Figure
201.64.23.10
Subnet mask =
255.255.255.0
9-25. Sample Problem Scenario
Notes:
Let's assume that sys5 can telnet to sys8 on network 201.64.23 but not to sys10.
The ping test of the host name sys10 came back with the following message:
ping: host name sys10 NOT FOUND
The ping test of the ip address for sys10, 201.64.23.10 resulted in:
PING 201.64.23.10 (201.64.23.10): 56 data bytes
The result of the netstat -rn command on sys5 showed the following:
Route Tree for Protocol Family 2 :
default
135.9.19.4 UG 2 3450 tr0
201.64.23 135.9.19.6 UG 2 2794 tr0
135.9
135.9.19.5 U
2 2759 tr0
The result of the netstat -rn command on sys10 showed the following:
Route Tree for Protocol Family 2:
135.9.19.4
201.64.23
201.64.23.6 UGH
201.64.23.10 U
0 0 tr0
0 0 tr0
/etc/resolv.conf does not exist on either system. However, a review of the /etc/hosts file on
sys5 shows no entry for sys10. A review of the /etc/hosts file on sys10 shows an entry for sys5.
Given the above information, where do you think the problem(s) lie?
Instructor Notes:
Purpose — To provide a simple problem scenario so students can see how some of the
commands can be used to isolate a problem.
Details — The visual shows three networks with two routers. The problem and the results of
several commands are outlined in the student notes. Step through the output of these commands
with the students soliciting their comments along the way as to what they think the problem is. In
reality, there are two problems. One is the fact that sys10 is not in the /etc/hosts file on sys5. The
other is the way routing is set up on sys10. Ask students what was it that really got in the way of
completing a telnet session. Was it the routing or name resolution? It really is the routing.
Transition Statement — Let's review some items with the checkpoint questions.
Checkpoint
Exercise — Troubleshooting
1.
Name the two commands that can be used on a AIX System to
display the characteristics of a network interface.
— Correct Answer
1.
Isattr
ifconfig
2.
Which command below lists configuration information for a Token-Ring
network adapter on the AIX including the vital product data?
a.
b.
c.
d.
lsdev -C -c tok0
lscfg
lscfg -v -I tok0
Isattr -E -I tok0
— Correct Answer ------------------------------------------------------------------2.
3.
c
Which two commands below are the most commonly used and most
useful commands for doing problem determination on a network?
a.
b.
c.
d.
arp and host
ping and nfsstat
ping and netstat
spray and no
— Correct Answer ------------------------------------------------------------------------3.
c
4.
If you want to monitor network traffic across an interface, what
command would you use?
a.
b.
c.
d.
netstat -s
netstat -i
netstat -l
netstat -m
— Correct Answer ------------------------------------------------------------------------4.
5.
c
How do you find out the Token-Ring speed for tok0?
a.
b.
c.
Isattr -E -I tok0
Isdev -C -c adapter
ifconfig tok0
— Correct Answer --------------------------------------------------------5.
a
TF
6.
The iptrace tool is found in many versions of UNIX, while tcpdump
is unique to AlX.
— Correct Answer ------------------------------------------------------------------------6.
False
Unit Summary
• When debugging a network it is always a good idea to
work from a picture of the network
• A good methodology to use for problem determination is to
work with the layering model of TCP/IP from the bottom up
• Commands that can be used to document the system and
network include Isdev, Iscfg, Isattr, ifconfig, ping -R, no
• Commands that are useful to diagnose TCP/IP problems are:
ping, netstat, iptrace, tcpdump
Figure
Notes:
9-26. Unit Summary