1
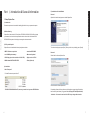
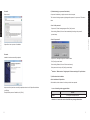
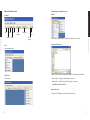
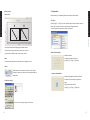
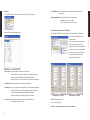
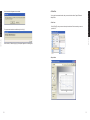
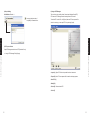
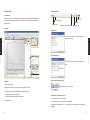
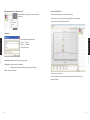
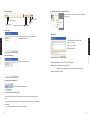
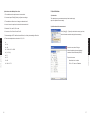
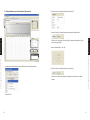
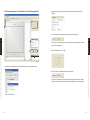
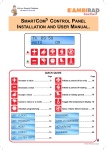
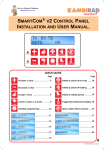
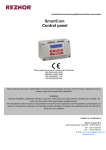
User's Guide
For PC Interface software OptizenView 4.2
Feb 2011 (2st edition)
Mecasys Co., Ltd.
Notice!
Spectrophotometer Optizen® and Software OptizenView™ are
trademarks of Mecasys Co., Ltd.
No part of the Optizen Series, including this publication
may be reproduced, or modified in any form or by any means
without the prior written permission of Mecasys Co., Ltd.
For more detail information on Optizen® and OptizenView™,
you may refer to “Technical Support”
in the last Chapter of this guide or visit our websites below.
http://english.mecasys.co.kr
Contents
PartⅠ. Introduction & General Information
1. Setup OptizenView
2. Survey Scan
6
1) Introduction
6
2) Before Starting
6
3) PC System Required
6
4) Installation
6
5) Installation with Install Wizard
7
6) Troubleshooting (on process of installation)
9
7) Confirmation after installation
9
2. Menu And Basic Control
10
1) Toolbox
10
2) File Management And Mode Selection
11
3) Common Function Keys And Input Windows
13
4) Chart Control
14
3. Configuration
15
1) Cell Type
15
2) Options
16
3) Calibration (Only applied in OPTIZEN 3220UV)
17
4. Print Out
19
PartⅡ. OptizenView Usage
26
1) Introduction
26
2) Display
26
3) Measure
26
4) Graph Setting
27
5) Managing data value from Measurement
28
6) Draw STC at SUR mode
29
3. Simple Kinetic
31
1) Introduction
31
2) Display
31
3) Measure
31
4) Graph Setting
32
5) Managing data value from Measurement
33
4. Multiple Wave Scan
34
1) Introduction
34
2) Display
35
3) Measure
35
4) Attentions while Multiple Wave Scan
36
5. Quick Guideline
37
1) Introduction
37
2) Confirmation before measurement
37
21
5-1. Simple Absorbance(or Transmittance) Measurement
38
1) Introduction
21
5-2. Measuring Concentration using Standard Curve
40
2) Display
21
5-3. Measuring Absorbance (Transmittance) In Specific Wavelength Area
44
3) Measure
21
5-4. Measuring Absorbance (Transmittance) Timely
46
4) Graph Setting
22
5-5. Save and Print Out
48
5) STC open
22
6. Trobleshooting
49
6) Usage of STC Manager
23
7) Attentions while making & modifying STC
25
PartⅢ. Technical Supports
8) Calculating value R in a regression line
25
1. Technical Supports
1. ABS/%T/CONC and Standard Curve
50
5) Installation with Install Wizard
PartⅠ. Introduction & General Information 1. Setup OptizenView
PartⅠ. Introduction & General Information 1. Setup OptizenView
Part Ⅰ. Introduction & General Information
Process1.
OptizenView install wizard prepares to install OptizenView.
1. Setup OptizenView
1) Introduction
Personnel computer can be used with installing OptizenView into your personnel computer.
2) Before Starting
OptizenView is the exclusive S/W for Optizen POP/3220UV/2120UV/2120V/1412V and helps
you measure, check and control experimental results on the real time in Windows-95/98/
NT/2000/XP/Vista system. It also helps you manage the instrument easier.
3) PC System Required
OptizenView can be installed with the required system as below.
• IBM PC Pentium or equivalent
• more than HDD 50MB
• over 256MB system memory
• Mouse and keyboard
• VGA Display (more than resolution of 1024 X 768)
• Higher version of IE 6.0
• MS-Windows 98/NT/2000/XP/VISTA
• Printer (Optional)
To continue install program, press [Next], When you like to stop installing, press [Cancle]
Process2.
Select folder for software OptizenView.
4) Installation
• Start “Setup.exe”
Find and Execute setup.exe at drive E.
Choose folder for software OptizenView.
※Caution : Above shows drive E, however, you must check your own CD-ROM drive.
For updating software for future reference and information, suggest saving files that has
been served by install wizard. ( Suggested folder C:\Program Files\OptizenView4.2 )
※Attention : 4.2 means the version of the S/W. It may change without notice.
6) Troubleshooting (on process of installation)
Start to install.
On process of installation, you might encounter to reboot computer.
PartⅠ. Introduction & General Information 1. Setup OptizenView
PartⅠ. Introduction & General Information 1. Setup OptizenView
Process3.
This incident of rebooting computer might happen after process 2 or on process 5. Proceed as
below.
• Case 1: After process 2
On process 2, ‘Restart’ message appears. Press [Yes] to restart.
After rebooting Windows, Process 3 starts automatically. According to the process 3,
proceeds setup.
• Case 2: On process 5
OptizenView is now on process of installation.
Process4.
Installation has been successfully completed.
On process 5, message box appears to restart as above.
Click [Yes] to proceed ‘restart’.
After rebooting Windows, Process 5 will start continuously.
When process alert to stop, click [Next] to precede setup.
※Attention : “Window restart” might repeat 2-3 times according to PC pecifications.
7) Confirmation after installation
Check installation of OptizenView
After installation, check existence of a directory as below has composed.
All process of setup has been successfully completed, and new icon of OptizenView shall be on
your Display.
• In case of installing at the suggested folder.
address
Complete all the process of installation, click [Finish].
Folder
C:₩Program Files\OptizenView4.2
※Attention : 4.2 means the version of the S/W. It may change without notice.
2) File Management And Mode Selection
1) Toolbox
• New File
New
Save
Open
Print
Save as
• New
STC
manager
Instrument
PartⅠ. Introduction & General Information 2. Menu And Basic Control
PartⅠ. Introduction & General Information 2. Menu And Basic Control
2. Menu And Basic Control
Cell
holder
Basic
Settings
Select measuring mode at [File(F)] → [New(N)], or select [New] icon in tool box..
• Open/Save File (Save as)
Select measuring mode.
• Cell Holder
Select cell type.
Interface of File saving and opening mostly like designed operated same way as Windows.
• Open : [File(F)] → [Open(O)] or select [Open] icon in tool box
• Save : [File(F)] → [Save(S)] or select [Save], [Save as] icon in tool box
※Data files are saved as *.ODF file.
• Export to Excel (E)
Using [Export to Excel(E)], you can save as MS-Excel(*.csv) form.
10
11
3) Common Function Keys And Input Windows
[File(F)] → [Print(P)], or select [print] icon in tool box. You can choose the report form among
On the right side of display of OptizenView, you can see Cell selecting box, message box,
Graph+Table, Graph or Table.
buttons, and box of inputting measuring conditions.
A Select cell : Select the number of cells for measuring.
• Mode selection and File management
Move cursor to left side of display of OptizenView, [New/Open]. And you can see modes
display as below.
B Set measuring condition : Input experiment name and
set measuring condition.
C Measure/Autozero : Measure & Auto Zero buttons.
A Mode select : Select mode for measuring
D Message box : Windows for status of measuring, or
error message.
• Display
: Clicking as left side will show Graph + Table, Graph or Table.
B Folder select : Select folder for data.
Click
C File select : Confirm the saved data, then double
click will open file.
12
13
PartⅠ. Introduction & General Information 2. Menu And Basic Control
PartⅠ. Introduction & General Information 2. Menu And Basic Control
• Print(P)
3. Configuration
• Zoom In/Out
Before measuring for accumulating data, check conditions as shown below..
PartⅠ. Introduction & General Information 3. Configuration
PartⅠ. Introduction & General Information 2. Menu And Basic Control
4) Chart Control
1) Cell Type
Select [Config(C)] → [Cell Type] in menu, cell holder types will show as below. Select cell
holder type, then status of changes in cell holder type will appear as below.
You cannot select some cell types according to instruments.
Use drag and drop will lead display bigger and smaller window.
Drag and drop like ‘A’(right and down) in picture above, zoom out.
Drag and drop like ‘B’(left and up) in picture above, zooms in.
• Multi Cell Holder Mode
Standard cell holder
(8 rotating cell holder) shows as left.
• Move
[Config(C)] → [Cell Type] → [Multi Cell].
Keep pressing the right button of mouse and move the graph as your will.
• Select
Select absorbance or transmittance to show in Y axis of graph.
By selecting, transform into either way for showing absorbance or
transmittance.
• Single Cell Holder Mode
Standard setting applied cell holders like Round
cell holder, Film cell holder and Long path cell
• Chart Color Setting
holder.
Single cell holder shows as left.
[Config(C)] → [Cell Type] → [Single Cell].
Choose color of line figment in graph from color box.
14
15
To set the basic conditions of the instrument, select [Config(C)] → [Options] in menu.
PartⅠ. Introduction & General Information 3. Configuration
PartⅠ. Introduction & General Information 3. Configuration
• %T(ABS) Max/Min : Set minimum/maximum of measured value in absorbance and
2) Options
transmittance.
• Wavelength Max/Min : Select minimum/maximum wavelength range.
wavelength range : 190nm ~ 1100nm
(For 1412, range is from 340nm to 1100 nm)
Select as above, table box appears as below.
3) Calibration (Only applied in OPTIZEN 3220UV)
To calibrate OPTIZEN 3220UV, select [Config(C)] → [Advanced Setting] → [Calibration].
This is to calibrate wavelength and cell
holder positioning.
After manufacturing, on process of quality
control, we, Mecasys, have done all
calibration for correction in wavelength and
cell positioning. You don’t need to calibrate
without special reasons. Please, be aware
that calibration is usually done under
manufacturer’s strict guideline.
• Device Name : In a case of Stand Alone Version, Write “Localhost”
In a case of PC Version, when user has personal computer connected for
measuring with Optizen 3220UV, write [Default: Optizen3220UV]
When using 2120 or 1412, input the name of PC connected to the instrument.
• %T(ABS) Decimal : Set decimal point in absorbance and transmittance.
• D2 Lamp Save : If you use visible light source area mostly, you can save power and lengthen
lifespan of D2 lamp by turning off D2 lamp. However, frequent switching
power of D2 lamp might cause shortening lifespan of D2 lamp.
Attention : D2 lamp is one of expensive part in your instrument.
• Lamp Change : You can set wavelength change point in D2 lamp and W lamp.
wavelength range : 340nm ~ 410nm.
Calibration type : 2 Section
Calibration type : 3 Section
• WP, LP : Wavelength and Lamp
• CP : Cell holder positioning
※Attention : False calibration by user may cause breakdown.
16
17
4. Print Out
PartⅠ. Introduction & General Information 10. Print Out
PartⅠ. Introduction & General Information 3. Configuration
Select item and will appear as shown below.
You can print he measured results, and you can select three forms, Graph, Table and
Graph+Table.
• Print form
Select [Print(P)], and you can see three options as below. Select one and you can see
Pop up process bar and start calibration by click Yes(Y).
preview for it.
After execution, 'Calibration (wp, lp) Is Completed' appeas on a message box.
• Graph form
18
19
1. ABS/%T/CONC and Standard Curve
1) Introduction
This mode is to set Standard Curve at the specific Wavelength to find out Absorbance,
Transmittance and Concentration of samples.
2) Display
B
Part Ⅱ. Optizen View Usage 1. ABS/%T/CONC and Standard Curve
PartⅠ. Introduction & General Information 10. Print Out
Part Ⅱ. OptizenView Usage
• Table/Graph+Table form
A
C
E
D
3) Measure (Multi cell holder Mode)
1. Select cell number(A).
2. Input wavelength, factor, unit and so on to measuring condition (C).
When taking concentration by Standard Curve, Click and select standard curve frame (B).
B Previous page / next page
A Zoom in / out
20
C Starting print
3. Select Auto Zero(D).
4. Select Measure(E), and you can see the measured data on table.
21
4) Graph Setting
6) Usage of STC Manager
Set Min/Max of Y axis - 1
This mode is to make, modify, delete, find and open Standard Curve(STC).
: You can set min/max value of
Y axis(ABS) of Standard Curve.
STCs saved in STC Manager can be shared by several ATC modes.
To transfer STC to other PCs, click [Export] and save STC as a separate file.
And on the contrary, you can open STC file by selecting [Import].
A
B
Part Ⅱ. Optizen View Usage 1. ABS/%T/CONC and Standard Curve
Part Ⅱ. Optizen View Usage 1. ABS/%T/CONC and Standard Curve
5) STC open or Select
Open STC Manager and select one STC (Standard Curve).
※ Usage of STC Manager Refer (23page)
C
D
E
F
• Import (A) : Open STC file that is exported from other instruments.
• Export (B) :Save STC as a separate file for transfer or backup purposes.
• New STC (C)
• Modify (D)
• Delete (E) : Delete selected STC.
• Select (F)
22
23
7) Attentions while making & modifying STC
As selecting New STC(C) or Modify(D), you can see the window as below.
a. No. of Measurement means the number of measuring times of each standard samples.
b. After measuring, if you discard the specific result, click square(left side of A) and then click
Type(H) and Recalc(I).
c. If you use multi cell mode, the number of cell number and row must be the same.
For example, if you put the sample in cell no. 1, 3 and 5, you must input the concentration at
row no. 1, 3 and 5.
d. You can make STC without measuring standard samples. Input ABS at ABS column, and
then click Type(H) and Recalc(I).
Part Ⅱ. Optizen View Usage 1. ABS/%T/CONC and Standard Curve
Part Ⅱ. Optizen View Usage 1. ABS/%T/CONC and Standard Curve
e. We recommend that you make the backup file of STC.data which is in the folder, C:\Program
Files\OptizenView 4.1, since STCs are saved on it.
A
8) Calculating value R in a regression line
C
D
E
B
F
G
H
I
Compensate maximum value of aberration and compute accurate value, an equation known
as Pearson’R equation used when a linear line going through Zero point. And other linear line
takes method of ordinary least square.
• Pearson’ R
1. Input name of this STC. (B)
2. Input wavelength. (C)
3. Input measuring times. (D)
4. Set unit. (E)
5. Input the concentration of the standard sample. (A)
6. Press AutoZero. (F)
7. Press Measure to get the ABS value. (G)
When, X = Concentration
Y = Absorbance
• Method of Ordinary Least Square
8. After measuring, click Type(H) and Recalc(I) to get the proper STC.
9. Click [Apply] to save at STC manager.
When, Y = Extended coefficient in slope of Selection Curve
Y = Average
24
25
2. Survey Scan
4) Graph Setting(E)
1) Introduction
Survey scan allows you to have data with selected cell measured in selected wavelength range.
After tested and measured absorbance and transmittance, test results will be shown as below
table and graph.
1 Set Range
2) Display
6 Arrows
2 Set Peak / Valley
5 Cursor
Absorbance / Transmittance 3
4 Peak / Valley
• Set Range (1)
Set min/max wavelength (y-axis) and absorbance or
A
transmittance (x-axis).
Part Ⅱ. Optizen View Usage 2. Survey Scan
Part Ⅱ. Optizen View Usage 2. Survey Scan
E
F
• Set Peak/Valley (2)
B
This is to set the condition of auto detecting of peak/
valley.
D
3) Measure
C
• Absorbance / Transmittance (3)
1. Select cell number(A).
Select absorbance or transmittance.
2. Input Name, Start wave., End wave, Step, Scan speed and so on(B).
3. First, blank must be scanned with selected condition as order (2).
Click Baseline[C] for setting up for blank.
After setting up with blank, all cleared to measure.
4. Click Measure(D).
• Peak/Valley, Cursor, Arrows (4,5,6)
Click Peak/Valley[4] to find Peak/Valley.
In Peak/Valley box, click Cursor[5] will show absorbance
(transmittance) and wavelength. ← / → table arrows[6] can search before or next peak/valley
Managing.
26
27
5) Managing data value from Measurement (F)
Measured data (F), click right side of mouse will lead to be
shown as left.
6) Draw STC at SUR mode
1. Make the scanning spectrum of standard samples orderly.
2. After measuring, click Cursor(5) to check the ABS values of each wavelengths.
3. Place the Cursor at the wavelength to draw STC.
• Manipulate
Part Ⅱ. Optizen View Usage 2. Survey Scan
Part Ⅱ. Optizen View Usage 2. Survey Scan
You can Manipulate the measured data.
- Graph (+,-,*,/) Graph
- Graph (+,-,*,/) Constant
- Differentiate of graph.
• Show only this chart : You can see the only selected graph.
• Change title : Change the name of selected data.
Changing name of selected data will lead some changes in title of table.
• Delete : Delete measured data.
4. Click to proceed to STC mode.
5. At the concentration column, meaningless values are written. Please input the correct
concentration values.
28
29
3. Simple Kinetic
1) Introduction
Simple kinetic allows mutation or variation of samples in time interval at selected wavelength.
Test results will be shown as below table and graph.
2) Display
E
A
6. After input the concentration, click [Make STC] to draw STC. Refer to – Attentions while
Part Ⅱ. Optizen View Usage 3. Simple Kinetic
Part Ⅱ. Optizen View Usage 2. Survey Scan
F
B
making & modifying STC – for other settings.
7. Click [Apply] to save at STC manager.
D
8. Import the STC at the ATC mode to measure the concentration of unknown samples.
C
3) Measure
1. Select cell number(A).
2. Input Name, Wavelength, Total time, Interval, and so on(B).
3. Click Autozero(C).
4. Click Measure(D). And you will get the results at graph and table in real time.
30
31
4) Graph Setting(E)
5) Managing data value from Measurement (F)
Measured data (F), click right side of mouse will lead to be
shown as left.
6 Arrows Table
2 Set Activity Range
1 Set Range
5 Cursor
Absorbance / Transmittance 3
4 Activity
• Set Range (1)
Y-axis shows transmittance or absorbance. Set
• Manipulate
Part Ⅱ. Optizen View Usage 3. Simple Kinetic
Part Ⅱ. Optizen View Usage 3. Simple Kinetic
Minimum and maximum.
You can Manipulate the measured data.
- Graph (+,-,*,/) Graph
- Graph (+,-,*,/) Constant
- Differentiate of graph.
• Set Activity Range (2)
Set interval in time for activity.
• Show only this chart : You can see the only selected graph.
• Change title : Change the name of selected data.
Changing name of selected data will lead some changes in title of table.
• Delete : Delete measured data.
• Absorbance / Transmittance (3)
Select absorbance or transmittance.
• Activity, Cursor,Arrows Table (4,5,6)
Click Activity will show interval in time and value will be shown on the right-upper part as a
table.
Click Cursor [5] leads displaying value of absorbance [transmittance], testing time, and testing
wavelength.
← / → Arrows Table [6] leads before or next value in a table.
32
33
4. Multiple Wave Scan
2) Display
1) Introduction
This mode is to measure absorbances and calculate with preset equations at multi wavelength.
A
• Terminology
Name
Description
Wavelengths to be measured.
Factor List
Factors to be used in equation.
STC List
STCs to be used in equation.
C1, C2, C3
Calculated results
E
B
An : (n=1~8) The ABS of No. n wavelength at Wave List.
If Wave List is 500; 600,
A1 = ABS of 500 nm
A2 = ABS of 600 nm
Variables
Part Ⅱ. Optizen View Usage 4. Multiple Wave Scan
Part Ⅱ. Optizen View Usage 4. Multiple Wave Scan
Wave List
D
C
Fn : (n=1~8) The Factor of No. n (kinds of a constant).
If Factor List is 3; 5; 1.9,
F1 = 3
F2 = 5
F3 = 1.9
Sn : (n=1~8) The calculated result of An by No. n STC
If Wave List is 500; 600, and
If STC List is STC_A; STC_B,
S1 = the result that input ABS of 500 nm to STC_A
S2 = the result that input ABS of 600 nm to STC_B
3) Measure
1. Select Cell(A).
2. Input Name, Wave List, Factor List, STC List, C1, C2, C3 and do on(B).
3. Click and perform Base Line(C).
4. Click Measure(D), and you will get the results at table.
34
35
4) Attentions while Multiple Wave Scan
5. Quick Guideline
1. The variables used in equations are not case-sensitive.
1) Introduction
2. You cannot input at Table(E) directly. It will just show settings.
This chapter shows you measurement steps of each mode step by
3. The variables not defined or out of range are determined as 0.
step to use OptizenView more easily.
4. In case of errors in equations, the value will be determined as 0.
5. Calculate C1 first, and C2, C3 in order.
2) Confirmation before measurement
6. You can use C1 at C2 and C1 and C2 at C3.
Click [Config(C)] → [Options] to check device name, type of cell,
7. If the wavelengths of STC and Wave list are different, it will obey the wavelength of Wave list.
device information and other settings before measuring.
Part Ⅱ. Optizen View Usage 5. Quick Guideline
Part Ⅱ. Optizen View Usage 4. Multiple Wave Scan
8. These are examples that can be used at C1, C2, C3.
A1
A1 * A2
A1 + A2
Set device name, select Cell type.
A1 * 1.234 + A2 * 3.141592
And set the display option and minimum/
A1 * ( A2 * A3 )
maximum of measured value (ABS/%T).
A1 * F1
A1 * F2
36
Ex) set device name
S1 + S2
Stand Alone Ver : localhost
A3 * A2 + S1 * F3
PC Ver : PC name or IP address
37
5-1. Simple Absorbance(or Transmittance) Measurement
2. Input name of test, wavelength, Distillation factor and unit.(C)
B
A
3. Click Auto Zero(D) to correspond the light intensity between Sample & Blank.
Part Ⅱ. Optizen View Usage 5-1. Simpel Absorbance(or Transmittance) Measurement
Part Ⅱ. Optizen View Usage 5-1. Simpel Absorbance(or Transmittance) Measurement
While Auto Zero is executing, “Executing Auto Zero” appears on Message Box(F), after
C
execution “Ready” appears.
4. Select Cell Number(CELL 1-No. 1)(B).
E
D
F
1. Locate Mouse point New/Open(A) left side, and Mode selections will appear as shown.
5. After Cell selection, Click Measure(E) to start measurement.
While execution, “Measuring” appears on Message Box, and after execution “Ready”
appears.
Double click ATC.
38
39
5-2. Measuring Concentration using Standard Curve
2. Input name of test, wavelength, Distillation factor and unit.(D)
C
B
A
3. Pop up Standard Curve window by click Make STC(B) upper right side of graph.
Part Ⅱ. Optizen View Usage 5-2. Measuring Concentration using Standard Curve
Part Ⅱ. Optizen View Usage 5-2. Measuring Concentration using Standard Curve
D
B
E
F
G
1. Locate Mouse point New/Open(A) left side, and mode selections will appear as shown.
Double click ATC .
40
41
4. Make STC.
6. Select Cell Number(CELL 1-No. 1)(B).
7. After Cell selection, Click Measure(F) to start measurement.
Part Ⅱ. Optizen View Usage 5-2. Measuring Concentration using Standard Curve
Part Ⅱ. Optizen View Usage 5-2. Measuring Concentration using Standard Curve
While execution, “Measuring” appears on Message Box(G), and after execution “Ready”
appears on a message box and measured value will be displayed as a table and a graph.
a. Input sample’s concentration orderly from number 1.(Cell number 1 – Number 1)
b. Click Auto Zero.
c. Click Measure to start measurement.
d. When tests are done, absorbance value and data result appeared as graph.
e. Select Recalc, and click Apply to use framed graph into ATC.
5. Click Auto Zero(E) to correspond the light intensity between Sample & Blank.
While Auto Zero is executing, “Executing Auto Zero” appears on Message Box(G), after
execution “Ready” appears.
42
43
5-3. Measuring Absorbance (Transmittance) In Specific Wavelength Area
2. Input/select Name of Test, Start wavelength, finish point wavelength, Step and Scan
Speed(C).
B
A
3. First and before measuring samples, click Base Line(D) for setting blank.
Part Ⅱ. Optizen View Usage 5-3. Measuring Absorbance (Transmittance) In Specific Wavelength Area
Part Ⅱ. Optizen View Usage 5-3. Measuring Absorbance (Transmittance) In Specific Wavelength Area
C
While execution, “Executing Base Line Collection” appears on Message Box(F), and after
execution “Ready” appears.
D
E
4. Select Cell Number(CELL 1-No. 1)(B).
F
1. Locate Mouse point New/Open(A) left side, and mode selections will appear as shown.
5. After Cell selection, Click Measure(E) to start measurement.
While execution, “Measuring” appears on Message Box(F), and after execution “Ready”
appears on a message box and measured value will be displayed as a table and a graph.
Double click Survey Scan .
44
45
5-4. Measuring Absorbance (Transmittance) Timely
2. Input Name of Test, Wavelength, Total Time and Time interval.(C)
B
A
3. Click Auto Zero(D) to correspond the light intensity between Sample & Blank.
Part Ⅱ. Optizen View Usage 5-4. Measuring Absorbance (Transmittance) Timely
Part Ⅱ. Optizen View Usage 5-4. Measuring Absorbance (Transmittance) Timely
C
While Auto Zero is executing, “Executing Auto Zero” appears on Message Box(F), after
D
E
execution “Ready” appears.
4. Select Cell Number(CELL 1-No. 1)(B).
F
1. Locate Mouse point New/Open(A) left side, and mode selections will appear as shown.
5. After Cell selection, Click Measure(E) to start measurement.
While execution, “Measuring” appears on Message Box(F), and after execution “Ready”
appears on a message box and measured value will be displayed on a table and a graph.
Double click Kinetic Scan .
46
47
5-5. Save and Print Out
6. Trobleshooting
• Save
• When a message box [Instrument is not found] appears,
Select [File(F)] → [Save(S)] or [Save as(A)] to save
1. Embedded PC(Internal PC) happens not to be operated in booting process of OPTIZEN
measured data.
3220UV. Please re-boot 10 seconds later. After “beep” sound, rebooting has been
※File format is *.ODF.
succeeded.
Select [File(F)] → [Export to Excel(E)]
to save measured data as Excel form.
2. Check Device name at [Options].
- Stand Alone Version : localhost
- PC Version : Optizen3220UV
Part Ⅱ. Optizen View Usage 6. Trobleshooting
Part Ⅱ. Optizen View Usage 5-5. Save and Print Out
3. Check the OptizenDevice icon(shape of mecasys logo) at system tray window.
• Print
Select [File(F)] → [Print(P)] and choose print form
to print out.
48
49
Part Ⅲ. Technical Supports
1. Technical Supports
When you have any difficulties of installing Optizen 3220UV and OptizenView. Please go
through and review with this user’s guide. If troubleshooting does not help to solve troubles,
please contact your nearest distributor or producer.
Caution: When contact for after service, must be reported symptom of trouble.
Mecasys Co., Ltd.
Postal code: 305-150
Part Ⅲ. Technical Supports 1. Technical Supports
10F, 640-3 Bansuk dong, Yuseong-gu, Daejeon, Rep. of KOREA.
Fax : +82-42-485-7118
For technical service E-mail : [email protected]
http://english.mecasys.co.kr/
50