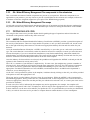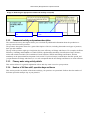
1
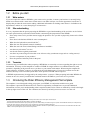
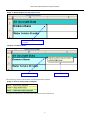
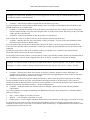
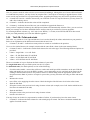
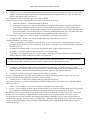
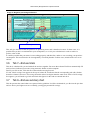
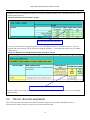
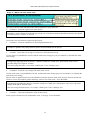
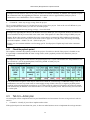
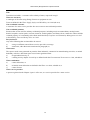
Water Efficiency Management
Plan
Template User Guide
July 2011
Prepared by:
Urban Water Policy and Management
Department of Environment and Resource Management
© The State of Queensland (Department of Environment and Resource Management) 2011
Copyright inquiries should be addressed to [email protected] or the Department of
Environment and Resource Management, 41 George Street Brisbane QLD 4000
Published by the Queensland Government, Xxxx 2011
This publication can be made available in alternative formats (including
large print and audiotape) on request for people with a vision
impairment.
Contact (07) 322 48412 or email <[email protected]>
July 2011
#29844
Contents
1
2
3
4
Introduction
3
1.1
What is a Water Efficiency Management Plan?
3
1.2
Before you start
4
1.3
Introducing the Water Efficiency Management Plan template
4
General details
7
2.1
G1-G2 General details
7
2.2
G3-G4-G5 Submission data
7
2.3
G6 Business-site data
8
Baseline water use and water source information
10
3.1
Tab 1—Water use summary
11
3.2
Tab 2—Management review
12
3.3
Tab 3—Management actions
13
3.4
End uses
13
3.5
Tab 6—End use inventory
19
3.6
Tab 7—End use totals
21
3.7
Tab 8—End use summary chart
21
Water savings and action plan
22
4.1
Tab 9-1—Water saving measures
22
4.2
Tab 9-2—Economic assessment
23
4.3
Tab 9-3—Action plan
25
4.4
Submitting your WEMP
26
4.5
Reporting and review
26
5
Glossary
27
6
Attachment 1—38 Brown Street (WEMP Sample 1) water efficiency policy
29
7
Attachment 2—38 Brown Street (WEMP Sample 1) water efficiency information
for staff
30
ii
Water Efficiency Management Plan: Template User Guide
1
Introduction
The objective of a water efficiency management plan (WEMP) is to help businesses save water and money, with
positive benefits for the environment.
The Water Efficient Management Plan Template User Guide (this user guide) has been developed in line with the
contents of the Water Supply (Safety and Reliability) Act 2008 (the Act) and the Guideline for Preparing a Water
Efficiency Management Plan Outside South East Queensland (the guideline).
This user guide, and the associated WEMP template (the template), are designed to assist non-residential customers
of water service providers outside South East Queensland (SEQ), or a designated region, when preparing a WEMP.
It is important that non-residential customers required to complete a WEMP are familiar with the requirements of
the guideline prior to undertaking to complete the template. While use of the template is recommended, customers
are able to develop their own WEMP.
This user guide should be used by those preparing their WEMP using the template. Supplementary to this user
guide, are two WEMP samples which have been designed to provide ideas and real life examples of how the
different WEMP requirements can be completed within the template. These samples can be accessed on the
Department of Environment and Resource Management’s (the department) WEMP page at
<www.derm.qld.gov.au>. The samples refer to the two different classes of non-residential customers (for more
information about the classes of non-residential customers see the guideline):
•
WEMP Sample 1—38 Brown Street Office Building – customers with premises occupied by commercial
buildings
•
WEMP Sample 2—Meats and Meats – customers with premises used for other activities.
Additionally, two checklists are referred to in the template and in this user guide, and are also available on the
department’s WEMP page at <www.derm.qld.gov.au>. These checklists are:
•
WEMP Water Using Features Checklist
•
WEMP Water Saving Measures Checklist.
Be sure to check the glossary at the back of this document for an explanation of any unfamiliar terms.
1.1
What is a Water Efficiency Management Plan?
A WEMP is a detailed assessment of the water use of a non-residential customer’s premises, and based on this, it is
a plan of efficiency measures that will be implemented in order to achieve water savings for those premises.
A WEMP identifies where and how water is being used–end uses. Once end uses are identified, a WEMP should
estimate potential water savings by implementing water efficient measures. These measures will be entered into an
action plan for endorsement by senior management of the business. Once the WEMP has been completed, and the
action plan commenced, continuous improvement should occur through ongoing monitoring and assessment of
water use. This will allow the business to identify water (and monetary) savings and ensure it is operating in a way
that achieves the highest potential water savings.
Pursuant to section 53 of the Act, a WEMP must comply with any guidelines made by the chief executive of the
department for preparing a plan, that is, the guideline. More specific information relating to the background and
requirements for WEMPs is available in the guideline on the department’s website at <www.derm.qld.gov.au>.
While any representative of a business may prepare a WEMP, it should be developed by combining input from
senior management with maintenance and operational staff’s knowledge and ideas.
You may choose to attach additional information to the template (for example a water efficiency policy or
examples of staff notices—see Attachments 1 and 2) or submit your WEMP in a report format. It is important that
you refer to the guideline for compulsory WEMP requirements.
3
Water Efficiency Management Plan: Template User Guide
1.2
Before you start
1.2.1
Water meters
If you are required to submit a WEMP to your water service provider, it means your business is currently being
billed in accordance with a water meter. Water meters can differ in shape, size and/or appearance, but all have a
display that provides the water meter reading. Additional information on reading water meters is available on the
department’s website at <www.derm.qld.gov.au/waterwise>
1.2.2
Site understanding
It is very important that the person preparing the WEMP has a good understanding of the activities on site. Below
are some questions that you should consider before commencing the preparation of the WEMP:
•
How many water service provider meters supply the premises? Are you able to physically locate each of these
meters?
•
How often is the business billed for water consumption?
•
What does the hydraulic network look like1?
•
What date was the hydraulic network installed?
•
What date were the water related fittings and fixtures installed2?
•
Are there any sub-meters3 on site?
•
Are the sub-meters regularly monitored?
•
Are there any water using activities that occur 24 hours a day (continuous usage such as cooling towers)?
•
Is water a component of your product?
•
Have the premises had many leaks in the past?
1.2.3
Tenancies
Tenancies may pose difficulties when preparing a WEMP due to ownership or issues regarding the right to access
information. You may use the template to conduct a WEMP for single tenancies or combined tenancies (total
premises), depending on how much access you have to your tenants' information. When using the template for
single tenancies, a baseline4 water use is required for the individual tenancy. If your site’s tenants are not submetered, this may not be a feasible option and a whole premises WEMP will be required.
A WEMP requirement may be triggered by the total premises’ water use. When preparing individual WEMPs for
tenants on one site, ensure you submit the combined tenancies WEMPs to your water service provider.
1.3
Introducing the Water Efficiency Management Plan template
The template is a tool designed to help you prepare your WEMP, in conjunction with this user guide.
The template is presented in Microsoft Excel. There are explanatory comment boxes to provide additional
information or assist you in understanding what is required in that section. These are marked by a small red triangle
in the top right corner of the cell. The comments are shown if you hold your mouse cursor over the cell.
1
The hydraulic netwrok is the piping infrastructure that provides water to the various parts of the business.
The age might give insight into the water efficiency of fixtures and fittings.
3
Sub-meters are water meters that are put in place past your main water meter(s) to measure usage on a portion of the distribution network, for example to only
monitor the water used by a single process or piece of equipment, or perhaps on individual tenancies.
4
This refers to the initial period for which the template is being completed. This will be a representative period of no less than 12 months before the start of the
WEMP or a time period approved by the water service provider.
2
4
Water Efficiency Management Plan: Template User Guide
Image 1—Red triangle at the top right of a cell
Red triangle indicates a
comment
Image 2—Comment boxes
Put cursor over the cell
Comment pops up
The following colour code has been used throughout the template.
Image 3—Colour coding used in template
Navigate the template by clicking on the tabs at the bottom of the sheet.
5
Water Efficiency Management Plan: Template User Guide
Image 4—Navigational tabs
Tabs
The first three tabs are named Cover, Checklist and Instructions.
1.3.1
Cover
The cover tab will fill in automatically once you have completed your WEMP. There is no need to enter any
information into this sheet.
1.3.2
Checklist
The checklist tab provides a checklist to ensure all parts of the WEMP have been completed. It will be important to
come back to this tab when you feel you are ready to submit your WEMP to your water service provider.Note: if
you submit your WEMP in hard copy, cells C/D19 can be signed once printed. Alternatively, if you submit it
electronically, use an electronic signature in this cell.
1.3.3
Instructions
The instructions tab provides general instructions to navigate the template.
The template has been developed based on different modules and this tab provides a brief description of each.
6
Water Efficiency Management Plan: Template User Guide
2
General details
To identify water uses and potential savings, you must have a good understanding of the premises. Maintenance,
operational, technical and cleaning staff will be your best sources of information, so ensure you involve them in the
process.The template requests the following to be included in your WEMP:
•
premises location
•
customer name
•
contact person and contact details
•
general description of the type of operations and activities that are conducted on the premises and how they
affect water use.
The template follows six modules in three tabs for general details regarding the WEMP and the premises, these are:
•
G1—Account data
•
G2—Customer contact for the WEMP
•
G3—Submission details
•
G4—WEMP components in this submission
•
G5—WEMP scope
•
G6—Business and site data.
2.1
G1-G2 General details
2.1.1
G1—Account data
The general details tab is a record of the customer details. Indicate here your business name, water service provider,
name of account holder, premises address, account number and ABN/CAN.
2.1.2
G2—Customer contact for the Water Efficiency Management Plan
In G2 insert the customer contact for the WEMP. This is also referred to as the water efficiency manager in the
template. The water efficiency manager should be someone in the organisation who will be responsible for
implementing the WEMP's water saving measures and the person who should be contacted for issues relating to
water (for example, if there is a leak it should be reported to this person to arrange for it to be fixed in a timely
manner).
2.2
G3-G4-G5 Submission data
2.2.1
G3—Submission details
Include details of the WEMP’s author (in most cases, this should be the water efficiency manager entered in the
previous tab) and the WEMP authority, including the latter's signature. Note: if submitting your WEMP in hard
copy, cell D5 can be signed once printed. If you are submitting your WEMP electronically, use an electronic
signature in this cell.
A WEMP authority should be a person with the appropriate power to authorise the actions identified in it (for
example, the chief executive officer, operations manager or business manager). The WEMP authority does not have
to be the same person as the water efficiency manager in G2.
7
Water Efficiency Management Plan: Template User Guide
2.2.2
G4—Water Efficiency Management Plan components in this submission
This is an initial assessment of which components are present on your premises. Where the component is not
applicable to your premises, you may choose to provide a justification for the exclusion (for example, indicate 'no'
to outdoor use because irrigation stopped two years prior to the WEMP being prepared).
2.2.3
G5—Water Efficiency Management Plan scope
Use this tab to provide an initial general description of the type of operations and activities that are conducted on
the premises and how they affect water use. The WEMP scope can assist in setting the boundaries of the WEMP.
2.3
G6 Business-site data
This tab gives the water service provider further detail regarding the type of operations and activities that are
conducted on the premises and how they affect water use.
2.3.1
ANZSIC Code
The Australian and New Zealand Standard for Industry Classification (ANZSIC) provides a general description of
the activity of the business. There are a large number of options, so once you have selected the cell, use the scroll
bar on the right of the drop down menu to select the most appropriate industry division and class name for your
business.
Go to the Australian Bureau of Statistics’ ANZSIC search facility at <www.abs.gov.au> and search your business
type. The search function is most effective when less detail is entered. For example, to ensure you select the most
relevant description, if you are a canned fruit manufacturer, enter fruit manufacturing, rather than canned fruit
manufacturing, and select the appropriate option. The search will provide the industry division and class for your
business. Select these from the drop down menus on tab G6 of the template.
Once the industry division and class are selected, the spreadsheet will populate the ANZSIC code and provide the
options for the commercial activity unit (CAU).
The CAU is a measure of your business’s output/activity. In some cases, the template may generate a number of
relevant CAUs, from which you will need to select the most appropriate. The CAU for your business is important
as it will be used for key performance indicator (KPI) benchmarking5 of your water use, so ensure the unit is
appropriate. For further information on CAUs and KPIs, an information sheet is available on the department’s
website at <www.derm.qld.gov.au>.
As the CAU cell is presented in yellow in the template, it indicates that by clicking on the cell, you will be provided
with options to select the appropriate CAU.
There may not be a perfect industry division or class for your business. While the ANZSIC code is important for
benchmarking purposes, having a relevant CAU, and therefore KPI, is more important. If two or more divisions or
classes are appropriate, choose the one that provides you with the most relevant CAU, or contact your water service
provider for assistance.
In some cases, the CAU(s) indicated by the template may not be appropriate (for example, the template will
provide shopping centres with a CAU of employees, where it may be more appropriate to use visitors or shoppers).
In these instances, use the next cell to indicate your preferred CAU. It is preferable that you use the pre-determined
CAU(s) as it allows for water service providers to compare between similar business’s water consumption.
8
Water Efficiency Management Plan: Template User Guide
Image 5—Selecting an appropriate commercial activity unit (CAU)
Select from drop down
box
2.3.2
If necessary fill in an alternative
CAU
Commercial activity and premises description
The commercial activity description allows you to include any additional information about the production or
activity carried out on the premises.
The premises description allows for a general description of the site, including the number and types of premises,
their age and condition.
The age of the premises might give insight into the water efficiency of fittings and fixtures. For example, the Water
Efficiency Labelling and Standards Act 2005 (WELS), stipulated the mandatory classification of taps, showers,
toilets and urinals from 2006. The installation of water efficient, WELS rated fittings and fixtures, became
mandatory in the Queensland Development Code in 2007. If you had a major remodel done after this period, and
you purchased new fittings and fixtures, it is a safe assumption that the new fittings and fixtures are water efficient.
2.3.3
Primary water using activity details
This section allows for a general explanation of how and why water is used on your premises.
2.3.4
Number of full time staff, operation days and hours
This section provides an outline of the hours and days your premises are operational. Indicate here the number of
full-time equivalent staff per day at your premises.
9
Water Efficiency Management Plan: Template User Guide
Enter formulas in Excel to calculate your average operation days.
Example: For an office building operating five days a week, the calculation entered in Excel should be =365*5/7
Every business will have a different full time equivalency. Ensure you describe what the basis for your full time
equivalency is under hours of operation per day and days of operation per year.
Example: An office may have:
•
an average working day of 8 hours
•
an average operation of five days per week = 365 x 5 / 7 = 260.71 days per year
•
a full time equivalent (FTE) staff of:
•
10 office staff at 8 hours/day 5 days/week
FTE = 10 x (8/8) x (5/5) = 10
•
5 office managers at 10 hours/day 5 days/week
FTE = 5 x (10/8) x (5/5) = 6.25
•
2 supervisors at 10 hours/day 6 days/week
FTE = 2 x (10/8) x (6/5) = 3
•
5 office admin at 5 hours/day 5 days/week
FTE = 5 x (5/8) x (5/5) = 3.125
•
10 part office staff at 8 hours/day 3 days/week
FTE = 10 x (8/8) x (3/5) = 6
Total FTE staff = 28.375
3
Baseline water use and water source
information
Your WEMP must document the premises' current water use and evaluate its water use by identifying where water
is being used and a KPI to monitor water use henceforth.
The WEMP will include an inventory of end uses, including location, number, general condition and water use of
the following:
•
taps, showers, toilets and urinals
•
cooling towers
•
any other water using processes or pieces of equipment (for example, washdown, cleaning, irrigation, boilers).
This information is to be used to document your end use inventory (Tab 6), which shows the estimated water
consumption for each end use on the premises. The template presents this inventory as a pie chart (in Tab 8—End
use summary).
The following tabs identify the end uses, volumes and water balance for your premises:
•
Tab 1—Water use summary
•
Tab 2—Management review
•
Tab 3—Management actions
•
Tab 4—End use definitions
•
Tab 5-1A—Taps and showers
•
Tab 5-1B—Toilets and urinals
•
Tab 5-2—Cooling tower
•
Tab 6—End use inventory
•
Tab 7—End use totals
•
Tab 8—End use summary.
10
Water Efficiency Management Plan: Template User Guide
Reminder: in the template, only fill in the white cells and select the appropriate option from the yellow cells.
Green cells will automatically be completed as information is entered into other cells.
3.1
Tab 1—Water use summary
This tab allows you to specify your current baseline water consumption and baseline KPI. It will also provide an
overview of the premises’ water use in the past, in relation to reticulated mains and other water sources.
3.1.1
Baseline water use
Here you will be required to establish the most recently completed financial year (known as your baseline year) and
the water use in mega litres (ML) for that year (known as your baseline water consumption). It is important that the
baseline year reflect the last financial year prior to the audit, unless otherwise agreed upon with your water service
provider.
This information is provided in your water bills from your water service provider. You may have more than one bill
for each financial year (for example, if you are billed every six months you will have two bills per financial year).
Add the consumption charge for each bill to get the total for one financial year.
In general, water is billed in kilolitres (kL). When inserting your baseline consumption, divide your billed
consumption by 1000 to obtain the consumption figure in mega litres (ML).
3.1.1.1
What if you do not have enough data for the last financial year?
If your business has recently opened, or commenced operation on the premises, you may need to extrapolate your
current usage for the financial year.
Example: A shopping centre has been operational for eight months and has one water service provider bill
charging 7.5ML for a period of six months. Any bills prior to this represent water used during construction of the
premises.
The extrapolated consumption for the year can be found by multiplying the bill for six months by two
= 7.5 x 2 = 15 ML/year.
3.1.2
Commercial activity units
Insert the total CAU for your business for the baseline year.
Example: A business has a CAU (as identified in tab G6) of staff employed. The business has an average staff
number of 329 per day and operates for five days a week. The CAU for the baseline year is calculated by using
the average number of staff per day, multiplied by the number of days the premises are operational per year.
CAU for year:
= 329 staff x 365 (days per year) x 5 (operating days per week) / 7 (days per week)
= 85 775
Note: the KPI (L/CAU) will be calculated for you.
The KPI target and KPI industry benchmark options should be used if your premises are currently aiming to
achieve a water use target (based on an industry benchmark). You may leave these cells blank if not applicable.
3.1.3
Historical water use
An analysis of the premises' historical water use can help you identify any trends. Use this section if you have the
data available for any financial year for the past seven years.
11
Water Efficiency Management Plan: Template User Guide
Select the year you would like to start from and insert the respective consumption and CAU if available. You may
then be able to determine how your premises have been performing in the past in relation to water use.
Use the comments section to provide any known reasons for peaks or troughs in water use experienced in the past.
3.1.4
Water meters (including sub-meters if present on the premises)
Identifying how many meters (including sub-meters) are used on the premises will give an indication of the
complexity of your hydraulic network.
Sub-meters can help you monitor consumption for specific end uses (for example, cooling towers). They can also
aid management with the billing of water consumption for tenanted premises. Complete this section where you
have monitored specific end uses through sub-meters.
In this section, indicate information for the top five water using sub-meters. This will assist you to understand the
major end uses for your business.
For each sub-meter, indicate the location (for example, sterilisers), identification number and the use, in ML, in the
baseline year.
If you have extrapolated consumption for the baseline year, ensure you do the same for the sub-meters.
If you do not have any sub-meters on your premises leave this section blank.
3.1.5
Other sources
Many businesses use sources of water other than reticulated mains water for certain end uses (for example,
rainwater for garden irrigation). The other sources section of this tab must be used to record details of water use by
the business from any of these other water sources.
This is the only section of the template that water from sources other than reticulated mains water will be
recorded or used.
For example, if the end use of vehicle wash down is supplied by 100 per cent recycled water, then once
recorded under other sources in tab 1, no information on vehicle wash down will appear in the subsequent tabs
of the template.
As a further example, if rainwater is used to supply 40 per cent of the outdoor irrigation end use, this will be
recorded in tab 1, and will not appear in the remainder of the template. Only the remaining 60 per cent of
outdoor irrigation supplied by reticulated mains water will be recorded in the relevant subsequent tabs, that is,
initially described in Tab 4, and then the estimated quantity of water use recorded in tab 6.
Where possible, indicate how much water is used from the alternative source. If you have estimated the volume,
indicate in the comments section how the estimation was made.
If you do not use any alternative sources leave this section blank.
3.2
Tab 2—Management review
A management review of how water use is considered by your business should be completed by the WEMP
authority from G3—Submission details. Although this is not mandatory, it is considered best practice to review
management attitudes towards water management.
Not all answers may fit the exact nature and structure of your business. Apply the questions as best you can so it is
relevant to your business. Where questions do not apply leave the answer blank.
12
Water Efficiency Management Plan: Template User Guide
3.3
Tab 3—Management actions
This tab helps your business identify management actions which could be implemented to assist you manage water
more efficiently on your premises.
If you leave some questions blank, you may choose to provide an explanation of why the question does not apply to
your business in the action measure details column.
3.4
End uses
To assist with identifying the end uses for your business, the WEMP Water Using Features Checklist available
from the department's website at <www.derm.qld.gov.au> may provide a useful starting point. This checklist
provides likely water end uses for a range of different business categories or types. These suggested end uses will
be useful in directing your investigations during your water audit.
A zero flow test is an effective way to identify what may be unnecessary water use on your premises outside
business hours. It is also one of the most effective ways to indicate the likely presence of leaks.
The test involves selecting a time period outside usual business operation hours (preferably over a weekend), when
no water use should occur on the premises. Take a meter reading (on all meters if you have more than one) after the
close of business and again, prior to the next business day commencing. If there are no water using devices
operating during this period (such as air conditioner cooling towers), the increase in the meter reading could
indicate leakage.
It is recommended that you undertake a zero flow test for your premises prior to completing the water audit. This
will assist in alerting you to the probable presence of leaks or water use outside business hours that should be
discovered during the water audit process. If the zero flow test indicates water use, and the water audit fails to
discover any water use or leaks to explain the change in meter readings, further, and more detailed investigation of
the hydraulic network by a licensed plumber will likely be required.
3.4.1
Conducting a water audit
To thoroughly complete the next tabs in the template, it is important that you undertake a detailed water audit of
your premises. The water audit will be used to:
•
identify end use categories
•
identify possible leaks
•
quantify end use fittings and fixtures (for example, number and condition of taps, showers, toilets and urinals)
•
understand water using behaviours (for example, number of minutes staff take to have a shower)
•
help you calculate the amount of water used for each end use category.
A relatively easy way to conduct an audit is to do a premises walk with a staff member(s) who understands the
operations of your business. Operational staff will have the detail required to successfully proceed with the
following sections of the template. In a walk-through water audit, you will identify all water using equipment and
processes, and their associated water volumes, and any relevant water use behaviour (see example below).
It may also be useful to undertake a walk-through audit outside of business hours. This will give you the
opportunity to identify wastes and inefficiencies, for example, water using processes that operate continuously even
outside operational hours. It will also provide you time to investigate water uses that you may not be able to
identify during busy operational hours.
When conducting the walk-through take notes—printing tabs 4,5-1A and 5-1B will be useful.
13
Water Efficiency Management Plan: Template User Guide
Example: During the audit of a three storey office building with six toilet facilities (one female and one male
toilet block on each floor), one central kitchen facility and one landscaped garden, the WEMP author would:
1.
Visit each of the toilet facilities.
2.
Count and record the number of like fittings and fixtures in each facility (for example, the number of dual
flush toilets and single flush toilets), inspecting each for any leaks or other inefficiencies.
3.
Talk to the users of each facility to describe the use behaviour of like fittings and fixtures (for example, the
floor is occupied by 80% women and 20% male staff members, impacting female and male toilet facility
use).
4.
Observe user's behaviour and question the kitchen users about their water use practices (for example, how
many times a week is the dishwasher operated?).
5.
Talk to the cleaning staff about the cleaning practices for each toilet block and the kitchen facility.
6.
Ask the facilities manager for details on the garden watering schedule (for example, how many minutes per
day do you water with a hand held hose?).
Once you have walked through the premises, and taken detailed notes, you can proceed with the next tabs in the
template.
3.4.2
Tab 4—End use definitions
In this tab, you should list all the end use categories you identified during your premises audit. Fill in the details of
the end use category in columns C and D/E. Only include end use categories that use reticulated mains water (do
not include end use categories supplied solely from other sources, as identified in Tab 1).
It is important that in identifying your end uses, you do not duplicate the seven standard end use categories that are
provided for you. For example, if you identify cleaning as an end use during your audit it is possible that this water
use may be captured under the taps end use already provided.
If it is your preference to show end uses, such as cleaning, separate to the taps end use, then include cleaning as an
end use category in Tab 4, and ensure that all water use and information related to cleaning appears in Tab 6. In this
case, no information relating to water used for cleaning will be entered into Tab 5-1A.
The template provides two example rows (cooling and fire testing) - delete these if they do not apply.
3.4.3
Tab 5-1A—Taps and showers
This tab is designed to calculate how much water your premises are using in taps and showers. An inventory of all
the taps and showers on the premises must have been completed (for example during the walk-through audit) to fill
out this sheet, When doing the inventory, try to obtain information on the usage rates of the taps and showers. For
example, ask your staff if, and how often, they use the showers.
Taps include kitchen trigger sprays and outdoor taps. Many businesses may find it more useful to show outdoor tap
water used for irrigation as a separate end use.
How to fill in the sections
1.
Column B—indicates the location of the fixture.
Example: If you have two taps at 9L/min and two taps at 20L/min in the ladies toilets, insert each set in a
separate row, under the same location.
2.
Columns C and D—indicate the number of fixtures. Use different rows for different flow rates.
3.
Column E—indicates the average duration of use in seconds.
14
Water Efficiency Management Plan: Template User Guide
Example: For a hand wash, Brisbane City Council suggests 20 seconds of tap use. In both WEMP samples, 20
seconds was used for each hand wash.
4.
Column F—indicates the number of people that use the fixture(s) per day.
If you do not know the ratio of female to male amenity users, use a 50 per cent breakdown for each. Refer to the
WEMP samples for an example of this.
5.
Column G—indicates the number of times the fixtures are used per day. For example, you may assume that
people wash their hands every time after using the toilet. So if they use the toilet four times per day, four hand
washes per day would be used.
6.
Column H—indicates the number of days the premises are operational.
Link Column H to cell C10 in Tab G6 where you have already specified operation days.
7.
Column I—indicates the flow rate of the fixture in litres per minute. You may source this information from
the fixture's specification or WELS rating.
If you do not have the specification or WELS star rating for the fixture, you may need to measure the flow rate.
You will need a container where you know the volume (for example, an empty 600ml bottle or a 9L bucket) and a
stopwatch.
Record how long it takes to fill up the container at what you consider to be a usual flow rate for that fixture.
Divide the volume (in litres) by the time (in minutes).
For premises with too many fixtures, you may choose to take a representative sample of them, but remember that if
they are inefficient, you may need to upgrade them all, so it may be cost effective to measure all fittings.
Example 1: It took 30 seconds to fill up a 9L bucket from a shower. Shower flow rate = 9L / 0.5min = 18L/min
Example 2: It took 6 seconds to fill up a 600mL bottle from a tap. Tap flow rate = 0.6L / 0.1min = 6L/min
8.
Column J—indicates how much of this fixture is used for volumetric purposes (used to fill things), for
example, taps in cleaners’ rooms are often used to fill buckets and upgrading these with aerators or low flow
fittings won't represent any actual water savings.
9.
Column K—indicates the general condition of the tap or shower from the options of good, poor or leaking.
Use this column to indicate any leaks. Call a plumber and request all leaks to be fixed at once. This will save
money and ensure all leaking fixtures are fixed as soon as possible. Leaks will still form part of your water balance
and the savings will be represented in tab 9-1—Water saving measures.
10. Column L—indicates whether the fixture needs to be changed. This should be in line with the guideline
requirements.
As per the guideline, for commercial buildings, the WEMP should ensure water fixtures have a minimum WELS
efficiency rating of:
•
taps—3-star or higher or less than 9.0 L/min
•
showers—3-star or higher or less than 9.0 L/min
•
kitchen sprays—3-star or higher, mounted, flexible hoses with automatic cut-off trigger or less than 9.0 L/min.
For premises used for other activities (not commercial buildings), water use efficiency should seek to achieve a
reduction of water use by 25 per cent, or best practice water use efficiency, or implementation of all measures with
a payback period of four years or less.
15
Water Efficiency Management Plan: Template User Guide
Also, for premises used for other activities (not commercial buildings), although the use of water efficient fixtures
is considered best practice, you may choose to complete Tabs 7 and 8 prior to selecting to upgrade fixtures. If the
water used by taps and showers is proportionally minor, upgrading the fittings may not lead to significant savings.
11. Columns M, N and O—indicate what action you would like to take. For taps and showers you may choose to
add a flow reducing device.
12. Column P—indicates the date the action will be completed.
13. Column Q—indicates the new flow rate you would like to upgrade the fixtures to.
Once you have completed Column Q, the subsequent columns will automatically calculate. Here, you can see how
much you currently use for those identified fixtures and how much you could save from any upgrades.
Try inserting different volumes (e.g. 9.0 L/min (3-star WELS), 7.6 L/min (4-star WELS) and check how much
water you could potentially save from the different upgrades.
3.4.4
Tab 5-1B—Toilets and urinals
This tab is very similar to 5-1A Taps and Showers, but is used to identify the toilets and urinals on your premises.
Below is an explanation of the differences between this tab and 5-1A.
1.
Columns C, D and E—indicate how many toilets or urinals are available on the premises.
Use rows for similar fixtures (for example, urinals with the same flush volume in the same amenity block).
2.
Columns F and G—indicate the current flush volumes for each toilet type. The following flush rate options are
provided:
•
0 Stars—single flush - 11 or 12L flush
•
1 Star —9L full flush and 4.5L half flush
•
3 Stars—6L full flush and 3L half flush
•
4 Stars—4.5L full flush and 3L half flush.
There are a number of ways to find out the flush volume of your toilet.
For single flush units (only one flush option) use the 11L option.
For dual flush units (two flush options) use one of the following:
1.
Check the make/model—most toilets will have a make and model specified somewhere on the unit. With the
make and model you can go to the WELS website <www.waterrating.gov.au> and look up the fixture in the
Finding a WELS Product section. The products all have a WELS rating. Pick the appropriate option in the
drop down menu. Note: if you have receipts for your toilets you may check the star rating or make and model
there.
2.
Measure the cistern:
•
turn off the valve supplying the toilet cistern. Check the height of the full water level in the toilet cistern
•
flush the full flush
•
fill up the cistern to the previous level using a known volume (for example, out of a 9L bucket which has one
litre intervals marked on the side)
•
flush the half flush
•
fill up the cistern to the previous level using a known volume
•
turn the valve back on.
You may choose to do this for a representative number of toilets, if you know they have the same cistern.
3.
Column H—indicates the flush volume for each urinal/group of urinals. The above calculation method also
applies for urinal cisterns.
16
Water Efficiency Management Plan: Template User Guide
4.
Columns I and J—indicate the equipment and operation type for each urinal/group of urinals. Contact a local
supplier of urinals for help in explaining any unfamiliar terms from columns I and J or check the make and
model in the WELS website (see above).
The breakdown for these columns is given according to WELS.
Column J provides device classification by how they are operated, as follows:
a.
conscious operation—operated manually by the user
b.
demand-driven operation—operates automatically on demand, rather than by conscious activation of a
user, with an adjustable activation sensitivity field at the front of the urinal or a urine sensing device
c.
smart-demand operation—programmable operation with an adjustable activation sensitivity field at the
front of the urinal or a urine-sensing device to control a predetermined flush cycle, with smart logic that
detects users, and controls programmable delay and flushing modes of the device.
Use urinal only in column J for waterless urinals. In column H use a volume per flush of 0L.
5.
Columns K and L—indicate the average number of users per day and uses per person.
Urinals on flushing valves with a timer:
•
contact your plumber to establish how often the timer is set to open the valve. Urinals operating on timers
normally operate 24 hours per day, 365 days per year, unless a controller is used. Confirm with your plumber
that this is the case
•
in column K, insert the number 1 as it is not relevant how many people use the urinal per day
•
in column L, insert the number of times the urinal is set to flush per day
•
if the timer is set to flush 365 days per year (not under a controller), the figure inserted in column K will be
different than the number of days the premises are operational.
Example: The timer is set to open the valve at 5 minute intervals. This equates to 60 / 5 = 12 flushes per hour =
12 x 24 hours per day = 288 flushes per day. In this example, column J would equate to 288.
6.
Column M—indicates the number of days the premises are operational. For manual cisterns or urinals
operating under a flushing valve with a sensor, the use is directly related to the amount of people who use the
urinals. Fill these columns out as explained for columns F and G in 5-1A Taps and Showers.
7.
Column N—indicates the general condition of the toilet(s) or urinal(s).
Use this column to indicate any leaks. Call a plumber and request all leaks are fixed in one go. This will save
money and ensure all leaking fixtures are fixed as soon as possible.
8.
Columns O to R—indicate if the fixture needs to be changed or repaired.
As per the guideline, for commercial buildings the WEMP should ensure water fixtures have a minimum WELS
efficiency rating of:
•
toilets—3-star or higher, or new toilets should be a minimum of 6/3L dual flush
•
urinals—4-star or higher, or flush volume no more than 1.5L per flush or maximum daily use of 10L per stall
or per 600mm of continuous wall. Waterless technology should be implemented where possible.
For other customers, water use efficiency should seek to achieve a reduction of water use by 25 per cent, or best
practice water use efficiency, or implementation of all measures with a payback period of four years or less.
For premises used for other activities (not commercial buildings), although the use of water efficient fixtures is
considered best practice, you may choose to complete tabs 7 and tab 8 of the template prior to selecting to upgrade
fixtures. If the water used by toilets and urinals is proportionally minor, upgrading the fittings may not lead to
significant savings.
17
Water Efficiency Management Plan: Template User Guide
9.
Column S—indicates the date the action should be completed by. All water saving actions should have a
timeframe for implementation associated with them. This will assist the ongoing monitoring and reporting on
the WEMP actions.
10. Column T—indicates the flush volume for the toilet you would like to install.
11. Columns U to W—indicate the new flush volume, equipment and operation type for urinals.
3.4.5
Tab 5-2—Cooling tower
The cooling tower tab is used to assess the efficiency of your cooling tower. This tab is only relevant if you
currently have a sub-meter installed on the tower's feed (make up) and bleed lines. If you do not have sub-meters
installed on these lines, leave this section blank. If this is the case, it is highly recommended that one of your water
efficiency actions include sub-metering both cooling tower make up and bleed lines and monitoring them. When
preparing an annual report on your WEMP, ensure you include the monitoring results.
Many cooling towers operate on a bleed controller that adjusts the total dissolved solids (TDS) limits and sets out
the cycle of concentration (CoC) your cooling tower is operating under.
If you are unsure of the terms or values in this tab, contact your cooling tower service technician for assistance.
1.
Column C—insert the name or location of the cooling tower
2.
Column D—insert the conductivity of the make up water feeding your cooling tower
Your water audit should have confirmed that the make up water for your cooling tower was sourced from your
water service provider. If alternative water sources, such as recycled water or rainwater are used, do not complete
this tab. Information indicating that an alternative water source is used for the cooling tower make up should have
already been entered into Tab 1.
3.
Column E—insert the conductivity of the bleed water
If you do not know the conductivity of the bleed water, but know the system is set at a specific cycle of
concentration, adjust the bleed value to give the set CoC in Column E.
4.
Column H—insert the total volume of the cooling towers bleed water in ML/year for the baseline year.
5.
Column I—insert the total consumption in ML/year for the baseline year.
If you do not have one year of data, extrapolate what you have out to 365 days (or equivalent operational days of
the year).
Example: For a new meter installed three months ago, with a consumption of 600kL, the annual use would
equate to 2.4ML.
6.
Column M—if column M indicates ‘inefficient’, your cooling tower may be leaking. Leaks/losses could be
from leaks from the tower basin;,, splash out of the sides (through splash guards) or make up water going
down the overflow. See the cooling tower section of the WEMP Water Saving Measures Checklist for further
possibilities6.
Request that your cooling tower service company conduct a visual check of the unit during the next
maintenance/scheduled service for potential causes of losses.
7.
Column Q—indicates which CoC you will aim to achieve by re-setting your bleed controller.
The spreadsheet will then calculate the level of savings that could be achieved from re-setting the CoC to a water
efficient value.
Best practice cooling tower management stipulates a minimum CoC of five. If appropriate, request that your
cooling tower service company adjust the cycles of concentration.
Depending on your make up water conductivity, your premises may not be able to operate at more than five CoC.
Your water service provider may be able to provide further advice in relation to this.
18
Water Efficiency Management Plan: Template User Guide
3.5
Tab 6—End use inventory
This section of the WEMP is site-specific and will depend on your premises’ water audit. This tab will include
water using processes and procedures such as cleaning or washdown of equipment. The two WEMP samples
provide a range of examples of possible end uses.
All the end uses identified from number 8 onwards in tab 4 will appear here with a detailed breakdown.
It is important that no water use information that has already been entered in tabs 5-1A and 5-1B appears in Tab 6.
1.
Columns C, D and E—indicate the location, type and details for each process/piece of equipment
2.
Column G—indicates how much water is used by the specified end use in ML/year. Here you will have to use
assumptions and calculations specific to your premises
3.
Columns J and K—indicate the general condition of equipment or machinery and provide comments on how
you estimated the consumption
4.
Column I—will automatically indicate ‘Y’ (yes a sub-meter is recommended), if an individual end use
accounts for greater than 30 per cent of the total water use for the premises. This is not a mandatory
requirement and it will be up to individual water service providers to decide whether or not they support this
approach by their customers.
If column I is highlighted red with a ‘Y’ upon completion of tab 6, it is suggested that you discuss this with your
water service provider contact person.
Use NA (not applicable) where general condition does not apply.
Example 1: Leaking tap at a rate of 0.5L/min unfixed for three days:
Leak = 0.5 * 60 * 24 * 3 = 2,160L / 1,000,000 = 0.002ML/year
Example 2: Cleaning of 100m2 of shopping centre communal areas (tiled floor). The cleaner may report that
they use three buckets of 20L filled up to half-way (10L each) per day. An additional two half buckets are used
to clean the female and male toilets. The premises are cleaned once a day, 360 days per year in total:
Mopping = (30 + 10 + 10) * 360 = 18,000L / 1,000,000 = 0.018ML/year
Example 3: Cooling of a steel welder—a small localised hose at 2.5L/min is used to cool the equipment. The
welder is used approximately 9 hours per day 260 days per year.
Cooling steel welder = 2.5 * 60 * 9 * 260 = 351,000L / 1,000,000 = 0.351ML/year
For other examples refer to the WEMP samples.
3.5.1
Check balance
Once you have identified and recorded all your end uses, and their volumetric use, check cells D4 to D8.
Image 6—Checking the volumetric balance
19
Water Efficiency Management Plan: Template User Guide
Check these cells
These cells are used to determine how much of the premises’ water use has been accounted for. Cell D8 provides
the percentage difference between the two. In theory, you should have more metered use than modelled use and D8
should be a positive value.
Note: as much as 10 per cent difference is considered acceptable.
3.5.1.1
Percentage difference is higher than 10 per cent
Image 7—Percentage difference
Difference is higher than 10%
If the percentage difference is over 10 per cent, you may have underestimated the water used by the various end
uses. Re-visit the end uses, including taps, showers, toilets and urinals, and ensure that all end uses have been
identified and reasonable estimations have been applied. You may have missed a piece of equipment or water using
process, or there could be a leak in the network.Modelled use is more than your metered use (negative value in D8).
20
Water Efficiency Management Plan: Template User Guide
Image 8—Negative percentage difference
Difference is a negative value
This will give the illusion that the premises are producing water, and is therefore incorrect. In these cases, it is
possible that you have overestimated in your assumptions, so re-visit your calculations in order to achieve a
positive value in D8.
It could be possible that your meter is not working properly, and therefore, under or over recording your premises’
consumption. This would need to be investigated by a licensed plumber. In these cases, include meter error as an
end use.
3.6
Tab 7—End use totals
This tab is calculated for you and adds all the end uses together. Be aware that column H will not automatically fill
until you have indicated your water saving measures further on in the template.
Ensure you click on the ‘Click this first’ button before moving forward.
If a red ‘Check savings’ box appears at the top of column H, it indicates that the corresponding red cell(s) further
down the column is incorrect. The savings from this end use are higher than the water used. If this ‘Check savings’
box appears, you will need to go back and check the figures for this end use entered into tab 6.
3.7
Tab 8—End use summary chart
This tab presents the water balance as requested in the guideline. It will be calculated for you. Review the pie chart
and see where your highest uses are to identify your biggest potential for savings.
21
Water Efficiency Management Plan: Template User Guide
4
Water savings and action plan
Now that you have identified your water use, it is time to identify the potential for savings. The next section of the
template provides an analysis of the potential savings for your premises.
Use the WEMP Water Using Features Checklist and WEMPWater Saving Measures Checklist to identify potential
savings options, available from the department's WEMP page at <www.derm.qld.gov.au>. The checklist provides a
number of ideas on water saving actions which can be used for a range of different business types. These are
grouped into end use categories for ease of application to your premises.
The checklist is designed as a starting point for businesses to begin to identify possible water saving actions.
Businesses are encouraged to develop their own additional water saving measures relevant to the water use
identified during the water audit.
Look at the pie chart in tab 8 and check which uses are your highest..
4.1
Tab 9-1—Water saving measures
Once you have identified all the potential water saving measures, insert them in this tab. Note: even if a measure is
entered in this tab, it still requires economic assessment in tab 9-2 before a decision is made to include it as an
action outcome of the WEMP.
1.
Column D—select the appropriate end use category for each measure from the list of options available in the
yellow boxes. If the options box appears blank when you initially click on the drop down menu, use the scroll
bar on the right hand side of the box to scroll to the top of the list
2.
Column E—describe the savings/efficiency measure
3.
Column F—insert any savings from the measures that were achieved prior to the WEMP being prepared
4.
Column G—select the first quarter after the completion of your WEMP from the drop down menu in cell G8.
Next identify how much water saving will be achieved for the first quarter the savings measure is
implemented
5.
Columns H, I and J—insert the subsequent quarters' expected savings.
Use the different quarters for seasonal or one-off savings (for example , fixing leaks).
If you have calculated your savings annually, insert the annual value in column G, leave columns H to J blank, and
insert a comment in column N (comments).
Tabs 5-1A, 5-1B and 5-2 have calculated savings by upgrading fixtures and cooling towers. Link the savings cell to
the value from those tabs for each measure.
22
Water Efficiency Management Plan: Template User Guide
Example: You have an estimated 1.2ML/year savings by upgrading toilets to 4.5/3 dual flush cisterns. In tab 51B the results present as:
Image 9—Estimated end use water savings
Cell Z6 shows savings in
ML/year
Cell Z6 shows savings in ML/year
In tab 9-1 you will include ‘Upgrading toilets to 4.5/3 dual flush cisterns’ as an action. In tab 9-1, cell G10,
insert the link to the savings cell for toilets by writing the equation = ‘5-1B Toilets & Urinals’!Z6 (see further
images below).
Image 10—Equation for linking potential water savings to Tab 5-1
Insert link to Tab 5-1B Toilets & Urinals cell Z6
Because cell Z6 of tab 5-1B provided annual savings, and the savings will be continuous, leave the remaining
quarters blank.
4.2
Tab 9-2—Economic assessment
This tab will provide an economic assessment of all the savings options you have identified in Tab 9-1.
First insert the current costs for your business of water and trade waste.
23
Water Efficiency Management Plan: Template User Guide
Image 11—Water and trade waste costs
The cost per kL for water and trade waste will be specified on your water bill.
1.
Column G—insert the capital costs of the project.
Example: A water efficient showerhead may cost $19.89. If a business needs to install four showers, the capital
cost of the project = 19.89 x 4 = $79.56
Look at the costs of purchases required for the project.
2.
Column H—insert the installation or other implementation costs.
Example: A plumber may charge $100 to replace the showerheads for the project.
3.
Column J—insert the cost savings you will receive from the water saved.
Use the water cost (identified in cell E4) and the total water savings per year (in column F) to calculate the water
cost savings.
Example: By upgrading the four showers, a business would save 0.6ML/year. The business' water service
provider charges $1.39 per kL of water.
The cost savings for water = 0.6 x 1000 = 600kL/year x 1.39 = $834 per year
4.
Column K—insert the cost savings from trade waste saved.
Use the trade waste cost (identified in cell E5), and the total water savings per year (in column F), to calculate the
trade waste cost savings.
Shower water is disposed to the sewer and therefore will also represent trade waste savings. End uses that do not
release to sewer (for example, garden watering), will not save trade waste—leave this blank.
Example: By upgrading the showers, a business would save 0.6ML/year. The business' water service provider
charges $0.80 per kL of trade waste.
The cost savings for trade waste = 0.6 x 1000 = 600kL/year x 0.80 = $480 per year
5.
Column L—insert any maintenance costs for the project.
Some projects will not have any maintenance costs, or savings—leave this blank.
24
Water Efficiency Management Plan: Template User Guide
Example: All four showers were in very poor condition and leaked constantly. A plumber was required to repair
the continuous leaks. By upgrading the showers, the business will save approximately $100 per year in
maintenance costs. Maintenance costs in column L = -$100
6.
Column M—insert any energy savings from the project.
There are many different ways to calculate the energy savings for a project. Look at the cost of kW/hour in your
energy bill and the time (hours) you will save from the project.
Some projects will not have any energy savings—leave this blank.
Example: By upgrading the showers, the business will save 600kL per year. In general, showers are taken warm
so an estimation of 50 per cent of the water is hot water. This equates to a hot water saving of 300kL per year.
Sydney Waters best practice guidelines for water conservation in commercial office buildings and shopping
centres uses a value of $3.131 per kL of hot water (refer to page 24). Using this value, the savings for energy
use in the template = 300kL x $3.131 = $939.30 per year.
Ensure you are consistent with the cost for energy per kL for all projects. Explain any basis in the comments
column.
4.2.1
Check the payback period
The template calculates the payback period for the project. Check this to decide if the project is feasible or not.
It is generally recommended that all water saving actions, with a payback period of less than four years, be
implemented.
Example: For the upgrade of the showers, the payback period is 0.1 years. The business has the potential to save
up to $2300 in a year by upgrading them, and saving 0.6ML of water per year.
Image 12—The payback period
It is possible that a negative value may be achieved in column N: Total Savings, if additional energy costs or
maintenance costs out way trade waste or water supply savings. If this is the case, a negative payback period
would be achieved and payback would never occur. If the result for column N is negative, the payback column
will automatically be blocked out to indicate there is no relevant payback period. This will carry over into tab 93: Action plan.
4.3
Tab 9-3—Action plan
An action plan will be completed based on your identification and assessment of water saving actions in tabs 9-1
and 9-2.
1.
Column D—identify if you wish to implement the action.
If the payback period is more than four years, it does not make business sense to implement the savings measure.
25
Water Efficiency Management Plan: Template User Guide
2.
Column N—indicates the person who will be responsible for implementing the action.
3.
Column O—indicates a target completion date.
Check cells D3 to F6 to see your target savings and KPI by implementing the selected measures.
Although the WEMP is now ready to be provided to the water service provider, it will not remain static. Once you
have completed water savings actions from your plan, ensure to return to tab 9-3 to record your progress by using
columns P and Q.
4.4
Submitting your WEMP
In most cases, it is likely that your water service provider will require you to submit your WEMP in hard copy
(printed) format. If this is the case, once the template is completed, each page can be printed using the Excel print
function. Once printed, the WEMP authority can sign in the spaces provided in the Checklist and tab G3.
If your water service provider prefers electronic submission, an electronic signature block should be used by the
WEMP authority in the checklist and tab G3.
4.5
Reporting and review
Once the WEMP has been approved, it is important that water consumption is tracked and benchmarked against the
KPI. Under section 56 of the Act, non-residential customers who have an approved WEMP are required to provide
a written report to the water service provider annually advising of:
a.
the extent to which the plan has been implemented (that is, the water saving actions implemented to date)
b.
the water savings and efficiencies achieved by implementing the plan
c.
any change of circumstances in relation to the matters mentioned in section 57(1)(a) of the Act. For
example, any additional water saving practices, apart from those outlined in the WEMP, that the nonresidential customer has had to implement in response to a severe water shortage etc.
Use columns P and Q to track deliverables, and the comments section to indicate any issues or successes achieved
by implementing your WEMP.
In addition, by tracking water consumption and CAU, you can track the water savings achieved by the different
implemented actions. Use the WEMP Meter Reading Template to continuously track your water consumption and
monitor your KPI. The meter reading template can be downloaded from the department's WEMP page at
<www.derm.qld.gov.au>.
26
Water Efficiency Management Plan: Template User Guide
5
Glossary
Terms used for the purpose of this user guide
Baseline water use
Volume of reticulated water consumed during the period of no less than 12 months before the audit (or a time
period approved by the water service provider) forming the basis for the water balance.
Benchmarking
The process of comparing performance with other organisations, identifying comparatively high performing
organisations and learning what they do to achieve that high level of performance.
The process includes identifying and observing the best practices from one or more benchmark organisations.
Best practice
Methods and techniques that have consistently shown results, superior to those achieved with other means, and
provide benchmarks for which to strive. There is, however, no practice that is best for everyone, or in every
situation, and no best practice remains best for long as people continually improve on ways of doing things.
(Source: BusinessDictionary.com).
Commercial activity unit (CAU)
The units used by a non-residential customer to measure or benchmark their commercial activity. The units should
be comparable to water use and will depend on the objectives of the operations undertaken at the premise(s). This
may include, but are not limited to, kilograms, tonnes, litres, staff, students, passengers, visitors, square metres and
gross floor area.
Commercial buildings
A commercial building includes a building(s) where the significant end uses of water are for cooling towers and
fittings and fixtures (including taps, showers, toilets and urinals), for example, office buildings. In this definition,
the term significant end use means when the end use of water is equal to or more than 85 per cent of total water
used on the premises (excluding unplanned uses).
Cooling tower
An open reticulating cooling water system used to extract heat from processes or equipment on premises, including
air conditioning, chillers and industrial processes.
Key performance indicator (KPI)
A quantifiable measurement that accurately reflects the water use for the commercial activity conducted at the
premises and permits benchmarking with historical water use or other like businesses. The relevance of a KPI is
strongly dependent on selecting an appropriate commercial activity unit.
ML (Megalitre)
One million (1,000,000) litres of water. This equates to 1,000 kilolitres (kL).
Payback period
The number of years needed to recoup the initial investment for each water efficiency measure.
Reticulated (town) supply system
A system of water distribution infrastructure, operated by a water service provider, delivering potable (drinking
quality) water to premises in the local government area of the service provider. Delivery may be directly to the
premises through the distribution system or indirectly to the premises in a water tanker or other container
containing water that has been sourced from the service provider’s supply system.
The system also includes a rainwater tank which contains any water sourced from the reticulated water supply
system, including rainwater tanks employing a trickle top-up system.
27
Water Efficiency Management Plan: Template User Guide
TDS
Total dissolved solids—a measure of the salinity of water, expressed in mg/L.
Water use inventory
A catalogue of all water using fittings, fixtures or equipment on site.
Terms as defined in the Water Supply (Safety and Reliability) Act 2008 (the Act)
Non-residential customer
A customer of a water service provider who uses water on non-residential premises.
Non-residential premises
Premises that are not used for ordinary residential purposes, including tourist accommodation, nursing homes,
hostels, hospitals, caravan parks, convents, nurseries, market gardens, turf farms, farms, conference centres and the
common property of a community title scheme under the Body Corporate and Community Management Act 1997
or the Building Units and Group Titles Act 1980.
Recycled water
Any of the following that are intended to be reused:
a)
sewage or effluent sourced from a service provider’s sewerage
b)
wastewater, other than water mentioned in paragraph (a).
Wastewater
The spent or used water generated on premises from industrial, commercial or manufacturing activities, or animal
husbandry activities, other than spent or used water generated from:
a)
an agricultural activity; or
b)
a mining activity chapter 5A activity as defined under the Environmental Protection Act 1994, schedule 4.
Water entitlement
a)
a water allocation; or
b)
an interim water allocation as defined in the Water Act 2000, schedule 4; or
c)
a water licence.
Water service provider
A person registered under Chapter 2, part 3 of the Act, as a service provider for a water service.
28
Water Efficiency Management Plan: Template User Guide
6
Attachment 1—38 Brown Street (WEMP
Sample 1) water efficiency policy
Water Efficiency Policy Statement
Brown Street Property Management Pty Ltd is committed to achieving efficient water use in its buildings. As such
we will endeavour to:
•
Promote the use of water efficient devices and practices
•
Monitor, measure and report on the water consumption on our premises
•
Provide water efficiency training to staff who use water as part of their duties
•
Encourage patrons to use water efficiently whilst on our premises
•
Implement appropriate maintenance procedures to minimise water loss
•
Continually improve our water usage towards meeting best practice targets
___________________________________
Signed: Office Manager
________________
Date:
29
Water Efficiency Management Plan: Template User Guide
7
Attachment 2—38 Brown Street (WEMP
Sample 1) water efficiency information for
staff
Water Efficiency Information
Brown Street Property Management Pty Ltd is committed to the efficient use of water in its office buildings. This
water efficiency information is for the office building located at 38 Brown Street. The building has recently
undergone a detailed water audit and prepared a Water Efficiency Management Plan (WEMP) identifying potential
for water savings.
WEMP results
At the time of the audit 38 Brown Street was performing at 62.8 litres per staff member per day. Of the total water
use 50 percent is used by taps and 27 percent by toilets. The WEMP has identified these two end uses as having
potential for savings. We will be upgrading all fixtures, including toilets and taps on floors 1-4 in the next three to
six months.
With these upgrades and better maintenance of the cooling tower and better cleaning practices, 38 Brown Street is
aiming to achieve a 41 percent reduction from the water use in the last financial year, equating to a target future use
of 36.97 litres per staff member per day.
WEMP actions
Brown Street Property Management Pty Ltd has allocated a budget for completing WEMP actions and promoting
continuous improvement. We acknowledge that water efficiency is everyone's responsibility and as such, we have
developed an education campaign which includes the following actions:
•
Signage has been placed in all the bathrooms indicating that staff should reduce their water use by taking
showers shorter than four minutes, turning off the tap while soaping their hands and where appropriate using
the dual flush option on the toilet suites.
•
Newsletter now includes a section on water efficiency. This section will announce upgrades and weekly litres
per staff member per day (L/staff/day) results.
•
Monitoring of our water meter will occur on a weekly basis. Any increase in water consumption over 10
percent will immediately be investigated.
•
Cleaners have been involved to identify further potential for water savings and immediately report any leaks.
•
Reporting leaks will be rewarded with a coffee voucher. Leaks must be reported to Jane Doe.
•
Cooling tower maintenance will occur quarterly.
•
Encouragement of new technologies and water savings ideas through a quarterly staff challenge. Winners of
the challenge will receive a $50 voucher.
Please contact Jane Doe if you have any queries or ideas regarding water efficiency on your floor. Remember to
report leaks immediately as they may result in large wastage of water.
Saving water is everyone's business!
Brown Street Property Management Pty Ltd
30