1
10.3.2
Using the VisIt CLI (command line interface)
We will now perform exactly the same steps as in the last section but using the python interface of VisIt instead of
the GUI. Start up the CLI by issuing
visit -cli
You should now see an empty visualization window but unlike in the previous section there will be no graphical
user interface but a python command line instead. Enter the following commands, one by one, noticing the changes
in the visualization window after every block of commands:
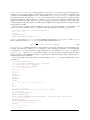
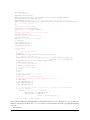
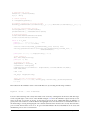
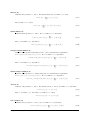
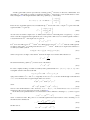
OpenDatabase("deform.vtu")
AddPlot("Pseudocolor","stress")
DrawPlots()
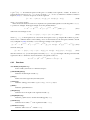
p=PseudocolorAttributes()
p.centering=p.Nodal
SetPlotOptions(p)
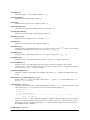
AddOperator("ThreeSlice")
DrawPlots()
t=ThreeSliceAttributes()
t.x=0.3
t.y=0.3
SetOperatorOptions(t)
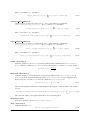
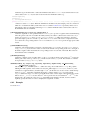
AddPlot("Vector", "disp")
DrawPlots()
v=VectorAttributes()
v.useStride=1
SetPlotOptions(v)
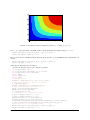
s=SaveWindowAttributes()
#change settings as required
SaveWindow()
exit()
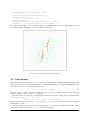
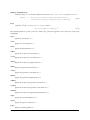
All but the last call to DrawPlots() is not required and was only put there for demonstrating the effects of
the commands. You can save these commands to a file, e.g. deformVis.py and let VisIt process them noninteractively like so:
visit -cli -nowin -s deformVis.py
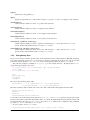
The -nowin option prevents the visualization window from being shown which is not required since the purpose
of the script is to save an image file.
Obviously, we have barely touched on the powerful features of VisIt and this section was only meant to give
you a minimal introduction. The VisIt website has a reference manual for the python interface that explains how to
perform other operations programmatically, such as changing the view.
138
10.3. Visualizing escript Data