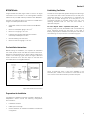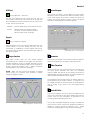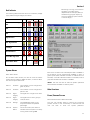
1
INSULOGIX® B User Manual - Revision 3.8 Power Factor/TanDelta Monitoring System For Transformer Bushings, Current Transformer Bushings, and Lightning Arrestor Leakage Current Monitor High-Voltage Equipment - Read the entire manual before operating Copyright 2013 by WEIDMANN All rights reserved. Reproduction without written permission is prohibited. Specifications are subject to change without notice. 05/13 Contents Contents Section 1 - INTRODUCTION 1 Receiving Instructions 1 InsuLogix® B 1 Hardware 1 Software 1 Introduction to InsuLogix® B 1 PF and Insulation Stability 1 Continuous Monitoring of PF and other devices 2 Section 2 - SAFETY 3 Section 3 - InsuLogix® B HARDWARE INSTALLATION 4 Specifications 4 InsuLogix® B Cabinet 4 Bushing Tap Coupler (BTC) 4 BTC/MTU Cable 5 Pre-Installation Instructions 5 Preparations for Installation 5 Establishing Test Points 5 Installing the BTC 6 Installing the InsuLogix® B Cabinet 6 InsuLogix® B Power and Input/Output Connections 7 Power Source Connections 7 AC/DC Input Signal Connections 7 Digital Alarm Outputs 8 Analog Alarm Outputs 8 Touch Panel Display 8 Current Sensor Connection 9 SECTION 4 - InsuLogix® B CONFIGURATION AND OPERATION 11 InsuLogix® B software 11 Introduction 11 Access Control 11 InsuLogix® B Control 11 iii Contents Settings 11 Configuration 13 Diagnostics 17 Utilities 19 Advanced Tools 19 InsuLogix® B Monitoring 20 Before Running Monitoring 20 Main System Display 20 System Alarms 22 Other Functions 22 The Monitoring Process 23 InsuLogix® B Graphs 24 Main Display 24 Types of Graphs 25 Changing the Data Source 26 Export Data 27 Reports 27 Troubleshooting 28 Database Structure 28 Database Files 28 Database Table Structure 29 Backup/Archival Considerations 29 Section 5 - CONSOLE OPERATION 30 Installing pcAnywhere for Remote access 30 Remote Connection Using pcAnywhere 30 Remote Connection Using Windows® Remote Desktop Connection 31 Section 6 - COMMUICATIONS OPTIONS 32 Modem Connection Option 32 Network Connection Option 32 UCA Server Option 32 Introduction 32 UCA Server Input 32 UCA Server Output 33 DNP3 Option 33 Ethernet Settings 33 iv Contents RS232 33 Configuration file 33 Operating the form 34 Items that cannot be changed 34 TCP/IP Validation Rules 34 DNP Address Validation Rules 34 Classes 34 Published Data 34 Bushings 34 Level devices 35 Items in the Configuration File 35 DNP3 Points List 36 SECTION 7 - MAINTENANCE 37 Periodic Testing 37 Repair 37 Appendix A - Installation Checklist 38 Appendix B - Software License Agreement 39 Appendix C - Substation Visual Inspection Procedure 41 Equipment Required 41 Process Steps 41 Warranty 42 v Section 1 Section 1 - INTRODUCTION Receiving Instructions It is very important that the equipment received is checked against the packing list to ensure that all materials are present. Notify WEIDMANN of any shortage at +1 802 748 8106 or e-mail to [email protected]. Please examine the equipment for damage received in transit. If any damage is discovered, file a claim with the carrier at once and notify WEIDMANN or nearest authorized sales representative, giving a detailed description of the damage. The system has been thoroughly tested and inspected to meet rigid specifications before being shipped. It is ready for use when set up as indicated in this manual. InsuLogix® B WARNING BEFORE REPLACING FUSES, DISCONNECT THE POWER FROM THE INSULOGIX® B, AND GROUND THE INPUTS FROM THE MONITORED DEVICES This continuous on-line monitoring system (hereafter referred to as the system or as InsuLogix® B) is a costeffective, software-oriented, PC-based monitoring system running under Windows and using a standard SQL database for data storage. The system consists of specially designed hardware and software: Hardware • • • • • • • • • Bushing Tap Coupler (BTC) InsuLogix® B Cabinet (maximum of 32 AC or DC) Input Conditioning for up to 30 AC signals (3 per AC Input Board) DC Input Board for up to 8 DC level signals per board PC/104 Pentium MMX CPU Module 1GB DiskOnChip Memory Unit 500KHz PC/104 Analog-to-Digital Conversion Module Watchdog/Alarm Board (6 Alarm Outputs – 2 Digital/Analog Outputs) Optional Fiber Optic Network capability for 1300 nanometer multimode fiber optic cable with ST connectors Introduction to InsuLogix® B The InsuLogix® B is a continuous on-line monitoring system, for monitoring power factor in high voltage capacitive bushings, is now available with an optional leakage current monitor for high voltage lightning arresters. The system includes a minimum set of three sensors permanently connected to a series of capacitive bushing taps, or lightning arresters. It is based on the field proven SOS TanDelta System. The system is capable of monitoring up to 32 direct connected sensors, and up to 256 wireless sensors. The system acquires, analyzes, and trends data pertaining to AC Insulation Power Factor of Bushings and/or HV Current Transformers, and leakage current of lightning arresters. The InsuLogix® B system can also interface to signals from other devices, or IEDs, such as: temperature sensors, DGA, or any 0-10Vdc, 10V peak, 4-20mA, or 0-1mA signal. Providing single point access of transformer mounted sensors. Data can be downloaded on-site, or remotely. The system can also interface to an existing EMS system via a LAN/WAN, or dial-up connection to an IEC 61850 (UCA2.0TM ) network PF and Insulation Stability The deterioration of oilpaper insulation in high-voltage (HV) equipment is a matter of continuous concern. Normal aging of HV equipment is a slow process that takes place over 30 to 40 years due to thermal, electrical and environmental effects. Premature failure on the other hand is often a relatively sudden process that is not detected by periodic offline tests. This prompted the need for continuous on-line insulation condition monitoring to manage the risk factor and to initiate maintenance procedures based on the condition of the insulation. The power factor (PF) calculation in the InsuLogix® B system is based on the conventional Schering Bridge used in laboratories. Data is acquired under software control from transducers connected to the test objects associated with a transformer and then the data is compared to data from another electrical phase to produce a power factor value. The eventual breakdown of insulation is a rapid avalanche of failing dielectric layers. Damaged or deteriorated dielectric is associated with: • Increased dielectric losses (I2R) with other sources of heating may eventually fuel a mechanism of thermal runaway. PF is a measure of dielectric losses. • Partial discharges and treeing. High levels of partial discharge are reflected in the PF and are usually only present just after lightning or switching impulses and just before and during insulation failure. • Increased sensitivity to changes in temperature, humidity, and moisture (i.e., increased temperature coefficient). Sources of heating include dielectric losses, ambient temperature, and more significantly, load fluctuations. Software • • • InsuLogix® B Software Symantec PCAnywhere Optional UCA 2.0 compatible device server 1 Section 1 The concept of measuring PF is based on the derivation of the phase shift between two voltage signals. The method is similar to the standard bridge methods, but software is used for angle difference determination. The measurement of PF of insulation is accepted as part of well-established laboratory testing procedures to determine the quality of insulation at the factory before commissioning new and refurbished HV equipment. PF as a parameter is by nature a relatively slow-changing value and is an integral characteristic depending on: • Design, materials and production technology • Operating voltages and temperatures • Aging of insulation related to design and operating conditions such as over-voltages, loading conditions, etc. • Climatic/Weather related Phenomenon The system calculates the PF of a unit as a relative value compared with a reference voltage from another unit in service, thereby eliminating the need for a standard capacitor. The reference device does not have to be associated with the same phase since InsuLogix® B will automatically make the proper phase angle adjustments. Relative measurements and evaluation can reduce the effect of influences such as ambient temperature, operating voltages, loading conditions, different aging characteristics, different designs, operating conditions, etc. The system uses a principle of cross-referencing units in a closed loop to confirm all measurements and increase the confidence of isolating a defective unit. Because the system uses relative measurements, the minimum number of units to be monitored is three. Continuous Monitoring of PF and other devices The dictionary defines “continuous” as “without interruption.” However, in the context of continuous on-line monitoring, the selected time between measurements must be sufficiently short so that the process can be considered, for all practical purposes, continuous. All measurements are tested for integrity against three parameters: rms and mean of the signal, and the PF value calculated. Only measurements passing the integrity tests are stored in the database. The default monitoring period is once every 5 minutes. This setting can be changed from once a minute, to once per day. The sensors are configured into the graphical user interface by the user during installation. Each monitored device is entered into the database with an acquisition channel number, and descriptive text. The condition of each monitored device is displayed on the monitor screen. See section 4 of this manual detail of software setup and operation. 2 Section 2 Section 2 - SAFETY The system and the specimen to which it is connected are a possible source of HV electrical energy and all persons making or assisting in tests must use all practical safety precautions to prevent contact with energized parts of the test equipment and related circuits. Persons actually engaged in the test must stand clear of all parts of the complete high-voltage circuit, including all connections, unless the test set is de-energized and all parts of the test circuit are grounded. Persons not directly involved with the work must be kept away from test activities by suitable barriers, barricades, or warnings. Treat all terminals of HV power equipment as a potential electric shock hazard. There is always the possibility of voltages being induced at these terminals because of proximity to energized HV lines or equipment. Always disconnect test leads from power equipment before attempting to disconnect them at the system. The ground connection must be the first made and the last removed. This equipment operates from a single-phase power source and requires a two-pole, three-terminal, line, neutral, and earth type source. The voltage to ground from the line pole of the power source must not exceed the maximum rated operating voltage. The neutral pole must be at ground potential. Before making connection to the power source, determine that the instrument rating matches the voltage of the power source. Safety is the responsibility of the user. Follow your company safety procedures at all times. Qualified personnel who are familiar with the construction and operation of the system and the hazards involved must only perform corrective maintenance. Refer to IEEE 510 - 1983, "IEEE Recommended Practices for Safety in High-Voltage and High-Power Testing," for additional information. If the test equipment is operated properly and all grounds correctly made, test personnel need not wear rubber gloves. As a routine safety procedure, however, some users require that rubber gloves be worn, not only when making connections to the HV terminals, but also when manipulating the controls. WEIDMANN considers this an excellent safety practice. Users of equipment should note that HV discharges and other sources of strong electric or magnetic field might interfere with the proper functioning of heart pacemakers. Persons with heart pacemakers should obtain expert advice on the possible risks before operating this equipment or being close to the equipment during operation. Warning and caution notices are used throughout this manual where applicable and should be strictly observed. These notices appear in the format shown below and are defined as follows: WARNING WARNING, AS USED IN THIS MANUAL, IS DEFINED AS A CONDITION OR PRACTICE THAT COULD RESULT IN PERSONAL INJURY OR LOSS OF LIFE. Misuse of this HV equipment can be extremely dangerous. The purpose of this equipment is limited to use as described in this manual. Do not use the equipment or its accessories with and device other than specifically described. Never connect the system to energized equipment. CAUTION CAUTION, AS USED IN THIS MANUAL, IS DEFINED AS A CONDITION OR PRACTICE THAT COULD RESULT IN DAMAGE TO OR DESTRUCTION OF THE EQUIPMENT OR APPARATUS UNDER TEST. Do not use the system in an explosive atmosphere. 3 IsolatedAlarm ContactOutputs 6Contacts,MaxDC200V,MaxCurrent DC1A. DigitaltoAnalog OutputChannels 2(12BitChannels),+/5,0to5,or0to 10VoltsAnalogOutputrange. • Dimensions The InsuLogix® B Cabinet shown in the following figure contains all the equipment required to condition the input signalforacquisitionandtoprovideelectricalprotectionand isolation. The capacitance rating of the AC Input Boards in the InsuLogix® B Cabinet must be chosen so that they are tuned to the capacitance of the bushings or CTs being monitored. These signals are then routed to an Analog to Digital Converter and the resultant Power Factor variables are stored in an onboard long term memory device for periodic statistical analysis to determine if an insulation deteriorationconditionexists. 20in.Tallx16in.Widex8in.Deep (49cmx40.64cmx20.32cm) Weight:45lbs(10.45Kg) 45 lbs (20.4Kg) • Environmental BTCandInterfaceCabinet:40oCto +65oC,0to95%humidity noncondensing PollutionDegree1 • PowerSupply Isolatedsupplytocabinet110/220V AC,50/60Hz,40W InsuLogix®BCabinet NumberofACanaloginput channels 30ACMax(3perACInput Board) Inputimpedance 50Ω(<1kHz) Signalinputmode Differential Maximumfullscalevoltage 60Vrms Operatingvoltage 29Vrms Isolationbetweeninputs 3000V Surgewithstandcapabilities ANSI/IEEC37.90.11989IEC 254 NumberofDCanaloginput channels 32DCMax(requiresan8 channelDCInputBoard) ABTCisusedinconjunctionwithacapacitivedividercircuit intheInsuLogix®BCabinettoproduceameasurablesignal from the test object (CT or bushing). BTCs are essentially capacitive transducers with protection and signal conditioning limiting continuous voltage to 29 V RMS. Each BTC and InsuLogix® B Cabinet are configured and supplied withaspecificdesignationtoatestobjectinthesubstation so that it is tuned to the capacitance of the bushing or CT. The BTC circuit is contained in a watertight container, complyingwithNEMAtype4protectionclassification. DimensionsandWeight: BTCVariesdependingonthebushingtypeand manufacturer. The BTC mounting varies depending on the type of CT or bushing to be monitored. Refer to PreInstallation InstructionsandInstallingtheBTCformountinginstructions. TypicalBTCs Section 3 BTC/MTU Cable Establishing Test Points Single Twisted Pair (STP) signal cable is used for all signal transmission from the BTC to the InsuLogix® B Interface Cabinet. A fifty foot (50) cable is provided for each BTC/MTU. The last foil of the capacitive graded HV equipment (bushings for Transformers and Current Transformers) is the test point (otherwise referred to as measurement or capacitive tap point). This is either brought out as a test point or it is connected internally to the base metal of the unit. The following scenarios exist for units with and without a capacitive test point: However, the cable may be up to a maximum of 1000 feet in length. The cable specifications are: • Single STP: rated for 2 kV AC insulation levels (Belden 9342). • Minimum shield/drain gauge > 0.7 mm2 • Minimum core gauge > 0.7 mm2 • Individual and overall STP bundles with several individually shielded pairs in each. • Overall shielding with drain wire. • Minimum drain wire gauge > 1.0 mm2 For test objects with a capacitive test point: On a bushing, a test point may be available under a removable cap which otherwise grounds the test point. In this case a Bushing Tap Coupler is needed for the test point that houses the measuring circuitry as shown in the following figure. Pre-Installation Instructions Before starting the installation, it is important to understand the overall system layout and cable and shield connections. Read and understand Section 2, Safety, before installing the system. The following figure shows the signal cable and shield connections from the test object to the BTC and terminated at the InsuLogix® B Cabinet. Test Bushing with BTC connected Some CT Bushings have a test point available in the secondary box, where a link connects it to the base of the unit. This link should be removed to provide a test point. Signal Cable and Shield Connections Preparations for Installation Complete the Installation Checklist, provided in Appendix A. Preparations should include the following configuration documentation: • Installation schedule • Cable layout and length • Channel allocation for hardware installation and software configuration 5 Section 3 InsuLogix® B PFLive Plus ElementaryDiagram Diagram Elementary J2-1 BTC In + J2-2 A1 J4-1 Condition Change Green to Yellow J4-2 BTC GND J2-3 Chasis GND J2-4 BTC In + J2-5 J2-6 Chasis GND J2-7 J4-3 J4-4 A3 J4-5 Unit Down Alarm AC INPUT BD. SIGNALS Boards A-E Channels 1-15 BTC GND A2 Condition Change Yellow to Red OUTPUT ALARMS WDT PCB J4-6 A4 J4-7 Vector Group Down Alarm J4-8 J4-9 A5 CF Alarm J4-10 BTC In + J2-8 BTC GND J2-9 The BTC is coupled mechanically and electrically to the tappoint of each test object via an appropriate adapter bolted or threaded onto the bushing. The BTC is placed physically close to the test point to secure a safe signal voltage through adequate voltage division and protection. See the following figure. A6 J4-11 Health Alarm normally energized J4-12 Chasis GND To InsuLogix® B Cabinet J4-13 TB-1 TB-2 TB-3 SCADA output voltage AOUT1 Worst Case bushing condition Line Neutral Earth AC POWER IN 85/240 VAC(setting) 50/60 Hz 40 Watts J4-14 BTC Connection Diagram J4-15 SCADA output voltage AOUT2 Average Condition Value Optional J4-16 CAUTION J2-1 Input 1 (Channel 9) J2-2 Input 2 (Channel 10) J2-3 Input 3 (Channel 11) J2-4 J2-5 J2-6 Input 4 (Channel 12) Input 5 (Channel 13) Input 6 (Channel 14) J2-7 Input 7 (Channel 15) J2-8 Input 8 (Channel 16) J2-9 THE SCREEN DRAIN OF EACH TWISTED PAIR MUST NOT BE GROUNDED TO SUBSTATION EARTH AT THE BTC OR TEST OBJECT. THE ONLY POINT TO WHICH THE INDIVIDUAL STP SCREEN DRAIN IS CONNECTED TO EARTH IS VIA THE TERMINAL BLOCKS IN THE INSULOGIX® B CABINET DC INPUT BD. (Optional) Connects to P3-6 on output bd. Link Settable Inputs: 0-1ma 4-20ma +10V peak Signal Ground VIDEO VGA RJ45 Ethernet Connection Key DB15-fm Mouse Optional Serial Port 1: RS232 DB9-male J1 PC Anywhere Access Serial Port 2: RS232 DB9-male Serial Port 3: RS232 DB9-male Serial Port 4: RS232 or 485 DB9-male Elementary Diagram Installing the BTC WARNING THERE IS ALWAYS THE POSSIBILITY OF VOLTAGES BEING INDUCED AT THE TERMINALS OF A TEST OBJECT BECAUSE OF PROXIMITY TO ENERGIZED HIGH-VOLTAGE LINES OR EQUIPMENT. A RESIDUAL STATIC VOLTAGE CHARGE MAY ALSO BE PRESENT AT THESE TERMINALS. GROUND EACH TERMINAL TO BE TESTED WITH A SAFETY GROUND STICK, THEN INSTALL SAFETY GROUND JUMPERS, BEFORE MAKING OR CHECKING CONNECTIONS. Installing the InsuLogix® B Cabinet Since each combination of BTC and InsuLogix® B Cabinet is manufactured and supplied to correspond to a designated test object, be sure the correct cabinet is installed. The following figure provides the dimensions and location of the mounting holes for the InsuLogix® B Cabinet. The Cabinet must be mounted low enough that test personnel can attach the Communications Cable from an external computer, yet close enough to the test object base or support frame to afford short connections to the BTCs assigned to this Cabinet. The InsuLogix® B Cabinet must be solidly connected to substation earth. 6 Section 3 InsuLogix® B Cabinet Mounting Dimensions InsuLogix® B Power and Input/Output Connections Power Source Connections The isolated power source should enter the cabinet via a weatherproof hole in the bottom of the cabinet and connected to the J1 connector on the WDT/ALARM board as shown in the Power Connections and Jumper Setting figure. The board has an “IN” designation next to the J1 connector and “E” (Earth), ‘L” (Line), and “N” (Neutral) designations on the board from right to left indicating where the power cable should be connected. The jumper JMP1 in the lower middle of the WDT/ALARM board should be positioned to the left for a 110-volt power source and to the right for a 220-volt power source. There are “110” and “220” designators on the board next to the JMP1 jumper. WARNING THERE IS ALWAYS THE POSSIBILITY OF VOLTAGES BEING INDUCED AT THE TERMINALS OF A TEST SPECIMEN BECAUSE OF PROXIMITY TO ENERGIZED HIGH-VOLTAGE LINES OR EQUIPMENT. A RESIDUAL STATIC VOLTAGE CHARGE MAY ALSO BE PRESENT AT THESE TERMINALS. GROUND EACH TERMINAL TO BE TESTED WITH A SAFETY GROUND STICK, THEN INSTALL SAFETY GROUND JUMPERS, BEFORE MAKING OR CHECKING CONNECTIONS. ENSURE THAT THE OBJECT TO BE TESTED IS COMPLETELY DE-ENERGIZED AND DISCHARGED. Power Connections and Jumper Setting AC/DC Input Signal Connections WARNING THERE IS ALWAYS THE POSSIBILITY OF VOLTAGES BEING INDUCED AT THE TERMINALS OF A TEST SPECIMEN BECAUSE OF PROXIMITY TO ENERGIZED HIGH-VOLTAGE LINES OR EQUIPMENT. A RESIDUAL STATIC VOLTAGE CHARGE MAY ALSO BE PRESENT AT THESE TERMINALS. GROUND EACH TERMINAL TO BE TESTED WITH A SAFETY GROUND STICK, AND THEN INSTALL SAFETY GROUND JUMPERS, BEFORE MAKING OR CHECKING CONNECTIONS. ENSURE THAT THE OBJECT TO BE TESTED IS COMPLETELY DE-ENERGIZED AND DISCHARGED. The Installation Checklist (Appendix A) requires the capacitance values of each test object so the divider capacitance rating of the InsuLogix® B Cabinet can be selected before installation. Together with the BTC, the capacitor divider circuit in the InsuLogix® B Cabinet transforms the voltage across the Test Tap to a voltage signal of approximately 29V rms. The STP cable from the BTC is connected to the input terminals in the InsuLogix® B Cabinet. 7 Section 3 Each AC Input board in the InsuLogix® B cabinet can handle up to three AC input signals from the bushing tap couplers. The terminal block on the AC Input board has nine connection posts. Each STP from a BTC will use a set of three consecutive connections on the terminal block. The first input on this AC Input board will use the right set of three posts on the terminal block, the second input will use the middle set of three posts, and the third input will use the left set of three posts. The right most connector of each set of three connectors on the nine post terminal block is for the (+) positive signal, the middle connector is for the ground connection, and the left connector is for the shield connection in the STP. The following figure illustrates the terminal block on the AC Input board. Digital Alarm Outputs The digital alarm outputs are connected to the J4 terminal block on the WDT/ALARM board and are designated as “A1” thru “A6” on the board next to the J4 connector. It is highly recommended that at least three of these Digital Alarm outputs (A2, A3, and A6) be attached to external SCADA equipment so that the operational status of InsuLogix® B can be monitored at a remote location. The alarm conditions associated with these digital outputs are as follows: A1 Normally open and will close if the condition of a unit changes from green to yellow. A2 Normally open and will close if the condition of a unit changes from yellow to red. A3 Normally open and will close if the signal from a single unit is down. A4 Normally open and will close if the signals from a vector group (3 units) are down. A5 Normally open and will close if the available disk space on the computer is below the specified percentage. A6 Normally closed and will open if the Monitoring program stops (e.g. when the operating system crashes or the PC hangs). Analog Alarm Outputs This feature of InsuLogix® B can be used to convert two internal variables, such as selected condition values and display them as a voltage in the 0 to 10 volt range. They are designated as “A/01” and “A/02” on the WDT/ALARM board next to the J4 connector. The high side of the device receiving the output should be connected to one of these two posts and connect the low side of the device should be connected to the associated “GND” post. A/01 represents the worst case bushing condition value from 0 to 100%. The output voltage ranges from 0 to 10V DC the voltage level is a representation of the condition value of the bushing. For example, if the bushing condition value is 50%, then the voltage will be 5V DC. A/02 is an analog 0 to 10V DC voltage. The voltage level is a representation of the average condition value all of the bushings monitored. For example, if the average bushing condition value is 50%, then the voltage will be 5V DC. Typical AC Input Board Arrangement and Board Layout The DC Input board uses the same type of terminal block with nine connector posts. The right most connection is for DC channel 1 and up to eight DC channels can be monitored. The ninth connection on the terminal block is for the ground input. Touch Panel Display Some models of the InsuLogix® B have an optional LCD Touch Panel display mounted on the inner door. This allows the user to view the monitor screen and access the control program via the touch panel display. The display can be operated with a finger or stylus to access the control and graphs applications as well as the monitor screen. 8 Section 3 InsuLogix® B with Optional Display Some models of the InsuLogix® B Cabinet have a RED/YELLOW/GREEN condition value status LED mounted on the outer door of the enclosure. This LED indicates the status of the worst case bushing and matches color of the status LED as shown on the monitor Screen and detailed in section Main System Display. Green will indicate that all units are in a green condition, yellow will indicate that at least one unit has a yellow (warning) condition, while red will indicate that at least one unit has a red (alarm) condition. Off indicates that the analysis function has not been able to determine a condition value during system startup or that reference window data is being collected. Current Sensor Connection The Leakage Current monitoring option for Lightning Arresters consists of a minimum of three sensors, one for each phase. Each of these sensors has a bandwidth 50 Hz to 10 kHz. Its measuring capability is from 0.5 mA to 300 mA with accuracy in the μA range. The amplitude error is less than 1% and the phase shift is less than 1 degree. The sensor is well protected to survive lightning and switching surges. Typical Lightning Arrester Connection. Note: The Arrester base must be isolated from Ground. Increased levels of leakage current can be due to changes in either of the above two cases, and it would require corrective action. If a wash down of the surface pollutants of the ceramic does not decrease the leakage current, then the metal oxide blocks are changing their characteristics. Further off-line tests on the Lightning Arrester will confirm that they are not fully protecting the transformer, and that they should be replaced. The InsuLogix® B software is a field proven and versatile software that will accommodate the inputs from various IEDs. In the case of leakage current from Lightning Arresters, the data is obtained at a user settable interval, analyzed and stored. A Graphical indication of the changes in leakage current is displayed on the Monitoring Screen of the InsuLogix® B. The value of the leakage current will start filling the green bar from the bottom with yellow (Warning). A full yellow bar will start changing with Red from the bottom, as the leakage current further increases (Alarm). (See Figure below). Typical Monitoring Screen It is required that the Lightning Arrester be insulated at its base and has a single ground point. Lightning Arrester monitoring is achieved by connecting a Current Transformer across the Ground Strap of the Lightning Arrester to measure the total leakage current. This total leakage current is made up of 2 main components: 1. Surface Leakage Current caused by pollutants being deposited on the ceramic surface. 2. Resistive Leakage Current traveling through the metal oxide blocks due to the changes in the characteristics of the arrester material, requiring replacement of the Arresters. Monitoring Screen - 3 Lightning Arresters being monitored. A full yellow bar indicates a 70% change from the baseline leakage current value, and a full Red bar indicates a 100% 9 Section 3 change from the baseline value. On reaching either stage, the Plus system will provide an “Alarm”, or a “Warning”, indicating a potentially sensitive situation which requires immediate attention. As a level device an alarm point can also be set for an alarm when the leakage current exceeds a predetermined value. . The factory default setting is 5mA and is suitable for most lightning arrestors. However, the user should refer to the instruction manual of the lightning arrester or the manufacturer of the lightning arrester for the proper Alarm set point. This Alarm is reported on the monitoring screen and via SERIAL, DNP3, or IEC61850 communications. 10 Section 4 SECTION 4 - InsuLogix® B CONFIGURATION AND OPERATION entering without a password will only allow the user to use the diagnostic tools. InsuLogix® B software Introduction InsuLogix® B Control The InsuLogix® B software can be accessed from the InsuLogix® B program group (Start – Programs - InsuLogix® B x). The programs (x) in the InsuLogix® B suites are: • Control - This program is used for all configuration and diagnostics of the InsuLogix® B system. Please note that Monitoring should be stopped before executing Control. • Monitoring - This program performs the continuous monitoring and reporting of the insulation conditions and signal integrity in the substation. • Graphs - This program gives the user the ability to investigate data captured over time by Monitoring. The functionality in Control is grouped into settings, monitoring configuration, diagnostic tools, and other utilities categories. Settings Various settings controlling the operation of InsuLogix® B can be specified using Control. System Settings Menu: Settings - System Access Control Access to the Control program is restricted. Without the password, a user will not be allowed to change any information regarding the units in the system or any system settings. No password is needed to access the Monitoring program, as it must start up automatically with Windows without any user intervention or with the Graphs program as it is only used to view data. System settings includes the system frequency at which the units will operate (50 or 60 Hz), selection of either the Power Factor or TanDelta calculation, the temperature units of measure, the input channels for the temperature and humidity DC level sensors, and Monitoring Startup Mode which should be set to “With Windows” in order to have Monitoring automatically startup on Windows startup. NOTE: The default password is “MASTER” and should be changed after installation using InsuLogix® B Control. InsuLogix® B Control The user can access InsuLogix® B Control in various modes using the InsuLogix® B Access Control screen displayed below. InsuLogix® B Access Control Accessing Control with a password will allow the user to make changes to the system configuration and settings and InsuLogix® B System Settings 11 Section 4 The difference in the result of the Power Factor calculation and the TanDelta calculation is insignificant when the angle between the two phases is small. The equations for these calculations are given for reference only and in this manual the Power Factor calculation is assumed. TanDelta = ((a2*b1 – a1*b2)/(a1*a2 + b1*b2)) Power Factor = cos(pi/2 – arctan(TanDelta)) The final result is expressed as a percentage. TanDelta = 100 * TanDelta or Power Factor = 100 * Power Factor In the Send Alarms or Warning using section, only specify that InsuLogix® B should send alarms/warnings as hardwired alarms contacts unless the Modem or Network options are included. In the Send These Reports section, specify the reports that you want InsuLogix® B to generate so they can be viewed using pcAnywhere. In the Alarms/Warnings and Time Delay section, specify which alarms InsuLogix® B will report with the time delay that InsuLogix® B should wait before activating the specific alarm. Types of Alarms and Time Delays Acquisition Settings The following alarm types are available in InsuLogix® B: Menu: Settings – Acquisition Alarm 1 Condition The condition of a unit went from green to yellow. These pre-configured settings are used for data acquisition through an A/D device and should not be changed. Alarm 2 Condition The condition of a unit went from yellow to red. Communication Settings Alarm 3 Signal Integrity The signal from a single unit is down. Alarm 4 Signal Integrity Signal Integrity Alarm: The signals from a vector group (3 units) are down. Alarm 5 System The available disk space on the computer is below the specified percentage. Menu: Settings – Communication These communication settings are pre-configured based on the InsuLogix® B model ordered and should not be changed. Alarm and Reporting Menu: Settings – Alarm and Reporting The Alarm and Reporting Settings allow the user to configure the various reports and automatic alarms available in InsuLogix® B. A time delay can be specified for alarms 1 through 4, before InsuLogix® B will actually activate the alarm. Waiting times of 0 (none), 1 hour, 12 hours, 1 day, or 1 week can be specified. If a time delay is specified and the problem (e.g. signal down – alarm 3) corrects itself in the waiting time, the alarm will not be activated. Configure Reports Menu: Configure Reports InsuLogix® B Alarm and Reporting Settings 12 Section 4 The user will need the following information before configuring InsuLogix® B for monitoring: • A list of all units to be monitored. • Information on every unit, such as type, manufacturer, serial number, voltage, feeder and phase. • A physical layout of the units in the substation (one-line diagram). Every unit in the system will be assigned a unique unit ID and a channel number (assignment corresponding to the physical hardware channel). NOTE: The assignment of channel numbers is made when Configure Reports In the report configuration, reporting times (in days) can be specified for both the detailed and summary reports. Text on the reports section is used to specify a header for the reports (substation name or identifier), as well as up to 3 footnotes to be displayed on the reports. The footnotes could be used to specify a support contact person and telephone number. Configure Recipients wiring the BTC to the InsuLogix® B cabinet. To reduce the possible complexity of the configuration, unit 1 should be wired to channel 1, etc. Background The analysis that the software performs is partly based on correlation between comparative units. These comparative units are specified in the PF/TanDelta and Vector groups. Comparative units are: • Equipment of similar type (i.e. comparison of CTs with CTs, and bushings with bushings) • Equipment of similar manufacturer • Equipment with similar load profiles (i.e. industrial and domestic) • Equipment exposed to the same weather conditions (i.e. outside vs. inside, shade vs. direct sunlight, etc.) This function is not utilized in InsuLogix® B since it will not normally be connected to a telephone line or network. Configure Alarms per Unit Menu: Configure Alarms per Unit Alarms can be further configured per unit. By default, all alarms will be enabled for all units in the monitoring set, but the user can disable certain alarms for specific units (i.e. the alarm will not be activated for the unit). Change Password Menu: Settings - Change Password Selecting the Change Password menu item allows the password to be changed. Enter the old password that needs to be changed and the new password and confirm the new password (the OK button will be disabled if the new password is not confirmed). The units to be monitored are grouped in a monitoring set. The monitoring set consists of information on all the units to be monitored by the InsuLogix® B system in a substation, as well as information about the way in which the monitoring must take place. Some units could be added and then temporarily taken out-of-service, which means that they will not be monitored while they are out-of-service. Only units inservice are monitored and thus included in the sampling sequences and screen layout. NOTE: Monitoring Set = All ‘in service’ Units = All Units to be Monitored. Configuration When configuring the InsuLogix® B system for monitoring, the user specifies the units to be monitored, their layout on the screen (one-line diagram), the sequence in which they should be sampled, and how often the various units should be sampled (sampling schedule). 13 Section 4 Monitoring Set – Add a New Unit Enter the UnitID of the device to be monitored (we recommend that you begin with 1 and follow the sequence as connected in InsuLogix® B cabinet). Note that the channel number will by default be the same as the UnitID, the user needs to change this manually if this is not the case. Substation in All DC Level type units should be entered after all the PF/TanDelta units (CT, Bushing, Other) have been added. When Level units are added, ensure that all the needed information in Edit Configuration Information is specified. operation Monitoring set Enter all the relevant information for the unit. Note that Voltage refers to the voltage of the source to which the unit is connected, and that In Service indicates that the unit must be included in the monitoring set and thus monitored. Spare, old or replacement Master set: all possible Monitoring Set By clicking Add to Database, the unit is added to the system database. Repeat for every unit that needs to be added. The Clear Fields option resets all fields when clicking Add to Database, leaving this option unchecked will retain the previously enter information when adding a new unit (should be used when most of the information is the same). Lightning Arrester Monitoring Setup Monitoring Set Menu: Configuration – Monitoring Set The Monitoring Set Maintenance screen consists of three tabs: • Add a New Unit into the system; • Edit Master Information – physical information about the unit (e.g. a 25kV bushing); • Edit Configuration Information – information about the utilization of the unit (e.g. Phase B feeder 5). Add a New Unit Lightning arresters are DC level type units, and are configured to measure leakage current. The lightning arrester settings are usually configured when the unit is shipped from the factory. If a leakage current sensor is added in the field select the add a unit tab as shown in InsuLogix® B “Alarm and Reporting Settings”. Follow the steps for adding a DC Level unit in section configuring a DC Level Type Device and enter all the relevant information for the unit. Note that Voltage refers to the voltage of the source to which the unit is connected, and that In Service indicates that the unit must be included in the monitoring set and thus monitored. By clicking Add to Database, the unit is added to the system database. Repeat for every unit that needs to be added. The Clear Fields option resets all fields when clicking Add to Database, leaving this option unchecked will retain the previously enter information when adding a new unit (should be used when most of the information is the same). Edit Master Information On the Edit Master Information tab, the physical information of units in the system can be viewed or edited. This includes type, voltage, manufacturer and serial number. NOTE: A unit cannot be deleted out of the system – when a unit should not be monitored anymore, remove the check in the In Service option on the Edit Configuration Information tab. 14 Section 4 Edit Configuration Information On the Edit Configuration Information tab, the utilization information of units in the system can be viewed or edited. This includes phase, channel assignment, feeder, some other designation for the unit, whether the unit must be monitored (In Service) and some level device specific information. Configuring a DC Level Type Device All non-Level type units must be assigned to a PF/TanDelta group for sampling and can be optionally assigned to a Vector group for sampling, as shown in the following figure. Phase: A B C Vector Group When a new Level type unit has been added, it is important the level specific settings in Edit Configuration Information also be specified. This includes: • Lower Voltage - Enter the lowest operating voltage for the level device. • If you are configuring a 4 to 20mA Current loop device, 4ma=1VDC, 20ma=5VDC for this setting. The 4-20mA link must be in place on the DC input board for this type of device. • If you are configuring a 0 to 1mA Current loop device, 0mA=0VDC, 1mA=5VDC. The 0-1mA link must be in place on the DC input board for this type of device. • Lower Value - Enter the number of counts the lowest voltage level represents. • Higher Voltage - Enter the highest operating voltage for the level device. • Higher Value - Enter the number of counts the highest voltage level represents. • Alarm Limit - The alarm limit count value is used to determine the alarm state of level devices. • After the voltage from the level device is converted to a count value, if it exceeds 90 percent of the alarm limit count value, the unit is considered to be in an alarm state and if the voltage count value exceeds 70 percent of the alarm limit count value, the unit is considered to be in a warning state. PPF/TanDelta Group TanDelta and Vector Groups Units are assigned to a PF/TanDelta group and Vector group by specifying group numbers > 0 (units with the same number are grouped together). For example, if units from different phases are assigned to the same PF/TanDelta group (InsuLogix® B will make the necessary angle adjustment before computing the Power Factor) then the user may desire to not assign the units to a vector group. This is accomplished by entering a zero (0) in the Vector Group field. Sampling Sequence Menu: Configuration – Sampling Sequence The sampling of all units in the monitoring set will happen in three steps: PF/TanDelta sampling, Vector sampling, and Level sampling. NOTE: After any configuration changes to units in the monitoring set have been made, the sampling sequence should be verified by clicking the Check Sequence button. Keep in mind that InsuLogix® B Monitoring should be stopped and restarted in order to use the new configuration and sampling sequences Sampling Sequence PF/TanDelta & Lightning Arrester Sampling Every non-Level type unit must belong to a PF/TanDelta group The units in a PF/TanDelta group do not have to be from the same phase as the software will make the 15 Section 4 rotational adjustment before computing the PF/TanDelta. A unit is assigned to a PF/TanDelta group by specifying a PF/TanDelta group number > 0 for the unit. Lightning arresters must be assigned to their own individual group as well. The leakage current of the arrester will then be trended. The leakage current alarm point for each arrester is individually set as shown in section During PF/TanDelta sampling, InsuLogix® B Monitoring will cycle through all of the units each PF/TanDelta group and obtain voltage measurements so that the relative TanDelta between units in a PF/TanDelta group can be computed. For example, if units 1, 2, 3 and 4 are grouped together, then unit 2 will be sampled with reference to unit 1, unit 3 to 2, unit 4 to 3 and unit 1 with reference to unit 4 as illustrated in the following figure. Lightning Arrester & Level Sampling Level units of the same type, such as lightning arresters may belong to a specific group if the user wishes to trend them as well as set individual alarm points for each level input. NOTE: Both the PF/TanDelta and Vector group should be set to 0 (zero) for a level type device. Verifying the Sampling Sequence After all PF/TanDelta and Vector groups have been assigned, click on the Check Sequence button to verify that the assignments are valid. If there are any errors in the sampling sequence, the error messages will appear in the list box. If the units in a PF/TanDelta group are not associated with the same phase, a warning message “Inconsistent Phase” is shown so the user can verify that this is not an error. 1 2 Make any necessary corrections and click the Check Sequence button again. A “Saved OK” message will appear if the sampling sequence was verified and saved. 3 Screen Layout 4 Menu: Configuration – Screen Layout TanDelta Sampling Vector Sampling Not all units must belong to a Vector group - a Vector group consists of three units from the three different phases. A unit is assigned to a Vector group by specifying a Vector group number > 0 for the unit. Note that only one unit per phase may belong to a Vector group. The user can configure the screen layout, and add descriptive text on the InsuLogix® B Monitoring display. All unplaced units will appear at the top of the screen (just below the legend) and must be placed by dragging them (left-click and move mouse) onto the main layout area. Units can be grouped or organized in a layout that makes sense to the user and represents the physical layout of the units in the substation. Units already placed can be dragged into a new position – please note that the layout uses a small grid and all units will be aligned with this grid. During Vector sampling, InsuLogix® B Monitoring will cycle through all of the units per Vector group and calculate the vector representation of the 3 units in the Vector group. The phase shifts (angles in degrees) between the units are stored. InsuLogix® B Screen Layout Vector Sampling NOTE: The UnitID is shown at the upper left corner of the symbol / icon. 16 Section 4 To add descriptive text anywhere on the layout, left click on an open space and add the text. Text can be dragged into a new position, and can also be edited or deleted (right click the text for options). (10 * 12 = 120 minutes), even though the parameter is specified in PF/TanDelta samples. • Time interval between analyzing the data: This specifies the execution frequency of the analysis routine (in hours). The analysis routine uses the stored average values in the database to calculate new condition values for the units in the monitoring set. These condition values are then stored to the database. • Number of days to retain the current data: This duration interval (in days) specifies when the data will be moved from the current database to an archived database. Doing this will control the size and volume of data in the current database. The backup function is executed once a day to determine if archiving is required and will also automatically copy the current database to another database file as a backup on a daily basis. • Number of average PF/TanDelta samples to be used to build the Reference Window: This specifies the number of average PF/TanDelta values that will be contained in the reference window. The reference window is used during the analysis routine to compare current data against reference window data – this enables the analysis algorithms to detect shifts or trends in the data. Keep in mind that the reference window only applies to PF/TanDelta measurements, and not Vector measurements. For the values specified in previous figure, the duration of the reference window can be calculated as follows: 336 samples * 12 (averaging of 12 samples) * 5 (one sample every 5 minutes) = 20,160 minutes = 336 hours = 14 days. This number also indicates how long it will take to initially build the reference window. To close the layout screen after placing all the units, click the button in the title bar of the window (upper right corner). Sampling Schedule Menu: Configuration – Sampling Schedule InsuLogix® B Sampling Schedule Through the sampling schedule, the user controls how often InsuLogix® B will sample, calculate averages, store data, and analyze data. The different scheduler variables are: • • • Time interval between PF/TanDelta measurements: This specifies the frequency of PF/TanDelta sampling, e.g. a value of 5 means that PF/TanDelta sampling will take place every 5 minutes. All measurements are kept in memory until averaging, when it will be stored to the database. Time interval between Vector measurements: This specifies the frequency of Vector sampling, e.g. a value of 10 means that Vector sampling will take place every 10 minutes. All measurements are kept in memory until averaging when it will be stored to the database. Number of PF/TanDelta measurements before averaging: This specifies how many PF/TanDelta samples the system will collect before calculating the average of all PF/TanDelta and Vector samples and storing the average values to the database. For example, if PF/TanDelta sampling is done every 5 minutes and averaging after every 12 samples, then an average value will be added to the database every hour (5 * 12 = 60 minutes) per unit sampled. Please note that this setting also controls the averaging of Vector samples, which is every two hours NOTE: The factory default for this setting is 128. We recommend that this setting be increased by 128 every 3 months during the first year of operation to create a reference window that covers 4 seasons of data. Diagnostics InsuLogix® B Control contains a comprehensive set of diagnostics tools to assist the user while installing the InsuLogix® B monitoring system, or to troubleshoot a defective component of the system. NOTE: The diagnostics tools communicate directly with the units and use the physical channel number to which a unit is connected. NOTE: The diagnostics tools will be disabled if InsuLogix® B Monitoring is already running. This is necessary because running both InsuLogix® B Control Diagnostics and InsuLogix® B Monitoring can cause a conflict through simultaneous access to the hardware resources. 17 Section 4 A/D Card Vector Diagram Menu: Diagnostics – A/D Card The A/D card diagnostics tool provide the user with the functionality to test the two major functions of the A/D card and will display the results returned by the A/D card on the screen. The two functions are: Test D/O: Test the digital output functionality of the card. Test A/I: Test the analog input (analog to digital converter) – the user needs to provide a channel number which to sample. This function will draw a vector diagram of three signals sampled, as well as calculate and draw the resultant vector of the three signals. Click Draw to sample and draw the signals. The primary benefit will be to confirm the phase orientation of three signals from different phases. Signals Menu: Diagnostics - Signals Signal diagnostics is the most important diagnostics tool. The various utilities in this tool provide the user with the functionality to troubleshoot incorrect signals, bad wiring, and various other problems that could affect the quality of the signals sampled. Signal Diagnostics - Vector Diagram Harmonics Scope Function The scope function plots any two signals sampled simultaneously on a voltage vs. time graph. You can take a snapshot sample by clicking on Sample and Hold or let the function continuously sample and plot the two channels by clicking Continuous Sampling (click / toggle Continuous Sampling again to stop continuous sampling). NOTE: Make sure that Continuous Sampling is stopped before moving on to perform other functions, or before exiting the diagnostics tools. This function will sample one channel and draw the different harmonic components of the signal in a bar-chart format. Other Functions Using this tool, the user can sample any two channels with the same phase orientation and view the calculated maximum, RMS, and mean of the two signals, as well as the relative PFand TanDelta calculations (as a percentages) and relative capacitance between the two signals. The temperature and humidity values can also be read from the temperature and humidity channels, if configured. The DC voltage reading from a Level channel can be sampled as well as writing a test value to the two Analog Output channels. Check All Units This is a very important function to verify the signals from all units in the monitoring set at a glance. Please note that this function uses the unit configuration as specified for the monitoring set (PF/TanDelta groups, etc.). Signal Diagnostics – Scope Function You can take a snapshot sample by clicking on Sample and Hold or let the function continuously sample and update the display by clicking Continuous Sampling (click / toggle Continuous Sampling again to stop continuous sampling). 18 Section 4 The UnitID and channel number of the unit and the reference unit are displayed (note that every unit is sampled with another unit as a reference). Communications Menu: Diagnostics – Communication e.g. UnitID 1 (channel 1) is sampled with reference to UnitID 7 (channel 7). The green rectangle is an indication of the signal quality. The Communication Diagnostics tool is not used on the InsuLogix® B system unless the fax and/or e-mail capability options are utilized. Utilities The various signal quality indicators are: From the InsuLogix® B Control toolbar or menu bar, various other utility functions are available. Green Signal OK Red Signal down Yellow The signal is OK, but the reference unit’s signal is down. This means that no PF/TanDelta calculation can be made for the unit. Blue View or Print Monitoring Set Both signals are OK, but PF/TanDelta is out of range. the calculated Menu: Utilities – View or Print Monitoring Set This utility function will generate a report (to be viewed, saved, or printed) of all units in the monitoring set. Import or Export Configuration and Settings Signal Search This function will scan the range of channels specified and will provide a list of the active channels that were found. It will display the type of channel (AC or DC) and the RMS and Mean values of the samples collected and an indication of the frequency of the signal. NOTE: Make sure that Continuous Sampling is stopped before moving on to perform other functions, or before exiting the diagnostics tools. Hard Wired Alarms Menu: Diagnostics – Hard Wired Alarms The InsuLogix® B system can be connected to external alarms that can be activated by InsuLogix® B (called hardwired alarms). The Hard Wired Alarms diagnostics tool provides the functionality to test these connections. Menu: Utilities – Import or Export Configuration and Settings This utility function allows the user to export / import the complete InsuLogix® B system configuration – all the settings files as well as the configuration (monitoring set) database. The configuration files and database are compressed into a single *.zlb file that will be by default saved to a floppy disk. To import a InsuLogix® B system configuration from another already configured system, click Import and locate the *.zlb file containing the configuration files. Launch Graphs Menu: Utilities – Launch Graphs This will launch the InsuLogix® B Graphs program. Advanced Tools CAUTION THESE FUNCTIONS CAN SERIOUSLY IMPACT THE PERFORMANCE OF THE INSULOGIX® B SYSTEM AND SHOULD ONLY BE USED BY QUALIFIED PERSONNEL. Test Hard Wired Alarms Click any alarm box to toggle the connection from open to close (or open again) – lime indicates a open (normal) connection and red indicates an closed (alarm) connection. The watchdog box toggles the signal to the watchdog board in the InsuLogix® B cabinet that is normally in the closed state (red). Reset Reference Data Base Menu: Utilities – Reset Reference Data Base 19 Section 4 This advanced utility will reset the current database file (…SOS\Data\pescdata.gdb) for the InsuLogix® B system, including the reference windows, to an empty database file. Reset Archive Data Base Menu: Utilities – Reset Archive Data Base This advanced utility will reset the backup database file (…SOS\Data\pescold.gdb) for the InsuLogix® B system to an empty database file. Manipulate Reference Windows Before Running Monitoring InsuLogix® B Monitoring is designed for continuous monitoring, not requiring any user interaction. Because of this, it is very important that the system was correctly and completely configured using InsuLogix® B Control. Since InsuLogix® B Monitoring must automatically start-up with Windows, ensure that the start-up mode in Control - System Settings is set to With Windows. When InsuLogix® B Monitoring is started for the first time, perform these manual checks on the running system: • Check that Monitoring starts up automatically with Windows and that there is are no prompts for user input. • Check the signal integrity of all units for normal operation. • Check that Monitoring is sampling and storing data (a message at the bottom right hand corner of the screen that changes will indicate this is operating correctly). Menu: Utilities – Manipulate Reference Windows This advanced utility provides the user with the ability to erase all, or part of a reference window for a specific unit based on the data range specified. It is very important that the reference window per unit should contain data that can be viewed as “normal” condition data. If a reference window contains a portion of data that was influenced by factors other than normal operation, like severe weather or bad wiring, this data can be deleted. Use InsuLogix® B Graphs to view the data in a unit’s reference window so that the abnormal data range can be determined before using this function. Main System Display The following figure Monitoring display: shows a typical InsuLogix® B Manipulate Reference Windows InsuLogix® B TanDelta Monitoring System – Main Display Delete system logs Since the adcard.log, comm.log, and reboot.log will accumulate historical status information over time, this function will remove these log files so that they can be replenished with new status information. System Summary Monitoring Screen - Top Section InsuLogix® B Monitoring This is the main InsuLogix® B executable program which performs the continuous monitoring of devices in the substation. At the top of the screen, just below the menu options, the following information or options are available: • View - The user has the option to view all units or to select to view only units in a certain PF/TanDelta group, Phase, Type of Unit, or in a certain Condition 20 Section 4 • Signal Integrity - A green square (LED) indicates that there are no problems with the signal integrity of any of the units in the monitoring set. A red square will indicate that a unit has signal integrity problems. Unit Condition The unit condition is displayed as follows: Condition - This square indicates a summary of the overall condition of the units in the monitoring set. Green will indicate that all units are in a green condition, yellow will indicate that at least one unit has a yellow (warning) condition, while red will indicate that at least one unit has a red (alarm) condition. Gray indicates that the analysis function has not been able to determine a condition value. Green (normal) Condition: The rectangle will be green, with a yellow filling indication that the unit is approaching a warning condition state. A completely green rectangle indicates a condition value of 0. Yellow (warning) Condition: The rectangle will be yellow, with a red filling indicating how far the unit is approaching the alarm state. • Temperature - The current temperature reading. Humidity - The current relative humidity reading. Red (alarm) Condition: The rectangle will be red. • No Condition Available: A gray rectangle indicates that the condition value for the unit is not available. This could be because the system is still capturing data for the unit’s reference window. Last Know Condition: A dark green, yellow or red rectangle indicates that the system has not currently sampled and analyzed the unit, and is therefore only displaying the “last known” condition status. • Monitoring Screen - Bottom Section In the status bar at the bottom of the screen, the following information is displayed: • Current date and time • Any system warnings, i.e. when the available disk space falls below the alarm limit • Progress bar and activity indicator (right hand corner) – shows the current activity (i.e. sampling, analyzing, storing data, etc.) as well as a completion progress indicator NOTE: A yellow condition means there is some concern about the condition of a unit and the user is required to investigate the particular unit. Conventional off-line tests are highly recommended. A red condition means the probability of a unit failing is dangerously high. Unit Layout Signal Integrity Note that no data will be stored to the database when signal integrity problems are experienced with a particular unit (this ensures the integrity of the data stored). The three main types of signal integrity problems are: Monitoring Screen - Unit Layout The main portion of the monitoring screen contains the unit layout and unit specific information. All units in the monitoring set, as well as any text added to the layout, are displayed as positioned in InsuLogix® B Control. By right-clicking any unit indicator icon, full information on the particular unit is displayed. Signal Down: The signal from a unit is classified as “down” when the RMS value falls outside specified limits, or the mean value exceeds a certain limit. Reference Signal Down: The PF/TanDelta value for a unit could not be calculated because the unit that is used as reference when sampling for the particular unit is down. PF/TanDelta or Level Out of Range: If the calculated PF/TanDelta or level value falls outside specific limits, the values are not stored to the database. The following information is available on the screen: Unit Unit Condition Unit Indicator, showing type, phase, and signal integrity 21 Section 4 Monitoring is running, the contact for this alarm is normally closed (Operational) and will open (Alarm) if the Monitoring program stops (e.g. when the operating system crashes or the PC hangs). Unit Indicator The following table shows the various unit indicators, display type, phase and signal integrity information: CT Bushing Level Other A / Red Phase - Signal OK B / White Phase -Signal OK C / Blue Phase - Signal OK Signal Down Ref. Signal Down N/A TanDelta or Level Out of Range A/D Card Error Level Warning State N/A Level Alarm State N/A N/A N/A N/A N/A Unit Indicator Table Alarm Status Display System Alarms Menu Alarm Status On the alarm status screen, the user can view the various system alarms, enable or disable an alarm, or reset an alarm. The various system alarms are: Each of the six alarms can individually be reset or disabled or all the alarms can be simultaneously disabled or reset. A green square (LED) indicates the alarm is enabled and not activated, a red LED indicates the alarm is activated, while a gray LED indicates that the alarm is disabled. NOTE: The user will have to enter the system password before allowed to disable or reset any alarm. Alarm 1 Condition The condition of a unit changes from green to yellow. Alarm 2 Condition The condition of a unit changes from yellow to red. Alarm 3 Signal Integrity The signal from a single unit is down. Alarm 4 Signal Integrity The signals from a vector group (3 units) are down. Menu Pause Process or Resume Process Alarm 5 Storage The available disk space on the computer is below the specified percentage. The user can manually pause or resume the monitoring process. Access to this functionality is restricted and the user will have to enter the system password. Alarm 6 System Status This is not an alarm, but rather an indication that the system is currently running. When InsuLogix® B Other Functions Pause / Resume Process 22 Section 4 Reset Communications • A swing indicator test, testing for increased variance in the data. Menu Reset Communications This function is not utilized on the InsuLogix® B system unless the Modem option is included. The Monitoring Process The sequence of execution is controlled by the sampling schedule as configured in InsuLogix® B Control. The major processes are briefly described. Sampling & Averaging Process Based on the sampling schedule, InsuLogix® B Monitoring samples all units in the monitoring set at regular intervals. Three types of sampling will happen: • • • PF/TanDelta Sampling - All non-level type units are sampled per PF/TanDelta group. Sampling occurs in pairs – a unit is always sampled with reference to another unit – forming a closed loop in the PF/TanDelta group. The voltage magnitude of the two signals, as well as the relative PF/TanDelta is calculated and stored in memory. Vector Sampling - All non-level type units are sampled per Vector group. The voltage magnitudes and angles between the three signals are calculated and stored in memory. Level Sampling - All level type units are sampled, and the DC voltage at the devices are measured and converted to count values and stored in memory. All measurements are kept in memory until the number of samples specified for averaging has been reached, then the average of all the samples for the unit is calculated and stored in the disk resident database file. Analysis Process Based on the sampling schedule, InsuLogix® B Monitoring analyzes the stored data and calculates new condition values for the units in the monitoring set. PF/TanDelta Analysis The condition values of all non-level type units are based on a set of statistical tests performed on the PF/TanDelta data in the current database. These test include: Please note that the PF/TanDelta analysis uses a reference window of data built per unit. This implies that the quality of the analysis depends on the quality of data in the reference window - this data should represent data under “normal” / non-failing conditions. When starting monitoring of a new unit, data for the reference window needs to be collected before the full set of tests can be performed. Level Analysis • The condition value of a level unit is based on the alarm limit for the unit specified in InsuLogix® B Control. The alarm and warning tests are performed on the most recent 20% of the samples in the current database. If any of these samples is in the alarm state (> 90% of the alarm limit), the condition value for the unit is set to 95 – a red condition. If any of these samples is in the warning state (> 70% of the alarm limit), the condition value is set to 75 – a yellow condition. If a level unit is not in an alarm or warning state, a seasonal slope analysis is performed on all the samples in the current database, and a condition value between 0 and 70 is assigned to the unit, based on the analysis. Dynamic Analysis Scheduling The analysis process will dynamically change the sampling schedule (controlling the sampling, averaging, and analysis processes) depending on the highest condition value calculated or the largest change in condition values detected. The following table gives the dynamic schedule based the condition values (C) calculated and the sampling schedule as specified in InsuLogix® B Control. For the purpose of this example, a PF/TanDelta sampling rate of 5 minutes, an averaging rate of 12 samples, and an analysis rate of 4 hours are assumed. Condition Value (C) C <= 40 40 < C <= 60 C > 60 • A current trend analysis, looking at the last several days of data. • A long-term trend analysis, comparing current data with the reference window data. • A seasonal slope estimator test. (Cnow – Clast) > 30 Dynamic Averaging (Av) Av = as specified e.g. 5 x 12 = every hour Av = as specified e.g. 5 x 12 = every hour Av = Av / 2 e.g. 5 x (12/2) = every 30 minutes Av = Av / 2 e.g. 5 x (12/2) = every 30 minutes Dynamic Analysis (An) An = as specified e.g. every 4 hours An = An / 2 e.g. every 2 hours An = An / 4 e.g. every hour An = An / 4 e.g. every hour 23 Section 4 Archive Process The main display consists of the following areas: The archive process will execute once a day (normally at midnight). During this process, the backup database file (pescold.gdb) is updated with data from the current database file (pescdata.gdb). The current database file is also copied to the SOS\Backup\ folder as another backup and renamed pescdata.bak. Depending on the archive days setting in the sampling schedule (between 2 and 92 days), a new archived database file (file name format SOSyyyymmdd.gdb) will be created from the backup database file and stored in the SOS\Backup\ folder each time this archiving interval is reached. The backup database file is then initialized to an empty state. Reporting Process Depending on the reporting settings in InsuLogix® B Control, warning, summary or detail reports are generated (normally at midnight). Reports are generated as text files and stored in the default SOS folder. The text files are called “warning.txt”, “summary.txt” and “detail.txt” respectively. A warning report contains status information on all activated alarms, signal integrity problems, or units that have a yellow or red condition value. A summary report contains information about the whole system (i.e “The condition of all monitored units is GREEN.”). A detail report contains information on every unit in the monitoring set. UnitID Selection UnitID Selection – Non-Level Units The top section of the screen allows the user to select a unit for which data will be displayed. The user can select a unit by clicking the dropdown list (Unit ID:). Data for the selected unit will be displayed in all the graphs. The reference unit, other unit (the unit that is using the selected unit as a reference) and the vector group information will also be displayed. When viewing level data or level condition data, another UnitID selection input is used. UnitID Selection – Level Units Up to three units can be selected. To remove a unit from the graphs, click the relevant erase button. Date Range Selection InsuLogix® B Graphs InsuLogix® B Graphs is the data investigation utility in the InsuLogix® B software suite. This program gives the user the ability to view stored operational data in graphical form. Main Display The following figure Monitoring display: shows a typical Date Range Selection This box allows the user to specify a date range for which data will be displayed. By clicking the down arrow on a date selection box, a calendar will be displayed from which the user can select a date. InsuLogix® B Selecting a Date All graphs will automatically be scaled to fit the date range specified. To scale the graphs to fit the available data in the entire graph area, click the Auto-scale button (click again to scale to the specified date range). InsuLogix® B Graphs Screen 24 Section 4 Graphs - General Available Types of Graphs Various graphs are available to the user – to view a graph, select (click) it from the list of available graphs. other pair is drawn in red. This graph enabled the user to search for visible trends in the data. Because of the closedloop, relative sampling in a PF/TanDelta group, one would expect a “butterfly / mirror image” trend if the selected unit’s isolation is deteriorating. If only one of the lines shows a trend (i.e. it is not mirrored by the other line) it might indicate that either the reference unit or the other unit is failing. All graphs are displayed as line-charts, with the date on the horizontal (bottom) axis and the relevant value on the vertical (left and/or right) axes. All graphs can be manually moved left, right, up or down. This is done by right dragging with the mouse on the graph (right-click, hold the mouse button down and move the mouse). Voltages To manually zoom into an area of a graph, left drag a box around the area from top-left to bottom-right (left-click the top-left corner of the area, hold the mouse button down, move the mouse to the bottom-right corner and release the mouse button again). This graph plots sampled voltages of the selected unit; its reference unit and the unit referencing the selected unit (“other” unit), over time. While the mouse cursor is in a graph area, holding down the shift key will show crosshairs, enabling the user to easily read the x-axis and y-axis values at a particular point. To reset the display of a graph (zoom out and move to original position) after manually moving and/or zooming a graph, left drag a box anywhere on the graph from bottomright to top-left (left-click anywhere on the graph, hold the mouse button down, move the mouse to the top and left, and release the mouse button again). Vector The vector graph plots the angles of the three units in a Vector group, with reference to the first unit, over time. Note, that only the Phase B and C angles are drawn as they are referenced to Phase A. Types of Graphs Non-Level Type Units PF/TanDelta Condition This graph plots the calculated condition value of the selected unit. The humidity and temperature readings are also shown. PF/TanDelta Reference Window This very important graph shows the values that are used in the analysis of PF/TanDelta data. This includes the reference window data for the selected unit, as well as the current (up to the number of data points in the reference window) PF/TanDelta data for the unit. Typical PF/TanDelta Data This graph plots PF/TanDelta data (left-axis), relative capacitance (left-axis) and the temperature and humidity data (right-axis), during the time interval selected. The date/time stamps of the first and last record in the reference window are displayed. Note that no horizontal / bottom axis is visible for this graph, because the reference window data and present PF/TanDelta data will have different date/time intervals. The PF/TanDelta data for the selected unit and reference pair is drawn in blue, while the PF/TanDelta data of the unit and 25 Section 4 Level Type Units button that will show the InsuLogix® B Graphs archived data extraction utility. Levels Extract Archived Data This graph plots level values (in counts) of up to three selected units. The humidity and temperature readings are also shown (scaled to the right-axis). NOTE: To use archived data as a data source for InsuLogix® B Graphs, the archived data first need to be extracted into an archive source file (sosarchive.gdb). Level Condition InsuLogix® B Graphs will extract all valid SOS database files found in a specified directory. A database file called sosarchive.gdb will be created in the current database folder (see Database Selection) and will be used by InsuLogix® B Graphs if the user specifies archived data to be used. The Level Condition graph plots the calculated condition values of up to three level units for the selected time interval. The humidity and temperature readings are also shown (scaled to the right-axis). Changing the Data Source Menu File – Change Data Source The user can specify the data source to be used by InsuLogix® B Graphs. This will determine the data used in all graphs, reports, and export functionality. Archived Data Extraction Utility Data Source Selection To extract archived data, follow these steps: 1. Specify if present data should also be included in the archive source file (sosarchive.gdb) or not. 2. Specify the folder containing the archived database files Database Selection InsuLogix® B Graphs can use the default (active) database (in the …\SOS\Data folder) or another specified folder containing the database files. Note that when another folder is specified, it must contain the pescandb.gdb file. To specify another database location / folder, click the button and browse to the folder containing the database files. Data Selection – Present or Archived to be extracted by clicking the button. All valid SOS archive files (sos*.gdb), as well as present data files if so specified in step 1, in this folder will be extracted. 3. Specify the date range for data to be extracted - only data within this range will be extracted and included in the archive source file. 4. Click the Extract button to start the extraction process. 5. Click OK when done. The user can also specify if present or archived data should be used as the data source. Present data is stored in the pescdata.gdb database file, while archived data is extracted into an archive source file called sosarchive.gdb, which is then used by InsuLogix® B Graphs. While the system is busy extracting data, the progress of the extraction process will be indicated, as well as the data type and filename currently being extracted. The user can scroll through the progress information by clicking the up or down arrows. When archived data is selected, InsuLogix® B Graphs will use the archive source file in the current database folder (see Database Selection). If data has not been extracted before, or if the user wants to use newly extracted data, click on the Progress Information 26 Section 4 To cancel the extracting process, click the Stop button. NOTE: If the extracting process is stopped or cancelled, the archive source file could be invalid or only contain partial data. Export Data Example of analysis data exported InsuLogix® B Graphs can export data in comma separated variables (CSV) text files to be used in application like Microsoft Excel. Reports All reports are previewed on the screen, from where the user can select to print or save it (reports are saved in QuickReport format – QRP). Export Data to CSV Files Menu Export Data - …per unit to CSV files This function will export data from the current data source (either present data or archived data) to CSV (commadelimited) text files. Data is exported for a specified unit and is stored in *.csv files in the folder …SOS\Export Data\. Report Preview Toolbar The buttons on the preview toolbar are, from left to right: • Zoom to Fit • Zoom to 100% • Zoom to Width • First Page • Previous Page • Next Page • Last Page • Printer Setup • Print • Save Report The data files are named sos_x_type.csv, where x indicates the UnitID and type indicates the data type in the file (e.g. sos_1_condition.csv). • Load Report • Close the Preview Note that a file with an analysis type is also created. This file contains the PF/TanDelta data used in the analysis to calculate the condition value of the selected unit. As the PF/TanDelta data is compared with data from the reference window, both the present data and reference data is exported. One of the statistical tests in the analysis uses a sorted array containing both present and reference data – this array (Mann-Whitney array) is also exported. Conditions Report Export Data to CSV Files Menu Print Report - Conditions This report consists of condition values vs. time graphs of all units in the system. Composite Report Menu Print Report – Composite Report This report consists of various graphs per selected unit. The available graphs on the report depend on the type (level or 27 Section 4 non-level) of the selected unit. The user will be presented with the options – select the graphs to include on the report and click Continue. ‘adcard.log’ Any errors that occurred with the A/D card are logged in this file. ’reboot.log’ A log file with an entry and reason for every time that the PC104 is rebooted. alarmlog.txt’ Every time that a user disables or resets an alarm manually, the action is logged in this file. ‘condition.txt’ A date/time stamped text file with the latest condition values and signal integrity information, for all units. ‘alarmstatus.txt’ A date/time stamped text file with a record of the status of the different system alarms. ‘referencewindow.txt’ A text file with a record of the reference window for every unit in the monitoring set (this file indicates the number of records for every unit) ‘olddata.txt’ A date/time stamped text file with information about the status of the current database and old database. This file gets updated every time SOS Monitoring executes the archive process. Configure Composite Report NOTE: The composite report is only available if a unit has been selected on the main screen. Troubleshooting SOS Monitoring uses some checks to prevent the system from failing to monitor for an extensive period in time: • • • An internal watchdog timer in the software will force the PC to reboot (‘soft’ reboot) if it was determined that the software monitoring cycle was disrupted for more than an hour. For example, if the computer is used for non-SOS functions, such as applications other than SOS Control or SOS Monitoring programs, a message will appear to give the user a chance to cancel the reboot process before the reboot, in case the user deliberately cancels / pauses the monitoring process. The user may activate the SOS Control program at any time to have the watchdog timer reset. Database Structure The InsuLogix® B software uses a standard SQL database server for data storage. By default, InterBase is used as the database server, but the data structure allows for other database servers also to be used. SOS Monitoring will check the A/D card and driver and will force the PC to reboot (‘soft’ reboot) if consecutive errors occurred with the sampling process (i.e. could not access the A/D card through the driver). This will pick up problems with the A/D card or A/D card driver and DMA memory access and will reset these problems by rebooting the PC. The client/server model employed by the InsuLogix® B software ensures data integrity and easy remote retrieval and manipulation of data. A watchdog board in the InsuLogix® B cabinet is reset every couple of minutes by the Monitoring or Control programs. In case this watchdog board is not reset for a period longer than 15 minutes, the watchdog board hardware will cut the power to the PC in order to force the PC to reboot (‘hard’ reboot). This will of course only be effective provided the PC is connected to the power out connector on the InsuLogix® B cabinet. Data is stored in various database files in the …SOS\Data\ folder. These database files include: InsuLogix® B Monitoring also keeps log files that can be reviewed for more information on the monitoring process: ‘comms.log’ All communication events, including any errors while sending a fax or e-mail. Database Files Pescandb.gdb: Contains the system configuration data. Pescdata.gdb: The current monitoring data is stored in the file (all sampled and calculated values). Pescold.gdb: This serves as a backup database file for the pescdata.gdb file. This database gets updated with data from the current database once a day and is stored until a new archive database file is created. 28 Section 4 Archive database files are created periodically by the system and are stored in the …SOS\Backup\ folder. These files are named SOSyyyymmdd.gdb (where the date is an indication of the date of the most recent data contained in the file) and is a copy of the backup database file (pescold.gdb) for that time interval. During the installation process, the BDE (Borland Database Engine) aliases for the database files are automatically created. These are pescan for pescandb.gdb, pescdata for pescdata.gdb, and pescold for pescold.gdb. Database Table Structure The following table structures are given for reference purpose only. The user is allowed to do simple data retrieval on the database through standard SQL queries, but is under no circumstances allowed to manually update or delete data. Pescandb.gdb Contains the alarm configuration per unit in the monitoring set. • ALARMS • PESCMAST Contains all information regarding the physical units (all possible units in the substation) entered into the system (type, manufacturer, etc). • PESCCONF Contains all utilization information on the units to be monitored (phase, feeder, etc.). • TEXT Contains the text to be displayed on the layout. • RPTEMAIL Contains all e-mail report recipients. • RPTFAX Contains all fax report recipients. Pescdata.gdb • ENVIRONMENT Contains temperature and humidity data. • PESCREF Contains the reference window data. • PESCTAND Contains the PF/TanDelta sampling data. • PESCVEC Contains the vector sampling data. • PESCLEV Contains the level sampling data. • PESCCOND Contains the condition calculation data for all units. • PESCSIGNAL Contains information on units from which the signals were down for some time. Pescold.gdb and Archived Database Files • ENVIRONMENT Contains temperature and humidity data. • PESCTAND Contains the PF/TanDelta sampling data. • PESCLEVC Contains the vector sampling data. • PESCLEV Contains the level sampling data. • PESCCOND Contains the condition calculation data for all units. Backup/Archival Considerations There is over 100 Megabytes of data storage available for the database on a InsuLogix® B system. To estimate how much data can be stored, the following algorithm can be used. A PF/TanDelta unit having a sampling rate that produces an average sample value every hour will require 5000 bytes of data storage per day. Since there can be at most fifteen PF/TanDelta units in a InsuLogix® B system, the following equation gives the total number of days before the 100 MB of data is exhausted. Total Days = 100000000 bytes/ (5000 bytes/day * 15 units) = 1333 days or 3.65 years Therefore, exceeding the allotted data storage has a very small possibility of occurring. However, to insure the availability of the data in the event of a hardware failure, it is recommended that the archive database files (file name format SOSyyyymmdd.gdb) be copied from the InsuLogix® B system to the notebook computer at periodic intervals using the pcAnywhere File Transfer function. Once this archive data has been copied to the notebook computer, the files can be deleted in the InsuLogix® B system to make more storage space available. The data files contained on the notebook can then be transferred to a Network Server or CD to secure the data. 29 Section 5 Section 5 - CONSOLE CONSOLE OPERATION Installing pcAnywhere for Remote access pcAnywhere is a software package that will allow remote operation of InsuLogix® B cabinet that has been connected directly using a RS232 communications port and a cable or via an optional network connection to a notebook computer. A version of pcAnywhere was pre-installed with InsuLogix® B and configured to automatically startup in the host mode with the Windows operating system. However, pcAnywhere must be installed on the notebook computer before it can communicate with InsuLogix® B. To install pcAnywhere on the notebook computer, place the InsuLogix® B Installation CD in the CDROM of the notebook computer. When the InsuLogix® B startup screen appears, select the InsuLogix® B + Installation item with the cursor and the following display should be displayed. pcAnywhere Host Login Display Once you have gained access to the InsuLogix® B software, then you can perform the Control, Monitoring, and Graph operations described in Section 4. A sample of the InsuLogix® B Monitoring display is shown below. It is important to realize that the host pcAnywhere menu bar is still active and is shown at the top of the display and it may be necessary to use the right most scroll bar to view the entire InsuLogix® B Monitoring display. Move the cursor to the pcANYWHERE line and use the left mouse button to begin the installation process. This will run the setup.exe program in the pcAnywhere folder on the CD. Select the Typical installation and skip over the Live Update and Registration operations. When it asks to restart the computer, select the No option and then exit the InsuLogix® B Installation display and select All Done on the InsuLogix® B + screen. The pcAnywhere installation on the notebook computer needs to be configured for Remote Control. Launch pcAnywhere by selecting the icon or from the programs group (Start – Programs – Symantec pcAnywhere). Select “Remotes” from the toolbar on the pcAnywhere Manager display and double click on Add Remote to add an icon for InsuLogix® B. On the Connection Info tab, select the COM port being used or TCP/IP if the optional network connection is being used on the notebook computer. Then enter OK to complete the configuration. Change the “New Remote” name to “InsuLogix® B” and then click the cross in the upper right corner to exit the pcAnywhere Manager display. Remote Connection Using pcAnywhere To use pcAnywhere for direct remote communication with InsuLogix® B, a Null Modem Serial Cable with a DB9 pin male connector on one end and a DB9 pin female connector on the other end is required. The connection is established by double clicking on the pcAnywhere icon on the notebook Windows desktop screen and then double clicking on the InsuLogix® B Remote icon on the pcAnywhere Manager display. The following pcAnywhere Host Login screen is shown and you should enter the Username “sos” and the password “sos” to obtain access to the InsuLogix® B Monitoring display. pcAnywhere Display of InsuLogix® B Monitoring If it is desired to transfer files from the InsuLogix® B system to the notebook computer for backup or archiving purposes, then the File Transfer capability should be utilized by double clicking on the File Transfer icon on the pcAnywhere menu bar at the top of the screen. This will allow you to select the appropriate folder in InsuLogix® B system shown on the right of the screen and the corresponding folder on the notebook computer shown on the left of the pcAnywhere File Manager display as shown in the following figure. 30 Section 5 192.168.0.48 in the IP address box > Type 255.255.255.0 in the Subnet Mask box > Click OK. in pcAnywhere File Transfer Display Remote Connection Using Windows® Remote Desktop Connection To use Windows® Remote Desktop Connection for direct remote connection with InsuLogix® B, a CAT 5 Patch Cable with male RJ45 connectors on both ends is required. The connection is established by clicking on the Remote Desktop Connection icon located in the start menu under Programs > Accessories > Communications > Remote Desktop Connection (Note: Remote Desktop Connection is preinstalled with Windows XP Professional, if you do not have Remote Desktop Connection installed it can be downloaded from Microsoft at: http://www.microsoft.com/windowsxp/downloads/tools/rdcli entdl.mspx.) IP Properties Window If the InsuLogix® B is on a Local Area Network the IP Address will be assigned automatically. The following Remote Desktop Connection Login screen is shown and you should enter the Username “sos” and the Password “sos” to obtain access to the InsuLogix® B Monitoring display. Remote Desktop Connection Computer Selection On the Remote Desktop Connection computer selection screen type in the IP Address of the InsuLogix® B that you would like to connect to. If connecting to the InsuLogix® B from port P2 the IP Address by default is set to 192.168.0.50. When using port P2 the laptop used to connect to the InsuLogix® B must have its own specified IP address. To assign an IP address to the laptop you must go into Control Panel > Network Connections > Right Click on Local Area Connection > Scroll down to Properties > Click on Internet Protocol (TCP/IP) > Click Properties > Click on the Alternate Configuration tab > Type in Remote Desktop Connection Login Display Once you have gained access to the InsuLogix® B software, then you can perform the Control, Monitoring, and Graph operations described in Section 4. 31 Section 6 Section 6 - COMMUICATIONS OPTIONS UCA Server Option Modem Connection Option Introduction If it is desired to have the InsuLogix® B system send Warning, Detail, or Summary Reports by facsimile, then the modem connection option must be installed. Due to the harsh electrical environment at the transformer, the InsuLogix® B cabinet must be connected to an external modem in the Control House using 1300 Nanometer Multimode Fiberoptic cable with ST connectors. This option requires installing a Async Fiberoptic Mini Modem (e.g. Black Box product ME605A-FST) in the InsuLogix® B cabinet via a short cable with a DB9 pin female connector to the COM 1 port from the PC104 board and the DB25 male connector on the cable to the DB25 female connector on the Async Fiberoptic Mini Modem. The two ST connectors on the fiber optic cables are fed into the bottom of the cabinet and attached to the modem. The other ends of the fiber optic cables are attached to the ST connectors of the second Async Fiberoptic Mini Modem and the DB25 pin connector is connected to an external modem attached to a phone line in the Control House. Network Connection Option If it is desired to have the InsuLogix® B system accessible on a network, then the network connection option must be installed. Due to the harsh electrical environment at the transformer, the InsuLogix® B cabinet must be connected to the Network Hub in the Control House using 1300 Nanometer Multimode Fiberoptic cable with ST connectors. This option requires installing a Fast Ethernet Media Converter in the InsuLogix® B cabinet with a short CAT 5 Patch Cable with male RJ45 connectors on both ends. The cable is used to connect the Converter to the Network connector on the PC104 Processor Board. External power must be supplied to the Converter and the two ST connectors on the fiber optic cables are fed into the bottom of the cabinet and attached to the terminals on the Fast Ethernet Media Converter. This InsuLogix® B option enables the Monitoring program to utilize the industry standard UCA (Utility Communication Architecture) protocol. Installing the optional UCA Server in InsuLogix® B and having the hardware connected to a network enables a gateway between InsuLogix® B and the SOS Supervisor. In a typical scenario, UCA Server accepts data requests from the SOS Supervisor and sends the appropriate responses back to SOS Supervisor for each data requests. UCA Server also is able to dynamically create “bricks” associated with each domain, as the user add new units to the InsuLogix® B system. A stand-alone executable file called sos_ucaserver.exe has to be installed in the\sos directory. InsuLogix® B Monitoring starts UCA Server by calling sos_ucaserver.exe, after it completes the first sampling of all units. There are also three other MMS-EASE LITE configuration files that have to be under \sos to make UCA Server work. These are lean.cfg, mbufcalc.cfg, and mms_log.cfg files. UCA Server Input There are two types of input received from SOS Supervisor, namely UCA variable names and UCA variable name list. Whether one type of input is received over the other, is dependent upon how SOS Supervisor sends out the request. UCA Server does not directly handle low-level communication calls between SOS Supervisor and itself. All low-level communication tasks are done via MMS-EASE LITE services, which are abstract and transparent to UCA Server. At a much higher level, UCA Server assumes the responsibility of executing implementation specific tasks such as database transactions, when it receives a request from the SOS Supervisor. Most implementations take place within “read indication” functions. The MMS Read indication functions are the major inputs to UCA Server, and the values assigned for each named variables within each read indication functions will be sent back to SOS Supervisor, after each data is retrieved successfully from the database and assigned to each name variables. The other ends of the fiber optic cables are attached to the ST connectors of a Fiberoptic Network Hub in the Control House or to a second Fast Ethernet Media Converter and the Converter is then connected to the Network Hub. 32 Section 6 The DNP Master must know the TCP/IP address, the DNP Slave Address and the DNP Master Address. UCA Server Output The following table illustrates naming conventions used for some of the named variable types associated with actual field names stored in the Database table, to which both the InsuLogix® B system and UCA Server have access. Named Variables Actual Field Names SQL Data Type MMS Data Type RS232 The following screen is displayed for RS232 configuration. Table BUSH1$MX$PF$TanDeltaF tand Float ST_FLOAT pesctand BUSH1$MX$PhsV$Reff mag1 Float ST_FLOAT pesctand BUSH1$MX$PhsV$f mag2 Float ST_FLOAT pesctand BUSH1$MX$RelCap$f relcap Float ST_FLOAT pesctand BUSH1$CF$UnitId$UnitId unitid Smallint ST_INT16 pesctand BUSH1$CF$RefId$RefId refid Smallint ST_INT16 pesctand BUSH1$ST$CndSt$b2 condition Smallint ST_UINT8 pesccond BUSH1$ST$SigIntg$b16 unitid Smallint ST_INT16 pescsignal DNP3 Option The DNP Slave program, DNP3Slave, provides data to the DNP Master program. The two programs can communicate via RS232 or Ethernet. The configuration program, DNP3SlaveConfig, provides the means to configure the slave program. Ethernet Settings The following screen is displayed for Ethernet configuration. Configuration Display for Serial Port settings. The Master must know the Baudrate, the DNP Slave Address and the DNP Master Address. Configuration file The configuration file name is “DNP3SlaveConfig.txt” and it exists in the “C:\sos” directory. The file is maintained by the configuration program. Configuration file format • There is one item on a line. The format of the line is • ItemName=ItemValue • Where: ItemName is a text string describing the item. ItemValue is the ASCII representation of the value for the item. • There are no comments. Items in the Configuration File DNP3 Configuration Display for Ethernet Settings • ItemName: Communications − ItemValue: 1 = RS232, 5 = Ethernet 33 Section 6 • ItemName: SlaveAddr − ItemValue: ItemValue: Any valid DNP address number. See the Configuration Program screen above for a description of a valid DNP address. • ItemName: MasterAddr − ItemValue: ItemValue: Any valid DNP address number. See the Configuration Program screen above for a description of a valid DNP address. • ItemName: TCPIPAddr − ItemValue: Any valid TCPIP address. • ItemName: SerialPortNum − ItemValue: One of the values selected from the dropdown list in the Configuration Program. • ItemName: Baudrate − ItemValue: One of the values selected from the dropdown list in the Configuration Program. • ItemName: Period − ItemValue: The period, in seconds, that the program checks for new data. If the period is 0, the program will start once and then terminate. • ItemName: TCPIPPort − ItemValue: TCP/IP port to use. Operating the form • Select "TCP/IP" from the Communication Type dropdown list. − The Serial port number and Baudrate fields are disabled. − Enter a TCP/IP address in the TCP/IP Address field. The address is checked to make sure it is valid. See the validation rules below. • Select "RS232" from the Communication Type dropdown list. − The TCP/IP Address field is disabled. − Select a serial port number from the Serial port number dropdown list. − Select a baudrate from the Baudrate drowdown list. • Enter a DNP Slave address in the DNP Slave Address field. • Enter a DNP Master address in the DNP Master Address field. • Select OK to save the data to the configuration file if all of the data is valid. If any of the data is not valid, none of the data is saved. • Select Cancel to discard the changes. Items that cannot be changed • • The period does not get displayed and it cannot be changed except by manually editing the configuration file. The TCP IP port does not get displayed and it cannot be changed except by manually editing the configuration file. TCP/IP Validation Rules • Must have 3 dots (4 address sections). • Each section must have only digits. • Each section must have at least 1 digit and no more than 3 digits. • Each section cannot exceed 255. DNP Address Validation Rules These rules apply to both the Slave and Master addresses. • Must have no more than 5 digits. • Must have all digits. • Cannot be greater than or equal to 65535. Classes All classes and class methods are well documented in the code. • The CDNP3SlaveConfigDlg class is the main dialog box class and handles all the fields and buttons in the main dialog box. • The CConfig class reads and writes the configuration file. Published Data All data is published as analog floating point numbers with a time stamp. The order of the data described is the order it is published in (i.e. the DNP point number). All bushings are published first ordered by unit ID number. After the bushings, all Level devices are published ordered by unit ID number. Temperature, always point number 0 Humidity, always point number 1. Bushings Point numbers start at 2 for the first bushing. They are numbered consecutively in the order listed below. For each bushing • Unit ID 34 Section 6 • • • • • • • • • • • • • • • • Phase − Phase A = 1 − Phase B = 2 − Phase C = 3 Vector Group In Service − 1 = In service − 0 = Out of service Reference ID TanDelta Mag1 Mag 2 PF RelCap Condition − 0 = very good to 110 = bad RefTanDelta Ref RelCap RefPF Unit Status − Alarm = 0x80 − Warning = 0x40 − OK = 0xC0 − Unknown = 0 Signal Status − Down = 0x40 − Good = 0x80 Alarm − Off = 0 − On = 1 • • • • • • − ItemValue: ItemValue: Any valid DNP address number. See the Configuration Program screen above for a description of a valid DNP address. ItemName: MasterAddr − ItemValue: ItemValue: Any valid DNP address number. See the Configuration Program screen above for a description of a valid DNP address. ItemName: TCPIPAddr − ItemValue: Any valid TCPIP address. ItemName: SerialPortNum − ItemValue: One of the values selected from the dropdown list in the Configuration Program. ItemName: Baudrate − ItemValue: One of the values selected from the dropdown list in the Configuration Program. ItemName: Period − ItemValue: The period, in seconds, that the program checks for new data. If the period is 0, the program will start once and then terminate. ItemName: TCPIPPort − ItemValue: TCP/IP port to use. Level devices Point numbers continue from the last point number for the last bushing. They are numbered consecutively in the order listed below. For each level device • Unit ID • In Service • Upper Value • Upper Voltage • Lower Value • Lower Voltage • Alarm Value • Level • Alarm − Off = 0 − On = 1 • There are no comments. Items in the Configuration File • ItemName: Communications − ItemValue: 1 = RS232, 5 = Ethernet • ItemName: SlaveAddr 35 Section 6 DNP3 Points List 36 Appendix A SECTION 7 - MAINTENANCE Periodic Testing WARNING THERE IS ALWAYS THE POSSIBILITY OF VOLTAGES BEING INDUCED AT THE TERMINALS OF A TEST SPECIMEN BECAUSE OF PROXIMITY TO ENERGIZED HIGH-VOLTAGE LINES OR EQUIPMENT. A RESIDUAL STATIC VOLTAGE CHARGE MAY ALSO BE PRESENT AT THESE TERMINALS. GROUND EACH TERMINAL TO BE TESTED WITH A SAFETY GROUND STICK, AND THEN INSTALL SAFETY GROUND JUMPERS, BEFORE MAKING OR CHECKING CONNECTIONS. ENSURE THAT THE OBJECT TO BE TESTED IS COMPLETELY DE-ENERGIZED AND DISCHARGED. Repair WEIDMANN offers a complete repair service and recommends that its customers take advantage of this service in the event of any equipment malfunction. Equipment returned for repair must be shipped prepaid and insured and marked for the attention of the Repair Department. Please indicate all pertinent information, including problem symptoms and attempted repairs. The serial number and catalog number of the system should also be specified. Our shipping address is: WEIDMANN DIAGNOSTIC SOLUTIONS INC., 230 Gordon Mills Way, PO Box 799, St. Johnsbury, VT 05819-0799, USA T +802 748 8106, F +802 751 3555. It is important that the system is periodically tested, according to prescribed test protocols, to ensure proper operation. InsuLogix® B Control diagnostic utilities can be used to verify signal integrity, as well as to troubleshoot a signal that is down. To troubleshoot a signal that is down, proceed with these steps: • Select the Scope Function from InsuLogix® B Control Diagnostics. Enter the channel number of each channel that is down (two channels can be compared for phase relationship and signal integrity). • If a signal is deformed or missing, begin tracing the signal from the BTC to the InsuLogix® B cabinet. Measure the input channel voltage and compare the amplitude to the other two phases. The amplitudes should be within 15 percent of each other. • If not within 15 percent, check wire connections at the InsuLogix® B cabinet and follow the wiring to the BTC. Verify that the screen is properly connected for each wire. Ensure that the wire is not nicked or frayed. Examine the BTC to make sure it is sealed properly. Check the terminals for tightness and verify that the shield is properly connected between each wire in the BTC. • Before checking the InsuLogix® B cabinet, ensure that the device it is attached to is de-energized. Check the wire connections and seals in the InsuLogix® B cabinet. 37 Appendix A Appendix A - Installation Checklist Complete one worksheet for each set of three units monitored so a WEIDMANN engineer can use this data to determine the CDU (uF) value and the correct InsuLogix® B Cabinet can be ordered. Feeder / Bay ID : Voltage : ________ kV Unit : Bushing / CT Capacitance [PF] Red Phase A Type : __________ Manuf. : __________ Ser.No : __________ Phase B Phase C Obtain drawings of tap point or of coupling unit. No [ ] For CT decide on isolation method. Yes [ ] Obtain drawings of tap point or of coupling unit. No [ ] For CT decide on isolation method. Yes [ ] Obtain drawings of tap point or of coupling unit. No [ ] For CT decide on isolation method. C1 = ______ Blue Type : __________ Manuf. : __________ Ser.No : __________ Yes [ ] C1 = ______ White Type : __________ Manuf. : __________ Ser.No : __________ Measurement Tap - Point present ? [Yes / No ] and action C1 = ______ ONE-LINE DIAGRAM To assist in the planning, cable layout and system configuration. BUSHING TAP COUPLER For test objects with capacitive tap-point a BTC is required. This unit will be coupled mechanically and electrically to the tap-point via an appropriate adapter bolted or threaded onto the CT or bushing. 38 Appendix B Appendix B - Software License Agreement LIMITED WARRANTY IMPORTANT Read carefully before opening software packet. By opening the sealed packet containing the software, you are agreeing to be bound by the terms of this legal agreement. The enclosed software is owned by GridSense and is provided by WEIDMANN with permission from GridSense for your use as explained in this Software License Agreement. If you have questions regarding the terms of this Software License Agreement, please contact WEIDMANN prior to opening the packet. LIMITED WARRANTY. GridSense warrants, for your benefit alone, that (a) the SOFTWARE will perform substantially in accordance with the accompanying written materials for a period of ninety (90) days from the date of receipt, and (b) the medium on which the SOFTWARE is recorded will be free from defects in materials and workmanship under normal use and service for a period of ninety (90) days from the date of receipt. Some states/jurisdictions do not allow limitations on duration of an implied warranty, so the above limitation may not apply to you. 1. 2. GRANT OF LICENSE. This License Agreement permits you to use one copy of the enclosed software program (the “SOFTWARE”) on a single computer. If you have a multiuser license for the SOFTWARE, then at any time you may have as many copies of the SOFTWARE in use as are permitted by the multi-use license. The SOFTWARE is in “use” on a computer when it is loaded into temporary memory (i.e., RAM) or installed into permanent memory (e.g., hard disk, CD-ROM, or other storage device). If the anticipated number of users of the SOFTWARE could exceed the number of users permitted by applicable licenses, the user must have a reasonable mechanism or process in place to ensure that the number of persons using the SOFTWARE does not exceed the number permitted by the applicable licenses. All rights not expressly granted to you in this agreement are reserved to GridSense. COPYRIGHT. The SOFTWARE is owned by GridSense or its suppliers and is protected by United States copyright laws and international treaty provisions. Therefore, you must treat the SOFTWARE like any other copyrighted material. You may, however, either (a) make one copy of the SOFTWARE solely for backup or archival purposes, or (b) transfer the SOFTWARE to a single hard disk, provided you keep the original solely for backup or archival purposes. You may not copy the written materials accompanying the SOFTWARE. 3. OTHER RESTRICTIONS. You may not reverse engineer, decompile, or disassemble the SOFTWARE. You may transfer the SOFTWARE to a third party provided that after each transfer you do not retain any copies of the SOFTWARE, including all upgrades that you may have received, nor retain any of the written materials accompanying the SOFTWARE. 4. OPERATING SYSTEM OPTIONS (CD-ROM MEDIA). If the SOFTWARE is distributed with multiple versions on a CDROM for compatibility with different operating systems, your license grant extends to using only the applicable version for your operating system. You are, however, granted the limited right to use more than one version of the SOFTWARE solely for the purpose of creating executables for multiple operating systems, up to the number of licenses purchased. CUSTOMER REMEDIES. GridSense’s entire liability and your sole and exclusive remedy shall be at GridSense ’s option, either (a) return of the fees paid, or (b) repair or replacement of the SOFTWARE that does not meet GridSense’s Limited Warranty stated previously, and which is returned to GridSense with a copy of your receipt. The Limited Warranty is void if failure of the software has resulted from accident, abuse, or misapplication. Any replacement SOFTWARE will be warranted for the remainder of the original warranty period or thirty (30) days, whichever is longer. NO OTHER WARRANTIES. Except as expressly set forth in the preceding, the SOFTWARE and the documentation are provided “as is” without warranty of any kind, and no other warranties, either expressed or implied, are made with respect to the SOFTWARE, including but not limited to any implied warranties of merchantability or fitness for a particular purpose or any other warranties that may arise from usage of trade or course of dealing. GridSense. does not warrant, guarantee, or make any representations regarding the use of or the results of the use of the SOFTWARE or the documentation in terms of correctness, accuracy, reliability, or otherwise and does not warrant that the operation of the SOFTWARE will be uninterrupted or errorfree. GridSense expressly disclaims any warranties not stated herein. NO LIABILITY FOR CONSEQUENTIAL DAMAGES. The entire liability of GridSense and its dealers, distributors, officers, directors, agents, and employees are set forth in the preceding. To the maximum extent permitted by applicable law, in no event shall GridSense or its suppliers be liable for any damages including any special, direct, indirect, incidental, exemplary, or consequential damages, expenses, lost profits, lost savings, business interruption, lost business information, or any other damages arising out of the use or inability to use the SOFTWARE or the documentation even if GridSense has been advised of the possibility of such damages. You acknowledge that the license fee reflects this allocation of risk. Because some states/jurisdictions do not allow the exclusion or limitation of liability for consequential or incidental damages, the preceding limitation may not apply to you. 39 Appendix B GENERAL WARNING. WEIDMANN products are not designed with components and testing for a level of reliability suitable for use in the diagnosis and treatment of humans or as critical components in any life support systems whose failure to perform can reasonably be expected to cause significant injury to a human. Reliability of operation of the SOFTWARE can be impaired by adverse factors, including but not limited to fluctuations in electrical power supply, computer hardware malfunctions, computer operating system software fitness, fitness of compilers and development software used to develop an application, installation errors, software and hardware compatibility problems, malfunctions or failures of electronic monitoring or control devices, transient failures of electronic systems (hardware and/or software), unanticipated uses or misuses, or errors on the part of the user or application designer. (Adverse factors such as these are hereafter collectively termed “system failures.” Any application where a system failure would create a risk of harm to property or persons (including the risk of bodily injury and death) should not be reliant solely upon electronic monitoring due to the risk of system failure. To avoid damage, injury or death, the user or application designer must take reasonably prudent steps to protect against system failures, including but not limited to back-up or shutdown mechanisms. U.S. GOVERNMENT RESTRICTED RIGHTS. The SOFTWARE and the documentation are provided with restricted rights. Use, duplication, or disclosure by the Government is subject to restricts as set forth in the Rights in Technical Data and Computer Software clause at DFARS 252.227-7013(c)(1)(ii) or the Commercial Computer Software – Restricted Rights clause at 48 CFR 52.227-19(c)(2), or clause 18-52.227-86(d) of the NASA Supplement, as applicable. Contractor/manufacturer is WEIDMANN Diagnostic Solutions Inc., 230 Gordon Mills Way, St. Johnsbury, VT 05819-0799. USA. This agreement is governed by the laws of the Commonwealth of Pennsylvania, exclusive of any provisions of the United Nations Convention on the international sale of goods, and without regard to principles of conflicts of law, and constitutes the complete agreement between you and WEIDMANN. It supersedes any oral or written proposals, prior agreements, purchase orders or any other communication between you and WEIDMANN relating to the subject matter of this agreement. If any action is brought by either party to this Agreement against the other regarding the subject matter hereof, the prevailing party shall be entitled to recover, in addition to any relief granted, reasonable attorney fees and court costs. If any provision of this Agreement is held invalid, the offending clause will be modified so as to be enforceable and, as modified, shall be fully enforced, and the remainder of this Agreement will continue in full force and effect. 40 Appendix C Appendix C - Substation Visual Inspection Procedure Equipment Required 8 Click on the in the upper right corner of the pcAnywhere display, which is the top most display. This will display a confirmation window to determine if you want to “End Remote Session?”. Click on the “Yes” button to return to the pcAnywhere Manager display. Click on the in the upper right corner to exit pcAnywhere. 9 Shutdown the notebook computer and remove the RS232 cable and lock the InsuLogix® B Cabinet. If any abnormal conditions were recorded, notify the Substation Maintenance Supervisor so that corrective action can be taken using the information contained in the InsuLogix® B Instruction Manual. Notebook Computer with pcAnywhere software installed and the DIRECT Remote configured for the available COM Port. An RS232 Null Modem Serial Cable with a 9 pin male connector on one end and a 9 pin female connector on the other end. The notebook computer battery should be fully charged. Process Steps 1 Unlock the InsuLogix® B Cabinet, and open the door so that the male connector of the RS232 Null Modem connector can be attached to the cabinet. Attach the other end of the cable to the notebook computer serial port. 2 Turn the computer ON and activate pcAnywhere by placing the cursor on the icon and double click the left mouse button. Left click the Remotes button on the pcAnywhere Manager display and double click on the DIRECT remote that should have already been assigned to use the COM port on the notebook computer. 3 On the pcAnywhere Host Login display, enter the username “InsuLogix® B” and the password “plus” and then depress the Enter key. Activate the InsuLogix® B + Monitoring display, if it is not already being displayed. 4 Record the reference number of any PF/TanDelta unit that has a red or blue cross thru the device symbol or a white cross thru a red device symbol. 5 Record the reference number of any Level unit that has a red horizontal arrow or a red or blue cross in the circle. 6 Record the reference number of any unit that has yellow or red in the top portion of the condition bar. 7 Click the cursor on the Alarm Status item in the menu bar at the top of the InsuLogix® B + Monitoring display to show the Alarm Status display. Record if Alarm 5 is red. Click on the in the upper right corner of the Alarm Status display to exit this display. 41 Warranty Warranty Products supplied by WEIDMANN are warranted against defects in material and workmanship for a period of one year following shipment. Our liability is specifically limited to replacing or repairing, at our option, defective equipment. Equipment returned to the factory for repair must be shipped prepaid and insured. This warranty does not include batteries, lamps, or other expendable items, where the original manufacturer’s warranty shall apply. We make no other warranty. The warranty is void in the event of abuse (failure to follow recommended operating procedures) or failure by the customer to perform specific maintenance as indicated in this manual. 42