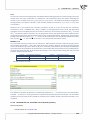
1
14
CORRELATION
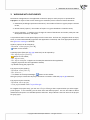
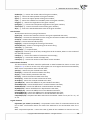
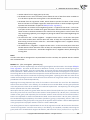
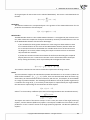
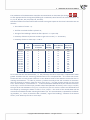
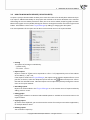
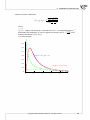
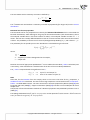
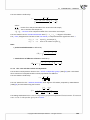
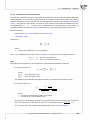
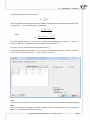
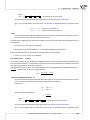
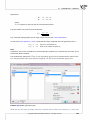
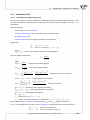
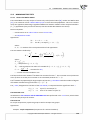
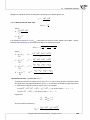
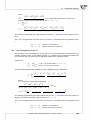
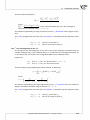
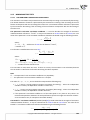
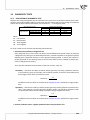
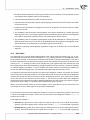
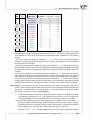
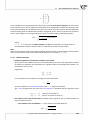
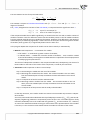
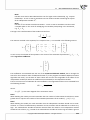
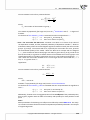
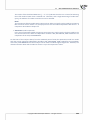
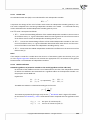
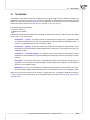
where:
O11 , O12 , O21 , O22 - observed frequencies in a con ngency table.
The Q coefficient value is included in a range of < −1; 1 >. The closer to 0 the value of the Q is, the
weaker dependence joins the analysed features, and the closer to −1 or +1, the stronger dependence
joins the analysed features. There is one disadvantage of this coefficient. It is not much resistant to
small observed frequencies (if one of them is 0, the coefficient might wrongly indicate the total dependence of features).
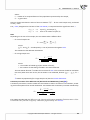
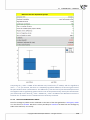
The sta s c significance of the Yule's Q coefficient is defined by the Z test.
Hypotheses:
H0 : Q = 0,
H1 : Q ̸= 0.
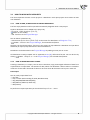
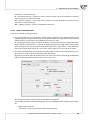
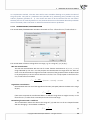
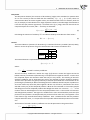
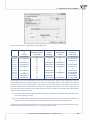
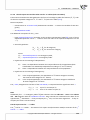
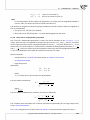
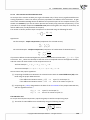
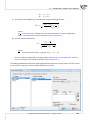
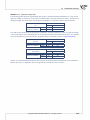
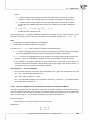
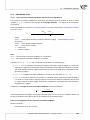
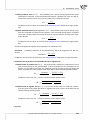
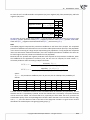
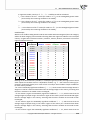
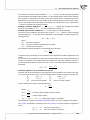
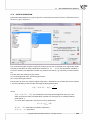
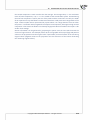
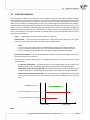
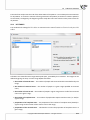
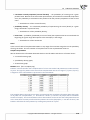
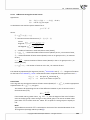
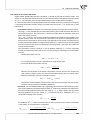
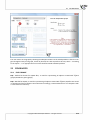
The test sta s c is defined by:
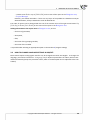
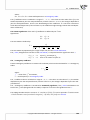
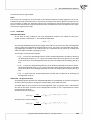
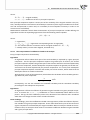
Z=√
Q
1
4 (1
− Q2 )2 ( O111 +
1
O12
+
1
O21
+
1
O22 )
.
The test sta s c asympto cally (for a large sample size) has the normal distribu on.
The p value, designated on the basis of the test sta s c, is compared with the significance level α:
if p ≤ α =⇒
if p > α =⇒
reject H0 and accept H1 ,
there is no reason to reject H0 .
The ϕ con ngency coefficient
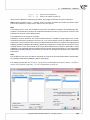
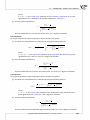
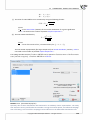
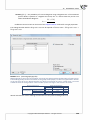
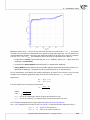
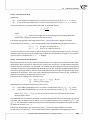
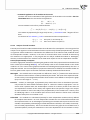
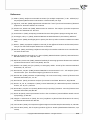
The Phi con ngency coefficient is a measure of correla on, which can be calculated for 2×2 con ngency
tables.
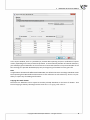
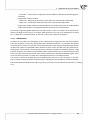
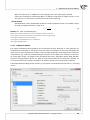
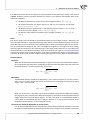
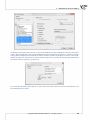
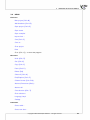
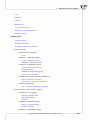
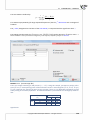
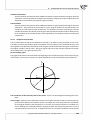
√
χ2
,
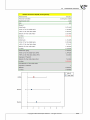
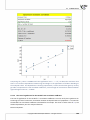
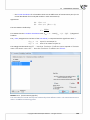
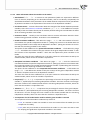
ϕ=
n
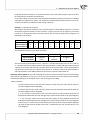
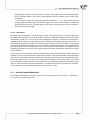
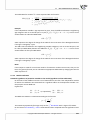
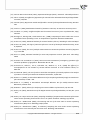
where:
χ2 − value of the χ2 test sta s c,
n − total frequency in a con ngency table.
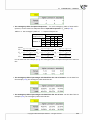
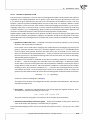
The ϕ coefficient value is included in a range of < 0; 1 >. The closer to 0 the value of ϕ is, the weaker
dependence joins the analysed features, and the closer to 1, the stronger dependence joins the analysed features.
The ϕ con ngency coefficient is considered as sta s cally significant, if the p-value calculated on the
basis of the χ2 test (designated for this table) is equal to or less than the significance level α.
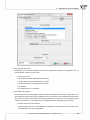
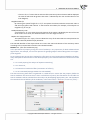
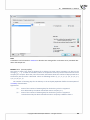
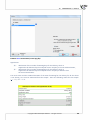
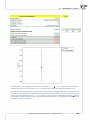
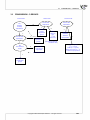
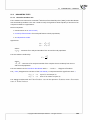
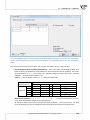
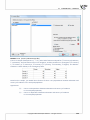
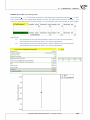
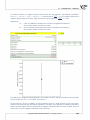
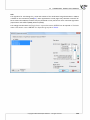
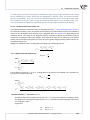
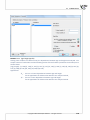
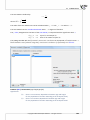
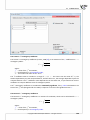
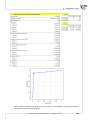
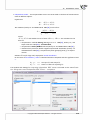
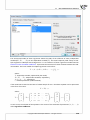
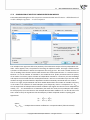
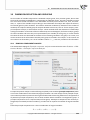
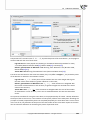
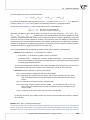
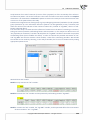
The se ngs window with the measures of correlation Q-Yule, Phi can be opened in Statistics menu
→ NonParametric tests (unordered categories) → Q-Yule, Phi (2x2) or in Wizard.
Copyright ©2010-2014 PQStat So ware − All rights reserved
189