1
19 SURVIVAL ANALYSIS
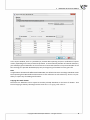
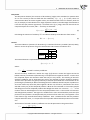
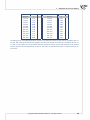
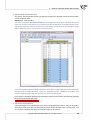
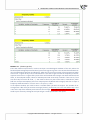
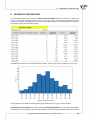
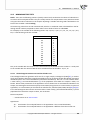
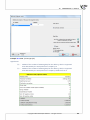
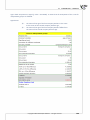
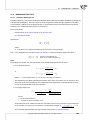
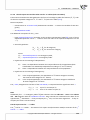
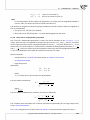
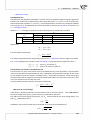
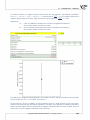
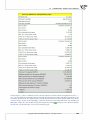
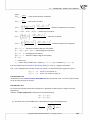
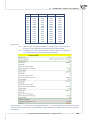
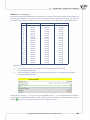
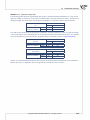
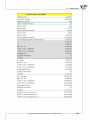
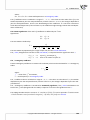
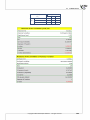
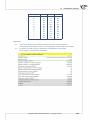
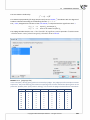
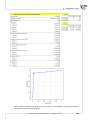
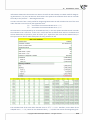
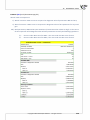
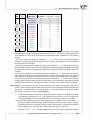
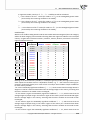
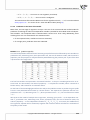
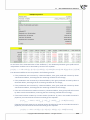
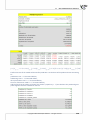
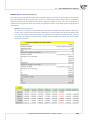
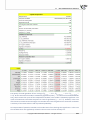
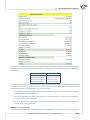
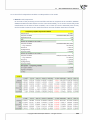
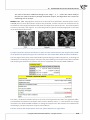
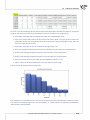
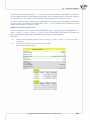
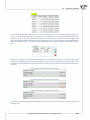
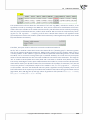
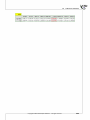
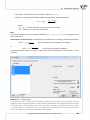
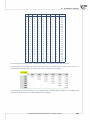
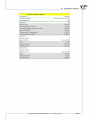
For each 3-year period of me we can interpret the results obtained in the table, for example, for people
living for at least 9 years a er the transplanta on who are included in the range [9;12):
• the number of people who survived 9 years a er the transplanta on is 39,
• there are 7 people about whom we know they had lived at least 9-12 years at the moment the
informa on about them was gathered but we do not know if they lived longer as they were le
out of the study a er that me,
• the number of people at the risk of death in that age range is 36,
• there are 14 people about whom we know they died 9 to 12 years a er the transplanta on,
• 39.4% of the endangered pa ents died 9 to 12 years a er the transplanta on,
• 60.6% of the endangered pa ents lived 9 to 12 years a er the transplanta on,
• the percent of survivors 9 years a er the transplanta on is 61.4% ± 5%,
• 0,08 ± 0.02 is the death probability for each year from the 9-12 range.
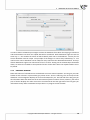
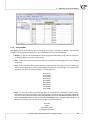
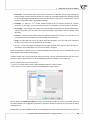
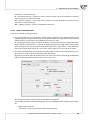
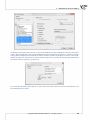
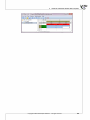
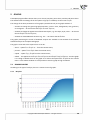
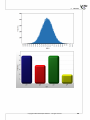
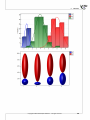
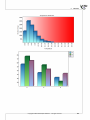
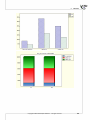
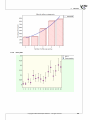
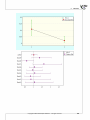
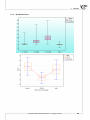
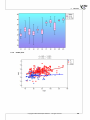
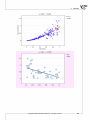
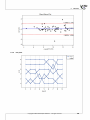
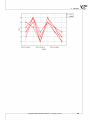
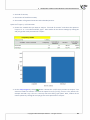
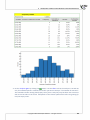
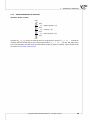
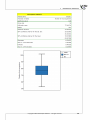
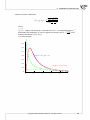
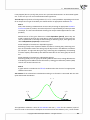
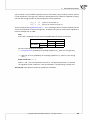
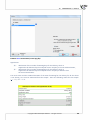
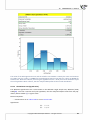
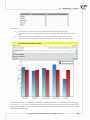
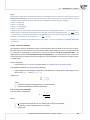
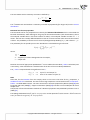
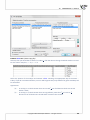
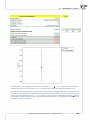
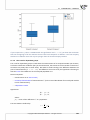
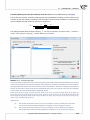
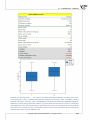
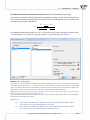
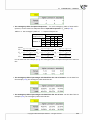
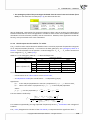
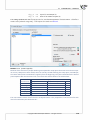
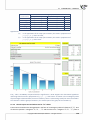
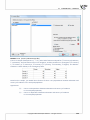
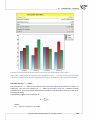
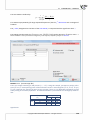
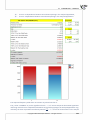
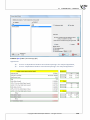
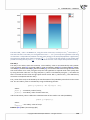
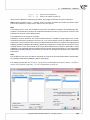
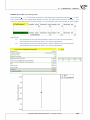
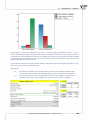
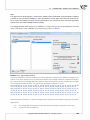
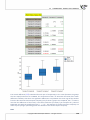
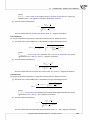
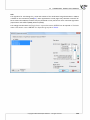
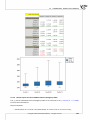
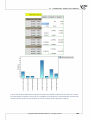
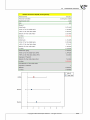
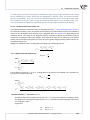
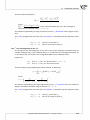
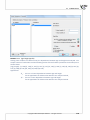
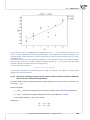
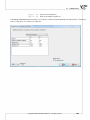
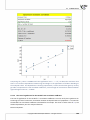
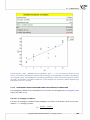
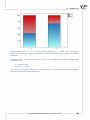
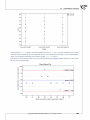
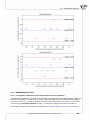
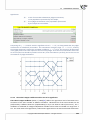
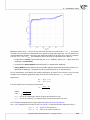
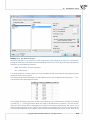
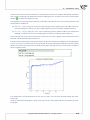
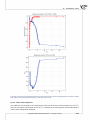
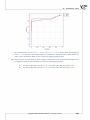
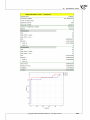
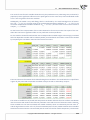
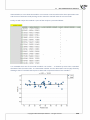
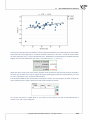
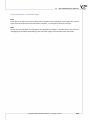
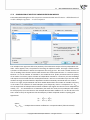
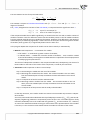
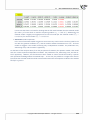
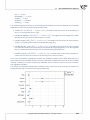
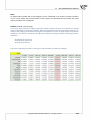
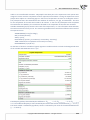
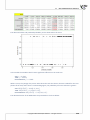
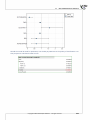
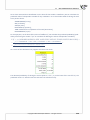
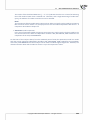
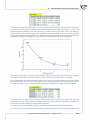
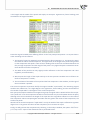
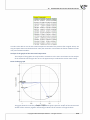
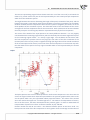
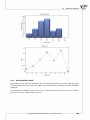
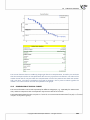
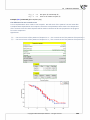
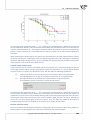
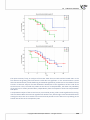
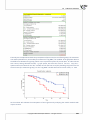
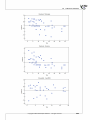
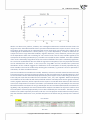
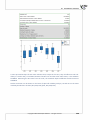
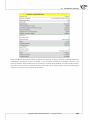
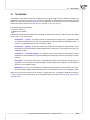
The results will be presented on a few graphs:
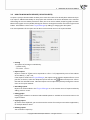
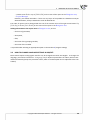
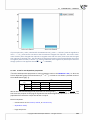
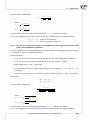
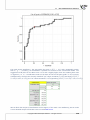
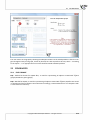
The probability of survival decreases with the me passed since the transplanta on. We do not, however, observe a sudden plunge of the survival func on, i.e. a period of me in which the probability of
death would rise drama cally.
Copyright ©2010-2014 PQStat So ware − All rights reserved
279