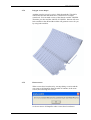
1
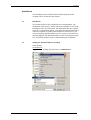
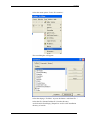
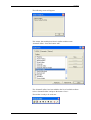
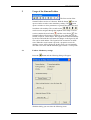
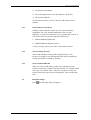
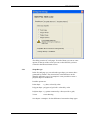
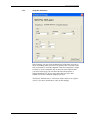
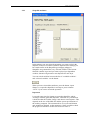
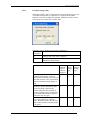
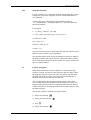
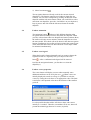
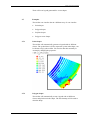
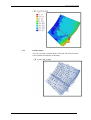
User’s guide
ArcMap SimonaToolbar
SIMONA report number 2008-10
User's guide
ArcMap SimonaToolbar
Coupling between ArcMap and Simona
Version number: 1.7, Mei 2014
Maintenance:
see www.helpdeskwater.nl/waqua
Copyright:
Rijkswaterstaat
Log-sheet
Log-sheet
document
version
date
Changes with respect to the previous version
1.0
20-02-2008
c70942. First version.
1.1
02-09-2008
C70942. Second version. Navigation buttons.
1.2
19-09-2008
C70942. Animation button added
1.3
17-10-2008
C70942: Animation of more then one shapefile layers simultaneously.
1.4
25-03-2009
C70942: Vector shapefiles via delft3d plugin
1.5
01-04-2009
C70942: Extensions to installation description and vector shapes
1.6
09-04-2009
C70942: Minor corrections vector shapes
1.7
07-05-2014
SIMONA-4128: Add SimonaToolbar on Windows7
1.7, Mei 2014
i
Preface
Preface
This is the documentation of the SimonaToolbar for the ArcGis
application ArcMap. Some screenshots in the documentation can be
different from the screens that will appear in ArcMap.
Results of Simona computations, which are stored on a SDS-file, can
be transformed to shapefiles. Shapefiles are created by Getdata and
they can be imported and visualized in ArcMap by using the
SimonaToolbar.
1.7, Mei 2014
ii
Contents
Installation ..................................................................................... 2
1.1 Installation .............................................................................. 2
1.2 Adding the SimonaToolbar in ArcMap .................................... 2
2 Usage of the SimonaToolbar ....................................................... 5
2.1 Toolbar: Mandatory settings .................................................... 5
2.1.1 Select Simona environment .............................................. 6
2.1.2 Select working directory ................................................... 6
2.1.3 Select a Simona SDS-file.................................................. 6
2.2 Shapefile settings .................................................................... 6
2.2.1 Shapefile type .................................................................. 7
2.2.2 Shapefile dimensions ........................................................ 8
2.2.3 Shapefile attributes ........................................................... 9
2.2.3.1 Potential settings (PSI)................................................10
2.2.4 Shapefile file-names ........................................................11
2.3 Toolbar: navigation ................................................................11
2.4 Toolbar: animation .................................................................12
2.5 Toolbar: reset legend ..............................................................12
2.6 Toolbar: vector properties.......................................................12
2.7 Examples ...............................................................................13
2.7.1 Point-shapes....................................................................13
2.7.2 Polygon-shapes ...............................................................13
2.7.3 Polyline-shapes ...............................................................14
2.7.4 Polygon vector-shapes .....................................................15
2.7.5 Known errors ..................................................................15
Installation
Installation
The installation of the SimonaToolbar and the integration with
ArcMap will be discussed in this chapter.
1.1
Installation
The SimonaToolbar will be installed by the simonainstaller. The
registration of the libraries will be done by the installer as well as the
installation of the .Net framework. The SimonaToolbar also contains
some dll’s of the Delft3D plugin. This means that the SimonaToolbar
cannot be installed at systems where Delft3D is installed. So if you
want to install the SimonaToolbar at such a system, you first have to
uninstall Delft3D. The SimonaToolbar uses the environment variable
WL_PLUGINS_HOME, which is defined during the installation.
1.2
Adding the SimonaToolbar in ArcMap
Start ArcMap.
On Windows7:
Right-click on ArcMap and select Run as Administrator:
)
1.7, Mei 2014
2
Installation
Select the menu-option “Tools à Customize”
The next dialogbox will appear:
Select the tabpage “Toolbars” en press the button “Add from file...”.
Select the file “SimonaToolbar.tlb” from the directory
ArcGis\bin\GisViewPlugin_Waqua\bin ArcGis is the installation
directory of ArcGis.
1.7, Mei 2014
3
Installation
The following screen will appear:
This means, that ArcMap has found a toolbar with the name
“SimonaToolbar”. Press the button “OK”.
The “SimonaToolbar” has been added to the list of available toolbars.
Select “SimonaToolbar” and press the button “Close”.
The toolbar is ready to be used now.
1.7, Mei 2014
4
Usage of the SimonaToolbar
2
Usage of the SimonaToolbar
The first section of the
SimonaToolbar consists of 2 buttons. With the button
you can
open a window to make some mandatory settings. The
button
opens a window to select parameters to generate the shape files and
load them with ArcMap. The second section
can be used to navigate through the mapdata of the shape. The last
section contains the reset button
and the vector button . The
SimonaToolbar will generate a legend for every shape that will be
loaded, except for vector shapes. The legend can be altered manually
by the user and with the reset button all changes to the legend by the
user can be made undone. The legend will be restored to its initial
state. When the vector button is pressed, a properties screen for
drawing vectors will be displayed. In this screen you can manually
alter the vector scale and the minimum gap between 2 vector points.
2.1
Toolbar: Mandatory settings
Press the
button and the following dialog will appear.
With this dialog you can select the following items:
1.7, Mei 2014
5
Usage of the SimonaToolbar
1) The Simona environment.
2) The working directory to store the temporary shape files.
3) The Simona SDS-file
If each of the items has a correct value the “OK” button will be
enabled.
2.1.1
Select Simona environment
With the “Browse Simona” button you can select the Simona
installation. Not every Simona-installation is able to create
shapefiles, so you have to make sure you’ve got the right version. At
least 2 files need to be present in the simona-directory.
·
SIMONADIR/bin/getdata.bat
·
SIMONADIR/etc/shapefile-gwb.txt
An error message will be given when a file cannot be found.
2.1.2
Select working directory
The second mandatory setting is the working directory. This
directory is needed to store the shapefiles that will be generated by
Simona and which are loaded by ArcMap.
2.1.3
Select a Simona SDS-file
When you select a SDS-file the toolbar will communicate with
Simona to read some variables from the SDS-file. For example which
time steps are available. These values are used later to let the user
choose which time steps to plot in the shapefile. This can take some
time.
2.2
Shapefile settings
Press
1.7, Mei 2014
, the following dialog will appear.
6
Usage of the SimonaToolbar
The dialog consists of 3 tab-pages. In each of them you can set some
options. In the top of the screen you can see the SDS-file you have
selected in the BrowseSimona screen.
2.2.1
Shapefile type
In the first tab-page you can select the type shape you want to have
generated by Simona. The selection has some influences on the
shapefile attributes page. For example it is not possible to create a
polyline shape for waterlevels.
Possible options are:
Point shape
-x,y dots, colored by value
Polygon shape –polygons of grid cell’s colored by value
Polyline shape –x,y points connected by a line (used for a grid)
Vector
-vector drawing
See chapter “examples” for the differences between the shape types.
1.7, Mei 2014
7
Usage of the SimonaToolbar
2.2.2
Shapefile dimensions
In this tabpage you can select the dimensions of the data you want to
show in ArcMap. When you have a big Simona-file, it will take some
time for Simona to create the shapefile. Therefore sometimes it might
be better to create a shapefile only for the part of the SDS-file that
you need. In this page you can select the start and stop-time, a
subgrid and the layers. If you select more than one layer, then
Simona will create a different shapefile per layer.
The button “Default values” will restore all the values to its original
values, if you have altered them. (only on this tabpage)
1.7, Mei 2014
8
Usage of the SimonaToolbar
2.2.3
Shapefile attributes
In this tabpage you can select the quantities you want to plot in the
shapefile. The list of available variables depends on the settings you
have made earlier in the Shapefile type tabpage (tabpage1).
Shapefiles are generated for every selected variable. If the current
SDS-file contains layers and you want to plot a layer dependent
variable, Simona will generate a new shapefile for each layer.
You can switch variables between the list of “available variables”
and “selected variables” via the button:
When you have selected the attributes, press the button “Open
Shape(s)” to open the shapefiles in Arcmap or press to button
“Close” if you want to cancel the operation.
Important
It can take some time for Simona to create the shapefiles and for
Arcmap to load the generated shapefiles. Therefore it’s possible that
it looks like that the Toolbar “hangs” and doesn’t react anymore. This
depends on the size of the SDS-file and the system specifications of
the working computer. The common advice is to wait until Simona
and ArcMap are finished. At the moment it’s NOT possible to check
the progress of Simona to let the user know how far it is.
1.7, Mei 2014
9
Usage of the SimonaToolbar
2.2.3.1
Potential settings (PSI)
When the variable “PSI” is selected, the sum of the total flow per cell
is calculated and stored in a shapefile. To compute the potential
function, some extra settings are required. Therefore an extra screen
will pop-up if you select the variable “PSI”.
Reference option: Manual referencing of discharges.
Ref option
1.7, Mei 2014
-1
Change sign if the value is negative
0
Disable the functionality
Change Never
sign if
change
value is sign
negative
Always
change
sign
Calibrate with extreme values in
field. (if the maximum is greater then
zero then extreme value is maximum,
otherwise minimum with change of
sign)
1
4
7
If mmax is greater then nmax, then
the m,n location is equal to the
location under the first segment of
the first column in irogeo. Otherwise
the location under the first segment
of the first row in irogeo
2
5
8
Use of m,n location as reference
value. With this option, also the m,n
value of the reference location needs
to be given.
3
6
9
10
Usage of the SimonaToolbar
2.2.4
Shapefile file-names
It’s not possible to set a file-name manually for the shapefile, because
Simona can create more shapefiles at once. Simona determines its
own filenames.
A Shape-file name generated by SimonaToolbar consists of:
“st”_”variablename”_”layername(optional)”_”ITDATE”(optional
increasing number)
For example:
·
st _RP_L1_2000_03_22(1).shp
st: “Every shape filename begins with the prefix st”
variable name: “RP”
layer name: “L1”
ITDATE: “2003_03_22”
Number: “(1)”
The layer name will only be added when the SDS-file contains layers
and the current variable is layer dependent.
The optional number at the end of the filename will only be added to
the shape filename if the shape filename without the number already
exists. If the shape filename with the number also exists, Simona will
choose a unique number.
2.3
Toolbar: navigation
When the SimonaToolbar loads a shapefile, it will automatically
generate a legend. Arcmap uses this legend to draw the shape. When
the shapefile contains several time steps, the toolbar will determine
the MIN and the MAX values. The legend will be divided into 10
different classes between the min and the max.
This is important for the navigation buttons, because the toolbar
won’t change the legend when the navigation buttons are used. The
same legend will be used for every timestep. When the user chooses
a different legend in Arcmap, the toolbar will use this legend, to draw
the other timesteps.
The toolbar contains 5 different navigation buttons.
1) Show first timestep.
2) Show previous timestep.
3) Play.
4) Show next timestep.
1.7, Mei 2014
11
Usage of the SimonaToolbar
5) Show last timestep.
The navigation buttons will only work for the current selected
shapefile(s). The buttons cannot be used when no shapefiles are
selected. You can select a shapefile by clicking on the name of the
shapefile with the left mouse button. When you would like to select
more then one shapefiles, press the “Ctrl-button” on your keyboard,
keep it presses and click with the left mouse button on another
shapefile.
2.4
Toolbar: animation
The animation button
behaves a little different then the other
navigation buttons when you select more then one shapefile. When
you have selected more then one shapefile and want to animate them,
the toolbar will only start to animate, when the shapefiles are from
the same model. This check will not be done for the other navigation
buttons. Furthermore, the toolbar will only animate the common part
of the individual time intervals. More than one vector shape cannot
be animated simultaneously.
2.5
Toolbar: reset legend
When the legend is changed manually and you want to change the
legend back into it’s originally state, you can press the reset
button
. After a confirmation the legend will be restored.
Just like the navigation buttons, you first have to select the
shapefile(s).
2.6
Toolbar: vector properties
The vector button will display a screen where manually some
additional attributes can be set by the user. . When vectors are
initially displayed to small or to large, it’s possible to scale the
vectors by setting the scale factor to an appropriate value. The final
scale factor is the inputted value times the diameter of the smallest
grid cell.
It’s also possible that the toolbar will draw a shape with vectors
initially to “crowded”. Therefore, an attribute can be set, what will
present the minimal gap between 2 vectors (in pixels).
1.7, Mei 2014
12
Usage of the SimonaToolbar
Their will be no legend generated for vector shapes.
2.7
Examples
The toolbar can visualize data in 4 different ways. It can visualize:
2.7.1
·
Point shapes
·
Polygon shapes
·
Polyline shapes
·
Polygon vector shapes
Point-shapes
The toolbar will automatically generate a legend with 10 different
classes. The symbol that is used to represent a point in the shape, can
be chosen to big by the toolbar. You need to alter this manually in
Arcmap by changing the properties.
2.7.2
Polygon-shapes
The toolbar will automatically create a legend with 10 different
classes and plot them in the shape. The first timestep will be used to
draw the shape.
1.7, Mei 2014
13
Usage of the SimonaToolbar
2.7.3
Polyline-shapes
You can only make a polyline shape of the grid. The M and N values
will be plotted automatically in the shape.
1.7, Mei 2014
14
Usage of the SimonaToolbar
2.7.4
Polygon vector-shapes
ArgMap can plot vectors by using 2 fields from the dbf. The dbf is
used to store the data that needs to be visualized. For example
waterlevels. You can make vectors of the Simona variable VSPEED.
Therefore you also need the ANGLE of VSPEED. Simona will store
both variables in the dbf and the toolbar will generate vectors for you
by using both variables.
2.7.5
Known errors
When vectors have been drawn by Arcmap during a session and the
user removes all shapefiles from the table of contents, in the same
session, the following error occurs:
So do not remove all shapefiles when vectors have been drawn.
1.7, Mei 2014
15