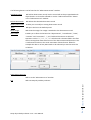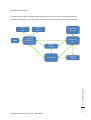
1
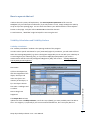
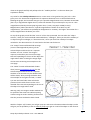
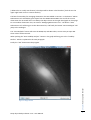
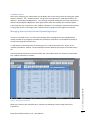
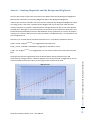
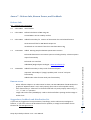
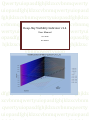
Qwertyuiopasdfghjklzxcvbnmqwerty
uiopasdfghjklzxcvbnmqwertyuiopasd
fghjklzxcvbnmqwertyuiopasdfghjklzx
cvbnmqwertyuiopasdfghjklzxcvbnmq
Deep-Sky Visibility Indicator v1.4
wertyuiopasdfghjklzxcvbnmqwertyui
User Manual
opasdfghjklzxcvbnmqwertyuiopasdfg
hjklzxcvbnmqwertyuiopasdfghjklzxc
vbnmqwertyuiop
17-5-2010
M.J. Maters
asdfghjklzx
dfghjklzxcvbnmqwertyuiopasdfghjklz
xcvbnmqwertyuiopasdfghjklzxcvbnm
qwertyuiopasdfghjklzxcvbnmqwerty
uiopasdfghjklzxcvbnmqwertyuiopasd
Table Of Contents
Quick Installation Guide [PLEASE READ BEFORE OPENING EXCEL FILE] ................................................. 3
Introduction............................................................................................................................................. 4
How to operate the tool .......................................................................................................................... 5
Visibility Calculation and Visibility Surface .......................................................................................... 5
Visibility Calculation ........................................................................................................................ 5
Visibility Surface .............................................................................................................................. 8
Managing Observation Lists and Optimizing Routes........................................................................... 8
Add Reset ...................................................................................................................................... 10
Export (Generate Scroll File).......................................................................................................... 10
Import ............................................................................................................................................ 10
Observation Routing Graph and route optimization ........................................................................ 11
Catalogue........................................................................................................................................... 11
Observation Record ........................................................................................................................... 12
Using an external tool ....................................................................................................................... 15
Add a couple of initial objects ........................................................................................................... 15
Creating an observation list by constellation .................................................................................... 16
Module Structure .................................................................................................................................. 17
Annex 1 - Limiting Magnitude and Sky Background Brightness ............................................................ 18
Annex 2 - Explanation of the field "Type" in the catalogue .................................................................. 19
Annex 3 - Note about the catalogi ........................................................................................................ 20
Annex 4 – Import function .................................................................................................................... 21
Annex 5 – Error messages ..................................................................................................................... 22
Annex 6 – Backup and Restore .............................................................................................................. 23
Annex 7 - Release Info, Known Errors, and Feedback .......................................................................... 24
Release Info ....................................................................................................................................... 24
Known errors ..................................................................................................................................... 24
Suggestions, feedback and distribution-list ...................................................................................... 24
Deep-Sky Visibility Indicator V1.4 – User Manual
Chapter: Quick Installation Guide [PLEASE READ BEFORE OPENING EXCEL FILE]
Workflow ............................................................................................................................................... 15
2
Quick Installation Guide [PLEASE READ BEFORE OPENING EXCEL FILE]
DVI version 1.4 is only available for Excel2007 and higher. When “DVI V1.4.xlsm” is first opened it will
create a directory structure on your main hard-drive directly under the root directory, and will
automatically save “DVI V1.4.xlsm” again.
Before opening the excel workbook the first time make sure that:
a) ViewObject.exe is placed in the same directory as “DVI V1.4.xlsm”
b) In the excel Trust Center (in Dutch: Vertrouwenscentrum) make sure that you will accept
“Macros” and have the proper Active-X settings. You can do this by opening Excel [NOT DVI
V1.4.xlsm!!] and:
Notes:
1. I’m not 100% sure that the above is a proper translation, since I work from a Dutch excel2007
version.
2. Allowing Macro’s can be harmful if non-trusted excel applications/workbook are opened.
3. I noticed that on rare occasion for some obscure reason the program doesn’t work for some
installations of Excel2007, I’m clueless to what the cause might be. Any help or feedback on
this would be appreciated.
Now simply open “DVI V1.4.xlsm” and installation will be handled automatically.
It might be advisable to read Annex 6 – “Backup and Restore”, when you intend to use the
“Observation Record” –Database.
Prerequisites:
For proper operations of the “Finder-chart” functionality and the “inverse” function of “Image” you
will need an internet connection and the Microsoft .NET framework version 3.0 or higher needs to be
installed on your PC/LapTop. This .NET framework comes automatically with the Vista operating
system and its successors, and can be freely downloaded from the Microsoft ® website. For more
information about the .NET framework see:
http://msdn.microsoft.com/en-us/netframework/default.aspx
Deep-Sky Visibility Indicator V1.4 – User Manual
Chapter: Quick Installation Guide [PLEASE READ BEFORE OPENING EXCEL FILE]
a. Click the Microsoft Office Button
, and then click Excel Options.
b. Click Trust Center, and then click Trust Center Settings.
c. Active-X Settings: Select 3rd option:
i. Warn before…
d. Marco settings: Select 4th option:
i. Enable all macro’s….
3
Introduction
What can be more frustrating, for a beginner amateur astronomer, then going out in the dark cold
night with your telescope , making sure the scope is properly aligned or if you have a GoTo system, it
is properly initialized, only to discover that you can't get any sight of the first few objects you are
trying to observe.
This tool helps rookie [or perhaps also the more advanced] amateur astronomers to give at least
some clue [or if you will: indication] about the visibility of certain deep-sky objects [the tool won't
work for stellar or stellar-like objects!]. After its first incubation the tools developed further and
features to manage observation lists were added. Now those features are the lions-part of this tool,
enabling you to manage and optimize observation lists.
Many people will use a planning program [e.g. Sky Tools] to make observation lists. I believe that this
tool can still provide a powerful addition to those programs because:
•
•
•
•
•
DVI enables you to optimize your “observation routes”,
DVI enables you to add “reset stars”,
DVI is capable of importing “ ;-separated files” [.csv extension] which can be created by most
of the popular planning programs,
DVI enables you to study the visibility of Deep-sky objects for your night-sky conditions in
detail,
DVI enables you to generate “GoTo system specific “ output files [currently only for Mel
Bartels system, but more can be build on request], saving you considerable time and avoiding
typing errors.
New features in release 1.4 are:
•
•
•
Administer the objects you have observed in the database,
Create, show and print finder-charts,
Show and print images of the objects.
But more about the above-mentioned functionality later on in this document.
The tool contains 9 catalogues with over 28,000 deep-sky objects. The catalogues included are:
Messier, NGC, IC, Caldwell, ARP, Herschel 400, UGC, Abell, and finally BOC [The Bright Object
Catalogue from www.AstroForum.nl].
Chapter: Introduction
Have fun using it!
Deep-Sky Visibility Indicator V1.4 – User Manual
4
How to operate the tool
I believe the tool is pretty self explanatory. The most important parameter to fill out is the
DIAM[eter] of your telescope in millimeters [if you only know it in inch, simply multiply this value by
25.4] on top of the opening page. You can store this value as your default with the "Store Defaults "
button on that page. Only the cells in MEDIUM BLUE should be altered!
To read section 4, "Workflow" might be helpful to start using the tool.
Visibility Calculation and Visibility Surface
Visibility Calculation
The “Visibility Calculation” window is the opening window of the program.
In order to do a specific calculation for your [estimated] night-sky conditions, you will need to fill out
either the Limiting Magnitude [e.g. what is the highest magnitude you can see with your naked eye at
a normal night at your observing site], or if you have a SQM [Sky Quality Meter] you can do a
measurement and fill-out the Sky Background Brightness [SBo]. See Annex 1 - Limiting Magnitude
and Sky Background Brightness
Next either:
Figure 1 - Visibility Calculation window
b) in the object selector
box select a catalogue and
a number.
Now 2 things have
happened:
Figure 1 - Opening screen DVI
The Output-box has been
updated to show a visibility-indicator, now if this says 0 [ZERO], you most probably won't be able to
see it. You might try it, especially if you're a more advanced observer, but it is anyway best is to
Deep-Sky Visibility Indicator V1.4 – User Manual
Chapter: How to operate the tool
a) fill out the Object-box,
with the magnitude of the
object, the major and
minor axis [size in arcminutes] of the object, or
5
observe the graph carefully and perhaps also the " Visibility Surface" on the next sheet (see
explanation below).
Any value for the visibility-indicator between 1-10 is more or less good and try your luck. It also
gives you a clue about what magnification for optimum detection to use in the field below that.
Reading the graph: The horizontal axis give you a possible magnification to use, between 30 and 480
[don't try a magnification higher than 1,5 times the diameter of your telescope in any case or a low
magnification whereby the exit-pupil is greater than +/-7mm, exit-pupil = DIAM (in mm)/
Magnification]. When the value for a specific magnification is below -0.35: Don't try this
magnification, you will be most probably be disappointed. In summary: the higher the number for a
certain magnification the better your luck!
On top of the graph you will find the "source" of the data presented, this can either be: "object
selector", when you use the method mentioned above, "catalogue", when you check the visibility of
an object using the catalogue, or "observation list", when you check the visibility of an object
included in the observation list. I'll come back to the later two further on.
The “Image”-button will download an image
(source: STScI Digitized Sky Survey) of the
selected object and show this in a separate
window. You can “inverse” the image if
required, and make a print-out of the image.
Remark: Depending on the size of the object this
might take a while. Inverting the image might
also be time consuming. See example on the
next page.
Warning: Only one Image or Finder-window can
be opened at the same time. Before opening
another Image or Finder window, please ensure
that the previous window has been closed.
Figure 2 - Example Finder-Chart
With the "Object Info"-button you will get a pop-up with more information about the object, and it
will give you the possibility to link to www.sky-map.org to get an visual of the object on the internet.
Deep-Sky Visibility Indicator V1.4 – User Manual
Chapter: How to operate the tool
The “Finder”-button will download a finderchart (source: www.Messier45.com) for the
selected object and show this in a separate
window. In the window only the detailed view
will be shown, when printing the finder-chart,
see example on the right-hand side, a nakedeye view and view-finder view will also be
presented, with Field-of-View circles in the
detailed-view. Remark: Depending on the size of
the object this might take a while.
6
(I believe this is a really neat feature). The object will be shown in the blue-box. [click the X in the
upper right-hand corner to remove the box].
The basic functionality for managing observation lists was added in version 1.2. The button "Add to
Observation List" will add the given object from the OBJECT SELECTOR to the end of the current
observation list. Be careful this is not always the object shown in the right-hand graph on that page.
For more about observation lists, see section "Managing Observation Lists". The button "GoTo
Observation List" will bring you to the observation list, and finally the button "GoTo Catalogue" will
jump to the catalogue.
The “Store Defaults” button will store the DIAM, LM, and SBo values, so next time you open DVI
those values will be restored.
When pushing the "GoTo Visibility Surface" button in the graph will bring you to the "Visibility
Surface" which is explained in the next paragraph.
Figure 3 - Image window
Deep-Sky Visibility Indicator V1.4 – User Manual
Chapter: How to operate the tool
Finally the “Exit” button exits the program.
7
Visibility Surface
Now when preparing your observations you probably don’t know exactly what the seeing/sky quality
will be in advance. The " Visibility Surface" will give you the indications in a 3D representation for
different "Sky Background Brightness’s. The resulting 3-D graph should give you some indication for
different Sky Background Brightness and magnifications about the visibility of the selected object.
From this graph you can go back to the "Visibility Calculation" by pushing the respective GoTo button
on the graph. See for an example of the “Visibility Surface”-graph the front-page of this manual.
Managing Observation Lists and Optimizing Routes
As soon as I finished version 1.1 of the tool including all the catalogues with over 28,000 objects
readily available at my fingertips I realized how powerful it would be as I could add functionality to
create and manage observations lists.
To add objects to the observation list simply push the ""Add to observation list" button in the
"Visibility Calculation" window. The selected object will be added at the bottom of the observation
list.
Figure 4 - Observation List window
Most of the columns are self explanatory, however the following columns might need some
explanation:
Deep-Sky Visibility Indicator V1.4 – User Manual
Chapter: How to operate the tool
The remaining functionality can be found when the “GoTo Observation List” button is pushed from
the “Visibility Calculation” window.
8
Type
ODM/VI
R
RC
This is the “type” of object, an explanation can be found in Annex 2
“Optimum Detection Magnification” / “Visibility Indicator”
R indicates that this is a so-called “Reset Star”
Indicates the Record number or line-number in the so-called scroll-files, this in only
applicable when using scroll-files
When you are in the “Observation List” window there are numerous options. When you push the
“File Menu”-button, the following sub-menu will be opened:
From left to right the buttons are:
New
Generates an new observation list
Open
Will open an existing observation list
Save / Save As
Saves the list in a CSV format that can be read by e.g. Excel as well
Print
Will print the list to the default printer
Import
Imports an observation-list generated with another program, see for further
explanation below.
Export
Will export the observation list to an external program, see for further
explanation below.
Exit
Exits the program
The File-menu bar can be closed by clicking on the area around the buttons.
Delete Item
Will delete the item on the selected item from the list
Move Up/Dwn
Will move the selected item up/down in the list
Reverse Route
Puts the observation list in reverse order [might come in handy when you did
a route optimization]
On the upper right-hand side the so-called “GoTo…”-buttons can be found, those buttons will bring
you to the respective part of the program.
Last but not least in the centre section just above the actual observation list the following button can
be found:
Deep-Sky Visibility Indicator V1.4 – User Manual
Chapter: How to operate the tool
Furthermore in the centre of the upper part of the screen the following buttons can be found:
9
Image
Shows an image of the selected object, for detail refer to page 5.
Finder
Creates a Finder-Chart for the selected object, for detail refer to page 5.
Visibility Calc.
Does a visibility calculation of the selected object 1
Find CloseBy
Jumps to the catalogue and will show you the Deep-Sky objects in the close
neighborhood of the selected object. See section Catalogue for a more details
description of the features.
Add Manually
Gives you the option to manually add objects to your observation list. Limited
error checking on the input variables is done.
Add Reset
Adds a Reset Star to the observation list, for a more detailed explanation see
the section below.
Add to observed list Will add the selected object to the observation Database. In the section
“Observation Records” this functionality will be explained in detail.
The functionality requiring more explanation, as mentioned above, is:
Add Reset
This functionality can be used to calibrate setting-circles or re-init GoTo sysems to ensure the DeepSky object will be seen in your Field of View. It works as follows:
What it will do is look for nearby stars [initially 2 degrees] from the Yale Bright Star Catalogue to the
Deep-Sky object selected. If no nearby Bright Star can be found, there is an option to look in a 4x4 or
even 8x8 degrees area. When too many stars are listed, the list can be narrowed down to an 30’x30’
or 1x1 degrees area around the selected object. In the list select an appropriate star and push the
"select"-button. The selected star will be added to your observation list before the object selected.
Import
The import function is developed to be able to import data from other tools [e.g. such as Sky Tools].
The import function reads a “semicolon separated” file, which can be generated by for example
Excel. The header-line of this file will tell the “Import function” how to interpret the data. See for a
full explanation Annex 4 – Import Function.
1
When you use this function the Visibility Graph is shown, the Object Selector will still show you the originally
selected object. When you press the “Copy to Object Selector” button, the object will be copied to the object
selector. Be mind-full that the Visibility Graph might alter at this point. The reason for this being that the initial
“Visibility Calculation” is done on the original data from the catalogue. When pushing the “Copy to Object
Selector” button the program will use the NGC,IC or UGC data if available, which can differ from the original
data from the selected object.
Deep-Sky Visibility Indicator V1.4 – User Manual
Chapter: How to operate the tool
Export (Generate Scroll File)
This will generate a scroll-file for Mel Bartels' system with the *.scr extension. People who use that
system will understand it. Optionally in the future more file generation can be added to the tool, if
you do have requests in that area, please see section Annex 5 – Suggestions, feedback and
distribution list.
1
0
Observation Routing Graph and route optimization
From the “Observation List” you can go to the “Routing Graph”. The Routing Graph is a really
powerful tool and gives a graphical representation of the current Observation List. It makes it easy to
sport any irregularities in the Observation List. The Routing Graph has the option to optimize the
route, simply by pushing the "Optimize Route" button you will find on the graph. The algorithm being
used is a so-called Shortest Path First algorithm. By definition this algorithm will not always find the
shortest route. [ more complex algorithms are out of my league in terms of my visual basic
knowledge.]
When the route have been optimized you can reverse the route, this might come in handy to follow
the “right direction”, or for example to have more difficult to spot objects nearby the end of your
observation session.
From the Catalogue you can directly jump to the “Visibility Calculation”, “Observation List”, or
“Routing Graph” by using the respective “GoTo”-button.
Chapter: How to operate the tool
From the “Routing Graph” you can go back to the “Observation List” or “Catalogue” by using the
respective “GoTo”-buttons.
Deep-Sky Visibility Indicator V1.4 – User Manual
1
1
Figure 5 - Observation Routing Graph
Catalogue
There are various entry-points into the catalogue. You can jump directly to the catalogue from the
“Visibility Calculation”-window or from the “Observation List”, or alternatively you can use the “Find
Closeby” feature found in the “Observation List”-window.
The “Catalogue” will always show nearby objects around a selected object from the observation list.
This object is displayed in the upper right-hand corner. In the upper left-hand corner you will see
which area around the selected object is shown: 15’x15’, 30’x30’, 1x1, 2x2, 4x4, 8x8 degrees or the
whole catalogue is show, indicated by “Show All”. This can be altered using the buttons on the
upper left-hand side of the screen.
By using the drop-down boxes “Const.” [Constellation] and/or “Catalogue” the list can be narrowed
down if needed.
Now you are able to add a selected object to your observation list by simply selecting an object from
the list and then pushing the “Add to Obs.-List”-button, or do a visibility calculation2 for the selected
object by pushing the respective button.
Observation Record
There is only one entry point to the “Observation Record”-window, and that is through the
“Observation List”-window. Use the “GoTo Observed List”-button to go to the Observation Record
Database.
2
The “GoTo Visibility Calc.”-button will simply GO to this window the “Visibility Calc.”-button will go there as
well, but will also show a visibility calculation of the selected object.
Deep-Sky Visibility Indicator V1.4 – User Manual
Chapter: How to operate the tool
One of the new features in DVI release 1.4 is the Observation Record Database, which allows you to
keep track and make records of your observations.
1
2
Figure 6 - Add Observation Record
Some object and other details are already pre-populated on your screen, but can be modified. With
the “Browse…”-button and image (e.g. a scanned drawing) can be added to the Database as well.
However before doing this it is advised to create your Observation-locations, Instruments, Eyepieces, and used Filters in the Database. This is done by selecting the “Defaults”-tab when the “Add
to observed list”-button has been pushed.
Deep-Sky Visibility Indicator V1.4 – User Manual
Chapter: How to operate the tool
Normally observation records are added from an existing observation list in the “Observation List”window. Simply open an Observation-list and push the button “Add to observed list”, and the
selected object will be added to the Observation Database. The following screen will be shown:
1
3
The following buttons can be found in the “Observation Record”-window:
Add Observation
Will add an observation record, but the record will not be pre-populated with
object details. It is therefore advised to use the “Add to observed list”-button
in the “Observation-List”-window.
Delete Observation
Will delete the selected observation record
Modify Observation
Enables you to modify an existing observation record.
Print
Will print the list to the default printer
Show Image
Will show the image if an image is attached to the observation-record.
Select View
Enables you to filter the list based on “Object Name”, “Constellation”, “Date”,
“Location” and “Instrument”. *, and ? wildcard characters are allowed.
Operators such as “>”, “>=”, “<”, “<=” will also work. The Date-field in the filter
will not accept plain dates without one of the above mentioned operators. This
is unfortunate but due to the excel-annotation of date-formats. When for
example the data 5th of may 2010 needs to be selected you need to enter this
as follows:
GoTo Observation List
Will Go to the “Observation List”-window.
Will exit Deep-Sky Visibility Indicator.
Chapter: How to operate the tool
Exit
Deep-Sky Visibility Indicator V1.4 – User Manual
1
4
Workflow
I have added this section to outline how I’m using my own tool. Perhaps this section is superfluous,
but I thought that this may be handy anyway for the beginning observer.
In my mind there are various ways to generate effective/efficient observation lists:
•
•
•
Use an external tool and import data into this tool
Add a couple of initial objects to the observation list and complement the list
Create an observation list by selecting objects in a certain constellation
There are obviously more ways, but to aid the beginner I will be outlining the above mentioned
methods in a wee bit more detail using DVI.
Using an external tool
When using an external tool to generate observation lists, the assumption is that the “visibility” of
the objects is already verified in the external tool. If not, this program enables you to verify it once
more once the data is imported.
Step 1.
Step 2.
Step 3.
Step 4.
Step 5.
Step 6.
Step 7.
Import the data using the import function, see for a full explanation of the import
function Annex 4.
Verify that the data-import was done correctly
If required add objects using the “Find CloseBy” function.
Look at the “Routing Graph” to verify if you’re happy with the routing and if not, use
“Optimize Route” to optimize the routing.
If you need to align / reinitialize your GoTo system or setting-circles, add “Reset Stars”
at required intervals
Save and if required print your observation list.
When using Mel Bartels GoTo system generate a scroll-file.
Add a couple of initial objects
Step 1.
Step 2.
Using the “Object Selector” in the “Visibility Calculation” window, select your objects,
and if required check the “Visibility” of the chosen objects and add those objects to the
Observation List with the “Add to Observation List”-button. Using the “Object Info”button, will give you the possibility to link to www.sky-map.org to get a visual of the
objects on the internet.
Once this is done go to the “Observation-List” window and for each object use the
“Find CloseBy”-button to go to the catalogue to see if there are more interesting
objects to be added to your observation list. Before adding more object ensure you
check the visibility of each object using the “Visibility Calc.”-button in the cataloguewindow.
Deep-Sky Visibility Indicator V1.4 – User Manual
Chapter: Workflow
People using a simple stellarium program might have an idea of some objects in the same vicinity
they might wish to observe. This workflow will help those to optimize their observation lists.
1
5
Step 3.
From this point onward follow steps 3 until 7 in the previous workflow “Using an
external tool”.
Creating an observation list by constellation
This workflow became my favorite after first having used the workflow as mentioned above. This
workflow is based on the idea to observe objects by constellation.
Step 1.
Step 2.
Step 3.
Step 4.
Step 5.
Chapter: Workflow
Step 6.
Go to the Catalogue-window and ensure the “field of view” is set to “Show All”.
With the “Const.-dropdown”-list select the constellation for which you want to create
an observation list.
With the “Catalogue-dropdown”-list select your chosen catalogue, and add the chosen
objects to your observation list. If needed check the visibility first using the “Visibility
Calc.”-button.
Repeat step 3 for other catalogues if required
If required go back to step 2, and select a constellation next to the previous one you
used.
From this point onwards follow steps 3 until 7 in the previous workflow “Using an
external tool”.
Deep-Sky Visibility Indicator V1.4 – User Manual
1
6
Module Structure
The diagram below gives a graphical representation of how you can move back and forth between
the different modules . This to aid the user to understand how one can move through the program:
Object
Info
START
Visibility
Surface
Observation
Records
Visibility
Calculation
Observation
List
(incl. Object Selector)
Image &
Finder
Routing
Graph
Chapter: Module Structure
Catalogue
Deep-Sky Visibility Indicator V1.4 – User Manual
1
7
Annex 1 - Limiting Magnitude and Sky Background Brightness
Over the past couple of years there has been much debate about the Sky Background Brightness
[SB0] and the translation from Limiting Magnitude [LM] to Sky Background Brightness.
I believe the consensus reached in the end is that the maximum Sky Background Brightness equals
22.0 mag./arcsec2. Hence the "Visibility Surface diagram will stop at that point. Now the other
relevant reference to consider is what LM will the average observer be able to see at this darkest
possible point. Although I'm not convinced there is consensus here, but based on discussions and
backed with extrapolated data from the Dutch Meteor Society [important to note for the skeptics
amongst you is that the data used is not only measured in The Netherlands], it is reasonable to set
this at magnitude 7.0.
Next then is to consider which translation formulas to use. I've looked at 3 different options:
a) SB0 = 21.58 - 5Log(10(1.586-LM/5)-1) as suggested by Nils Olof Carlin
b) SB0 = 24.19 - 2.814LM + 0.3694LM2 as suggested by José Ramón Torres
Plotting those formula's against data from the Dutch Meteor Society [based on over 500
observations], see figure below, it became apparent that the last formula as suggested by Jan van
Gastel matched the data best. Hence in this program this formula will be used.
Deep-Sky Visibility Indicator V1.4 – User Manual
Chapter: Annex 1 - Limiting Magnitude and Sky Background Brightness
c) SB0 = 22 - 5Log(10(1.7-LM/5)-1) as suggested by Jan van Gastel, based on the initial formula by Nils
Olof
1
8
Annex 2 - Explanation of the field "Type" in the catalogue
The field Type (see table below) corresponds to the type of object and gives further information. The
most complex type information is given for galaxies (e.g. the Hubble type), mainly adapted from
UGC, ESO and PGC or determined by own estimation. Generally types differ between various
sources. There is a special type for ring galaxies, following Thompson. Types for open clusters are
included according to Trümpler's classification. For globular clusters the concentration class (I...XII) is
given.
Type
*, *2,..,*Grp
C, D, E, I, P, S
Chapter: Annex 2 - Explanation of the field "Type" in the catalogue
R.., PRG
GxyP
OCL
GCL
DN, EN, RN, PN
SNR
GX
NF
Explanation
Star, double star,..,star group (asterism)
Galaxy: compact, dwarf, elliptical, irregular, peculiar, spiral (d=dwarf,
B=bar, R=ring , M=mixed); other letters: from Hubble type or its extensions
Ring galaxy (see [30]), Polar ring galaxy
Part of galaxy (e.g. bright HII region)
Open cluster (if no Trümpler class is available)
Globular cluster (if no concentration class is available)
Nebula: dark, emission, reflection, planetary
Supernova remnant
Galaxy
Not found
Deep-Sky Visibility Indicator V1.4 – User Manual
1
9
Annex 3 - Note about the catalogi
I've included the following catalogi in the object selector: Messier, Caldwell, NGC, IC, Herschel400,
ARP , UGC, Abell Planetaries and BOC [Bright Object Catalogue of Astroforum, www.astroforum.nl] . I
find the NGC, IC and UGC catalogi I use the most accurate, so if there is a reference from one of the
catalogi to the NGC, IC or UGC catalogue the tool will use the data from those. Special attention for
the ARP catalogue: the tool will only show the data for the object with the lowest magnitude
[sometimes ARP object consist for example of 3 different UGC objects], which is not necessarily the
one which is the easiest to spot [i.e. the tool might give you wrong info].
Chapter: Annex 3 - Note about the catalogi
In general, the catalogi are put together with much care, but I can't guarantee 100% accuracy. The
output of this tool is very sensitive to the data put into the tool, meaning if you want to be sure check
your data.
Deep-Sky Visibility Indicator V1.4 – User Manual
2
0
Annex 4 – Import function
The “Import”-function can be found in the “Observation-List” module. The”Import”- function is
developed to be able to import data from other tools [e.g. such as Sky Tools]. The import function
reads a “semicolon separated” file, which can be generated by for example Excel. The header-line of
this file will tell the “Import function” how to interpret the data.
This is how it will work:
Generate your data using for example Excel in a simple straight-forward way, see example below:
Gal
Gal
Gal
Gal
Arp 299
IC 691
NGC 3893
NGC 4181
IC 694
UGC 6447
UGC 6778
MCG 9-20-111
UMa
UMa
UMa
UMa
11h28m30.8s+ 58°33'43"
11h26m44.3s+ 59°09'20"
11h48m38.4s+ 48°42'34"
12h12m49.0s+ 52°54'12"
11.7
13
10.8
14.7
1.2'x 0.8'
33"x 23"
3.1'x 1.6'
5.8"
Now add an header-line the “Import”-function will recognize, and the Excel file will look as follows,
make sure you start at Row 1 and in Column A, so in this example the word “Type” is in cell A1 :
Type
Gal
Gal
Gal
Object
Arp 299
IC 691
NGC 3893
Reference
IC 694
UGC 6447
UGC 6778
Const.
UMa
UMa
UMa
RA
11h28m30.8s
11h26m44.3s
11h48m38.4s
DEC
+58°33'43"
+59°09'20"
+48°42'34"
M
Size
11.7 1.2'x 0.8'
13 33"x 23"
10.8 3.1'x 1.6'
Next thing to do is to save the file as a “semicolon”-separated file, with the extension “.csv” this file
will look as follows when you open it in a plain text editor:
Type;Object;Reference;Const.;RA;DEC;M;Size
Gal;Arp 299;IC 694;UMa;11h28m30.8s;"+58°33'43""";11.7;1.2'x 0.8'
Gal;IC 691;UGC 6447;UMa;11h26m44.3s;"+59°09'20""";13;"33""x 23"""
Gal;NGC 3893;UGC 6778;UMa;11h48m38.4s;"+48°42'34""";10.8;3.1'x 1.6'
This file can be used by the “Import”-function.
The mapping to the columns in the “Observation List” is self-evident, but be mind-full that the
header-line words are case-sensitive.
Deep-Sky Visibility Indicator V1.4 – User Manual
Chapter: Annex 4 – Import function
The header-line keywords the “Import”-function will recognize are:
"Object", "Reference", "Common name", "Const.", "Type", "M", "Size", "OM/VI", "RA", "DEC", "R"
2
1
Annex 5 – Error messages
There are quite a number of error messages, most of them are self-explanatory. However, a few
deserves special attention. They are listed below:
Chapter: Annex 5 – Error messages
<to be completed>
Deep-Sky Visibility Indicator V1.4 – User Manual
2
2
Annex 6 – Backup and Restore
Although great care has been taken to develop DVI, I cannot guarantee that no information will be
lost. This is especially important when using the “Observation-Record”-Database functionality. It is
therefore advised to make regular backups of the data. Below is explained how one should do this:
On initial startup of the application DVI will create a directory structure under the root directory on
your main hard drive. If your main hard drive is labeled “C”, then the directory “C:\DVI” is created
together with the subdirectories “Image” and “Backup” in this folder. On each new session DVI will
make a copy of the data in the Backup folder.
It is advised to make regular backups of this directory structure. If due to unforeseen causes the data
is corrupted, simply copy the Backup-data back to this directory-structure.
Chapter: Annex 6 – Backup and Restore
If the data is corrupted and if no backup is made of the data, the last un-corrupted data will still sit in
the Backup directory. One can simple copy this back to the main DVI directory. If one has to do this it
is advised to make an additional copy of the Backup data first, before DVI is restarted again. Once DVI
is restarted it might overwrite the Backup-data with the last corrupted set of data.
Deep-Sky Visibility Indicator V1.4 – User Manual
2
3
Annex 7 - Release Info, Known Errors, and Feedback
Release Info
Rel.
Release Date Description
1.0
2-dec-2009
Initial release
1.1
5-dec-2009
Refined calculation of SB0 using LM
Limited SB0 to 22.0 in Visibility Surface
1.2
9-dec-2009
Added functionality for creation of observation lists and related features
Generate Scroll-files for Mel Bartels Scope.exe
Introduced Jan van Gastel's formula to translate LM into SB0
1.3
11-01-2010
Added Routing Graph and Route Optimization routines
Enhanced Observation List creation options including Closeby selection options
Import functionality
Enhanced user-interface
If you have any suggestions for improvements, found bugs, wish to add certain catalogues or
features, if you want to be on the distribution list for updates, or simply have feedback for me.
Please mail: [email protected]
Chapter: Annex 7 - Release Info, Known Errors, and Feedback
Added BOC [Bright Object Catalogue - www.astroforum.nl]
Deep-Sky Visibility Indicator V1.4 – User Manual
2
4
1.4
13-05-2010
Added functionality to keep track of observed objects
Improved “Show Object” (image) capability with “inverse” and print
functionality
Added Finder Chart function with print functionality
Known errors
-
When different objects in an observation list have a RA East AND West of 0:00:00 then the
graph and "Optimize Route" won't work properly [but result is still acceptable I think].
Filter functionality in “observed”-list for date-fields will only work properly when using “>”,
“>=”, “<” and “<=” operators
Image and Finder-chart (ViewObject) needs to be closed before opening another Image or
Finder-chart
Suggestions, feedback and distribution-list