1
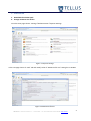
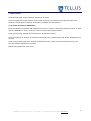
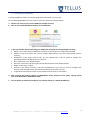
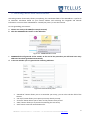
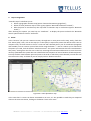
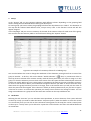
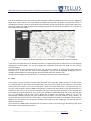
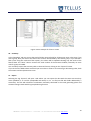
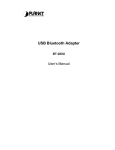
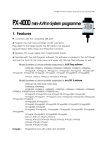
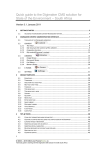
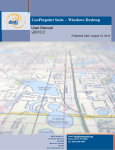
GEObusiness
The power of territorial analysis integrated in Microsoft Dynamics CRM.
User manual
Summary
1.
Installation .......................................................................................................................... 2
2.
Creating GEOaddress ............................................................................................................ 4
3.
Geocoding entities with ADDRESSfinder ............................................................................ 5
4.
Analyzing entities with MARKETfinder ................................................................................ 7
1
TELLUS S.r.l. via Duchi D’Aosta n. 2 - 33100 Udine – tel. 0432 534076 fax 0432 205399 www.tellus.it
1. Installation
a. Download the solution pack
b. Change maximum size of files
From the main page choose: Settings àAdministration àSystem Settings
Figure 1.1 System settings
In the new page choose “E-mail” tab and modify value of “Maximum file size” setting this to 30.000.
Figure 1.2 Maximum file size
2
TELLUS S.r.l. via Duchi D’Aosta n. 2 - 33100 Udine – tel. 0432 534076 fax 0432 205399 www.tellus.it
c. Import solution
From the main page choose: Settings à Solutionsà Import
In the new page choose the solution; once loaded choose next and wait for the importation. Once the
solution is imported go to: Settings à Solutions à Publish all customizations
d. Associate all entities to GEOaddress
Once the solution is imported and published you need to create an association between entities in CRM
and the “GEOaddress” entity. To do this, create e relationship between entities:
From main the page: Settings à Customizations à Customize system
In the new page go to: Entities à choose the interested entity à Relationship 1:N à New relationship one
to many
In the entity creation page fill in all fields as follow (instead of “name” choose an arbitrary name); once
you have filled in all fields save and close.
Repeat this procedure for each entity.
3
TELLUS S.r.l. via Duchi D’Aosta n. 2 - 33100 Udine – tel. 0432 534076 fax 0432 205399 www.tellus.it
2. Creating GEOaddress
Creating GEOaddress allows you to bind geographic information to your entity.
To start binding GEOaddress to one entity of yours you have to proceed as follow:
a. Choose one entity of yours on the CRM (for example account)
b. Click on the Create GEOaddress button on the ribbon bar
Figure 2.1: CreateGEOaddress button.
c. In the new window proceed selecting your CRM fields according to their geographic meaning.
· Name: is the name used by GEOBusiness solution to identify points on map. Required field.
· Address: is the street where the entity is located. Required only if you want a good map position
accuracy.
· PostalCode: is the entity’s postal code. It’s not required but it can be useful to support the
geocoding software finding the entity’s position.
· City: is the entity’s city. Required field.
· Province: is the entity’s province (the second administrative level). Required field.
· Region: is the entity’s region.
· Country: is the entity’s country, it can’t be provided but in this case you need to complete the
Country value field (all entities are assumed to belong to the same country)
· Longitude and Latitude: provide it if you already have the entity’s coordinates.
d. Click on Bind: this function creates one GEOaddress entity related to every entity, copying values
from your CRM fields to GEOaddress fields.
e. You can decide to delete this binding at any time by clicking on “Delete GEOaddress”.
4
TELLUS S.r.l. via Duchi D’Aosta n. 2 - 33100 Udine – tel. 0432 534076 fax 0432 205399 www.tellus.it
3. Geocoding entities with ADDRESSfinder
Geocoding entities functionality allows you updating the coordinates fields of the GEOaddress. It performs
an automatic calculation based on your entities address and retrieving the longitude and latitude
information. You must have a GEOaddress created (see point 1) to use this function.
To start geocoding your entities:
a. Choose one entity n the CRM (for example account)
b. Click the ADDRESSfinder button on the ribbon bar
Figure 3.1: ADDRESSfinder button
c. ADDRESSfinder will geocode all the entities. At the end of the procedure you will know how many
addresses have been geocoded automatically.
d. In the new window you can geocode the remaining addresses.
Figure 3.2 Normalization panel
·
·
·
·
·
“Normalize” button allows you to re-normalize your entity, you can also edit the field of the
entities.
“On map” button allows you to point your entity directly on map.
“Previous” button allows you to return to the previous entity record
“Next” button allows you to proceed normalizing the next entity
“End” button saves the normalization info.
5
TELLUS S.r.l. via Duchi D’Aosta n. 2 - 33100 Udine – tel. 0432 534076 fax 0432 205399 www.tellus.it
Figure 3.3 Grid of candidate addresses
e. Once you tap on Normalize button, if there is more than one option, it’s necessary you choose one of
addresses in list. To confirm the selection check it on the first column.
6
TELLUS S.r.l. via Duchi D’Aosta n. 2 - 33100 Udine – tel. 0432 534076 fax 0432 205399 www.tellus.it
4. Analyzing entities with MARKETfinder
Analyzing data on map allows you to visualize your entities on a geographic map performing
several operation such as thematic maps and route planning.
In order to use this functionality you must have geocoded your data (see point
2). To start analysing your entities:
a.
b.
Choose one entity on the CRM (for example account)
Click on MARKETfinder button on the ribbon bar
Figure 4.1 MARKETfinder button
c.
In a new window your geocoded entities are displayed.
Figure 4.2 MARKETfinder main page
7
TELLUS S.r.l. via Duchi D’Aosta n. 2 - 33100 Udine – tel. 0432 534076 fax 0432 205399 www.tellus.it
1. Map and navigation
All points are positioned on a map provided by http://it.bing.com/maps/.
The default view is Road. You can also select the Aerial option (pictures taken from above, detail depends
on the area you’re analysing) or Bird’s Eye (pictures taken from above at an angle of 45°, not available for
all areas).
You can zoom in and zoom out using the mouse wheel or the graduated bar on the upper left of the screen.
By pressing the CTRL key when you can trace a rectangle with the left mouse key obtaining a detailed zoom
on a precise area.
You can also move the map on top of a desired zone.
2. Info
Clicking on a circle on the map will open a new browser window or tab. The window shows a dialogue
screen of the CRM containing some point information.
3. Entity thematic maps
If you select the tab “Tematismo per entità” you can thematize the points by numeric values. A thematic
map is a representation of every single entity with a different colour; the colour assigned to an element is
chosen evaluating the value of one of its attributes and comparing it with the range of all the values of that
attribute for all the entities on the map.
To create a thematic map of an attribute select it from the drop-down menu. As a result, all the elements
on the map will be coloured according to the values shown on the legend that appears in the function’s
menu tab. By default the system creates five intervals, containing one fifth of the calculated values each.
The intervals may not include all the same amount of points.
To close a thematic map based on an entity, see chapter “Layer management”.
Figure 4.3 An example of entity data mapping.
8
TELLUS S.r.l. via Duchi D’Aosta n. 2 - 33100 Udine – tel. 0432 534076 fax 0432 205399 www.tellus.it
4. Geographic thematic maps
Tab “Tematismo geografico” allows you to create a thematic map referred on a chosen administrative level
and based on one numeric value.
First of all, choose the administrative level of the analysis: City, Province, Region or State. To create a map
based on an attribute of the entities, select “Dati entità” from the drop-down menu. To thematize the
areas according to one of the demographic attributes included in the application select “Dati
socioeconomici”. Finally, choose the reference attribute for the creation of the map. As a result all the
administrative divisions (of the selected level) will be coloured according to the values shown on the legend
that appears in the function’s menu tab. A black border will display the limits of the areas. If you selected
“Dati entità”, the only areas coloured will be the ones that contain at least one entity (for those the system
can calculate a value). The derived value of this attribute will be the sum of all the elements contained in
the same area in the chosen administrative level. Instead, if you selected “Dati socioeconomici” all the
divisions in the State will be coloured. By default the system creates five intervals, containing one fifth of
the calculated values each. Therefore the intervals may not include all the same amount of points. To
repeat the thematization of another attribute of the same data source just select it from the drop-down
menu. To create a map based on an attribute of the other data source (for example, first “Dati entità” then
“Dati socioeconomici”) select the data source before you can choose the attribute. To change the
administrative level just repeat all the operation.
With the geographic thematic map you can also colour the entities by the result of an expression between
two attributes. In this case: select the desired administrative level and click on “Espressione” button; this
will open a window where you can pick the two attributes (among all available from “Dati entità” and “Dati
socioeconomici”), and an operator (+, -, *, /). Tap “Ok ” to confirm the operation and create the map. If
one or more attributes come from “Dati entità” the only areas coloured will be the ones containing at least
one point, for which the system can calculate a value.
To close a geographic thematic map, see chapter “Layer management”.
Figure 4.4 An example of geographic data mapping
9
TELLUS S.r.l. via Duchi D’Aosta n. 2 - 33100 Udine – tel. 0432 534076 fax 0432 205399 www.tellus.it
5. Layer management
“Controllo Layer” tab allows you to:
1. delete a geographic thematic map (option “Nascondi tematismo geografico”);
2. delete an entity thematic map or close a group (option “Nascondi tematismo su entità”)
3. hide the points to visualize only the map with its thematic map or isochrones (option “Nascondi
entità”).
After checking the options you need tap on “Conferma”. To display the points uncheck the “Nascondi
entità” option and then click on “Conferma”.
6. Route
In the “Percorsi” tab you can create an itinerary through two or more points on the map. Firstly, check the
box “Attivo (S/N)”; then, click on the map (or on the spots) to acquire the points that will form the route to
compute. Every click will create in the list a new row with selected point’s pair of coordinates (Longitude
and Latitude). You can remove a point from the list using the button “-” next to it. When you’ve selected all
the points you need, click the button “Calcola itinerario”: the system will estimate the best route between
two points, starting from the first one to the last, returning the total time and distance to cover the entire
itinerary (CAUTION! The system does not calculate the best sequence of access between all selected points,
but only the best route between point and point in the order in which they were selected). You will also see
the route on the map. To delete all you can simply click on “Elimina itinerario”.
Figure 4.5 A route plotted on map
In the case there’s a Tom Tom device associated to our user, it’s also possible to send this just computed
route to the Tom Tom device, clicking on the button “Invia a Tom Tom”.
10
TELLUS S.r.l. via Duchi D’Aosta n. 2 - 33100 Udine – tel. 0432 534076 fax 0432 205399 www.tellus.it
7. Group
In the “Gruppi” tab you can represent elements with different colours depending on the grouping field
chosen among the ones defined like this during the data import.
To load a group you have to select the grouping field from the drop-down menu “Select”. The elements on
the map will be coloured with different tints, one per every voice. In the function’s menu tab will also
appear a legend.
In the “Riepilogo” tab you can see a summary of the total of the numeric values for each voice of the group.
You can also save the summary table in an Excel format clicking the “Esporta” button.
Figure 4.6 An example of a summary of data for a loaded group
You can also balance the zone to change the attribution of the elements, moving them from a voice of the
group to another. To do this, click on the button "Enable selection" (
); then, by consecutive clicks on
the map, draw a selection that contains entirely inside all those points that you want to assign to a new
group. To close the selection you must click at the centre of the first point that was selected (red circle with
a black one inside). While you’re in tracing mode, to navigate on the map just go near its borders to cause it
to move in that direction. When you’ve finished tracing the selection you have to choose from the dropdown menu the group field that you want to change, then in the second menu you will pick the value to
which the points will be assigned. If this value isn’t already in the drop-down menu you just have to type it
in the box to create it. To confirm the operation you always have to click on the “Assegna” button. You can
assign some elements to a group and at the same time visualize on the map a different one.
8. Isochrones
Selecting the tab “Isocrona” you can calculate areas equidistant, in time or distance, from a point selected
on the map. Firstly you need to select the button “Acquisisci punto” (when this button is active the arrows
on it turn black), then you can click on the isochrones starting point on the map (this can be a casual point
on the map or a circle). Once you’ve clicked on a point the X and Y fields in the menu tab will be filled with
its coordinates.
11
TELLUS S.r.l. via Duchi D’Aosta n. 2 - 33100 Udine – tel. 0432 534076 fax 0432 205399 www.tellus.it
After this you have to choose how to calculate the isochrones: inserting a time in the [hh]:mm format, or a
distance in meters. In the first case the system will follow the road network from the starting point and will
stop once reached the time set, covering each road with a different speed based on its type (ex.: highways
faster than urban streets). The result will be a polyline that connects the points reached and, usually, is
stretched on the main roads. In the second case instead the system will stop once reached the meters set;
the result will be once again a polyline connecting those points. To launch the procedure you must click on
the “Calcola isocrona” button.
Figure 4.7: An example of the representation of an isodistance of 20Km with the filter activated
If you want to change the time or distance of travel, or visualize the graph for a distance or a time without
changing the starting point, you can just change the parameters and then click again on the “Calcola
isocrona” button.
Once the isochrones are visualized on the map you can click on “Filtra” to show only the points that are
contained in it. In this case the totals in the “Riepilogo” tab will also be updated accordingly and it’s
possible to download a file containing only the filtered data from the “Esporta” tab.
To undo these changes use “Annulla filtro”, to undo the isochrones use “Annulla isocrona”.
9. Filter
In the “Filtro” tab you can filter the data using the fields in the input file. When you want to create a filter
on a field you have to click on the funnel-like button next to its name. Then you can select from the list the
values you want to filter, or you can use the boxes “Show rows with values that”. In these boxes you can
set up to two conditions with the AND clause (both are valid at the same time) or with the OR clause (it’s
valid one or the other). You can set one condition from the list and one with the boxes, in this case they will
be considered using an AND clause. You can also set conditions on different fields and in this case they will
too be considered using an AND clause. While the conditions set selecting voices in the list are
automatically applied, to apply the ones created with the boxes you must click the “Filter” button. To
cancel a filter you need to click on “Clear Filter” in each field where you had set a condition. Once a filter is
applied, you will see on the map only the filtered points and in the tab “Riepilogo” you will see only the
totals of those points.
If you click on the labels above each field you can order its values in an increasing or decreasing order, both
the numeric and the alphanumeric ones.
12
TELLUS S.r.l. via Duchi D’Aosta n. 2 - 33100 Udine – tel. 0432 534076 fax 0432 205399 www.tellus.it
Figura 4.8: An example of a filter in action
10. Summary
In the “Riepilogo” tab you can see the total of all the numeric fields for all the points seen in the map. If you
load a group, here you will see the total of the numeric data divided by the chosen group. If you activate a
filter (even using the isochrones filter option), the values will be updated showing only the totals of the
filtered data. The “Num” column contains the total number of the elements loaded, eventually on more
rows if a group is loaded.
You can always export the summary table in the Excel format, clicking on the “Esporta” button.
If you click on the labels above each field you can order its values in an increasing or decreasing order, both
the numeric and the alphanumeric ones.
11. Export
Selecting the tag “Esporta” will open a tab where you can export the data with the same structure they
were uploaded, in an .xml file (compatible with Excel) or in a .csv file (text file with fields delimited by a
semicolon). This file will include the coordinates eventually calculated in the initial geocoding phase and
eventual changes made with the group balancing function.
13
TELLUS S.r.l. via Duchi D’Aosta n. 2 - 33100 Udine – tel. 0432 534076 fax 0432 205399 www.tellus.it