1
VSIDE User's Manual
Revision 2.01
Aug 4, 2010
Revision history:
Rev.
Date
Description
1.00
04/08/2003
First edition
1.01
04/15/2003
Typo corrections
2.00
04/07/2008
VSIDE 2.00b, complete rewrite
2.01
08/04/2010
VSIDE 2.01 update
VSIDE User's Manual
Page 1
Table of Contents
1. Introduction......................................................................................................................................5
1.1. Features.....................................................................................................................................6
1.2. Requirements............................................................................................................................6
2. Installation........................................................................................................................................7
2.1. Installing under Windows.........................................................................................................7
2.2. Installing under Linux...............................................................................................................7
3. Getting started with VSIDE..............................................................................................................9
3.1. Introduction...............................................................................................................................9
3.2. Creating a project....................................................................................................................10
3.3. Modifying source code............................................................................................................12
3.4. Compiling...............................................................................................................................12
3.5. Executing and debugging........................................................................................................13
3.5.1. Problems with the emulator?...........................................................................................15
3.6. Adding files to the project......................................................................................................15
3.7. Setting breakpoints.................................................................................................................17
3.8. Variable evaluation.................................................................................................................18
3.9. Modifying project options.......................................................................................................20
4. Development environment.............................................................................................................22
4.1. Introduction.............................................................................................................................22
4.1.1. Projects and solutions......................................................................................................22
4.1.2. Configurations.................................................................................................................22
4.1.3. Dock windows.................................................................................................................23
4.2. Solution browser.....................................................................................................................23
4.2.1. File operations.................................................................................................................24
4.2.2. Folder operations.............................................................................................................25
4.2.3. Project operations............................................................................................................25
4.2.4. Solution operations.........................................................................................................26
4.3. Editor......................................................................................................................................26
4.4. Building..................................................................................................................................27
VSIDE User's Manual
Page 2
4.4.1. Build commands.............................................................................................................28
4.4.2. Configuration manager....................................................................................................28
4.5. Menus......................................................................................................................................29
4.5.1. File menu.........................................................................................................................29
4.5.2. Edit menu........................................................................................................................30
4.5.3. Project menu...................................................................................................................30
4.5.4. Build menu......................................................................................................................31
4.5.5. Debug menu....................................................................................................................31
4.5.6. Windows menu...............................................................................................................31
4.5.7. Help menu.......................................................................................................................31
4.6. Creating a new project............................................................................................................31
4.7. File options.............................................................................................................................32
4.8. Project options........................................................................................................................35
4.8.1. General............................................................................................................................35
4.8.2. C Compiler......................................................................................................................36
4.8.3. Assembler........................................................................................................................36
4.8.4. Linker..............................................................................................................................37
4.8.5. Debugging.......................................................................................................................38
4.8.6. Tools................................................................................................................................38
4.9. Solution options......................................................................................................................38
4.9.1. Configurations.................................................................................................................39
4.9.2. Cores...............................................................................................................................40
4.9.3. Debugging.......................................................................................................................40
5. Debugging......................................................................................................................................41
5.1. Debug commands...................................................................................................................41
5.2. Debug windows......................................................................................................................42
5.2.1. Watch window................................................................................................................43
5.2.2. Active variables window.................................................................................................43
5.2.3. Peripheral window..........................................................................................................44
5.2.4. Log window....................................................................................................................44
5.2.5. Standard input/output window........................................................................................45
VSIDE User's Manual
Page 3
5.2.6. Breakpoint window.........................................................................................................45
5.2.7. Command console window.............................................................................................46
5.2.8. Memory window.............................................................................................................47
5.2.9. Register window..............................................................................................................48
5.2.10. Disassembly window....................................................................................................49
5.3. Simulating executables directly..............................................................................................50
6. Miscellaneous.................................................................................................................................51
6.1. Command line options............................................................................................................51
6.2. Creating project templates......................................................................................................52
6.3. mem_desc file format.............................................................................................................53
6.3.1. MEMORY Section .........................................................................................................53
6.3.2. CORE Section ................................................................................................................54
6.3.3. PERIPHERAL Section ...................................................................................................55
6.3.4. INTERRUPT Section .....................................................................................................56
6.3.5. Peripheral instantiation ..................................................................................................56
VSIDE User's Manual
Page 4
1. Introduction
1. Introduction
VSIDE is an integrated software development environment for VLSI Solution's DSP cores.
1.1. Features
•
Integrated development environment (IDE) for VSDSP cores, including:
○
project management
○
code editor (with syntax highlighting)
VSIDE User's Manual
Page 5
1. Introduction
○
C compiler
○
assembler
○
debugger
•
C and assembly level debugging using hardware emulator (and/or simulator)
•
Two-point profiling (simulator only)
•
System simulation using C-modeled custom peripherals
•
Multi-OS support: Windows XP / Vista, Red Hat Linux (available upon request)
1.2. Requirements
Windows:
•
Microsoft Windows XP Professional (SP2) or Windows Vista
•
PC x86 architecture
Linux:
•
Red Hat Linux 7.0 (or newer)
•
PC x86 architecture
VSIDE User's Manual
Page 6
2. Installation
2. Installation
2.1. Installing under Windows
Make sure you have administrator privileges and run vside_win32.exe to start setup. Please read the
license agreement carefully and click agree to proceed. The installer will prompt for a destination
directory, typically “C:\Program Files\VSIDE” is a good choice.
After the installation completes, VSIDE shortcut should appear in the start menu. Click the shortcut
to launch VSIDE.
Installer will also deploy automatic un-installer program which can be invoked from the start menu
as well.
2.2. Installing under Linux
1) Unpack VSIDE tar.gz package to any directory. This directory is now referred as VSIDE.
E.g. Installing package at /tmp/ to /usr/local/:
cd /usr/local
tar xfvz /tmp/vside_linux.tar.gz
2) Set VSDSP_DIR environment variable to point to VSIDE/config.
For bash:
VSDSP_DIR=/usr/local/vside/config
export VSDSP_DIR
For csh or tcsh:
setenv VSDSP_DIR /usr/local/vside/config
3) Add VSIDE/bin path to $PATH. Without this, compiling won't work in IDE.
For bash:
PATH=/usr/local/vside/bin:$PATH
export PATH
For csh or tcsh:
VSIDE User's Manual
Page 7
2. Installation
setenv PATH /usr/local/vside/bin:PATH
4) CD to VSIDE path and run VSIDE:
cd vside
./vside
VSIDE User's Manual
Page 8
3. Getting started with VSIDE
3. Getting started with VSIDE
3.1. Introduction
This chapter describes the basics of VSIDE. If you have used similar integrated development
environments before, you may find that you're already familiar with most of the content. The C
programming language will be used throughout this chapter; any experience or knowledge on lowlevel programming of the VSDSP cores is not required.
As an exercise we will create a “Hello world” project. With this project we will learn how to
execute code and how to use the basic debugging features.
The target platform for this tutorial will be VLSI Solution's versatile audio chip, VS1053, which will
be used through a hardware emulator. You will need a functional VS1053 developer board
connected to your system in order to follow the exercise properly. If you do not have one, you can
purchase it from the VLSI Web Store.
To begin the tutorial, start up VSIDE.
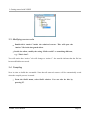
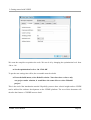
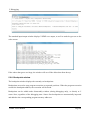
The main window should look something like the illustration below.
All windows are empty and most features are disabled, since no projects are open.
VSIDE User's Manual
Page 9
3. Getting started with VSIDE
3.2. Creating a project
Let's start the tutorial by creating the “Hello world” project.
The easiest way to create a new project is to use a project template which contains “main.c” source
file and proper project settings.
•
Under the File menu, click New and then click Project/solution.
VSIDE User's Manual
Page 10
3. Getting started with VSIDE
A “New Project” dialog will appear (illustrated below*).
The first task is to define a host solution for the project. A solution is a logical entity which contains
hardware-specific options (emulation settings for example) for the project. Each VSIDE project
must be associated with exactly one solution. A solution, on the other hand, can contain any number
of projects.
Check the radio button “Create new solution based on template” and select
•
“vs1053_solution”.
Enter a memorable name for the solution (e.g. “hello”)
•
•
Click Next
* please note that the actual set of available templates may differ as VLSI solution's product family
evolves
VSIDE User's Manual
Page 11
3. Getting started with VSIDE
Now you will see a list of available project templates. Content of the list varies depending on which
solution type was selected. To display all project templates, uncheck “Show only compatible
templates” option.
A short description of each alternative is available below the list box.
•
Select “vs1053 hello_world” as the starting point and click OK to dismiss the project
creation dialog.
Shortly, the solution browser will populate with the new project, “hello”, which is located under a
solution with the same name. Solution browser displays the solution and project hierarchy, as well
as all the related source files (in this case, there is only one source file, “main.c”).
VSIDE User's Manual
Page 12
3. Getting started with VSIDE
3.3. Modifying source code
•
Double-click “main.c” inside the solution browser. This will open the
“main.c” file in the integrated editor.
• Inside the editor, modify the string “Hello world!” to something different,
e.g. “This is fun!”.
You will notice that “main.c” tab will change to “main.c*”: the asterisk informs that the file has
been modified but not saved.
3.4. Compiling
Now its time to build the executable. Note that all unsaved sources will be automatically saved
when the compile process is started.
•
From the Build menu, select Build solution. You can also do this by
pressing F7.
VSIDE User's Manual
Page 13
3. Getting started with VSIDE
The build output (on the bottom of the screen by default) should display the following.
You can see a line with gray background, which informs of a compilation warning. Any possible
errors are shown with red background (as for now, there should be none).
• Double click with left mouse button on the gray line, IDE will display the
row of the source code that the warning is referring to.
You can ignore this warning.
3.5. Executing and debugging
Now that the project executable is successfully built, we can test it using the hardware emulator.
The emulator executes the code using the real DSP core but allows setting breakpoints and tracking
the values of the registers and memory locations (variables).
VSIDE communicates with the developer board using a serial port interface. Before executing the
program for the first time, it is a good idea to check that serial port parameters are correctly set up.
• Right-click on Solution “hello” in the solution explorer window.
• From the pop-up menu, select Properties.
VSIDE User's Manual
Page 14
3. Getting started with VSIDE
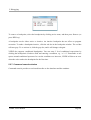
The solution options dialog will open.
• Click on the Debugging tab to see the emulator parameters.
VSIDE User's Manual
Page 15
3. Getting started with VSIDE
Make sure that debug mode is set to “HW Emulation”. Serial port parameters are located right
below. If your developer board is connected to a serial port other than COM1, select the appropriate
port from the pull down list.
In this example, we use VS1053 chip. Thus, make sure “vs1053” is selected as the chip type.
Execution address should be “0x50” for this configuration. Once everything seems right, click close
to dismiss the dialog and accept any changes made.
At this point, if your hardware is properly connected to the PC and powered up, you should be able
to execute the program. Please note that the hardware must be reset every time before the
program is loaded. There is a dedicated reset button on the developer board, press it shortly to make
the chip reset itself.
You can execute the program as a whole by clicking the yellow triangle icon (“Play”) at the toolbar
or by selecting Run from the Debug menu (or easier yet, by using the keyboard shortcut, F5).
• Reset the board and press F5 to execute the program
VSIDE will now switch to debug mode, and the window layout will change. The program should
execute and display the greeting text in the standard input/output window.
• If standard input/output tab (located at the bottom of the VSIDE window on
the default screen layout) is not visible, click the title to see the output.
Note that the program is still running. There is an infinite loop after the puts() statement in the
program. Let's stop it.
• Click the yellow square (“Stop”) icon or select Stop from the Debug menu
to stop the program and return to edit mode.
3.5.1. Problems with the emulator?
If you get “Invalid serial port or handshaking error” message while trying to execute, the reason
might be that
• developer board is not properly connected. Check that it is powered up
(power led is lit) and the serial cable is connected and functional.
VSIDE User's Manual
Page 16
3. Getting started with VSIDE
• The chip is not in reset state. Press the on board and try loading the
program again.
3.6. Adding files to the project
Next, we will create a new source file that will be included in the current project.
• Select File in the main menu, click New, then New Source File.
An empty document will appear. Using the integrated editor, type the following into the document:
#include <stdio.h>
void puthex(unsigned int a) {
static const char hex[]="0123456789abcdef";
char tmp[8];
tmp[0]=hex[(a>>12)&15];
tmp[1]=hex[(a>>8)&15];
tmp[2]=hex[(a>>4)&15];
tmp[3]=hex[a&15];
tmp[4]=' ';
tmp[5]='\0';
puts(tmp);
}
void foo() {
static int z;
for (z = 0; z < 100; z++) {
fputs(“z=”,stdout);
puthex(z);
}
}
Note the unusual static declaration of variable 'z'. This is to make sure its value is always available
for debugging (for more information, see page 20). Also note that even though the standard library
function printf would achieve the above more elegantly, it can't be used in this case because of
memory limitations.
Let's save the file and include it in our project.
• Under file menu, click Save (or press CTRL-S) and then select a save path
and a filename. Save the file under the newly created project path (i.e.
“\solutions\hello”), and name it as “foo.c”.
• Inside the solution Browser, right-click “Project 'hello'”. From the pop-up
menu, select Add existing item.
VSIDE User's Manual
Page 17
3. Getting started with VSIDE
• A file selection dialog appears. Select “foo.c” and click Open.
The file “foo.c” should now appear in the solution browser. We want our main() function to call
foo(), so we need to modify “main.c”.
• Double click “main.c” under solution browser (or just select “main.c” tab
in the editor, if it is still open). Modify “main.c” so that it looks as follows
(changes are shown with gray background):
#include <stdio.h>
void foo(); /* Introduce foo() function */
main() {
int i;
puts("This is fun!\n");
foo(); /* Call foo() */
while(1) ;
return 0;
}
• Now compile the program, like described above. Should there be any
errors, fix them and compile again.
The new function foo() should now be integrated into our project. We will test it in the next section.
3.7. Setting breakpoints
The next thing to do is to learn how to use breakpoints. A breakpoint stops the program's execution
when the location of the breakpoint is reached. Breakpoints can be set in the edit mode, or during
debugging.
• Under “main.c”, set a breakpoint to the line “foo(); /* Call foo() */”. You
can add breakpoints either by left-clicking the gray area of the code editor
(margin) or by moving text cursor to the appropriate line and pressing F6.
A red marker dot should appear in the margin next to the source line. See
the illustration below.
VSIDE User's Manual
Page 18
3. Getting started with VSIDE
You can clear (remove) breakpoints by repeating the action described above.
We will now create another breakpoint.
• Under “foo.c”, set another breakpoint to the first line of the for-loop:
fputs(“z=”,stdout).
We want this second breakpoint to be active only when C language condition “z == 5” is true. To
make the second breakpoint conditional, we need to open the breakpoint window.
• From the Windows menu, select View Breakpoints (or press CTRL-3).
A window like the following should appear (by default, it is located on the tab bar at the bottom of
the IDE window, click the tab titled breakpoints to make it visible):
To make the “foo.c” conditional, click on the foo.c() breakpoint line under the condition column.
This is the position where the “z == 5” is located in the picture above. Type the condition “z == 5”
(without quotation marks). Remember to use spaces around “==”!
Note that conditional breakpoints may cause the simulation to run slower, depending on the
breakpoint position. Each time the execution reaches position where a breakpoint is located, it
causes a slight delay regardless of whether the condition is true or not.
• Build the program and execute (press F5).
VSIDE User's Manual
Page 19
3. Getting started with VSIDE
The program should now hit the first breakpoint inside main(). You will see a small arrow
indicating the position of the execution. Let's proceed to the next breakpoint.
• Continue running the program (press F5 again).
The program should pause again. Study the standard input/output window output. It should contain
the following lines:
This is fun!
z = 0000
z = 0001
z = 0002
z = 0003
z = 0004
3.8. Variable evaluation
You can track the values of variables using the active variables window.
Please note that values of all variables may not be available at all times. This is especially true for
local variables within a function's scope. If you need the value of a certain local variable during
debugging, try declaring it global when possible (the easiest way to achieve this is by declaring the
variable static, like in the example code above). However, it is advisable remove the static
declaration when debugging is no longer needed. Extensive use of local variables will generally
result in faster and smaller code.
• Locate the Active Variables window in the screen. If it is not visible, use the
Windows menu and select View Active Variables. 'z' should be visible there.
Now let's try to change the value of 'z' on the fly.
• Under the Active Variables window, click the left mouse button on 'z' value.
A typing cursor will appear. Type '0' (a zero without the quotation marks)
as the new value. This will effectively start the loop from the beginning.
• Continue program's execution (press F5 again).
VSIDE User's Manual
Page 20
3. Getting started with VSIDE
Program should break again at the conditional foo() breakpoint. The standard input/output should
now contain the following:
This is fun!
z = 0000
z = 0001
z = 0002
z = 0003
z = 0004
z = 0000
z = 0001
z = 0002
z = 0003
z = 0004
Another way to deal with variables is to use the Watches window. You can type variable names in
the watch window, VSIDE will evaluate them with every screen update.
• Locate the watches window on the screen. If it's not visible, use the
Window menu and select View Watches.
• Left-click <add new...>. Type 'z' (again, without quotation marks) and
press enter. Whenever 'z' is visible at the current code location, its value
will be displayed. When it is not, the value will be displayed as '?'.
When you're done, you can stop the debugging session for now.
3.9. Modifying project options
Let's take a look at project options. You can find all settings related to how to build the project
(compilation, linking, custom build steps etc) here.
• Under Solution Browser, right-click Project. Select Properties.
Project options dialog will open.
• Select C Compiler tab, as shown in the picture below.
VSIDE User's Manual
Page 21
3. Getting started with VSIDE
We want the compiler to optimize the code. We can do it by changing the optimization level from
-O0 to -O6.
• Set the optimization level to -O6. Click OK.
To put the new settings into effect, the executable must be rebuilt.
• From the build menu, select Rebuild solution. Note that since we have only
one project under solution, it would have the same effect to select 'Rebuild
project'.
This is the end of the introduction tutorial. Hopefully you now have a basic insight on how VSIDE
can be utilized for software development on the VSDSP platform. The rest of this document will
describe the features of VSIDE in more detail.
VSIDE User's Manual
Page 22
4. Development environment
4. Development environment
4.1. Introduction
This section provides a description of the basic concepts of VSIDE.
4.1.1. Projects and solutions
Project management in VSIDE is based on two conceptual objects called solutions and projects:
• A project represents a single executable or a static library. A project
contains a set of source files and describes the build steps that are required
to produce a binary file, the target. You can find all compilation and
linking related settings from the project's properties.
• A solution contains the dependency relationships among projects (e.g.
“Executable” project with a depending “Static library” project).
VSIDE User's Manual
Page 23
4. Development environment
Solutions and projects have “one-to-many” relationship. A solution can contain any number of
projects, but a project always belongs to exactly one solution.
While a solution can contain several projects, only one of the projects are active at a time. The
active project is what receives the actions (e.g. gets compiled) when instructed. Small applications
can usually be developed using no more than one project.
4.1.2. Configurations
A configuration represents the settings of a particular project/solution.
For example, a typical project can have different configurations for debugging and release purposes.
Usually the debug version can be less optimized and include symbol information for debugging,
whereas the release version should be as small and fast as possible and contain no symbol
information. Instead of having to edit project options constantly (switching on and off the debug
symbol option), creating two project configurations and then switching then between them makes
more sense.
Solution configuration works in this way. Switching between solution configurations also switches
current active project configuration; this is because solution contains also information for each
project which configuration is active.
Every project and solution must have one or more configurations each.
4.1.3. Dock windows
VSIDE's user interface is based on the dock window concept. Most visible components of the user
interface are actually dock windows. Such window can be freely moved and resized within the main
VSIDE window, or even outside from it.
Dock windows can be dragged into dock positions (located at the edges of the main window) by
holding the left mouse button on the window's title bar and moving the mouse cursor to a dock
position. Note that dock windows can be “cascaded” on top of each other. If several dock windows
are cascaded on the same edge, a tab bar will appear with tabs representing each of the cascaded
windows.
VSIDE User's Manual
Page 24
4. Development environment
Note that VSIDE maintains separate window position information for debugging, project edit and
initialization states.
4.2. Solution browser
Currently open solution and its context is shown in the Solution browser window.
In the picture above, there is a solution called “VSIDE Example”. It contains two projects. Within
each project, there are folders that contain the individual files. These folders are used to group
similar types of files together, they do not reflect the directory structure on the hard drive.
One of the projects is always selected as active. When invoking project actions (such as Build
project), the active project is affected by the operation. To change the active project, right-click on
the top of the project icon (inside the solution browser window) and select Set as active project.
To quickly open source file for viewing or editing, double-click on the file's icon.
There are several useful features that can be accessed through the solution browser. They are
invoked by right-clicking either files, folders, projects or solutions. These operations are described
below.
VSIDE User's Manual
Page 25
4. Development environment
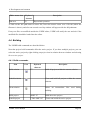
4.2.1. File operations
Item
Description
Compile
Compile the file.
Remove
Remove file from project. This will not physically remove
the file from hard disk.
Properties
Edit file properties.
See section 4.7 for more information.
4.2.2. Folder operations
Item
Description
Add existing item...
Add new source file(s) to the project.
Remove
Remove the folder and its contents from the project. Again,
this will not physically remove any files from the hard disk.
This option is not available to some of the folders that must
exist in the project.
Rename
Rename the folder.
This option is not available to some of the folders that must
exist in the project.
4.2.3. Project operations
Item
Set as active project
Description
Select project as active. Active project is affected by projectspecific commands.
Build
Build the target of the active project.
Rebuild All
Clean and then build the target of the active project.
Clean
Clean project's target and any temporary object files.
Save project
Write changes to the project to disk.
VSIDE User's Manual
Page 26
4. Development environment
Item
Remove project
Description
Remove a project from solution.
This will not physically remove any project files from the
hard disk.
Add folder
Add a (virtual) folder to the project.
Add existing item...
Add an existing item to project.
The proper folder for the file is automatically selected.
Properties
Edit project properties.
See Section 4.8 for more information.
4.2.4. Solution operations
Item
Description
Build Solution
Build all projects within a solution.
Rebuild Solution
Rebuild all projects within a solution.
Clean Solution
Clean all projects within a solution.
Add new project...
Add a new project to the solution.
Add existing project...
Add an existing project to the current solution.
Properties
Edit solution properties.
See section 4.9 for more information.
VSIDE User's Manual
Page 27
4. Development environment
4.3. Editor
Integrated source code editor is a regular text file editor that supports the basic editing features
including C syntax highlighting.
The code editor is also used to display code during the debugging state.
Editor window is tabbed, i.e. each open source file has its own tab in the top of the editor window.
By clicking the tab, the particular source file will be shown. By clicking the close button on the right
top corner of the editor (or pressing CTRL-W), the current source file will be closed.
Basic editor commands are found in the Edit menu:
Editor menu item
Keyboard
Description
shortcut
Undo
CTRL-Z
Undo previous edit command
Redo
CTRL-Y
Redo previous edit command
Cut
CTRL-X
Cut selected text
Copy
CTRL-C
Copy selected text
Paste
CTRL-V
Paste previously cut/copied text into cursor position
Go to line
CTRL-G
Go to source code line. New dialog will appear where the line
number is entered.
Find...
CTRL-F
Find text within the current source file. New dialog will appear
with more options.
VSIDE User's Manual
Page 28
4. Development environment
Editor menu item
Keyboard
Description
shortcut
Find next
F3
Repeat find operation.
To find out the full path name to source file, hover the mouse cursor over a file tab (where the
filename is shown), and after one second a tool tip window will appear with the full pathname.
If any text files are modified outside the VSIDE editor, VSIDE will notify the user and ask if the
modified files should be loaded into the editor.
4.4. Building
The VSIDE build commands are described below.
Note that project build commands affect the active project. If you have multiple projects, you can
select the active project by right-clicking on project icon in solution browser window and selecting
Set as active project.
4.4.1. Build commands
Item
Icon
Keyboard
Description
shortcut
Build solution
F7
Rebuild solution
Build all projects within the current solution.
Clean and build all projects within the current
solution.
Clean solution
Delete all intermediate files used during
building.
Build project
SHIFT-F7
Build the active project.
Rebuild project
CTRL-SHIFT-F7
Cleans and builds the active project.
VSIDE User's Manual
Page 29
4. Development environment
Item
Icon
Keyboard
Description
shortcut
Clean project
Delete all active project's intermediate files used
during building .
Stop build
Stop the current undergoing build process.
Configuration
Open configuration manager. More information
manager
below.
VSIDE User's Manual
Page 30
4. Development environment
4.4.2. Configuration manager
Configuration manager is used for managing the solution and project configurations.
To create new configuration, select a previous configuration and click Create copy.
To rename a configuration, select the configuration and click Rename.
To remove a configuration, use Remove. Note that both solution and project must have at least one
configuration at all times, so the last configuration can not be removed.
4.5. Menus
Commands accessible through menus are described below.
4.5.1. File menu
File menu item
New->Project
Description
Create a new project. New Project dialog will open, which
contains more options for project creation.
New->File
Open a new text file in the editor.
New->Blank solution
Create a blank solution. New Solution dialog will open,
which contains more options for project creation. Any
currently open solutions will be closed.
VSIDE User's Manual
Page 31
4. Development environment
File menu item
Open->Solution
Description
Open an existing solution from disk. Any currently open
solutions will be closed.
Open->Source
Open an existing source file from disk.
Open->Executable into simulator
Simulate an executable without projects/solution. See
Section 5.3 for more information.
Close
Close the currently active text file.
Close solution
Close the currently open solution.
Save
Save the currently open source file to disk. If the file has no
name, this command behaves like “Save As”.
Save As
Save the currently active source file to disk with a different
name.
Save All
Save all unsaved text files to disk.
Recent Files
Display a list of recently used files. Selecting a file from the
list will load the file into the editor. VSIDE remembers four
most recently viewed files.
Recent Solutions
Display a list of recently used solutions. Selecting a solution
from the list will close any currently open solution and load
the selected solution. VSIDE remembers four most recently
opened solutions.
Exit
Closes VSIDE.
4.5.2. Edit menu
See Section 4.3 for more information.
4.5.3. Project menu
Project menu item
Add existing item...
Description
Add an existing item to project. The proper folder for the file
is automatically selected.
VSIDE User's Manual
Page 32
4. Development environment
Project menu item
New folder
Description
Add a (virtual) folder to the project. These folders are only
used to group similar files together.
Generate makefile
Generates makefile named Makefile_<projectname> into the
project folder.
Properties
Edit project properties. See section 4.8 for more information.
4.5.4. Build menu
See section 4.4 for more information.
4.5.5. Debug menu
See section 5.1 for more information.
4.5.6. Windows menu
Window menu item
Description
Close all documents
Close all files in the integrated editor.
View <dock window name>
Show/hide <dock window>.
4.5.7. Help menu
Help menu item
Description
Help
Open the VSIDE help viewer.
About
Show VSIDE copyright and version information.
VSIDE User's Manual
Page 33
4. Development environment
4.6. Creating a new project
Select New project from the File menu to create a new project.
If existing solution is already open in VSIDE, new project can be added into it. If solution is not
available, new project dialog will create an empty solution. In this case, name and template must be
specified for the empty solution. You must also provide a location on the hard drive where files
associated with the solution and its projects will be stored. Click the Browse button to open a
directory selector dialog.
A project template contains default settings and source files - aimed to speed up the process of
starting a new project. There can be a different number of project templates available depending on
the VSIDE distribution.
Remember to enter a name for your project in the corresponding input box.
If a solution is already open, there is an option to add the new project under the current solution or
to close the current solution and create a new solution.
VSIDE User's Manual
Page 34
4. Development environment
When creating a new solution, check “Create subfolder for project” to create additional project
directory under the solution directory. The full project path is determined by combining base path
with solution's name and possibly with the project's name.
4.7. File options
The build process of an individual file can be customized, thus bypassing the automatic builder.
Build command can be manually overridden, or the file can be completely excluded from the build.
To configure individual file build settings, right-click on a source file's icon (under solution
browser) and select properties from the pop-up menu. File Options dialog (illustrated above) will
appear.
Select the project configuration that you wish to make this change for. Changes only apply to the
selected project configuration, others remain unchanged.
Select the desired build method from the combo box next to Build with label. The options are:
Item
Automatic
VSIDE User's Manual
Description
Use the automatic builder
Page 35
4. Development environment
Item
Custom build
Description
Custom build commands must be entered to the
Custom build command(s) input box. The
commands are executed in the shell as they are
written here. Use Carriage Return (CR) to
separate commands from each other.
Example:
echo “Building test.c...”<CR>
vcc -c test.c
None (exclude from build)
VSIDE User's Manual
The file will not be processed in any way.
Page 36
4. Development environment
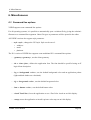
4.8. Project options
The active configuration is shown at the top of the dialog. Any changes will affect this configuration
only.
It is possible to override all these settings for individual files by using custom file configurations.
Any directory name can be either absolute or relative to the project's path.
4.8.1. General
This section contains the general project settings.
Item
Project type
Description
Executable, Static Library or NAND Flash/EEPROM image.
Executable contains a linked application, while static library is
a collection of object files. Last option behaves like executable,
but produces an additional image file (.img) suitable for
firmware creation (either for Flash or EEPROM).
Target filename
Name of the target that will be created when the solution is
compiled.
Target directory
VSIDE User's Manual
Directory name where the build target will be created.
Page 37
4. Development environment
Item
Description
HW Description file
Hardware description file that will be passed to both C
compiler and assembler when compiling “.c” or “.s” files.
4.8.2. C Compiler
This section contains the settings for compiling C language (.c) files.
Item
Description
Include directories
Add directories to the include search path. Separate with
comma (',').
Preprocessor definitions
Define preprocessor symbols. Separate with comma (',').
Compiler warnings
Add any compiler warning control flags here.
Add debug symbols
If checked, debug symbols are added to object files (and to any
resulting executables). Without debug symbols you cannot
debug executables at C language level.
Optimization level
Define optimization level: 0 (off) .. 6 (max)
Additional options
Any options added here will be added to every C compilation
command. Separate options with spaces.
4.8.3. Assembler
This section contains the settings for compiling assembly (.asm, .s) files.
Item
Generate List file
Description
Defines a file where to output a verbose listing
of the program. Leave blank if list file is not
needed.
Additional options
Any options added here will be added to every
assembler command. Separate options with
spaces.
VSIDE User's Manual
Page 38
4. Development environment
4.8.4. Linker
This section contains the settings for linking object files. These settings are valid only if project type
is “Executable”.
Item
Library directories
Description
Add directories to the library search path.
Separate with comma (',').
Libraries
Libraries to be linked with the executable.
Separate with comma (',').
Startup module
Filename of a startup module object to be linked
with executable.
Mem Description file
Memory description file to be used during
linking.
Linker command file
A linker command file can be used to map and
force sections into specific memory areas as
found in mem_desc. Use this parameter to
override the default command file.
Incremental linking
Enable incremental
linking. See VSLINK
documentation for more information.
Keep relocations
Prevents relocations to be deleted. See VSLINK
documentation for more information.
Strip symbols
Discards any symbol information from objects.
Additional options
Any options added here will be added to every
linker command. Separate options with spaces.
VSIDE User's Manual
Page 39
4. Development environment
4.8.5. Debugging
These settings are valid only if project type is “Executable”.
Item
Mem Description file
Description
Memory description file to be used when
debugging the system. This may differ from one
used during linking.
4.8.6. Tools
This section defines which executables will be used for C compiler, assembler, linker and archiver
when building a project.
Item
Description
C Compiler EXE:
Executable for C compiler. Default is “lcc”.
Assembler EXE:
Executable for assembler. Default is “vsa”.
Linker EXE:
Executable for linker. Default is “vslink”.
Archiver EXE:
Executable for archiver. Default is “vsar”.
VSIDE User's Manual
Page 40
4. Development environment
4.9. Solution options
Solution options are divided into three tabs;
•
“Configurations” - for associating active project configurations with solution
•
“Cores” - for configuring debugged cores (note: currently disabled)
•
“Debugging”- for configuring debugging mode
On the top of the dialog, configuration under modification is shown.
Solution options are automatically saved when they are modified.
Any directory name can be either absolute or relative.
VSIDE User's Manual
Page 41
4. Development environment
4.9.1. Configurations
Each solution configuration contains the information of which of the project configurations are
active. Thus, the solution configuration acts like a group selector for active project configurations.
Switching active solution configuration from one to another will switch all the active project
configurations.
The active project configuration list contains a list of all the projects and the selected project active
configuration.
By clicking the project name, the active project can be changed from the Project settings group
below.
4.9.2. Cores
Cores tab configures the DSP cores used during debugging. This version of VSIDE does not
support multi-core debugging, thus this section is always disabled.
4.9.3. Debugging
Debug target for the solution is defined in the debugging tab. There are two options; software-based
simulation and hardware-based emulation.
In case simulation is being selected as the debug mode, no further options are needed. For the
hardware emulation, the following parameters must be given:
Item
Serial port
Description
Name of the serial port which will be used for
communicating with the hardware.
Initial speed
Initial speed is the serial port speed that the
target communicates right after reset.
Target speed
Serial port speed that will be used to
communicate with the target (except for the
initialization phase which uses “Initial speed”
setting).
VSIDE User's Manual
Page 42
4. Development environment
Item
Speed multiplier
Description
If a high-speed serial port is available, it is
possible to use this value to get serial speeds
over 115200 bps.
Chip type
VSDSP chip type which is used in the target
board.
Clock speed
VSDSP clock speed which is used in the target
board.
Monitor file
Hardware emulator's monitor file to be loaded
into the target. Not applicable for VSDSP4.
VSIDE User's Manual
Page 43
5. Debugging
5. Debugging
This chapter describes the integrated debugger of VSIDE. This information applies to both software
simulation and hardware emulation.
5.1. Debug commands
Debugger can be controlled by using debug menu, debug toolbar or keyboard shortcuts. Layout of
the debug toolbar is shown below.
The following debug operations are available:
Item
Icon
Keyboard
Description
shortcut
Run
F5
Run the executable. The execution will continue
until breakpoint is hit, or Break command is
activated.
Note: During hardware emulation, it may not be
possible to break execution without previously set
breakpoints.
Run to Cursor
As above, except the execution will stop when
location of the cursor is reached (or any breakpoint
before the cursor location).
Break
F6
Break the execution. This command is not available
during hardware emulation.
Stop
SHIFT-F5
Break the execution and exit the debug mode.
debugging
VSIDE User's Manual
Page 44
5. Debugging
Item
Icon
Keyboard
Description
shortcut
Restart
F4
Unload current executable, reload executable again,
reset the VSDSP and run the executable until main()
is reached.
Step
single
F8
core clock
C-level
in the disassembly view.
step
F11
into
C-level
Execute a single clock cycle. Useful for debugging
Continue execution until the the next C line, or
execution moves into another function.
step
F10
over
Continue execution until the execution reaches the
next C line.
Currently not supported in software simulation.
C-level
step
SHIFT-F11 Continue execution until the current function exits.
out
Profiling
Currently not supported in software simulation.
Scroll Lock Start / stop profiling.
toggling
For further information on profiling output file, see
VS DSP Software Tools User’s Manual, section 9.6.
Not supported in hardware emulation mode.
View assembly
-
Toggles the source disassembly view. Available
during debugging only.
Refresh
F2
Refresh all windows. Use this to refresh in
simulation mode to get up-to-date simulation status.
VSIDE User's Manual
Page 45
5. Debugging
5.2. Debug windows
This section describes the debugging windows. These, like most other dock windows, can be shown
and hidden individually by using the Window menu.
5.2.1. Watch window
Watch window contains an user-defined list of variables to be viewed.
To enter a new value to be viewed, click on <add new...> and type variable name, e.g. “a” or
“hexTable[10]”. The variable is then added to the list, with it's current value shown on the right.
If a variable cannot be evaluated at the current execution address, all the parameters will be set to '?'.
Please see page 20 for important notes regarding the availability of values of variables.
To delete variable from the watch list, select the variable by clicking it and select Remove.
5.2.2. Active variables window
Active variable window shows C language variables that are visible at the current execution
address.
To modify the value of a variable, click on the variable's value column and type a new value. The
new value can be decimal, hexadecimal (prefixed with '0x') or symbol.
VSIDE User's Manual
Page 46
5. Debugging
Please note that the contents of arrays are not downloaded when using hardware emulation. Instead,
the array fields will display <hidden>. This is done to speed up debugging over the serial port. Use
the watch window to inspect array contents in the hardware emulation mode.
5.2.3. Peripheral window
Peripherals are only supported by the software simulator. Peripherals are used to make system-level
simulation possible.
The peripheral window displays the status of the loaded peripherals. Each peripheral instance that
supports the peripheral GUI API is shown here.
Each peripheral can define individual graphical user interface. Some of the elements may allow user
interaction, depending on the implementation of the peripheral.
To use one or more peripherals during the simulation, add the required peripherals to project's
mem_desc file under PERIPHERAL section. Configured peripheral plugins must be located in
VSIDE/plugins directory.
For more information on peripherals, see separate Peripheral GUI API documentation.
5.2.4. Log window
Log window shows build and debug messages.
5.2.5. Standard input/output window
VSIDE User's Manual
Page 47
5. Debugging
The standard input/output window displays VSDSP core output, as well as sends key-presses to the
stdin stream.
If the stdout data grows too large, the window will cut off the oldest data from the top.
5.2.6. Breakpoint window
The breakpoint window displays the currently set breakpoints.
Breakpoints are used to stop program execution at requested positions. When the program execution
reaches the breakpoint address, the execution will be break.
Breakpoints can be added under disassembly window (during debugging only), or directly at C
source lines, regardless of the debugging state. Source-line breakpoints are automatically inspected
and added to the corresponding program memory addresses.
VSIDE User's Manual
Page 48
5. Debugging
To remove a breakpoint, select the breakpoint by clicking on its name, and then press Remove (or
press DEL key).
A breakpoint can be either active or inactive. An inactive breakpoint has no effect on program
execution. To make a breakpoint inactive, click the red dot in the breakpoint window. The red dot
will turn gray. To re-activate it, click the gray dot, and it will change red again.
VSIDE also supports conditional breakpoints. You can enter C level conditional expressions by
clicking the breakpoint's Condition field and entering a condition, e.g. “z != 0”. Remember to use
spaces around conditional operators. In case the condition was incorrect, VSIDE will show an error
when the code reaches the breakpoint for the first time.
5.2.7. Command console window
Command console provides a text-based interface to the simulator and the emulator.
VSIDE User's Manual
Page 49
5. Debugging
To use the command console, enter commands into the edit box on the bottom of the command
console window. You can use command history by using the cursor keys.
To see the list of commands available, type help and press <enter>. To see the syntax of a specific
command, type help followed by the name of the command. Further documentation can be found
from the VSDSP Software Tools User's Manual.
5.2.8. Memory window
Memory window will display memory contents in hex and ASCII format.
Displayed memory type (X/Y/I) can be changed by using combo box on the top of the memory
window. Below is an example output from the memory window. Please note that contents of
unconnected memory will show up as dashes ('-').
VSIDE User's Manual
Page 50
5. Debugging
There are several ways to change the displayed memory address. Address or variable name can be
entered into the Goto address edit box. It is possible to use hex or decimal format, or symbol names
(e.g. “main”).
To freely browse memory, use keyboard cursor keys and PAGE UP and PAGE DOWN or mouse
wheel.
To modify memory contents, just move the “memory cursor” (underlined and bolded value) to the
desired address and type new hex values using the keyboard.
5.2.9. Register window
The register window displays the current VSDSP core register values.
The register window can display register values in hex, decimal and binary formats. Use buttons
“H”, “D” and “B” to toggle between these.
VSIDE User's Manual
Page 51
5. Debugging
To modify register values, left-click on field and enter a new value.
5.2.10. Disassembly window
The disassembler window can be used to view the machine language representation of the source
code. It is useful during debugging only. To display (and hide) the disassembler view, click on the
assembler icon on the toolbar.
The viewing position can be changed by scrolling the window, PAGE UP and PAGE DOWN,
cursor keys or using the mouse wheel. To jump to a specific address, type the program memory (Ipage) address or a function name to View addr/function edit box and press enter.
You can toggle breakpoints by clicking the area next to the disassembly code (margin).
5.3. Simulating executables directly
It is possible to simulate executables directly without creating a project or solution.
VSIDE User's Manual
Page 52
5. Debugging
To simulate executables, open the File menu and select Open and then Executable into simulator.
Then select the appropriate executable file (typically a .coff file) and required mem_desc file. The
simulator will now open.
Please note that the harware emulator does not support direct program execution.
VSIDE User's Manual
Page 53
6. Miscellaneous
6. Miscellaneous
6.1. Command line options
VSIDE supports some command line options.
For all operating systems, it is possible to automatically open a solution file by giving the solution's
filename as a command line argument. Other file types as parameters will be opened in the editor.
All VSIDE versions also support style parameter:
•
style <style>, changes the GUI style. Style can be one of:
○
windows
○
motif
○
platinum
The X11 version of VSIDE also supports some traditional X11 command line options:
•
-geometry <geometry>, sets the client geometry
•
-fn or -font <font>, defines the application font. The font should be specified using an X
logical font description.
•
-bg or -background <color>, sets the default background color and an application palette
(light and dark shades are calculated).
•
-fg or -foreground <color>, sets the default foreground color.
•
-btn or -button <color>, sets the default button color.
•
-visual TrueColor, forces the application to use a TrueColor visual on an 8-bit display.
•
-cmap, causes the application to install a private color map on an 8-bit display.
VSIDE User's Manual
Page 54
6. Miscellaneous
6.2. Creating project templates
Project templates are frameworks that are used as a starting point when a new project is being
created. Available project templates are shown in “New Project” dialog.
Project template contains:
•
project configuration information
•
any files related to project, e.g. C source files, mem_desc files, libraries, documentation, etc.
Creating a new project templates is simple:
•
Use New project and select a project template that resembles the template project you want to
create.
•
Modify it normally with VSIDE it until it contains the project settings and files you'd like to
have as a template. All files should be located under the project's directory.
•
Go to operating systems file manager, and make a copy of the project folder to
(VSIDE_DIR)/templates/project/. Rename the new folder to something that describes the
template project.
•
Under this new folder, rename the project file (with prefix “.project”) to “template.project”.
•
Open “template.project” with a text editor, and find string “[Project]” in the beginning of the
file. Under this group, there is a variable named “ Name”. Set the name variable to:
Name = “$$$PROJECTNAME”
You may also want to change the target filename to :
TargetFilename
= ""$$$PROJECTNAME.coff"
The new project template should be now available in “New project” dialog.
Note: creating new solution templates is not currently supported.
6.3. mem_desc file format
VSIDE User's Manual
Page 55
6. Miscellaneous
The default name for the memory description file is mem_desc, but any name can be used as long
as the new name is specified for the linker and simulation/emulation tools. Memory description file
used by the linker can be changed from the project settings dialog.
If the memory description file is not found in the current working directory, it is searched for in the
directory pointed by the VSDSP_DIR environmental variable.
The memory description file consists of several parts that define different things.
•
MEMORY section defines the general memory layout and memory types.
•
CORE section defines clock frequency and boot address.
•
PERIPHERAL section defines peripheral register mapping. Individual peripheral
instantiations configure the peripherals themselves.
6.3.1. MEMORY Section
Below is an example of a memory section of a mem_desc file.
MEMORY {
page 0:
i_ram: origin = 0000h, length = 1000h
i_rom: origin = 4000h, length = 800h, option = "ROM"
page 1:
bss_x: origin = 0000h, length = 800h
page 2:
bss_y: origin = 0000h, length = 800h
perip_y: origin = 4000h, length = 400h, option = "OLDPERIPHERAL"
host_mem: origin = 4400h, length = 400h
stdio: origin = 0x7000, length = 2, option = "vsstdio"
page 3:
}
VSIDE User's Manual
Page 56
6. Miscellaneous
Each entry in the memory configuration file consists of four fields. The first one, page, defines the
memory page for that entry. The page definition can be omitted when the page does not change. The
second field defines a logical name for the entry, e.g. bss_x. The third field, origin, sets the starting
address, and the fourth field, length, defines the length of the memory block. Start addresses and
lengths are currently not restricted in any way except that they may not overlap.
An optional field, option, may be used to define special attributes for the memory entries. These
definitions are used only by the simulator. Hardware emulator will ignore any memory area
definitions with the option field present.
Currently the following special options are available:
•
option=”ROM” flags a memory area as read-only.
•
option=”quit” defines an end-address for program execution. If instructions are fetched
from memory address that has this option, the simulation is stopped with success return
value. This option is only available in page 0 (the instruction memory space).
•
option=”>file” and option=”<file” option starting with a '<' defines an input file, and
option starting with a '>' defines an output file. These options are only available in pages 1,
2, and 3. Pages 1 and 2 are data memories X and Y, respectively. Page 3 refers to both of
them, meaning that page 3 can be accessed from both X- and Y-bus.
•
option=”vsstdio” is a special module that provides C standard input/output support. It must
be defined into the right location for the libc16 and libc32 libraries. The normal location is Y
memory (page 1) at 0x7000.
•
option=”PERIPHERAL“ defines an area as a peripheral bus bridge access point. Writes are
pipelined, reads cause one wait state. The actual peripheral register mapping is defined in the
PERIPHERAL section.
•
OLDPERIPHERAL defines an area as a peripheral bus bridge access point. Writes are
pipelined, reads do not cause wait states. The actual peripheral register mapping is defined in
the PERIPHERAL section.
6.3.2. CORE Section
VSIDE User's Manual
Page 57
6. Miscellaneous
CORE {
frequency = 48.0MHz
bootaddr = 0x4000
}
The core section sets some parameters for the core. By setting a clock frequency (or cycle time) the
simulation can show and understand 'realtime'.
6.3.3. PERIPHERAL Section
Below is an example peripheral section of a mem_desc file.
PERIPHERAL {
Y:0x4000
Y:0x4002
Y:0x4004
Y:0x4006
Y:0x4007
Y:0x4008
Y:0x4009
=
=
=
=
=
=
=
15-0:INTERRUPT.enablel0
15-0:INTERRUPT.enableh0
15-0:INTERRUPT.origin0
15-5:0,4-0:INTERRUPT.vector
15-3:0,2-0:INTERRUPT.encount
15-0:INTERRUPT.glob_dis
15-0:INTERRUPT.glob_en
Y:0x4020
Y:0x4021
Y:0x4022
Y:0x4023
Y:0x4024
Y:0x4025
Y:0x4026
Y:0x4027
Y:0x4028
Y:0x4029
Y:0x402a
=
=
=
=
=
=
=
=
=
=
=
15-0:IO.ddr
15-0:IO.odata
15-0:IO.idata
15-0:IO.int_fall
15-0:IO.int_rise
15-0:IO.int_pend
15-0:IO.set_mask
15-0:IO.clear_mask
15-0:IO.bit_conf
15-0:IO.bit_eng0
15-0:IO.bit_eng1
y:0x4040
y:0x4041
y:0x4042
y:0x4043
y:0x4060
y:0x4061
y:0x4062
y:0x4063
=
=
=
=
=
=
=
=
3-0:UART0.ssr
7-0:UART0.data
15-8:UART0.data
15-8:UART0.div0,7-0:UART0.div1
3-0:UART1.ssr
7-0:UART1.data
15-8:UART1.data
15-8:UART1.div0,7-0:UART1.div1
}
y:0x40a0 = 15-0:WDOG.config
y:0x40a1 = 15-0:WDOG.reset
y:0x40a2 = 15-0:WDOG.dummy
VSIDE User's Manual
Page 58
6. Miscellaneous
The peripheral section defines the mapping of peripheral registers into memory. The memory area
must have been set aside in the memory section by using the option PERIPHERAL (asynchronous
peripheral bus, 1 wait state in read, pipelined write) or OLDPERIPHERAL (synchronous peripheral
bus, no wait states).
The peripherals must be instantiated with the same names that are used in the PERIPHERAL
section.
6.3.4. INTERRUPT Section
Below is an example interrupt section of a mem_desc file.
INTERRUPT {
type = vsdsp4
interrupts = 16
}
The interrupt section configures the interrupt block. Depending on the interrupt handler type,
different registers are available.
6.3.5. Peripheral instantiation
All other peripherals are configured and instantiated similarly to the interrupt handler. The
peripheral definition begins with a unique name. The following block defines the characteristics of
the peripheral instance.
IO {
#
}
type = "stdio"
infile = "gpioin.dat"
outfile = "gpioout.dat"
bits = 16
intnum = 0
verbose = 1
The example instantiation above creates a peripheral called IO, which is the standard VSDSP4
interruptable GPIO block and gives it some parameters. Lines starting with a hash ('#') are regarded
as comments.
VSIDE User's Manual
Page 59