1
VSIDE User's Manual
Revision 1.01
Apr 15, 2003
Revision history:
Rev.
Date
Description
1.00
8. Apr. 2003
First edition
1.01
15. Apr. 2003
Typo corrections.
VSIDE User's Manual
Page 1
Table of Contents
1. Introduction......................................................................................................................................4
1.1. Features.....................................................................................................................................4
1.2. Requirements............................................................................................................................5
2. Installation........................................................................................................................................6
2.1. VSIDE Windows......................................................................................................................6
2.2. VSIDE UNIX............................................................................................................................6
2.3. License manager server installation..........................................................................................7
3. Getting started with VSIDE..............................................................................................................8
3.1. Introduction...............................................................................................................................8
3.2. Creating a project......................................................................................................................8
3.3. Modifying the source................................................................................................................9
3.4. Compiling the code.................................................................................................................10
3.5. Executing and debugging the code.........................................................................................11
3.6. Adding files to the project......................................................................................................12
3.7. Setting breakpoints.................................................................................................................14
3.8. Variable evaluation.................................................................................................................16
3.9. Modifying project options......................................................................................................18
3.10. Profiling................................................................................................................................19
4. Development environment.............................................................................................................20
4.1. Introduction............................................................................................................................20
4.1.1. Projects and Solutions.....................................................................................................20
4.1.2. Configurations.................................................................................................................20
4.1.3. Dock windows.................................................................................................................20
4.2. Solution browser.....................................................................................................................21
4.2.1. File operations.................................................................................................................22
4.2.2. Folder operations.............................................................................................................22
4.2.3. Project operations............................................................................................................22
4.2.4. Solution operations.........................................................................................................23
4.3. Editor......................................................................................................................................23
4.4. Building..................................................................................................................................24
4.4.1. Build commands.............................................................................................................24
4.4.2. Configuration manager...................................................................................................25
4.5. Menus.....................................................................................................................................26
4.5.1. File menu.........................................................................................................................26
4.5.2. Edit menu........................................................................................................................27
4.5.3. Project menu...................................................................................................................27
4.5.4. Build menu......................................................................................................................27
4.5.5. Debug menu....................................................................................................................27
4.5.6. Windows menu...............................................................................................................28
4.5.7. Help menu.......................................................................................................................28
4.6. New project creation...............................................................................................................28
4.7. File options............................................................................................................................29
4.8. Project options.......................................................................................................................30
4.8.1. General............................................................................................................................30
4.8.2. C Compiler......................................................................................................................31
VSIDE User's Manual
Page 2
4.8.3. Assembler........................................................................................................................31
4.8.4. Linker..............................................................................................................................32
4.8.5. Debugging.......................................................................................................................32
4.8.6. Tools................................................................................................................................33
4.9. Solution options.....................................................................................................................33
4.9.1. Configurations.................................................................................................................34
4.9.2. Cores...............................................................................................................................34
4.9.3. Debugging.......................................................................................................................35
4.10. Preferences............................................................................................................................36
4.10.1. General..........................................................................................................................37
4.10.2. Editor ............................................................................................................................37
5. Debugging......................................................................................................................................39
5.1. Debug commands..................................................................................................................39
5.2. Debug windows.....................................................................................................................41
5.2.1. RTOS window................................................................................................................41
5.2.2. Watch window...............................................................................................................41
5.2.3. Active variables window................................................................................................42
5.2.4. Peripheral window.........................................................................................................43
5.2.5. Log window...................................................................................................................43
5.2.6. STDIN/STDOUT window.............................................................................................44
5.2.7. Breakpoint window........................................................................................................44
5.2.8. Command console window............................................................................................45
5.2.9. Memory window............................................................................................................46
5.2.10. Register window..........................................................................................................46
5.2.11. Disassembly window...................................................................................................47
5.3. Simulating executables directly..............................................................................................48
6. Miscellaneous.................................................................................................................................49
6.1. Command line options...........................................................................................................49
6.2. Creating new project templates..............................................................................................50
6.3. mem_desc file format............................................................................................................51
6.3.1. MEMORY Section .........................................................................................................51
6.3.2. MIRROR Section ...........................................................................................................53
6.3.3. CORE Section ................................................................................................................53
6.3.4. PERIPHERAL Section ..................................................................................................54
6.3.5. INTERRUPT Section .....................................................................................................54
6.3.6. Peripheral Instantiation ..................................................................................................55
6.4. hw_desc file format...............................................................................................................55
6.5. Included peripherals................................................................................................................55
6.5.1. INTERRUPT...................................................................................................................55
6.5.2. STDSERIAL ..................................................................................................................56
6.5.3. STDWATCHDOG .........................................................................................................57
6.5.4. STDIO ............................................................................................................................58
6.5.5. FILEIN............................................................................................................................59
6.5.6. TIMER............................................................................................................................59
VSIDE User's Manual
Page 3
1. Introduction
1. Introduction
VSIDE is an integrated development environment for VLSI Solution VS_DSP cores.
1.1. Features
VSIDE v1.0 contains the following features:
Integrated development environment (IDE) for VSDSP cores, including integrated
project management, code editor, debugger, C compiler and assembler.
C and assembly level debugging by using simulator or hardware emulator
Multi-core debugging supported in simulator
Two-point profiling
Entire system simulation by using C modeled custom peripherals
Multi-OS support: Windows XP/2000, Red Hat Linux 7.0-8.0, Sun Solaris 5.8
VSIDE User's Manual
Page 4
1. Introduction
1.2. Requirements
Windows:
Microsoft Windows 2000 or Windows XP Professional
PC x86 architecture
Linux:
Red Hat Linux 7.0 – 8.0
PC x86 architecture
Sun:
Sun Solaris 5.8
32-bit or 64-bit SPARC architecture
VSIDE User's Manual
Page 5
2. Installation
2. Installation
2.1. VSIDE Windows
Run win32setup.exe to start setup.
To be able to set the required environment variables (PATH and VSDSP_DIR), you need to use
administrator account when running the setup.
2.2. VSIDE UNIX
1) Unpack this VSIDE tar.gz package to any directory. This directory is now referred as VSIDE.
E.g. Installing package at /tmp/ to /usr/local/:
cd /usr/local
tar xfvz /tmp/vside_linux.tar.gz
2) Set VSDSP_DIR environment variable to point to VSIDE/config.
For bash:
VSDSP_DIR=/usr/local/vside/config
export VSDSP_DIR
For csh or tcsh:
setenv VSDSP_DIR /usr/local/vside/config
3) Add VSIDE/bin path to $PATH. Without this, compiling won't work in IDE.
For bash:
PATH=/usr/local/vside/bin:$PATH
export PATH
For csh or tcsh:
setenv PATH /usr/local/vside/bin:PATH
4) CD to VSIDE path and run VSIDE:
cd vside
./vside
VSIDE User's Manual
Page 6
2. Installation
2.3. License manager server installation
VSIDE needs a connection to VSIDE license manager server. To set up the license manager,
download the separate VSIDE license manager package and install it according to its instructions
delivered with the package.
VSIDE User's Manual
Page 7
3. Getting started with VSIDE
3. Getting started with VSIDE
3.1. Introduction
This chapter describes the very basics of VSIDE. In case you have been using other similar IDEs
before, this will be mostly trivial information for you. Knowledge on VSIDE core is not required, as
this tutorial is kept in C language level.
In this exercise we will create a “Hello world” project, and use it in a various of ways.
First, start up VSIDE. The IDE should now look like this:
The windows are empty and most features are disabled, since no projects are open.
3.2. Creating a project
We're going to start by creating a new “Hello world” project. The simplest way to do this is to use
“Hello World” project template, which contains “main.c” source file and proper project settings.
Now do the following:
VSIDE User's Manual
Page 8
3. Getting started with VSIDE
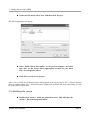
Under the File menu, click 'New' and then click 'Project'.
The following dialog will appear:
Select “Hello World Executable” as the project template, and then
type “hw” as the Name. Select appropriate location in your hard
drive. See the picture above.
Click OK to create a new project.
After a few seconds, the solution browser will populate with a new project “hw”, which is located
under a solution called “hw”. Solution browser displays the solution and project hierarchy, as well
as all the related source files.
3.3. Modifying the source
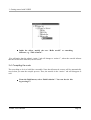
Double-click “main.c” inside the solution browser. This will open the
“main.c” file in the integrated editor.
VSIDE User's Manual
Page 9
3. Getting started with VSIDE
Inside the editor, modify the text “Hello world!” to something
different, e.g. “This is fun!\n”.
You will notice that the editor's “main.c” tab will change to “main.c*”, where the asterisk informs
that the file has been modified, but not saved.
3.4. Compiling the code
The next thing to do is to build the executable. Note that all unsaved sources will be automatically
saved when you start the compile process. Thus, the asterisk in the “main.c” tab will disappear as
well.
From the Build menu, select “Build solution”. You can also do this
by pressing F7.
VSIDE User's Manual
Page 10
3. Getting started with VSIDE
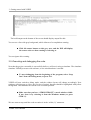
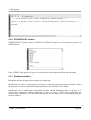
The build output on the bottom of the screen should display output like this:
You can see a line with gray background, which informs of a compilation warning.
Click left mouse button on this grey area, and the IDE will display
the source code row that warning is referring to.
You can ignore this warning.
3.5. Executing and debugging the code
Now that the project executable is successfully built, we will test it using a simulator. The simulator
simulates VSDSP processor with software, so no actual hardware is needed.
To start debugging from the beginning of the program, select “Step
Into” from the Debug menu, or press F11.
VSIDE will now switch to debug mode, and the window layout will change accordingly. New
windows will also pop up. Now, the first row of main() function should be highlighted with yellow
background. This indicates the current code execution position.
Make sure that you have “STDIN/STDOUT” console window visible.
If not, show it by selecting it from the Windows menus (or press
CTRL-5).
We now want to step until the code execution is in the “while(1);” statement.
VSIDE User's Manual
Page 11
3. Getting started with VSIDE
select “Step into” from the Debug menu (or press F11) until you
reach the while(1) statement.
Now, look at STDIN/STDOUT window. You should see your modified hello world message there
now.
After this, we want to stop debugging and continue editing the code.
Select “Stop debugging” from the Debug menu (or press SHIFT-F5).
The confirmation message box appears. Select “Yes” to proceed.
VSIDE now switches back to project editing state, and changes the window layouts again. Note that
the previous window layouts will be saved, so if you move windows around or close them, they will
appear (more or less) in the same way next time.
3.6. Adding files to the project
Next, we will create a new source file that will be merged to the current project.
Under the File menu, click 'New' and then click 'File'.
New empty document will appear. Using the integrated editor, type the following into the
document:
void foo() {
int z;
for (z = 0; z < 100; z++) {
printf("z = %d\n", z);
}
}
Now, under the File menu, click 'Save' (or press CTRL-S) and then
select a save path and a filename for this document. Save the file
under the newly created project path (e.g. “\solutions\hw”), and name
it as “foo.c”.
VSIDE User's Manual
Page 12
3. Getting started with VSIDE
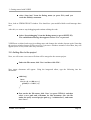
Now we need to add this new source file into the project. This is done as follows:
Inside the Solution Browser, right-mouse click the “Project 'hw'”
item. Select “Add existing item...”.See the picture below:
A file selection dialog appears. Select “foo.c” and press “Open”.
“foo.c” should now appear under project 'hw' in the Solution Browser. Now, we want our main()
function to call foo(), so we need to modify main.c.
Double click “main.c” under Solution Browser (or just select
“main.c” tab in the editor, if it is still open). Modify “main.c” so that
it looks as follows (changes are shown with gray background):
VSIDE User's Manual
Page 13
3. Getting started with VSIDE
#include <stdio.h>
void foo(); /* Introduce foo() function */
/* This is a hello world example! */
int main(void) {
puts("This is fun!\n");
foo(); /* Call foo() */
while(1);
return 0;
}
Now compile the program, like mentioned before. Again, this will
automatically save the source files changes to disk. If there are any
errors, fix them and recompile again.
Now, the new foo() function should be integrated into our project. We will test it in the next section.
3.7. Setting breakpoints
The next thing to try out is to use breakpoints. Breakpoints stop the program execution when the
execution reaches the breakpoint position. Breakpoints can be set while being in the edit mode or
during debugging.
In “main.c”, set a breakpoint to “foo(); /* Call foo() */” line. Setting
breakpoints can be done either by clicking left mouse button in the
left gray area in the editor, or to move editor's cursor to the
appropriate line and then press F9. A red marker dot should appear
in this gray area next to the source line. See the picture below.
Note that you can clear breakpoints by redoing the above-mentioned operation.
We will now also create another breakpoint.
VSIDE User's Manual
Page 14
3. Getting started with VSIDE
Under “foo.c”, set another breakpoint to line:
“printf("z = %d\n", z);“.
We want this second breakpoint to be active only when C language condition “z == 5” is true. To
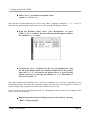
make the second breakpoint conditional, we need to open the breakpoint window.
From the Windows menu, select “View Breakpoints” (or press
CTRL-3). Now, a window like the following should appear (without
the condition 'z == 5' entry):
To make the “foo.c” conditional, in the foo.c() breakpoint line click
the left mouse button under the condition column. This is the position
where the “z == 5” is located in the picture above. A cursor should
appear, and now you can type the condition “z == 5”. Remember to
use spaces around '=='.
Note that conditional breakpoints may cause the simulation to run slower, depending on the
breakpoint position. Each time the execution reaches position where the breakpoint is located, it
causes a slight delay regardless of whether the condition is true or not.
Now, we can test how the breakpoints work. No compilation is now needed, as no changes to the
source code have been made.
Run the program; from the Debug menu you can do this by selecting
“Run”, or by pressing F5.
VSIDE User's Manual
Page 15
3. Getting started with VSIDE
The program should now hit the first breakpoint inside main(). We can now proceed to the next
breakpoint.
Run the program again by pressing F5.
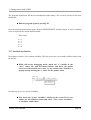
Now the program should pause again. Inspect STDIN/STDOUT window output. In case everything
went as expected, the output should contain:
“This is fun!
z=0
z=1
z=2
z=3
z = 4”
3.8. Variable evaluation
Next thing to practice is to evaluate variables. The first way to do it is to mark variables simply with
the mouse:
While still in the debugging mode, mark any 'z' variable in the
“foo.c” source file with left mouse button, and hover the mouse
cursor over the marked area. After ca. one second, there should be a
pop-up tool tip showing the 'z' value. See the picture below.
Second way is to view 'Active Variables'.
Now locate the “Active Variables” window in the screen. If it is not
visible, use the Windows menu and select “View Active Variables”.
'z' should be visible there.
VSIDE User's Manual
Page 16
3. Getting started with VSIDE
Now let's try to change the 'z' value on the fly.
Under “Active Variables” window, click the left mouse button on 'z'
value. An editor cursor will appear. Now, type the '0' as the new
value for 'z'.
Now, run the simulation again (using F5).
Program should break again on the conditional foo() breakpoint. The STDOUT output should be
now:
“This is fun!
z=0
z=1
z=2
z=3
z=4
z=0
z=1
z=2
z=3
z = 4”
The third way to deal with variables is to use 'Watches' window. In watch window, you can type
variable names, and VSIDE will evaluate them with every screen update.
Locate the “Watches” window on the screen. If it's not visible, use the
Windows menu and select “View Watches”.
Left mouse click “<add new...>” item, and editor cursor should
become visible. Type 'z' and press enter. In case 'z' is visible at the
current code location, the value will be displayed. In case it is not, the
values will be '?'.
Now stop debugging (by pressing SHIFT-F5), and clear the
breakpoints.
VSIDE User's Manual
Page 17
3. Getting started with VSIDE
3.9. Modifying project options
Next, we will take a look at project options.
Under Solution Browser, right-mouse click the project item. Select
'Properties'.
Project options dialog will now open.
Select “C Compiler” tab, as shown in the picture below.
We now want the compiler to optimize the code. We can do it by changing the optimization level
from -O0 to -O6.
Set the optimization level to -O6. Press “OK”.
To put the new settings into effect, we must rebuild the executable.
VSIDE User's Manual
Page 18
3. Getting started with VSIDE
From the Build menu, select 'Rebuild solution'. Note that since we have only
one project under solution, it would have the same effect to select 'Rebuild
project'.
3.10. Profiling
To be able to optimize the code, it is important to know the code performance at each position. This
is called profiling. VSIDE supports two-point profiling, where the performance will be measured
between two code positions. In the first position the profiling is activated, and in the second one it
will be stopped. The result is the profiling information between these two points.
Now, we want to profile the foo() function's for-loop.
Create two breakpoints to main() function, one at “foo(); /* Call foo()
*/” and one at the “while(1);” one line below.
Now run the program until the execution hits the first breakpoint.
Then, under Debug menu, select 'Start/stop profiling'.
Run the program again. The execution should now stop at the second
breakpoint. Again select 'Start/stop profiling'.
A pop-up window with the profiling data should now appear.
Close the profiling pop-up window, and stop debugging (SHIFT-F5).
This tutorial is now completed. Hopefully you now have a basic insight how VSIDE can be utilized
to develop systems based on VSDSP.
VSIDE User's Manual
Page 19
4. Development environment
4. Development environment
4.1. Introduction
VSIDE consists of source code editor, project management, compilers and debugger.
4.1.1. Projects and Solutions
The two key items in VSIDE's Project management are “projects” and “solutions”. These are used
to provide hierarchies and to auto-generate makefile scripts for binary compilation.
“Project” resembles either a single executable, or a static library. It consists of a group of source
files that produce the target binary.
“Solution” definitions include the dependency relationships among projects (e.g. “Executable”
project with a depending “Static library” project). They also include information about how to
deploy the projects that make up your solution.
Solution hierarchy system comes to its full power when creating a solution with several executable
projects (for simulating multi-processor environment).
There can be only a single solution open at the time.
4.1.2. Configurations
A configuration represents the settings of a particular project/solution.
E.g. a project could have a configuration for debugging and release purposes; debug version would
contain debug symbol information, whereas release wouldn't. Instead of having to edit project
options constantly (switching on and off the debug symbol option), creating two such project
solutions and then switching then between them would be more elegant choice.
Solution configuration works in the same way. Switching between solution configurations also
switches current active project configurations; this is because solution contains also information for
each project which configuration is active.
Every project and solution must have 1...N configurations each.
4.1.3. Dock windows
VSIDE uses dock windows to visualize information. Dock windows can be moved and resized
within the main VSIDE window.
Dock windows can be dragged into dock positions, by holding left mouse button on the dock
VSIDE User's Manual
Page 20
4. Development environment
window title bar and moving mouse cursor to a dock position. Dock positions are in the middle of
main window borders; top, bottom, left and right. When dragging the dock window, the rectangle
will change to thin line thickness when the window is ready to dock the dock area.
Note that VSIDE saves separate window position data for debugging, project edit and initialization
modes.
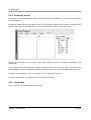
4.2. Solution browser
Currently open solution and its context is shown in “Solution Browser Window”. During
debugging, Solution Browser will be hidden by default.
In the picture below, there is solution called “prime”, and two projects inside it. Inside each project,
there are folders that contain the individual files. These folders are only used to group same types of
files together, they do not reflect the disk directory hierarchy.
One of the projects is always set as “Active”. When invoking project operations (like “Build
project”), active project is affected by the operation. To change the active project, right-mouse click
on the top of the project icon (inside “Solution Browser Window”) and select “Set as active
project”.
To quickly open source file for viewing or editing, double-click on the file's icon.
VSIDE User's Manual
Page 21
4. Development environment
There are several features that can be accessed through Solution Browser. They are invoked by
right-clicking either files, folders, projects or solutions. These are described below.
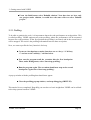
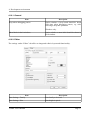
4.2.1. File operations
Item
Description
Compile
Compile the file.
Remove
Remove file from project. This will not remove the file for
hard disk.
Properties
Edit file properties.
See Section 4.7 for more information.
4.2.2. Folder operations
Item
Description
Add existing item...
Adds new source files to project. A file selection dialog will
appear. The selected file will be included to the project.
Remove
Remove the folder and its contents from the project. This
will not remove any files from the hard disk.
This option is not available to some of the folders that must
exist in the project.
Rename
Rename the folder name.
This option is not available to some of the folders that must
exist in the project.
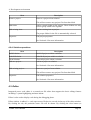
4.2.3. Project operations
Item
Description
Set as active project
Select project as an active project. Active project is affected
by any project-specific commands in Project or Build menus.
Build
Build project target.
Rebuild All
Clean and then build project target.
Clean
Clean project target and any temporary object files.
Save project
Save project changes to disk.
VSIDE User's Manual
Page 22
4. Development environment
Item
Remove project
Description
Remove a project from solution.
This will not remove any project files from hard disk.
Add folder
Add a (virtual) folder to the project. These folders are only
used to group similar files together.
Add existing item...
Add an existing item to project.
The proper folder for the file is automatically selected.
Properties
Edit project properties.
See Section 4.8 for more information.
4.2.4. Solution operations
Item
Description
Build Solution
Build all projects within a solution.
Rebuild Solution
Rebuild all projects within a solution.
Clean Solution
Clean all projects within a solution.
Add new project...
Add new project to solution.
See Section 4.6 for more information.
Add existing project...
Removes a project from solution.
This will not remove any project files from hard disk.
Properties
Edit solution properties.
See Section 4.9 for more information.
4.3. Editor
Integrated source code editor is a normal text file editor that supports the basic editing features
including C syntax highlighting and auto-indent.
Editor is also used to display code during the debugging phase.
Editor window is tabbed, i.e. each open source file has its own tab in the top of the editor window.
By clicking the tab, the particular source file will be shown. By clicking the close button (or
VSIDE User's Manual
Page 23
4. Development environment
pressing CTRL-W) on the right top corner of the editor, the current source file will be closed.
Basic editor commands are found in Edit menu:
Editor menu item
Keyboard
shortcut
Description
Undo
CTRL-Z
Undo previous edit command
Redo
CTRL-Y
Redo previous edit command
Cut
CTRL-X
Cut selected text
Copy
CTRL-C
Copy selected text
Paste
CTRL-V
Paste previously cut/copied text into cursor position
Go to line
CTRL-G
Go to source code line. New dialog will appear where the line
number is entered.
Find...
CTRL-F
Find text within the current source file. New dialog will appear
with more options.
Find next
F3
Repeat find operation.
Replace
CTRL-H
Like find, but find text will be replaced with another string.
Preferences
Modify program preferences. See section 4.10.
To find out the full path name to source file, hover the mouse cursor over a file tab (where the
filename is shown), and after one second a tool tip window will appear with the full pathname.
If any text files are modified outside the VSIDE editor, VSIDE will notify the user and ask if the
modified files should be loaded into the editor.
4.4. Building
The VSIDE build commands are described below.
Note that project build commands affect to active project. To select active project, right click on
project icon in Solution window, and select “Set as active project”.
4.4.1. Build commands
VSIDE User's Manual
Page 24
4. Development environment
Item
Icon
Keyboard
shortcut
Description
Build solution
F7
Builds all projects within the current solution.
Rebuild solution
CTRL-F7
Cleans and builds all projects within the current
solution.
Clean solution
Deletes all intermediate files used during
building for all the projects within the current
solution.
Build project
SHIFT-F7
Builds the active project.
Rebuild project
CTRL-SHIFT-F7
Cleans and builds the active project.
Clean project
Deletes all active project's intermediate files
used during building .
Stop build
Stops the current undergoing build process.
Configuration
manager
Opens configuration manager. See more below.
4.4.2. Configuration manager
Configuration manager is used for modifying solution and project configurations.
To create new configuration, select a previous configuration and press “Create copy”.
VSIDE User's Manual
Page 25
4. Development environment
To rename configuration, select the configuration and press “Rename”.
To remove configuration, use “Remove”. Note that there must be always at least one configuration
per solution/project.
4.5. Menus
The VSIDE menus are described below.
4.5.1. File menu
File menu item
Description
New->Project
Creates a new project. “New Project” dialog will open,
which contains more options for project creation.
New->File
Opens a new text file in editor.
New->Blank solution
Creates a new blank solution. “New Solution” dialog will
open, which contains more options for project creation. Any
currently open solutions are closed.
Open->Solution
Opens an existing solution from disk. Any currently open
solutions are closed.
Open->Source
Opens an existing text file from disk
Open->Executable into simulator
Simulate executables without projects/solution. See Section
5.3 for more.
VSIDE User's Manual
Page 26
4. Development environment
File menu item
Description
Close
Closes the currently active text file.
Close solution
Closes the currently open solution.
Save
Saves the currently active text file to disk. If the file has no
name yet, this command operates as “Save As”.
Save As
Saves the currently active text file to disk. Before operation,
file name and path query window will appear.
Save All
Saves all unsaved text files to disk.
Recent Files
List of recently used files. Selecting a file from the list will
load the file into editor.
Recent Solutions
List of recent used solutions. Selecting a solution from the
list will close any open current solution load the selected
solution.
Exit
Closes VSIDE.
4.5.2. Edit menu
See Section 4.3 for more information.
4.5.3. Project menu
Project menu item
Description
Add existing item...
Add an existing item to project. The proper folder for the file
is automatically selected.
New folder
Add a (virtual) folder to the project. These folders are only
used to group similar files together.
Generate makefile
Generates makefile named Makefile_<projectname> into the
project folder.
Properties
Edit project properties. See Section 4.8 for more
information.
4.5.4. Build menu
See Section 4.4 for more information.
4.5.5. Debug menu
See Section 5.1 for more information.
VSIDE User's Manual
Page 27
4. Development environment
4.5.6. Windows menu
Help menu item
Description
Close all documents
Closes all files in integrated editor.
View <dock window name>
Shows/hides <dock window>.
4.5.7. Help menu
Help menu item
Description
Show help
Opens an VSIDE help viewer.
About
Show VSIDE copyright and version information.
4.6. New project creation
New project creation is done through “New project” dialog.
Project name is specified in the “Name” field.
Project hard disk location is specified in the “Location” field. Press the “Browse” button to invoke
directory selection dialog.
If a solution is already open, there is an option to add the new project under the current solution or
VSIDE User's Manual
Page 28
4. Development environment
to close the current solution and create a new solution.
When creating a new solution, select “Create directory for solution” to place project directory under
a solution directory. The solution directory name determined in “New solution name” edit box.
Using this option makes sense when having several projects under the solution.
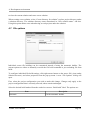
4.7. File options
Individual source file building can be customized instead of using the automatic builder. The
custom options are either to manually override the file build command or just excluding file from
build.
To configure individual file build settings, click right mouse button on the source file's icon (under
Solution browser), and select properties from the pop-up menu. A new “File Options” dialog will
open.
First, select the project configuration you wish to make this change. Changes only apply to the
project configuration that is currently selected, others remain unchanged.
Select the desired build method from the combo box next to “Build with” label. The options are:
Item
Automatic
VSIDE User's Manual
Description
Use the automatic builder
Page 29
4. Development environment
Item
Description
Custom build
Custom build commands must be entered to the
“Custom build command(s)” edit box. The
commands are executed in the current shell as
they're written here. Use Carriage Return (CR)
to separates several commands from each other.
E.g.:
echo “Building test.c...”<CR>
vcc -c test.c
None (exclude from build)
The file will not be processed in any way.
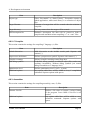
4.8. Project options
On the top of the dialog, configuration under modification is being shown.
It is possible to override all these settings for individual files by using file custom configurations.
Any directory name can be either absolute or relative to project's path.
4.8.1. General
This section contains the general project settings.
VSIDE User's Manual
Page 30
4. Development environment
Item
Description
Project type
Either “Executable” or “Static Library”. Executable contains a
linked application, while static library is a collection of object
files.
Target filename
Filename of a target that will be created when the solution is
compiled.
Target directory
Directory name where the target will be created.
HW Description file
Hardware description file that will be passed to both C
compiler and assembler when compiling “.c” or “.asm” files.
4.8.2. C Compiler
This section contains the settings for compiling C language (.c) files.
Item
Description
Include directories
Adds directories to the include search path. Separate with
comma (',').
Preprocessor definitions
Defines a preprocessor symbol. Separate with comma (',').
Compiler warnings
Add any compiler warning control flags here.
Add debug symbols
If checked, debug symbols are added to object files (and to any
resulting executables). Without debug symbols you cannot
debug executables at C language level.
Optimization level
Defines optimization level: 0 (off) .. 6 (max)
Additional options
Any options added here will be added to every C compilation
command. Separate options with spaces.
4.8.3. Assembler
This section contains the settings for compiling assembly (.asm, .S) files.
Item
Description
Generate List file
Defines a file where to output a verbose listing
of the program. Leave blank if list file is not
needed.
Additional options
Any options added here will be added to every
assembler command. Separate options with
spaces.
VSIDE User's Manual
Page 31
4. Development environment
4.8.4. Linker
This section contains the settings for linking object files. These settings are valid only if project
type is “Executable”.
Item
Description
Library directories
Adds directories to the library search path.
Separate with comma (',').
Libraries
Libraries to be linked with the executable.
Separate with comma (',').
Startup module
Startup module object filename to be linked with
executable.
Mem Description file
Memory description file to be used during
linking.
Linker command file
A linker command file can be used to map and
force sections into specific memory areas as
found in mem_desc. Use this parameter to
override the default command file.
Incremental linking
Enable incremental linking. See VSLINK
documentation for more information.
Keep relocations
Prevents relocations to be deleted. See VSLINK
documentation for more information.
Strip symbols
Discards any symbol information from objects.
Additional options
Any options added here will be added to every
linker command. Separate options with spaces.
4.8.5. Debugging
These settings are valid only if project type is “Executable”.
Item
Mem Description file
VSIDE User's Manual
Description
Memory description file to be used when
debugging a system. This may differ from one
used during linking.
Page 32
4. Development environment
4.8.6. Tools
This sections defines which executables will be used for C compiler, assembler, linker and archiver
when building a project.
Item
Description
C Compiler EXE:
Executable for C compiler. Default is “vcc”.
Assembler EXE:
Executable for assembler. Default is “vsa”.
Linker EXE:
Executable for linker. Default is “vslink”.
Archiver EXE:
Executable for archiver. Default is “vsar”.
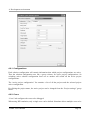
4.9. Solution options
Solution options are divided into three tabs;
“Configurations” - for associating active project configurations with solution
“Cores” - for configuring debugged cores
“Debugging”- for configuring debugging mode
On the top of the dialog, configuration under modification is being shown.
Solution options are automatically saved when they are modified.
Any directory name can be either absolute or relative.
VSIDE User's Manual
Page 33
4. Development environment
4.9.1. Configurations
Each solution configuration will contain information that which project configurations are active.
Thus the solution configuration acts like a group selector for active project configurations. So
switching active solution configuration from one to another will switch all the active project
configurations.
The “active project configuration” list contains a list of all the projects and the selected project
active configuration.
By clicking the project name, the active project can be changed from the “Project settings” group
below.
4.9.2. Cores
“Cores” tab configures the cores to be debugged.
When using HW emulation, only a single core can be defined. Simulator allows multiple cores to be
VSIDE User's Manual
Page 34
4. Development environment
simulated, e.g. single core running Executable #1 and five others running Executable #2. When
clocking the system all the cores receive the clock cycle.
Creating a multicore simulation is simple; just add new cores to the “Cores to be debugged” list by
using “Add new...” or “Create Copy”. To remove core from simulation, select the core from the list
and click “Remove”.
To modify core properties, just click it's name once, and edit the properties in “Core settings”
group.
Item
Description
Enabled
Enables or disables core. Disabled cores do not
affect debugging process.
Core name
Name of the core. Used only for GUI purposes.
Use settings from project
If not “<custom>”, core target executable and
mem_desc information will be read from
selected project's settings.
If set to “<custom>”, the next two items will be
available.
Executable file
Core executable file.
Mem description file
Core mem description file.
4.9.3. Debugging
In the “Debugging” tab, the solution debugging target is defined. There are two options; simulation
(default) and hardware-based emulation.
In case simulation is being selected as the “Debug mode”, no further options are needed. For the
hardware emulation, the following details must be given:
Item
Description
Serial port
Name of the serial port which will be used for
communicating with the hardware.
Initial speed
Initial speed is the serial port speed that the
target communicates right after reset.
Target speed
Serial port speed that will be used to
communicate with the target (except for the
initialization phase which uses “Initial speed”
setting).
VSIDE User's Manual
Page 35
4. Development environment
Item
Description
Speed multiplier
If high-speed serial port is available, it possible
to use this value to get serial speeds over
115200bps.
Chip type
VSDSP chip type which is used in the target
board.
Clock speed
VSDSP clock speed which is used in the target
board.
Monitor file
HW emulator's monitor file to be loaded into the
target. Not applicable for VSDSP4.
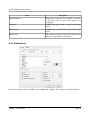
4.10. Preferences
Preferences dialog contains VSIDE's user-configurable settings. The settings are described below.
VSIDE User's Manual
Page 36
4. Development environment
4.10.1. General
Item
Beep when debugging pauses
Description
Option whether a beep sound should be heard
each time when debugging pauses, e.g. after
each single step-into operation.
Windows only.
Show labels in dock windows
Option whether a name label should be shown in
dock window.
4.10.2. Editor
The settings under “Editor” tab affect on integrated editor's layout and functionality.
Item
Description
Font Settings / Family
Font family to be used.
Font Settings / Size
Font height in pixels.
VSIDE User's Manual
Page 37
4. Development environment
Item
Description
Element
C language element to be modified. On the right,
available settings for the element are font color
and underlining.
Options / Word Wrap
Option whether the editor wraps long lines to the
next line.
Options / Completion
Not yet supported
Options / Parenthesis Matching
Option whether the editor highlights the data
between matching parenthesis.
Indentation / Tab Size
Number of empty characters the tab character
consists of.
Indentation / Indent Size
Number of empty characters each indent
consists of.
Indentation / Keep tabs
Option whether the editor should replace tab
characters with spaces.
Indentation / Auto Indent
Option whether auto-indent is enabled.
VSIDE User's Manual
Page 38
5. Debugging
5. Debugging
This chapter describes how debugging works in VSIDE. This information applies to both software
simulation and hardware emulation.
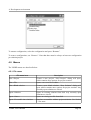
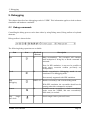
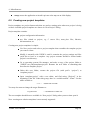
5.1. Debug commands
Controlling the debug process can be done either by using Debug menu, Debug toolbar or keyboard
shortcuts.
Debug toolbar is shown below.
Illustration 1: Debug toolbar
The following debug operations are available:
Item
Icon
Run
Keyboard
shortcut
F5
Description
Runs executable(s). The execution will continue
until breakpoint is being hit, or Break command is
activated.
Note: In HW emulation, it may not be possible to
break target execution without previously set
breakpoint(s).
Break
F6
Breaks execution(s). Debugging mode is not
terminated. The debugging mode.
Not currently supported with HW emulation.
Stop
debugging
SHIFT-F5
Breaks execution(s) and exits the debug mode.
With HW emulation, the executable should not be
running when this command is activated.
Restart
F4
Unloads current executable(s), reloads executable(s)
again, resets the VSDSP, and runs executable(s)
until main() is reached.
Step
single
core clock
F8
Send a single clock cycle to all cores.
VSIDE User's Manual
Page 39
5. Debugging
Item
Icon
Keyboard
shortcut
Description
C-level
into
step
F11
Continues execution until the execution reaches the
next C line, or execution moves into another
function.
C-level
over
step
F10
Continues execution until the execution reaches the
next C line.
Currently not supported in SW simulation.
C-level
out
step
SHIFT-F11 Continues execution until the current function exits.
Currently not supported in SW simulation.
Profiling
toggling
-
Start / stop profiling.
For information on profiling output file, see more
information from VS DSP Software Tools User’s
Manual, section 9.6.
Not supported in HW emulation.
Code
mode
display
-
Located in Debug toolbar.
Toggles display between C and disassembly view
modes:
“Show Disassembly” will always show the current
execution position by activating the disassembly
window.
“Show C source” will always show the current
execution position by opening any active C source
files. In case no C source file is found to display
current position, disassembly view is used instead.
Core
selector
view
-
Located in Debug toolbar.
Selects which core is being displayed. This affects
to all debug windows.
Available in multi-core simulations only.
Refresh
VSIDE User's Manual
F2
Refresh all windows. Use this to refresh in
simulation mode to get up-to-date simulation status.
Page 40
5. Debugging
5.2. Debug windows
This section describes the debugging windows. These dock windows can be shown and hid
individually by using Windows menu.
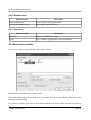
5.2.1. RTOS window
RTOS window lists all the current RTOS tasks.
Displayed task information can be seen in the picture below:
To see the code position of the current task in editor/disassembly window, double-click the task
name.
5.2.2. Watch window
Watch window contains an user-defined list of variables to be viewed.
To enter new value to be viewed, click on “<add new...>” and type variable name, e.g. “a” or
“hexTable[10]”. The variable is then added to the list, with it's current value shown on the right.
If variable cannot be evaluated at the current execution address, all the variable parameters will be
set to '?'.
VSIDE User's Manual
Page 41
5. Debugging
To delete variable from the watch list, select the variable by clicking it and click “Remove”.
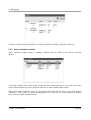
5.2.3. Active variables window
Active variables window shows C language variables that are visible at the current execution
address.
To modify variable value, click on the variable's Value column and type a new value. New value
can be either decimal, hex value (prefixed with '0x') or other variable name/symbol.
When using HW emulation, arrays are not downloaded. Instead, the array value fields display
“<hidden>”. This is done to speed up debugging over serial port. Use Watch window to inspect
array contents in HW emulation mode.
VSIDE User's Manual
Page 42
5. Debugging
5.2.4. Peripheral window
Peripherals are only supported together with SW simulator. Peripherals are used to provide systemlevel simulations.
Peripheral window displays peripheral status. Each peripheral instance that supports Peripheral GUI
API is shown here. If a peripheral doesn't use Peripheral GUI API, no tab page is shown.
Each peripheral defines its own custom GUI. Some of the items may be editable, depending on the
peripheral.
To use peripherals with simulation, add the required peripherals to project's mem_desc files under
PERIPHERAL section. Configured peripheral plugins must be located in VSIDE/plugins directory.
In multi-core simulations, each core will have its own peripheral instance.
See more information on peripherals from Peripheral GUI API.
5.2.5. Log window
Log window shows build and debug messages.
VSIDE User's Manual
Page 43
5. Debugging
5.2.6. STDIN/STDOUT window
STDIN/STDOUT window displays VSDSP core STDOUT output, as well as sends key-presses to
STDIN stream.
If the STDOUT data grows too large, the window will cut the oldest data from the beginning.
5.2.7. Breakpoint window
Breakpoint window displays the currently set breakpoints.
Breakpoints are used to stop program execution at requested (program memory) positions. When
the program execution reaches the breakpoint address, the execution will be break.
Breakpoints can be added under disassembly window (during debugging only), or directly at C
source lines (regardless whether debugging is active or not). C source line breakpoints are
automatically inspected by the IDE and a breakpoint will be added to the corresponding program
memory address.
VSIDE User's Manual
Page 44
5. Debugging
To remove breakpoint, select the breakpoint by clicking on its name, and then press “Remove” (or
press DEL key).
Breakpoints can be either active or inactive. Inactive breakpoints have no effect on program
execution. To make a breakpoint inactive, click the red dot in the breakpoint window. The red dot
will turn gray. To reactivate it, click the gray dot, and it will change red again.
VSIDE also supports conditional breakpoints. You can enter C level conditionals by clicking the
breakpoint's “Condition” field and entering the condition, e.g. “z!=0”. In case the condition was
incorrect, VSIDE will show an error when the code reaches the breakpoint for the first time.
5.2.8. Command console window
Command console is the interface to use the traditional command console. Simulator and HW
emulator both have a bit different console commands.
VSIDE User's Manual
Page 45
5. Debugging
To use command console, enter the commands into the edit box on the bottom of the command
console window. You can use command history by using keyboard CURSOR-UP and CURSORDOWN keys.
For a list of command console commands, consult the VSSIM chapter from VS_DSP Software
Tools User’s Manual.
5.2.9. Memory window
Memory window will display memory contents in hex and ASCII format.
Displayed memory type (X/Y/I) can be changed by using combo box on the top of the memory
window.
There are several ways to change the displayed memory address. Address or variable name can be
entered into “Goto addr:” edit box. It is possible to use hex or decimal format, or symbol names
(e.g. “main”).
To freely browse memory, use keyboard cursor keys and PAGE UP and PAGE DOWN or mouse
wheel.
To modify memory contents, just move the “memory cursor” (underlined and bolded value) to the
required address and type new hex values using the keyboard.
5.2.10. Register window
Register window displays the current VSDSP core register values.
The register window can display register values in hex, decimal and binary formats. Use buttons
“H”, “D” and “B” to toggle between these.
VSIDE User's Manual
Page 46
5. Debugging
To modify register values, click left mouse button on value once, and enter the new value.
5.2.11. Disassembly window
When debugging mode is activated, a disassembly tab will appear in the integrated editor. It will
also close automatically when debugging is stopped.
The code position can be changed by scrolling the window, PAGE UP and PAGE DOWN, cursor
keys or using the mouse wheel. To jump directly into certain address, enter either program memory
(I-page) address or function name to “View addr/function” edit box.
VSIDE User's Manual
Page 47
5. Debugging
To debug code in disassembly view, select “Show disassembly” from debug toolbar. If the “Show C
source” is selected, disassembly view is only shown when C source code is not available.
You can toggle breakpoints by clicking left mouse button in the area next to the disassembly code
(see picture above).
5.3. Simulating executables directly
It is possible to simulate executables directly without using any solution or project.
Hardware emulation is not supported with this method.
To simulate executables, open File menu and select “Open..” and then “Executable into simulator”.
Then select the appropriate executable file (typically .coff file) and required mem_desc file. The
simulator will now open.
VSIDE User's Manual
Page 48
6. Miscellaneous
6. Miscellaneous
6.1. Command line options
VSIDE supports some command line options.
For all operating systems, it is possible to auto-open solution file by giving the solution filename as
an command line argument.
Other files given as parameters will be opened in the editor.
All VSIDE versions also support style parameter:
-style style, changes the GUI style. Style is one of:
* “WindowsXP” - available in Windows XP only. Also, “Windows and buttons” setting
must be set to “Windows XP style”, located in Windows XP display settings (under tab
“Appearance”).
* “Windows” - Windows Classic style.
* “Motif”
* “MotifPlus”
* “CDE”
* “Platinum”
* “SGI”
The X11 version of VSIDE also supports some traditional X11 command line options:
-geometry geometry, sets the client geometry
-fn or -font font, defines the application font. The font should be specified using an X
logical font description.
-bg or -background color, sets the default background color and an application palette
(light and dark shades are calculated).
-fg or -foreground color, sets the default foreground color.
-btn or -button color, sets the default button color.
-name name, sets the application name.
-title title, sets the application title (caption).
-visual TrueColor, forces the application to use a TrueColor visual on an 8-bit display.
VSIDE User's Manual
Page 49
6. Miscellaneous
-cmap, causes the application to install a private color map on an 8-bit display.
6.2. Creating new project templates
Project templates are project frameworks that are used as starting point when new project is being
created. Available project templates are shown in “New Project” dialog.
Project template contains:
project configuration information
any files related to project, e.g. C source files, mem_desc files, libraries,
documentation, etc.
Creating new project templates is simple:
Use New project and select a project template that resembles the template project
you want to create.
Modify it normally with VSIDE it until it contains the project settings and files
you'd like to have as a template. Any project contents should be located under
project's own directory.
Go to operating systems file manager, and make a copy of the project folder to
(VSIDE root path)/templates/project/. Rename the new folder to something that
describes the template project.
Under this new folder, rename the project file (with prefix “.project”) to
“template.project”.
Open “template.project” with a text editor, and find string “[Project]” in the
beginning of the file. Under this group, there is a variable named “ Name”. Set the
name variable to:
Name = “$$$PROJECTNAME”
You may also want to change the target filename to :
TargetFilename
= ""$$$PROJECTNAME.coff"
The new template should be now available in “New project” dialog when you next time open it!
Note: creating new solution templates is not currently supported.
VSIDE User's Manual
Page 50
6. Miscellaneous
6.3. mem_desc file format
The default name for the memory description file is mem_desc, but any name can be used,
provided that the name is given with the -m option on the command line. If the memory description
file is not found in the current working directory, it is searched for in the directory pointed by the
VSDSP_DIR environmental variable.
The memory description file consists of several parts that define different things: the MEMORY
section defines the general memory layout and memory types, the MIRROR section defines
possible incompletely decoded memory areas or deliberate memory area mappings, the CORE
section defines clock frequency and boot address, the PERIPHERAL section defines peripheral
register mapping, and individual peripheral instantiations configure the peripherals themselves.
6.3.1. MEMORY Section
MEMORY {
page 0:
int_iram:
int_irom:
ext_imem:
ext2_imem:
page 1:
int_xmem:
ext_xmem1:
ext_xmem2:
far_xmem:
origin
origin
origin
origin
=
=
=
=
0000h, length = 1000h
4000h, length = 800h, option = "ROM"
8000h, length = 8000h, ws = 2
10000h, length = 10000h, ws = 2
origin
origin
origin
origin
=
=
=
=
0000h, length = 800h
4000h, length = 4000h, ws = 2
8000h, length = 8000h, ws = 2
10000h, length = 10000h, option = "MIRROR"
adc_mem:
origin = 80000000h, length = 32, option = "MIRROR", ws = 7
page 2:
int_ymem: origin = 0000h, length = 800h
int_perip: origin = 4000h, length = 400h, option = "OLDPERIPHERAL"
host_mem: origin = 4400h, length = 400h
ext_ymem: origin = 8000h, length = 8000h, option = "MIRROR"
stdio: origin = 0x7000, length = 2, option = "vsstdio"
page 3:
}
Each memory entry in the memory configuration file consists of four fields. The first one, page,
defines the memory page for that entry. The page definition can be omitted when the page does
not change. The second field defines a logical name for the entry, e.g. int_xmem. The third field,
origin, sets the starting address, and the fourth field, length, defines the length of the memory
block. Start addresses and lengths do not currently have restrictions except that they may not
overlap.
An optional field, option, may be used to define special functions for memory entries, and ws
defines waitstates and internal/external access status. If there is no ws setting, the memory area is
considered internal.
VSIDE User's Manual
Page 51
6. Miscellaneous
Currently the following special options are available.
ROM
ROM flags a memory area as read-only.
quit
quit defines an end-address for program execution. If instructions are fetched from memory
address that has this option, the simulation is stopped with success return value. This option is
only available in page 0 (the instruction memory space).
> and <
An option starting with < defines an input file, and option starting with > defines an output
file. These options are only available in pages 1, 2, and 3. Pages 1 and 2 are data memories X
and Y, respectively. Page 3 refers to both of them, meaning that page 3 can be accessed from
both X- and Y-bus.
vsstdio
vsstdio is a special module that provides C stdio support. It must be defined into the right
location for the libc16 and libc32 libraries. The normal location is Y memory (page 1) at
0x7000.
MIRROR
MIRROR defines an area as a window to somewhere else. What is seen in the memory area is
defined in the MIRROR section.
PERIPHERAL
PERIPHERAL defines an area as a peripheral bus bridge access point. Writes are pipelined,
reads cause one waitstate. The actual peripheral register mapping is defined in the
PERIPHERAL section.
OLDPERIPHERAL
OLDPERIPHERAL defines an area as a peripheral bus bridge access point. Writes are
pipelined, reads do not cause waitstates. The actual peripheral register mapping is defined in
the PERIPHERAL section.
VSIDE User's Manual
Page 52
6. Miscellaneous
6.3.2. MIRROR Section
MIRROR {
int_yimem = LH:int_imem
}
The mirror section defines memory mirroring. In this example the internal instruction memory can
be accessed through the Y memory, in the LOW-HIGH order (the lower half of the 32-bit
instruction word in lower address, the higher half in higher address). The different mapping types
are:
I map instruction memory to instruction memory
D map data memory to data memory
L map lower half of instruction word to data memory
H map upper half of instruction word to data memory
LH map lower and upper halves alternately
SLH split memory area in two, low first, high then
If R is added, the mapping of addresses is reversed.
MIRROR {
int_yimem = LH:int_imem, D:int_ymem
}
It is also possible to specify multiple mappings for one mirror area. In that case a register named
MEM_CTRL.mirrorname is created and can be mapped into peripheral address space. This register
is then used to select one of the mappings. The size of the register depends on the number of
alternative mappings.
MIRROR {
far_xmem = LH:ext_imem
ext_ymem = D:ext_xmem2
adc_mem = NCO.data
}
This last example shows how memory blocks that are inside peripherals can be mapped to the
memory space using the mirror section.
6.3.3. CORE Section
CORE {
frequency = 48.0MHz
bootaddr = 0x4000
}
The core section sets some parameters for the core. By setting a clock frequency (or cycletime) the
simulation can show and understand 'mealtime'.
VSIDE User's Manual
Page 53
6. Miscellaneous
6.3.4. PERIPHERAL Section
PERIPHERAL {
Y:0x4000
Y:0x4002
Y:0x4004
Y:0x4006
Y:0x4007
Y:0x4008
Y:0x4009
=
=
=
=
=
=
=
15-0:INTERRUPT.enablel0
15-0:INTERRUPT.enableh0
15-0:INTERRUPT.origin0
15-5:0,4-0:INTERRUPT.vector
15-3:0,2-0:INTERRUPT.encount
15-0:INTERRUPT.glob_dis
15-0:INTERRUPT.glob_en
Y:0x4020
Y:0x4021
Y:0x4022
Y:0x4023
Y:0x4024
Y:0x4025
Y:0x4026
Y:0x4027
Y:0x4028
Y:0x4029
Y:0x402a
=
=
=
=
=
=
=
=
=
=
=
15-0:IO.ddr
15-0:IO.odata
15-0:IO.idata
15-0:IO.int_fall
15-0:IO.int_rise
15-0:IO.int_pend
15-0:IO.set_mask
15-0:IO.clear_mask
15-0:IO.bit_conf
15-0:IO.bit_eng0
15-0:IO.bit_eng1
y:0x4040
y:0x4041
y:0x4042
y:0x4043
y:0x4060
y:0x4061
y:0x4062
y:0x4063
=
=
=
=
=
=
=
=
3-0:UART0.ssr
7-0:UART0.data
15-8:UART0.data
15-8:UART0.div0,7-0:UART0.div1
3-0:UART1.ssr
7-0:UART1.data
15-8:UART1.data
15-8:UART1.div0,7-0:UART1.div1
y:0x40a0 = 15-0:WDOG.config
y:0x40a1 = 15-0:WDOG.reset
y:0x40a2 = 15-0:WDOG.dummy
}
The peripheral section defines the mapping of peripheral registers into memory. The memory area
must have been already been set aside in the memory section by using the option PERIPHERAL
(asynchronous peripheral bus, 1 waitstate in read, pipelined write) or OLDPERIPHERAL
(synchronous peripheral bus, no waitstates).
The peripherals must be instantiated with the same names that are used in the PERIPHERAL
section. The peripheral model documentation (see chapter 6) tells which registers are available for
each peripheral type.
6.3.5. INTERRUPT Section
INTERRUPT {
type = vsdsp4
interrupts = 16
}
The interrupt section configures the interrupt block. Depending on the interrupt handler type,
different registers are available.
VSIDE User's Manual
Page 54
6. Miscellaneous
6.3.6. Peripheral Instantiation
All other peripherals are configured and instantiated similarly than the interrupt handler. A unique
name is defined as a block name, and the type setting defines the actual peripheral which is created.
IO {
#
type = "stdio"
infile = "gpioin.dat"
outfile = "gpioout.dat"
bits = 16
intnum = 0
verbose = 1
}
This example instantiation creates a peripheral named IO, which is the standard VSDSP4
interruptable GPIO block and gives it some parameters. Lines that start with a hash-mark are
comments.
6.4. hw_desc file format
The hardware description file defines the target VS_DSP architecture. This file is read by both the
assembler and simulator. Architecture restrictions must be obeyed.
Below is an example of hw_desc with variable explanations:
dataword
dataaddress
programword
programaddress
multiplierwidth
guardbits
indexregs
aluregs
modifieronly
16
16
32
16
16
8
8
8
0
loopregs
addressmode
modemask
// Datapath size
// Address size (<= dataword)
// Instruction size (only 32 now)
// Program address size (<= dataword)
// Multiplier input width (not used)
// guard bits for accumulators
// Number of address/modifier registers
// Number of ALU registers
// 0=interchang. - I0(M1)<>I1(M0) etc.
// 1=odd mod-only I0->I1(M0) I2->I3(M2)
// 2=separate modif. regs I0->M0 I1->M1
1 // loop hardware available
3 // modulo and bitreverse available
0x077f
version
4 // 0 for version 1, 2 for v2
6.5. Included peripherals
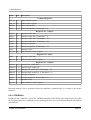
6.5.1. INTERRUPT
This peripheral is integrated into VSIDE executable; it has no .periph file in the plugins directory.
The type of the interrupt handler is selected in the INTERRUPT section with the parameter type
from one of "vsdsp2", "mp3", or "vsdsp4". The number of interrupt sources is selectable with
interrupts.
VSIDE User's Manual
Page 55
6. Miscellaneous
Name
Size
Description
Common Registers
glob_dis 16
global disable register
glob_en 16
global enable register
strobe0
0..16 cause interrupt bits
strobe1
1..16 cause interrupt bits, if interrupts > 16
Registers for "vsdsp2"
enable0
enable1
enable2
enable3
origin0
origin1
vector
encount
16
16
16
16
16
16
5
16
interrupt enable bits
interrupt enable bits, if interrupts > 8
interrupt enable bits, if interrupts > 16
interrupt enable bits, if interrupts > 24
interrupt origin bits
interrupt origin bits, if interrupts > 16
interrupt vector
global disable counter register
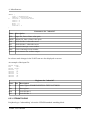
Registers for "mp3"
enable 16
encount 16
interrupt enable bits
global disable counter register
enablel0
enableh0
enablel1
enableh1
origin0
origin1
vector
encount
Registers for "vsdsp4"
interrupt low enable bits
interrupt high enable bits
interrupt low enable bits, if interrupts > 16
interrupt high enable bits, if interrupts > 16
interrupt origin bits
interrupt origin bits, if interrupts > 16
interrupt vector
global disable counter register
0..16
0..16
1..16
1..16
0..16
1..16
5
3
Interrupt requests can be generated from the simulator command line by writing to the strobe
registers.
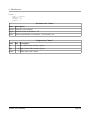
6.5.2. STDSERIAL
Peripheral type "stdserial" selects the VSDSP4 standard UART block. The model does not model
the reception in bit-level, although you get warnings if bytes are received faster than the selected bit
speed allows.
VSIDE User's Manual
Page 56
6. Miscellaneous
UART0 {
type = "stdserial"
infile = "uart0in.dat"
#
outfile = "uart0out.dat"
txint = 2
rxint = 1
div0 = 0
div1 = 0
verbose = 1
}
Parameters for "stdserial"
Name
Description
infile
input file, lines of time-value pairs
outfile output file, lines of time-value pairs
div0
clock divider 0 value after reset
div1
clock divider 1 value after reset
txint
transmit interrupt vector number
rxint
receive interrupt vector number
verbose set to nonzero for verbose output
In verbose mode changes in the UART state are also displayed on-screen.
An example of the input file:
#time value
199
0x10
#time 'char'
1800us '_'
2000us 'D'
2200us ' '
2400us 'Y'
2600us '4'
2800us '0'
Registers for "stdserial"
Name Size
ssr
4
data
8
div0
8
div1
8
Description
status register RXORUN:RXFULL:TXFULL:TXRUN
data register
clock divider 0
clock divider 1
6.5.3. STDWATCHDOG
Peripheral type "stdwatchdog" selects the VSDSP4 standard watchdog block.
VSIDE User's Manual
Page 57
6. Miscellaneous
WDOG {
type = "stdwatchdog"
clearval = 0x4ea9
}
Parameters for "stdwatchdog"
Name
Description
clearval the pattern to use to reset the counter
Registers for "stdwatchdog"
Name Size
config 16
reset
16
dumm
16
y
Description
clock divider / protection register
counter reset register
protection register
6.5.4. STDIO
Peripheral type "stdio" selects the VSDSP4 standard interruptable I/O block.
IO {
#
type = "stdio"
infile = "gpioin.dat"
outfile = "gpioout.dat"
bits = 16
intnum = 0
verbose = 1
}
Parameters for "stdio"
Name
Description
infile
input file, lines time-bit.state pairs
outfile output file
bits
the number of I/O bits 1..16
intnum interrupt vector number
verbose selects verbose output
In verbose mode changes in the IO state are also displayed on-screen.
An example of the input file:
#time bit=state
100
7=1
1s
7=0
VSIDE User's Manual
Page 58
6. Miscellaneous
Registers for "stdio"
Name
Size Description
ddr
odata
bits
bits
data direction register, 0 = input
output data register
idata
bits
pin state register
int_fall
bits
falling edge interrupt enable
int_rise
bits
rising edge interrupt enable
int_pend
set_mask
clear_mask
bit_conf
bit_eng0
bit_eng1
bits
bits
bits
16
16
16
pending interrupts
1-bits get set in odata
1-bits get cleared in odata
bit-engine 0 and 1 configuration register
bit-engine 0
bit-engine 1
6.5.5. FILEIN
Peripheral type "filein" selects raw input from file.
FILEIN {
type = "filein"
name = "file.bin"
bit = 8
feof = 0
}
Parameters for "filein"
Name
Description
name
bits
feof
Filename for input file
Byte or word reads from file: values 8 and 16 supported
If nonzero, end of file is checked and 0 returned on EOF
Registers for "filein"
Name Size Description
data
16
data register
6.5.6. TIMER
Peripheral type “timer” selects the timer block. Note: this is not the VSDSP4 standard timer block
(stdtimer).
VSIDE User's Manual
Page 59
6. Miscellaneous
TIMER0 {
type =
intnum
length
prediv
}
"timer"
= 6
= 32
= 0
Parameters for "timer"
Name
Description
intnum interrupt vector number
length
prediv
number of bits in the timer 1..32
Selects a predivider: 0=coreclock, 1=coreclock/2, etc.
Registers for "timer"
Name Size
low
16
high
16
enable
1
Description
low 16 bits of the counter register
high 16 bits of the counter register
enable bit for the counter
VSIDE User's Manual
Page 60