1
Performance Troubleshooting Guide for
®
®
Microsoft Business Solutions–Navision
PERFORMANCE TROUBLESHOOTING GUIDE FOR
MICROSOFT® BUSINESS SOLUTIONS–NAVISION®
DISCLAIMER
This material is for informational purposes only. Microsoft Business Solutions ApS
disclaims all warranties and conditions with regard to use of the material for other
purposes. Microsoft Business Solutions ApS shall not, at any time, be liable for any
special, direct, indirect or consequential damages, whether in an action of contract,
negligence or other action arising out of or in connection with the use or performance
of the material. Nothing herein should be construed as constituting any kind of
warranty.
The example companies, organizations, products, domain names, email addresses,
logos, people and events depicted herein are fictitious. No association with any real
company, organization, product, domain name, e-mail address, logo, person, or event
is intended or should be inferred. The names of actual companies and products
mentioned herein may be the trademarks of their respective owners.
COPYRIGHT NOTICE
Copyright © 2004 Microsoft Business Solutions ApS, Denmark. All rights reserved.
TRADEMARK NOTICE
Microsoft, Great Plains, Navision, FRx, AssistButton, C/AL, C/FRONT, C/ODBC,
C/SIDE, FlowField, FlowFilter, Navision Application Server, Navision Database
Server, Navision Debugger, Navision Financials, Microsoft Business
Solutions–Navision, SIFT, SIFTWARE, SQL Server, SumIndex, SumIndexField,
Windows, Windows 2000, Windows 2000 Server, Windows XP are either registered
trademarks or trademarks of Microsoft Corporation or Great Plains Software, Inc., FRx
Software Corporation, or Microsoft Business Solutions ApS or their affiliates in the
United States and/or other countries. Great Plains Software, Inc., FRx Software
Corporation, and Microsoft Business Solutions ApS are subsidiaries of Microsoft
Corporation.
DocID: NA-400-DVG-007-v02.00-W1W1
PREFACE
This document is designed to be used as a stand-alone reference book or as part of a
training course.
When this document is used as part of a training course, it should be supplied with its
companion book of exercises as well as the fob files that contain the tools and the fob
files that are used in the exercises.
TABLE OF CONTENTS
Chapter 1
Performance Problems – An Introduction. . . . . . . . . . . . . 1
Introduction . . . . . . . . . . . . . . . . . . . . . . . . . . . . . . . . . . . . . . . . . . . . . . . . . 2
The Test Environment . . . . . . . . . . . . . . . . . . . . . . . . . . . . . . . . . . . . . . . . . 3
Client Performance Indicators . . . . . . . . . . . . . . . . . . . . . . . . . . . . . . . . . . . 5
Common Performance Problems . . . . . . . . . . . . . . . . . . . . . . . . . . . . . . . . 6
Chapter 2
Identifying Performance Problems . . . . . . . . . . . . . . . . . . 9
Using the Session Monitor to Locate the Clients that Cause Performance
Problems on Navision Database Server . . . . . . . . . . . . . . . . . . . . . . . . . . 10
Using the Session Monitor to Locate the Clients that Cause Performance
Problems on SQL Server. . . . . . . . . . . . . . . . . . . . . . . . . . . . . . . . . . . . . . 11
Time Measurements . . . . . . . . . . . . . . . . . . . . . . . . . . . . . . . . . . . . . . . . . 15
The Client Monitor . . . . . . . . . . . . . . . . . . . . . . . . . . . . . . . . . . . . . . . . . . . 17
Locking . . . . . . . . . . . . . . . . . . . . . . . . . . . . . . . . . . . . . . . . . . . . . . . . . . . 25
Chapter 3
Other Issues . . . . . . . . . . . . . . . . . . . . . . . . . . . . . . . . . . . . 33
Hardware Setup. . . . . . . . . . . . . . . . . . . . . . . . . . . . . . . . . . . . . . . . . . . . . 34
SQL Server Error Log . . . . . . . . . . . . . . . . . . . . . . . . . . . . . . . . . . . . . . . . 37
Keys, Queries and Performance . . . . . . . . . . . . . . . . . . . . . . . . . . . . . . . . 39
Locking in Navision – A Comparison of Navision Database Server and SQL
Server . . . . . . . . . . . . . . . . . . . . . . . . . . . . . . . . . . . . . . . . . . . . . . . . . . . . 41
Configuration Parameters . . . . . . . . . . . . . . . . . . . . . . . . . . . . . . . . . . . . . 45
Appendix A
Object List . . . . . . . . . . . . . . . . . . . . . . . . . . . . . . . . . . . . 49
Performance Troubleshooting Object List . . . . . . . . . . . . . . . . . . . . . . . . . 50
Table of Contents
Chapter 1
Performance Problems – An
Introduction
This chapter introduces you to the basic elements that are
covered in this guide.
This chapter contains the following sections:
· Introduction
· The Test Environment
· Client Performance Indicators
· Common Performance Problems
Chapter 1. Performance Problems – An Introduction
1.1 INTRODUCTION
This material is designed to help you identify performance problems in a Microsoft
Business Solutions–Navision application. It describes how to troubleshoot on both
server options and describes and explains how to use the debugging tools that exist in
Navision to identify performance problems. It also describes how to use the
troubleshooting tools that come with this guide. Furthermore, it contains a brief
description of some of the Microsoft SQL Server tools that you can use.
This document describes some of the most common performance problems and the
reasons that can cause them. The topics covered include:
· The Client Monitor and the Code Coverage tool
· The new performance trouble shooting tools
· Hardware setup and performance
· Setting up the test environment
· Identifying the clients that cause performance problems
· Profiling a task with the Client Monitor
· Identifying the worst server calls and the keys and filters that cause them
· Identifying the tasks that cause deadlocks on Microsoft Business
Solutions–Navision Database Server
· Using the SQL Error Log to identify the clients involved in deadlocks on SQL Server
· How to identify locking problems
· How to set up locking order rules and check whether or not your application follows
these rules
· Identifying index problems on SQL Server
· How to identify bad C/AL NEXT statements on SQL Server
· How to use Excel pivot tables to get an overview of the data in the Client Monitor.
Performance problems can be caused by bottlenecks in the hardware setup or by
problems within Navision. Performance problems in Navision can be caused by, for
example, the way that keys are designed, by the way that keys are used together with
filters, or by the way that tables or records are locked.
This guide is mainly concerned with identifying performance problems that exist within
Navision, even though poor performance can be caused by inadequate or badly
configured hardware. For more information about hardware considerations, see the
section "Hardware Setup" on page 34.
Database Servers
The two database server options for Navision, Navision Database Server and SQL
Server, behave differently both with regard to performance and locking. However, the
methodology and the tools that you can use to identify these bottlenecks are almost
the same.
2
1.2 The Test Environment
1.2 THE TEST E NVIRONMENT
You will generally need to set up a separate test environment before you can start
troubleshooting and solving the performance problems that exist in a working
installation.
Setting up a test environment means:
1 Setting up a separate database server.
The test server should be set up on a separate computer and not on the computer
that is used by the production system. Using a separate test environment gives you
complete control over the system and over who has access to it. It also means that
the customer can continue to use the production system.
2 Copying the production system database to the test server.
If you are running on SQL Server, use the backup/restore functions in Enterprise
Manager to make a fast copy of the database to the test server. If you are running
on Navision Database Server, you can use the server-based backup program
HotCopy.
3 Warming up the server, to ensure that you get realistic measurements.
You must warm up the test server regardless of which server option you are using.
Warming Up SQL Server
If you have just turned SQL Server on or if you have just created the database or
company, you must warm up SQL Server by using the database and the company.
This ensures that the system resembles the actual customer installation and means
that you can generate realistic performance measurements.
You only need to run an initial test to warm up SQL Server. When SQL Server is
warmed up, the execution plans for most queries have already been generated and
are ready for use. Furthermore, the most frequently used data is now available in
memory.
When SQL Server is not warmed up, you will, for example, see that inserting,
modifying or deleting the first record in a table that contain keys that have
SumIndexFields associated with them can take up to several seconds to finish. This
would normally be done much faster in a working installation.
Warming Up Navision Database Server
If you have just started Navision or if you have just opened the database and company
in Navision, you must warm up Navision Database Server before you can generate
realistic performance measurements. Running an initial test will warm up Navision by
ensuring that all the objects you need are available on the client.
3
Chapter 1. Performance Problems – An Introduction
Debugging Tools
To ensure that you have the most recent version of the debugging tools, install the
newest version of the Navision client on the computers that you are going to use to
test the installation.
Note
. . . . . . . . . . . . . . . . . . . . . . . . . . . . . . . . . . . . . . . . .
The earlier version of Navision, Navision Financials does not have a Client Monitor for
the SQL Server Option. The Client Monitor is an essential element in the
troubleshooting procedures described in this training material.
If you develop corrections in Navision that you would like to implement in Navision
Financials, you can use the REMID feature from the Navision Upgrade Toolkit to
change the Navision objects before importing them into Navision Financials.
. . . . . . . . . . . . . . . . . . . . . . . . . . . . . . . . . . . . . . . . .
4
1.3 Client Performance Indicators
1.3 CLIENT P ERFORMANCE I NDICATORS
When you connect a client to Navision Database Server, you can see status
information about server calls that take two or more seconds in the status bar.
Typical server calls that generate status information are:
· Server calls that modify or delete sets of records.
· Server calls that scan an index or an entire table to find some data.
· Server calls that need to lock a record or a table can be forced to wait until other
transactions are committed and release the locks that they placed.
Therefore, you should keep an eye on the indicator in the status bar when you are
trying to identify problematic tasks because this information might be all you need to
break down a performance problem.
However, if you are using the Microsoft SQL Server Option for Microsoft Business
Solutions–Navision, the client’s user interface has no indicators to tell you how much
time is spent on long running tasks. You therefore need some other procedures to
break down a performance problem on SQL Server. However, when clients are
waiting for locks to be released by other clients, you can see this information by using
the session monitor as described in the section "Using the Session Monitor to Locate
the Clients that Cause Performance Problems on SQL Server" on page 11.
5
Chapter 1. Performance Problems – An Introduction
1.4 COMMON PERFORMANCE P ROBLEMS
Many things can cause poor performance but some of the most common causes are:
· The way that keys are defined combined with the way that they are used in filters or
queries when you want to read data.
· The way keys are defined with SumIndexFields combined with the way that
summing FlowFields are defined.
· The number of keys that are defined with SumIndexFields when running on SQL
Server.
The procedures described in this material will help you identify the places where these
problems occur.
If you are running on SQL Server, you must also be aware of a very specific
performance problem that applies to forms:
· Setting the SourceTablePlacement property to the default value (Saved) will often
make opening forms that display data from tables that contain many records
(1,000,000 or more), for example G/L entries, very slow. To fix this problem, set the
SourceTablePlacement property to First in these forms.
Performance and Locking
Performance problems that are related to specific tasks should always be tested in the
test environment, when no other users are logged on to the database server. This will
help you determine whether the performance problem is related to the task itself, or if
the problem only occurs when the task is executed in combination with other tasks on
the same server.
Performance problems that are caused by a specific task are described in the section
The Client Monitor on page 17. Performance problems that are caused by clients
spending time waiting for other clients to release locks on resources that the client in
question wants to place exclusive locks on are described in the section "Locking" on
page 25.
Deadlocks occur when concurrent transactions try to lock the same resources but
don’t lock them in the same order. This can either be solved by always using the same
locking order or by using a “locking semaphore” that will prevent these transactions
from running concurrently. You can find out which resources are causing deadlocks
by following the procedure described in the section "Locking" on page 25.
Hardware
When you are trying to identify any bottlenecks that exist in an installation you must
also check the hardware that the installation is running on. You should check the
hardware that is being used by both the server and the client computers. See the
section "Hardware Setup" on page 34.
6
1.4 Common Performance Problems
Getting Some Assistance
Depending on your expertise in the technical areas that are essential for
troubleshooting performance problems, you can choose to follow all the steps
described in this troubleshooting guide or you can stop at some point and give your
results to other experts.
For example, the data that you get by using the Client Monitor (as described in the
next chapter) can easily be transferred to other experts. They will then be able to
identify performance problems solely on the basis of this data, before looking at the
objects from the database and before having access to the data in the database.
7
Chapter 1. Performance Problems – An Introduction
8
Chapter 2
Identifying Performance Problems
This chapter explains how to identify performance problems
in Navision.
This chapter contains the following sections:
· Using the Session Monitor to Locate the Clients that
Cause Performance Problems on Navision Database
Server
· Using the Session Monitor to Locate the Clients that
Cause Performance Problems on SQL Server
· Time Measurements
· The Client Monitor
· Locking
Chapter 2. Identifying Performance Problems
2.1 USING THE S ESSION MONITOR TO LOCATE THE C LIENTS THAT C AUSE
PERFORMANCE P ROBLEMS ON N AVISION D ATABASE SERVER
You use the Session Monitor (Navision Database Server) to identify the clients that
cause performance problems on Navision Database Server.
You must import some helper objects before you can start to identify the clients that
are causing performance problems:
1 Import the Session Monitor (Navision Server).fob file. The objects imported
include form 150010, Session Monitor (Navision Srv).
2 Run form 150010, Session Monitor (Navision Srv).
The Session Monitor (Navision Server) window displays updated information from
the Session table. The information is refreshed every second by default, but you can
change this setting by clicking Monitor, Setup.
By default, the most active sessions in terms of the amount of records scanned are
shown at the top of the list. The Records Scanned field tells you how many records
the database server has scanned in order to find the records that this session wanted.
The sessions with the largest number of scanned records are the ones that should be
investigated first. Follow the guidelines in the other sections to investigate these
sessions.
Note
. . . . . . . . . . . . . . . . . . . . . . . . . . . . . . . . . . . . . . . . .
In the Session Monitor (Navision Server) window, if the value in the
Found/Scanned Ratio field is high, this indicates that the indexes and queries match.
A value of 30-50% is normal, while 3% is low.
. . . . . . . . . . . . . . . . . . . . . . . . . . . . . . . . . . . . . . . . .
10
2.2 Using the Session Monitor to Locate the Clients that Cause Performance Problems on SQL Server
2.2 USING THE S ESSION MONITOR TO LOCATE THE C LIENTS THAT C AUSE
PERFORMANCE P ROBLEMS ON SQL S ERVER
You use the Session Monitor (SQL Server) to locate the clients that cause
performance problems when you are using the SQL Server Option for Navision.
You must import some helper objects before you can start to identify the clients that
are causing performance problems:
1 Ensure that you have installed the client components for SQL Server from the
Microsoft SQL Server CD.
2 Open the Query Analyzer tool and click File, Open. Browse to the folder where you
have stored the session monitor tools and open the Session Monitor (SQL
Server).sql file.
3 Click Query, Change Database and select the Navision database that you want to
monitor.
4 Click Query, Execute. The Session Monitor (SQL Server).sql drops the
current Session (SQL) view and creates a new view to replace it.
5 In Navision, open the Object Designer and import the Session Monitor (SQL
Server).fob file.
6 Run form 150014, Session Monitor (SQL Server) window and click Monitor,
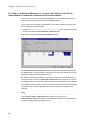
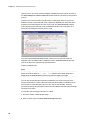
Setup and the Session Monitor Setup (SQL) window opens.
7 Click the Log tab:
8 Enter a check mark in the Log Session Activity check box. Specify a time interval
in the Log Interval (sec) field. If you are only interested in identifying any blocks
that occur, enter a check mark in the Log only Blocks check box.
You must enter a value in the Log Interval (sec) field, for example 15 seconds.
Navision will now log the current level of activity once every 15 seconds. When
Navision logs the activity, it runs through the active sessions and creates one entry
per session. These entries are logged to the Session Information History table.
11
Chapter 2. Identifying Performance Problems
If you select the Log only Blocks option, Navision only logs the sessions that are
involved in blocking. This includes the sessions that are blocked and the sessions
that are blocking others.
Finding the correct setting for the Log Interval (sec) option is a matter of achieving
the right balance between how accurately you want Navision to log activity, and
how large a performance overhead you are ready to accept. 15 seconds would
seem to give a reasonable balance.
The Session Monitor creates a log entry every time the specified interval has
elapsed and therefore any blocks that occur within the specified interval are not
logged. If you want to make sure, that the Session Monitor catches as many blocks
as possible, you can decrease the interval to, for example, 5 seconds or lower. To
simultaneously decrease the performace overhead, select the Log only Blocks
option so that only those sessions involved in a block are logged.
9 In the Session Monitor Setup (SQL) window, click Functions, Start Logging.
The Log Session Activity codeunit runs as a single instance codeunit. This means
that the only way to stop the codeunit is to close and re-open the company.
However, you can suspend it by removing the check mark from the Log Session
Activity option. The codeunit will still keep running in the background, but it will not
log anything. To resume logging, you must restart the session and start logging
again.
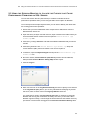
Viewing the Log
As mentioned earlier, the information gathered by the Session Monitor is inserted into
the Session Information History table. You use the Session Information History
window to view this data.
The Session Information History window shows you all the entries that have been
logged. You can analyze this information in Navision or export it to a .csv file and
analyze it in Excel.
To export the log to Excel:
1 Open the Object Designer and open the Session Information History window:
12
2.2 Using the Session Monitor to Locate the Clients that Cause Performance Problems on SQL Server
2 Click Functions, Export Log and specify a file name.
Remember to use the extension .csv, for example, Log.csv.
3 Double click the file, and it opens in Excel.
Excel has a limitation of 65,536 rows. If the log contains more entries that this, you
will not be able to open the file in Excel. You can get around this by applying a filter
and only exporting some of the entries. Alternatively, you can delete some of the
entries and then export the remainder. If you think that you are close to the limit of
65,536 records, click Functions, Count to find out how many entries are within the
current filter.
You can also view the information gathered by the Session Monitor in the Session
Monitor (SQL Server) window:
The Session Monitor (SQL Server) window displays updated information from a
view. This view is similar to the one that lies behind the Session table. The Session
Monitor (SQL Server) window tells you which clients are currently connected to the
server as well as the current load on the server. The information is refreshed every
second by default, but you can change this setting by clicking Monitor, Setup.
By default, the most active sessions in terms of physical I/O are listed at the top of the
Session Monitor (SQL Server) window. These are the sessions that should be
investigated first. You can also list the sessions according to their memory usage,
because this is also is a good indicator of activity. SQL Server can also give you
information about the CPU usage, but unfortunately this information is not very reliable
on SQL Server 2000.
To investigate these sessions, follow the guidelines described in the following
sections.
The Session Monitor (SQL Server) window also lists information about the clients
that are waiting for locks held by other clients to be released, as well as the identity of
the clients that placed the locks. If you want to concentrate on this area only, look at
and/or filter the fields starting with Blocked (Blocked, Blocked by Connection ID,
Blocked by User ID, Blocked by Host Name).
13
Chapter 2. Identifying Performance Problems
Deleting Entries
To delete entries from the Session Information History table:
1 Open the Object Designer and open the Session Information History window.
2 Click Functions, Delete Log Entries.
This deletes all the entries within the current filter. If you have not placed a filter, all the
entries are deleted.
14
2.3 Time Measurements
2.3 TIME MEASUREMENTS
When you are working with performance problems, it is recommended that you make
accurate measurements of the amount of time it takes to perform the tasks in
question.
You can monitor and measure the time a task takes by using a stopwatch or
preferably by using some helper objects.
The ActivityLog.fob file contains some objects that enable you to measure
precisely the time spent on a particular task. These measurements are stored in a
table enabling you to review the amount of time spent on the task at a later date.
To measure the time spent on a task:
1 Import the ActivityLog.fob file and compile the objects that are imported.
2 Use the objects in the same way as they are used in the codeunit contained in
Sample use of Activity Log.fob.
To see how this codeunit works:
1 Import the Sample use of Activity Log.fob file and open codeunit 150000,
Sample use of Activity Log in the editor to see how the Activity Log is used to
monitor the task in the codeunit.
2 Run codeunit 150000, Sample use of Activity Log. This creates a new line in the
Activity Log.
3 Run form 150000, Activity Log to open the Activity Log.
The Activity Log window contains the following information:
· The date and time at which the activity was started.
· The date and time at which the activity finished.
· The status of the activity.
· The total time in milliseconds that the activity took.
· The number of operations that the activity involved.
· The average time that each operation took.
15
Chapter 2. Identifying Performance Problems
· A check mark indicating which session was yours.
· The connection ID of the session that carried out the activity.
Details of the Activity
To see the changes, if any, that an activity made to the database, you must enable
this feature. Codeunit 150000, Sample use of Activity Log shows you how to enable
this feature.
After you have enabled the feature and carried out the activity that you are interested
in monitoring, select the activity and click Activity, Table Size Changes to see the
changes that were made to the database.
The Table Size Changes window appears:
This window contains information about the net amount of records that were entered
into or deleted from the tables in the database during the activity. Knowing the amount
of changes that an activity involves helps you understand the amount of time used by
a particular task.
16
2.4 The Client Monitor
2.4 THE CLIENT MONITOR
The Client Monitor is an important tool for troubleshooting performance and locking
problems. You can also use it to identify the worst server calls and to identify index
and filter problems in the SQL Server Option. The Client Monitor and the Code
Coverage tool now work closely together allowing you to easily identify, for example,
the code that generated a particular server call.
Using the Client Monitor to Profile a Task
The Client Monitor displays all the details of the server calls made by the current
client, including the time spent on each server call. This makes it an invaluable tool
when you want to analyze a particular task and study the server calls that the task
makes as well as the code that initiates the server calls.
To profile and analyze a given task in Navision using the Client Monitor, you must
have some Client Monitor helper objects:
1 Import the Client Monitor.fob file, including Form 150020, Client Monitor.
2 Compile all of the objects that are imported. This must be done because some of
the field definitions are different on the two database server options.
3 Click Tools, Debugger, Code Coverage to open the Code Coverage window. Start
the Code Coverage tool and then start the Client Monitor just before you are ready
to perform the task that you want to investigate.
4 Perform the task that you want to test.
5 When you have finished the task, stop the Client Monitor and then stop the Code
Coverage tool. The Client Monitor uses many lines to describe a single server call,
and this makes it difficult to use for data analysis.
6 Run form 150020 Client Monitor. This processes the data from the Client Monitor
and displays it in a new window.
The Client Monitor window displays and formats the data that has been gathered by
the Client Monitor so that it can be more easily analyzed. It carries out a kind of cross
tabulation of the operations and parameters and uses one line per server call.
Important
. . . . . . . . . . . . . . . . . . . . . . . . . . . . . . . . . . . . . . . . .
When you use these tools, make sure that your test tasks are focused on the area that
you are interested in testing. If you spend time doing other tasks, both the Client
Monitor and the Code Coverage tool will fill up with irrelevant information.
. . . . . . . . . . . . . . . . . . . . . . . . . . . . . . . . . . . . . . . . .
You can analyze the Client Monitor data within Navision, or you can perform a more
detailed analysis by importing the data into pivot tables in Excel.
If you are analyzing a lengthy task that takes an hour or more to run, you should
consider restricting the scope of the task. You can limit the task by applying filters that
17
Chapter 2. Identifying Performance Problems
will make the task handle less data, or by stopping the task after several minutes. You
can then use the Client Monitor data from the part of the task that was performed as
the basis for your analysis.
Here is an example of the kind of data that you can see in the Client Monitor (taken
from SQL Server):
The Client Monitor displays the database function calls that are made by the C/AL
code as follows:
18
Function call
in C/AL:
Function Name (+ Search Method) shown in the Client Monitor:
GET
FIND/NEXT(‘=’)
FIND(‘-‘)
FIND/NEXT(‘-’)
NEXT
FIND/NEXT(‘>’)
ISEMPTY
ISEMPTY (as long as no MARKEDONLY filter is used)
CALCSUMS
CALCSUMS
CALCFIELDS
If the FlowField is of type sum: CALCSUMS
If the FlowField is of type lookup: FIND/NEXT(‘-‘)
LOCKTABLE
LOCKTABLE
INSERT
If the table is not locked already: LOCKTABLE
INSERT
MODIFY
If the table is not locked already: LOCKTABLE
Often on SQL Server: FIND/NEXT(‘=’)
MODIFY
DELETE
If the table is not locked already: LOCKTABLE
DELETE
MODIFYALL
If the table is not locked already: LOCKTABLE
MODIFYALL (as long as validation code isn’t executed)
DELETEALL
If the table is not locked already: LOCKTABLE
DELETEALL (as long as validation code isn’t executed)
2.4 The Client Monitor
Generally, the FIND/NEXT function in the Client Monitor means:
Function
Name:
Search Means:
Method:
FIND/NEXT –
FIND(‘-’) or find the first record (within the current filter using the current
key).
FIND/NEXT +
FIND(‘+’) or find the last record (within the current filter using the current
key).
FIND/NEXT >
NEXT or find the record with key values greater than the current key
values (within the current filter using the current key).
FIND/NEXT <
NEXT(-1) or find the record with key values less than the current key
values (within the current filter using the current key).
FIND/NEXT =
GET or find one record with key values equal to the current key values
(within the current filter).
In the Client Monitor:
· For each FIND/NEXT, the Search Method field tells you what kind of FIND/NEXT
server call it is (see the previous table).
· For each FIND/NEXT, the Search Result field contains a value (the same as the
Search Method field) if data was found. Otherwise, it is blank.
· For each COMMIT, the Commit field normally contains the value 1, indicating that
the transaction was committed. If the transaction was rolled back and not
committed, the value is 0.
· The Elapsed Time (ms) field shows the amount of time that elapsed between the
start and the end of a server call. This means that it gives you the total time spent
on the client, the network and the server.
Note that the information in the Elapsed Time (ms) field tends to be slightly
inaccurate for fast server calls. If a server call takes 1 ms, then the average Elapsed
Time (ms) is 1 ms. However, 90% of the server calls will have 0 in the Elapsed Time
(ms) field, while 10% of the server calls will have 10 in the Elapsed Time (ms) field.
· The Table Size (Current) field tells you the amount of records that were in the
table when you started the Client Monitor. This information can help explain why
server calls to a particular table can take such a long time (that is, when the
Elapsed Time (ms) values are high).
· The SQL Status field tells you whether the data was read from the server or from
the client cache.
· A check mark in the Locking field indicates that the server call has locked data. To
focus on locking issues you can place a filter on this field.
The Client Monitor cannot be used to analyze temporary tables because they are
stored on the client and inserts into temporary tables do not involve server calls.
The Client Monitor gathers and displays all the database function calls that are made
by the C/AL code, as well as the server calls that are made indirectly by, for example,
19
Chapter 2. Identifying Performance Problems
opening a form. The C/AL code that initiates a database function call can be seen in
the Source Object and Source Text fields (these fields are not shown in the previous
picture).
However, this is not the most informative way of viewing the code. To get a more
detailed overview of the code that made a particular database call, select the line in
question in the Client Monitor and click C/AL Code. The Code Overview window
opens displaying the code that made the database function call. This gives you a
quick way of locating the relevant piece of code.
The focus of the Code Overview window is the line in the code that made the
database call. If C/SIDE made the database call, the Code Overview window will
point to the last C/AL code that was executed before
made the database call.
Note
. . . . . . . . . . . . . . . . . . . . . . . . . . . . . . . . . . . . . . . . .
When the code contains an IF..THEN ..ELSE statement, the break point that is
displayed in the Code Overview window will often be slightly inaccurate.
. . . . . . . . . . . . . . . . . . . . . . . . . . . . . . . . . . . . . . . . .
You can also specify that the information collected by the Code Coverage tool is
stored permanently in a table. This means that the data is always available and you
will not have to profile the task every time you need to see this data. However,
permanently storing this information makes the Client Monitor and the Code Coverage
tool work more slowly.
To store the code coverage information in a table:
1 Run form 150021, Client Monitor Setup.
2 Enter a check mark in the Save Code Coverage Info. field.
20
2.4 The Client Monitor
The Most Problematic Server Calls
To identify the most problematic server calls:
1 Profile your task as described in “Using the Client Monitor to Profile a Task”.
2 Run form 150020, Client Monitor.
3 Click View, Sort to sort the data in the Client Monitor window. Sorting by Elapsed
Time (ms) in descending order is one of the more useful ways of viewing the data.
The server calls that took the longest time will then be listed at the top. This will help
you identify the most problematic server calls.
After you have identified the problematic server calls, you can optimize the slow
queries that are caused by filters and keys that don’t match (especially on SQL
Server) by using the appropriate keys in the queries or possibly by changing the
existing keys.
Note
. . . . . . . . . . . . . . . . . . . . . . . . . . . . . . . . . . . . . . . . .
Rearranging the fields in a key, for example, by moving the first field in a key to the
end and by changing the references to the key (both in the code and in the
properties), can solve a performance problem. Furthermore, any FlowFields in the key
that are calculating sums are guaranteed to work as long as all the original fields are
left in the key. If you remove some of the fields from a key, you can cause some
FlowFields that are calculating sums to produce run time errors.
When you are developing an application, you will not encounter problems like the one
described above, unless you enter some pseudo-realistic amounts of data into the
database.
. . . . . . . . . . . . . . . . . . . . . . . . . . . . . . . . . . . . . . . . .
Carefully read the information about performance in the section "Keys, Queries and
Performance" on page 39.
The Overall Picture
You can use the Client Monitor together with Microsoft Excel to analyze the time spent
by tasks that make many server calls (that is, 100+). You must begin by profiling the
task as described in the section "Using the Client Monitor to Profile a Task" on page
17. The data must then be transferred into Excel.
To transfer the data into Excel:
1 Run form 150020, Client Monitor.
2 Click Export and save as a .txt file.
3 In Excel, import the .txt file that you have just saved.
You now have a spreadsheet containing the basic Client Monitor data.
21
Chapter 2. Identifying Performance Problems
You use the pivot tables in Excel to generate a sorted list of the tables that take the
most time. The pivot table must also list the functions that are used as well as the
search method and the search result for each table. You must also check the server
calls that generated the sums to see the average amount of elapsed time for each
server call.
You can also create new spreadsheets that summarize different operations on various
tables by using the Pivot Table feature.
To create a pivot table:
1 Click Data, PivotTable, PivotChart Report and click Finish in the wizard that
appears.
You can now choose which breakdown of the Client Monitor elements you would
like to analyze. This example uses the typical elements.
2 In the PivotTable window, select the Table Name button and drag it over to the
range that says "Drop Row Fields Here".
3 Repeat this procedure for Function Name, Search Method and Search Result
placing each field to the right of the previous field.
4 Drag Elapsed Time (ms) over to the range that says "Drop Data Items Here".
You can now see the breakdown of timings per table/function etc, summed up.
To list the most important tables first:
1 Double-click the Table Name field heading.
2 Select Advanced.
3 In the AutoSort options, select Descending. In the Using drop-down list select
Sum of Elapsed Time (ms).
To list the most important functions per table first, repeat this procedure for the
Function Name field.
If there are any totals that you do not want to see, right-click the field that contains the
word Total and click Hide.
For more information about pivot tables, see the online help in Excel.
22
2.4 The Client Monitor
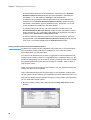
Here is a snapshot of an analysis of elapsed time:
Analysis at Table and Function Level – Sum of Elapsed Time (ms)
Sum of Elapsed Time (ms)
Table Name
Function Name
Search
Method
Search Result Total
Reservation Entry
CALCSUMS
(blank)
(blank)
380
DELETE
(blank)
(blank)
1382
FIND/NEXT
-
(blank)
630
361
+
+
0
(blank)
30
=
=
(blank)
140
0
>
>
(blank)
40
1851
INSERT
(blank)
(blank)
20
LOCKTABLE
(blank)
(blank)
0
MODIFY
(blank)
(blank)
1673
Reservation Entry Total
Calendar Entry
Calendar Entry Total
6507
FIND/NEXT
+
+
490
<
(blank)
1792
2282
These pivot tables contain information about the amount of time that was spent
performing certain operations. The table contains a table-by-table breakdown of the
time spent on each of the tables that were involved in the operations as well as the
total time used. The tables are listed in ascending order of time spent. The table also
lists the functions that were called on each table and the time it took to perform each
operation.
The first table listed is the Reservation Entry table. You can see that a total of 380
milliseconds were spent calculating sums and 1382 milliseconds were spent
performing deletions. A list of the FIND operations follows, which details the
operations that were performed and the amount of time that each operation took.
A total of 20 milliseconds were spent performing inserts into the Reservation Entry
table. A total of 1673 milliseconds were spent modifying data in the Reservation
Entry table.
23
Chapter 2. Identifying Performance Problems
If time is spent on modifications (INSERT, MODIFY, DELETE, MODIFYALL, DELETEALL)
and the average time spent on modification server calls is high, you should check the
keys in the table. The number and length of the keys greatly influence the time it takes
to make modifications on both database servers. On SQL Server, if the average time
spent on modification server calls is extremely long, check whether or not there are
SumIndexFields in the keys and whether or not the MaintainSIFTIndex property is set
to Yes for these keys. Setting the MaintainSIFTIndex property to No for these keys
can greatly improve the speed of modification server calls, but there will be some loss
of performance for those tasks that generate sums using these keys.
24
2.5 Locking
2.5 LOCKING
You can also use the Client Monitor to see whether or not locking prevents concurrent
tasks from being executed at the same time and to identify where deadlocks occur in a
specific multi-user scenario. Before using the Client Monitor to identify potential
locking problems you must import some Client Monitor helper objects:
1 Import the Client Monitor.fob file, including the following forms:
Form 150020, Client Monitor
Form 150024, Client Monitor (Multi-User)
2 Compile all the objects that are imported. This must be done because some of the
field definitions are different on the two database server options.
To identify locking problems:
1 Before trying to identify any locking problems, you must make sure the clocks are
synchronized on all the client machines. You can set up computers running most
Windows operating systems so that their clocks are automatically synchronized
with the time on a server when they log on by using the following command: “net
time \\computername /SET”.
2 Start the Client Monitor on all the computers that are involved in the multi-user test.
3 Perform the tasks that you want to test.
4 Stop the Client Monitor on all the computers.
5 On each client computer, process the common client monitor data by running form
150020, Client Monitor.
6 Run form 150024, Client Monitor (Multi-User) on one of the client computers.
The Client Monitor (Multi-User) window contains information about the
transactions that might have blocked other clients. The COMMIT in the transactions
that might have blocked other clients is shown together with the server calls made
by the clients that are potentially waiting for the COMMIT to be completed. The other
server calls are listed before the COMMIT.
25
Chapter 2. Identifying Performance Problems
For example, in the window shown here, you can see that the client with
Connection ID 52 has waited almost 4 seconds. This indicates that there might
have been a block.
7 Check the values in the Elapsed Time (ms) field to see if there are any server calls
that are taking longer than normal.
A high value in the Elapsed Time (ms) field indicates that a server call is waiting
for locks to be released. Use the filtering features in Navision to see all the details
of the locking scenarios. The value in the Locking field is Yes when a server call
locks data. You should put a filter on this field to limit the data.
8 If a deadlock has occurred on SQL Server, the SQL Error field in the Client
Monitor (Multi-User) window will show the error message generated by SQL
Server. To see all these lines, set the filter “SQL Error<>’’. These lines are marked
red and bold.
For more information about locking, see the section "Locking in Navision – A
Comparison of Navision Database Server and SQL Server" on page 41.
· You can “optimize” locking by checking whether a set is empty or not. If it is not
empty, you can continue locking and reading through the set. If a table is empty, it
should not be used at all, and this will remove all the locking problems that are
caused by that table. Such a solution can, for example, be acceptable for the
comment lines on a sales order during posting.
· You can limit the locking on SQL Server by setting the MaintainSIFTIndex property
on a key with SumIndexFields to No.
· In Navision, you can use the SIFTLevelsToMaintain property to more precisely
control the level of performance and locking on SQL Server.
Locating the Tasks That Cause Deadlock Problems on Navision Database Server
Two transactions can only cause a deadlock if they both lock some of the same
tables. However, if both of the transactions are defined so that the first lock they place
is on the same table, no deadlock will occur. In other words, a deadlock occurs when
two or more transactions have a conflicting locking order.
When you want to identify potential locking problems, you only need to use one client.
You run the tasks on the client that you think might cause locking problems and gather
all of the relevant data in the Client Monitor and then open a special form to see if
there are any potential deadlocks.
To find potential deadlocks on Navision Database Server:
1 Import the Client Monitor.fob file, if you have not already imported it.
2 Compile all the objects that are imported. This must be done because some of the
field definitions are different on the two database server options.
3 Prepare the tasks that you want to run concurrently without any deadlocks
occurring.
26
2.5 Locking
4 Open and start the Code Coverage tool and then open and start the Client Monitor.
5 Perform the tasks.
6 Stop the Client Monitor and then stop the Code Coverage tool.
7 Run form 150030, Potential Deadlocks (Navision).
The Potential Deadlocks (Navision Server) window lists all the potential deadlocks
or locking order conflicts that occurred during the tasks that you performed and is
based on an analysis of the locking order that is used in each write transaction that
was carried out. Each line in the window contains information about two transactions
that represent a potential deadlock. These transactions represent a potential deadlock
because they both lock some of the same tables but lock them in a different order.
Sets of transactions that do not contain a potential deadlock are not displayed.
Each line in the window contains the following information:
Field:
Contains:
Transaction No.
The number of the first of the two transactions that represent a
potential deadlock.
Transaction Description
By default, this field contains the name of the object that initiated
the first transaction.
Transaction No. 2
The number of the second transaction.
Transaction Description 2
By default, this field contains the name of the object that initiated
the second transaction.
First Locked Table ID
The ID and the name of the first table that is common to both
transactions and is locked by the first transaction.
First Locked Table Name
First Locked Table ID 2
First Locked Table Name 2
The ID and the name of the first table that is common to both
transactions and is locked by the second transaction.
From this form, you can access more detailed information about the locks that were
placed by each transaction, as well as the code that was used.
27
Chapter 2. Identifying Performance Problems
· To see the details about one of the transactions, select a line in the Potential
Deadlocks (Navision Server) window and click Transaction, Client Monitor,
Transaction 1 or 2. The details are displayed in the Client Monitor.
· To see the locking operations that were performed by one of the transactions,
select a line in the Potential Deadlocks (Navision Server) window and click
Transaction, Client Monitor (Locking Operations Only), Transaction 1 or 2. The
locking operations are displayed in the Client Monitor.
· To see the locking order used by one of the transactions, select a line in the
Potential Deadlocks (Navision Server) window and click Transaction, Locking
Order, Transaction 1 or 2. The locking order used by the transaction you select is
displayed in the Transaction Locking Order window.
· To see the code that made the first server call in the first transaction, select the
appropriate line in the Potential Deadlocks (Navision Server) window and click
C/AL Code 1. The code is displayed in the Code Overview window.
Locking Order Rules on Navision Database Server
As stated in the previous section a deadlock occurs when two or more transactions
have a conflicting locking order and no deadlock can occur if the first lock the
transactions place is on the same table.
From this we can deduce that if you have an agreed set of rules that determine the
locking order that must be used in your application then no deadlocks will occur. The
problem is that agreeing to a set of rules is one thing, adhering to the rules is another
thing entirely. Remembering the rules isn’t as easy as it sounds – there could be a
large number of them.
There is now a tool that can help you see whether or not your application follows the
locking rules that you have specified.
This involves determining which rules must apply in your application, entering them
into the system and then checking your application to see if it violates the rules or not.
After you have determined the rules that must govern locking order in your application,
you can enter them into the system:
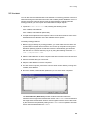
1 Run form 150029, Locking Order Rules and the Locking Order Rules window
appears:
28
2.5 Locking
2 Enter the rules that you want your application to follow. Each entry represents a rule
and you can enter as many rules as you need.
Each rule specifies that one table must be locked before another table. Needless to
say your rules must not contain any conflicts. The consistency of the rules is checked
when you test your application to see if it follows the rules. If the rules contain a
conflict you will receive an error message.
After you have entered the rules, you can test whether or not your application follows
the rules.
1 Open and start the Code Coverage tool and then open and start the Client Monitor.
2 Perform the tasks that you want to test.
3 Stop the Client Monitor and then stop the Code Coverage tool.
4 Run form 150027,Transactions (Locking Rules).
5 The Transactions (Locking Rules) window appears listing the transactions that
you performed:
· If any of the transactions violated the rules that you specified earlier a check mark is
displayed in the Locking Rule Violations field.
· To see the C/AL code that broke the locking rule, select the transaction in question
and click C/AL Code. The C/AL Code – Code Coverage window appears
displaying the relevant code.
· To see all the operations and tables that were involved in a particular transaction,
select the transaction and click Transaction, Client Monitor.
· To see only the locking operations and the tables that were locked in a particular
transaction, select the transaction and click Transaction, Client Monitor (Locking
Operations Only).
· To see the order in which tables were locked by a particular transaction, select the
transaction and click Transaction, Locking Order.
· To see the locking rules that were violated by a particular transaction, select the
transaction and click Transaction, Locking Rules Violated.
29
Chapter 2. Identifying Performance Problems
Locating the Clients That Cause Deadlock Problems on SQL Server
When a deadlock occurs, one transaction continues, while the others are aborted. To
find out which clients are involved in a deadlock on SQL Server and which clients are
not stopped, see the section "SQL Server Error Log" on page 37.
Identifying the Keys That Cause Problems on SQL Server
When you are using the SQL Server Option, it is important that any customizations
that you develop contain keys and filters that are designed to run optimally on SQL
Server. We have therefore developed a tool that helps you test your keys and filters in
a development environment and ensure that they conform to the demands made by
SQL Server
When you want to see if an application contains any keys that might cause problems,
you only need a demonstration database and not a copy of the customer’s database.
Inserting, modifying and deleting records will take a similar amount of time in both
large and small databases. However, the amount of time that it takes to read will be
very different, especially for tables that become very large in the customer’s database.
This means that an analysis based on the Elapsed Time (ms) field in the Client
Monitor is not enough when you are troubleshooting performance problems in a small
database.
To check whether the keys and filters are designed correctly:
1 Open and start the Code Coverage tool and then open and start the Client Monitor.
2 Perform the task that you want to test.
3 Stop the Client Monitor and then stop the Code Coverage tool.
4 Open form 150022, Client Monitor (Key Usage).
Queries with filters that do not use the keys appropriately are shown in this window.
The key that is being used is split into two fields: Good Filtered Start of Key and Key
Remainder. Those fields that are filtered to a single value, but are not used efficiently
on SQL Server because of the selection and ordering of fields in the key that is used,
are shown in the Key Candidate Fields field.
30
2.5 Locking
Remember, SQL Server always wants a single-value field as the filter or as the first
field in the filter. For more information about keys and filters, see the section "Keys,
Queries and Performance" on page 39.
The information in the Client Monitor (Key Usage) window is sorted by table name
and only displays the queries with filters that can potentially cause problems. You will
therefore have to use your knowledge of the application that you are developing and
the theory behind the design of keys for SQL Server to decide which of the queries
you can ignore and which you will have to modify.
In general, you should:
· Ignore those queries that use small tables that will not grow very large in the
customer’s database. An example of a small table that you can readily ignore is
table 95, G/L Budget Name.
· Focus on the large tables and the tables that will grow rapidly in the customer’s
database.
· Focus on the Key Candidate Fields and the Good Filtered Start of Key fields.
· As mentioned earlier you should look at the Good Filtered Start of Key field. If
this field is empty, check the Key Candidate Fields field and decide whether the
fields shown here would have made a difference if they had been used efficiently.
This is where your understanding of the application will help you.
You need to decide whether the suggested key will make the query run more
efficiently or not. If the suggested filter is a field that contains many different values,
it will probably help.
If you really understand the theory behind the design of efficient queries, you will
know whether or not it makes sense to change the application.
However, if you are uncertain about the theory you will have to test the suggested
query. This means that you must use a database that contains a realistic amount of
data and then test the existing filter and the suggested new filter to see which one
works more efficiently.
Note
. . . . . . . . . . . . . . . . . . . . . . . . . . . . . . . . . . . . . . . . .
The Client Monitor (Key Usage) window also gives you information about how a key
works on Navision Database Server. Some keys will give problems on both servers
and others will only be a problem on SQL Server.
. . . . . . . . . . . . . . . . . . . . . . . . . . . . . . . . . . . . . . . . .
Reading Problems on SQL Server
When you are running on SQL Server and are reading data, some NEXT function calls
can generate separate SQL statements instead of using the data that is stored in
cache, and this can cause performance problems. The Client Monitor also contains a
tool that can help you locate the C/AL code that generated these problematic SQL
NEXT statements.
31
Chapter 2. Identifying Performance Problems
To locate this C/AL code, you must perform the tasks in question, identify the
problematic NEXT statements and then locate the C/AL code that generated these
statements.
1 Import the Client Monitor.fob file, if you have not already imported it.
2 Compile all the objects that are imported. This must be done because some of the
field definitions are different on the two database server options.
3 Prepare the tasks that you want to perform.
4 Open and start the Code Coverage tool and then open and start the Client Monitor.
5 Perform the tasks that you want to test.
6 Stop the Client Monitor and then stop the Code Coverage tool.
7 Run form 150023, Client Monitor (Cache Usage).
The Client Monitor (Cache Usage) window lists the problematic NEXT statements
that were generated by the tasks that you performed. All of the normal NEXT
statements are ignored.
These NEXT statements are problematic because they generate their own SQL
statement and database call to retrieve data from the server and do not use the data
that is already cached on the client. It is difficult to know with certainty why these NEXT
statements behave like this. It might be:
· because C/SIDE is unable to optimize this function.
· a result of the way that the code is written.
However these NEXT statements only cause problems if they are run repeatedly as
part of a long-running batch job and generate a large number of extra server calls.
To see the C/AL code that generated the SQL NEXT statements, select the line you
are interested in and click C/AL Code. The code that generated the statement is
displayed in the Code Overview window.
To export the data in this window as a text file, click Export.
32
Chapter 3
Other Issues
This chapter discusses some of the other issues that you
must take into consideration when you are trying to identify
and solve performance problems.
This chapter contains the following sections:
· Hardware Setup
· SQL Server Error Log
· Keys, Queries and Performance
· Locking in Navision – A Comparison of Navision
Database Server and Microsoft SQL Server
· Configuration Parameters
Chapter 3. Other Issues
3.1 HARDWARE SETUP
It is also possible that poor performance is caused by the hardware that you are using.
There are three aspects of the hardware that you should consider: the server, the
clients and the network.
Hardware Setup for the Database Server
To identify any hardware bottlenecks that may exist on a server use the Windows
Performance Monitor. You should check the time usage for the both the disks and the
CPU.
If the disks cause the bottleneck, you can lessen the problem and improve
performance by:
· Adding more RAM to decrease disk activity, such as swapping.
· Spreading the SQL Server database and log files across more disks.
· Adding one disk controller per disk.
· Installing faster disks.
· If the bottleneck is caused by the CPUs, you can improve performance by installing
faster CPUs.
On SQL Server, if the performance problems are only significant when multiple users
are working simultaneously, adding more CPUs will lessen the problem. If the
bottleneck is not caused by the hard disks or the CPUs, it is outside the server and lies
either in the network or on the client computers.
It is always a good idea to expand the search for bottlenecks beyond the server
hardware and try to identify the reasons behind the unacceptable usage of resources.
You can use the Windows Performance Monitor to monitor the following server
performance counters:
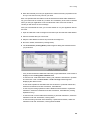
Object Name
Counter Name
Memory
Physical Disk
34
Instances
Best Values
Recommendation
(Best Values not
met)
Available Mbytes SQL Server
TS Servers
5MB
Add more memory
Reserve less memory
for SQL Server
Pages/sec
SQL Server
TS Servers
<25
Add more memory
Reserve less memory
for SQL Server
Avg Disk Read
Queue length
SQL Server
Disks
<2
Change disk system
Avg Disk Write
Queue length
SQL Server
Disks
<2
Change disk system
3.1 Hardware Setup
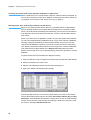
Object Name
Counter Name
Processor
System
Best Values
Recommendation
(Best Values not
met)
% Processor time SQL Server
TS Servers
0-80
Add more CPUs
Processor Queue SQL Server
Length
TS Servers
<2
Add more CPUs
Context
Switches/sec
SQL Server
Instances
SQL Server
<8000
TS Servers
(Multi-processor)
Set Affinity Mask
Network Interface Output queue
length
SQL Server
TS Servers
Increase network
capacity
SQL Server
Full Scans/sec
Access Methods
SQL Server
<2
Review Navision C/AL
Code
Page Splits/sec
SQL Server
0
Defrag SQL Server
Indexes,
Review Navision C/AL
Keys
SQL Server
Buffer Manager
Buffer Cache Hit
Ratio
SQL Server
>90
Add more memory
SQL Server
Databases
Log Growths
SQL Server
0 (during peak Increase and set the
times)
size of the transaction
log
SQL Server
User Connections SQL Server
General Statistics
SQL Server
Locks
Lock
Requests/sec
SQL Server
Review Navision C/AL
Code
Lock Wait/sec
SQL Server
Review Navision C/AL
Code
Hardware Setup for Clients
To identify any hardware bottlenecks that may exist on a client computer use the
Windows Performance Monitor. You should check the time usage for both the disks
and the CPU.
If the disks on the client computer cause the bottleneck, you can lessen the problem
and improve performance by:
· Adding more RAM to decrease disk activity such as swapping.
· Installing faster disks.
If the bottleneck is the CPU, you can improve performance by changing to a faster
CPU.
35
Chapter 3. Other Issues
If it isn’t the hard disks or the CPU that are causing the bottleneck, the problem (if it is
a hardware problem) is located outside the client and lies either in the network or on
the server.
Network
If neither the database server nor the clients seem to be the bottleneck in a system,
look at the network. To find out if a critical task runs slowly because the network is
slow, run the same task directly on the database server. The difference in speed tells
you the maximum improvement you can hope to achieve by having an optimal
network. You can also create a form based on the Performance virtual table to see
some measurements for the network you are using.
The good thing about hardware problems is that the solution is always hardware. It will
always be possible to improve performance by adding new hardware. The
improvement may only be slight, but it is still an improvement. Unfortunately, this can
give you a false sense of security. Your installation may have some serious problems,
the symptoms of which you are only alleviating by adding new hardware, while the
real source of the problem remains unaltered.
36
3.2 SQL Server Error Log
3.2 SQL SERVER E RROR LOG
To monitor deadlocks on SQL Server, enable trace flags 1204 and 3605 (if you are
running SQL Server 2000 and have not upgraded to Service Pack 3) in the Startup
Parameters of SQL Server, and then restart the server. This will generate diagnostic
messages in the SQL Server Error Log.
Trace Flag 1204 – returns the type of locks that are participating in the deadlock and
the current command affected.
Trace Flag 3605 – sends the trace output to the error log. This is always done when
you are running SQL Server 2000 Service Pack 3 or later. (If you start SQL Server
from the command prompt, the output also appears on the screen.)
Secondly you should implement a SQL Server alert to notify an operator when a
deadlock occurs so that an investigation of the deadlock scenario can start
immediately.
To enable a trace flag:
1 Open Enterprise Manager.
2 Expand Microsoft SQL Servers and expand SQL Server Group.
3 Right-click the server for which you want to enable the trace flags and select
Properties.
4 In the SQL Server Properties (Configure) window, click Startup Parameters and
the Startup Parameters window appears:
5 Enter the name of the trace flag in the Parameter field and click Add and then click
OK.
If your application experiences some locking problems you can open the SQL error
log and see the types of locks that were placed and the clients that were involved.
To open the SQL error log:
1 Open the Startup Parameters window as described earlier.
37
Chapter 3. Other Issues
2 Use the scroll bar in the Existing Parameters field to see which of the parameters
is the error log. This also tells you the path to where the error log is stored. This is
normally C:\Program Files\Microsoft SQL Server\MSSQL\log\ERRORLOG.
3 Locate the error log and open it in Notepad.
38
3.3 Keys, Queries and Performance
3.3 K EYS , Q UERIES AND PERFORMANCE
When you write a query that searches through a subset of the records in a table, you
should always carefully define the keys both in the table and in the query so that
Navision can quickly identify this subset. For example, the entries for a specific
customer will normally be a small subset of a table containing entries for all the
customers.
If Navision can locate and read the subset efficiently, the time it will take to complete
the query will only depend on the size of the subset. If Navision cannot locate and
read the subset efficiently, performance will deteriorate. In the worst-case scenario,
Navision will read through the entire table and not just the relevant subset. In a table
containing 100,000 records, this could mean taking either a few milliseconds or
several seconds to answer the query.
To maximize performance, you must define the keys in the table so that they facilitate
the queries that you will have to run. These keys must then be specified correctly in
the queries.
For example, you would like to retrieve the entries for a specific customer. To do this,
you apply a filter to the Customer No. field in the Cust. Ledger Entry table. In order
to run the query efficiently on SQL Server, you must have defined a key in the table
that has Customer No. as the first field. You must also specify this key in the query.
The table could have these keys:
Entry No.
Customer No.,Posting Date
The query could look like this:
SETCURRENTKEY("Customer No.");
SETRANGE("Customer No.",'1000');
IF FIND('-') THEN
REPEAT
UNTIL NEXT = 0;
You should define keys and queries in the same way when you are using Navision
Database Server. However, Navision Database Server can run the same query
almost as efficiently if Customer No. is not the first field in the key. For example, if you
have defined a key that contains Country Code as the first field and Customer No.
as the second field and if there are only a few different country codes used in the
entries, it will only take a little longer to run the query.
The table could have these keys:
Entry No.
Country Code, Customer No.,Posting Date
The query could look like this:
SETCURRENTKEY("Country Code","Customer No.");
SETRANGE("Customer No.",'1000');
IF FIND('-') THEN
39
Chapter 3. Other Issues
REPEAT
UNTIL NEXT = 0;
But SQL Server will not be able to answer this query efficiently and will read through
the entire table.
In conclusion, SQL Server makes stricter demands than Navision Database Server on
the way that keys are defined in tables and on the way they are used in queries.
This section has been copied from the Application Designer’s Guide.
40
3.4 Locking in Navision – A Comparison of Navision Database Server and SQL Server
3.4 L OCKING IN NAVISION – A COMPARISON OF NAVISION D ATABASE S ERVER
AND SQL S ERVER
The following information explains the differences and similarities in the way that
locking is carried out in the two database options for Navision, Navision Database
Server and SQL Server.
Important
. . . . . . . . . . . . . . . . . . . . . . . . . . . . . . . . . . . . . . . . .
The following information only covers the default transaction type UpdateNoLocks for
the SQL Server Option for Navision. For information about the other transaction types,
see the C/SIDE Reference Guide online Help.
. . . . . . . . . . . . . . . . . . . . . . . . . . . . . . . . . . . . . . . . .
Both Server Options
In the beginning of a transaction, the data that you read will not be locked. This means
that reading data will not conflict with transactions that modify the same data. If you
want to ensure that you are reading the latest data from a table, you must lock the
table before you read it.
Locking Single Records
Normally, you must not lock a record before you read it even though you may want to
modify or delete it afterwards. When you try to modify or delete the record, you will get
an error message if another transaction has modified or deleted the record in the
meantime. You receive this error message because C/SIDE checks the timestamp
that it keeps on all of the records in a database and detects that the timestamp on the
copy you have read is different from the timestamp on the modified record in the
database.
Locking Record Sets
Normally, you lock a table before reading a set of records in that table if you want to
read these records again later to modify or delete them. You must lock the table to
ensure that another transaction does not modify these records in the meantime.
You will not receive an error message if you do not lock the table even though the
records have been modified as a result of other transactions being carried out while
you were reading them.
Minimizing Deadlocks
To minimize the amount of deadlocks that occur, you must lock records and tables in
the same order for all transactions. You can also try to locate areas where you lock
more records and tables than you actually need, and then diminish the extent of these
locks or remove them completely. This can prevent conflicts on these records and
tables.
If this does not prevent deadlocks, you can, as a last resort, lock more records and
tables to prevent transactions from running concurrently.
41
Chapter 3. Other Issues
If you cannot prevent the occurrence of deadlocks by programming, you must run the
deadlocking transactions separately.
Locking in Navision Database Server
Data that is not locked will be read from the same snapshot (version) of the database.
If you call LOCKTABLE or a modifying function (for example, INSERT, MODIFY or
DELETE), on a table, the whole table will be locked.
Locking Record Sets
As mentioned previously, you will normally lock a table before reading a set of records
in that table if you want to read these records again later to modify or delete them.
With Navision Database Server you can choose to lock the table with
LOCKTABLE(TRUE,TRUE) after reading the records for the first time instead of locking
with LOCKTABLE before reading the records for the first time.
When you try to modify or delete the records, you will receive an error message if
another transaction has modified the records in the meantime.
You will also receive an error message if another transaction has inserted a record
into the record set in the meantime. However, if another transaction has deleted a
record from the record set in the meantime, you will not be able to notice this change.
The purpose of locking with LOCKTABLE(TRUE,TRUE) after reading the records for the
first time is to postpone the table lock that Navision Database Server puts on the table.
This improves concurrency.
Locking in SQL Server
When data is read without locking, you will get the latest (possibly uncommitted) data
from the database.
If you call Rec.LOCKTABLE, nothing will happen right away. However, when data is
read from the table after LOCKTABLE has been called, the data will be locked.
If you call INSERT, MODIFY or DELETE, the specified record will be locked
immediately. This means that two transactions, which insert, modify or delete
separate records in the same table will not conflict. Furthermore, locks will also be
placed whenever data is read from the table after the modifying function has been
called.
It is also important to note that even though SQL Server initially puts locks on single
records, it can also choose to escalate a single record lock to a table lock. It will do so
if it determines that the overall performance will be improved by not having to set locks
on individual records. The improvement in performance must outweigh the loss in
concurrency that this excessive locking causes.
If you specify what record to read, for example, by calling Rec.GET, that record will be
locked. This means that two transactions, which read specific, but separate, records in
a table will not cause conflicts.
42
3.4 Locking in Navision – A Comparison of Navision Database Server and SQL Server
If you browse a record set (that is, read sequentially through a set of records), for
example, by calling Rec.FIND('-') or Rec.NEXT, the record set (including the
empty space) will be locked as you browse through it. However, the locking
implementation used in SQL Server will also cause the record before and the record
after this record set to be locked. This means that two transactions, which just read
separate sets of records in a table, will cause a conflict if there are no records between
these two record sets. When locks are placed on a record set, other transactions
cannot put locks on any record within the set.
Note that C/SIDE decides how many records to retrieve from the server when you ask
for the first or the next record within a set. C/SIDE then handles subsequent reads
with no additional effort, and fewer calls to the server will give better performance. In
addition to improving performance, this means that you cannot precisely predict when
locks are set when you browse.
Note
. . . . . . . . . . . . . . . . . . . . . . . . . . . . . . . . . . . . . . . . .
Navision tables that have keys defined for SumIndexFields cause additional tables to
be created in SQL Server to support SIFT functionality. One table is created for each
key that contains SumIndexFields. When you modify a Navision table that has keys
defined for SumIndexFields, modifications can be made to these SQL Server tables.
When this happens, there is no guarantee that two transactions can modify different
records in the Navision table without causing conflicts.
. . . . . . . . . . . . . . . . . . . . . . . . . . . . . . . . . . . . . . . . .
Locking Differences in the Code
A typical use of LOCKTABLE(TRUE,TRUE) in Navision Database Server is shown in
the first column of the table below. The equivalent code for the SQL Server Option is
shown in the second column. The code that works on both servers is shown in the
third column.
The RECORDLEVELLOCKING property is used to detect whether record level locking is
being used. If this is the case, then you are using the SQL Server Option for Navision.
This is currently the only server that supports record level locking.This section has
been copied from the Application Designer’s Guide.
SQL Server
Navision Database Server
IF Rec.FIND('-') THEN
REPEAT
UNTIL Rec.NEXT = 0;
Rec.LOCKTABLE(TRUE,TRUE);
IF Rec.FIND('-') THEN
REPEAT
Rec.MODIFY;
UNTIL Rec.NEXT = 0;
Rec.LOCKTABLE;
IF Rec.FIND('-') THEN
REPEAT
UNTIL Rec.NEXT = 0;
IF Rec.FIND('-') THEN
REPEAT
Rec.MODIFY;
UNTIL Rec.NEXT = 0;
43
Chapter 3. Other Issues
Both Server Types
IF Rec.RECORDLEVELLOCKING THEN
Rec.LOCKTABLE;
IF Rec.FIND('-') THEN
REPEAT
UNTIL Rec.NEXT = 0;
IF NOT Rec.RECORDLEVELLOCKING THEN
Rec.LOCKTABLE(TRUE,TRUE);
IF Rec.FIND('-') THEN
REPEAT
Rec.MODIFY;
UNTIL Rec.NEXT = 0;
44
3.5 Configuration Parameters
3.5 CONFIGURATION P ARAMETERS
You can configure a Navision database by creating a SQL Server table configuration
parameter table and entering parameters into the table that will determine some of the
behavior of Navision when it is using this database.
In the database create a table, owned by dbo:
CREATE TABLE [$ndo$dbconfig] (config VARCHAR(512) NOT NULL)
GRANT SELECT ON [$ndo$dbconfig] TO public
(You can add additional columns to this table, if necessary. The length of the config
column should be large enough to contain the necessary configuration values, as
explained below, but need not be 512.)
There is one record in this table for each parameter that is required.
The following sections describe the parameters that you can enter into this table.
Index Hinting
It is possible to force SQL Server to use a particular index when executing queries for
FIND('-'), FIND('+'), FIND('=') and GET statements. This can be used as a
workaround when SQL Server's Query Optimizer picks the wrong index for a query.
Index hinting can help avoid situations where SQL Server’s Query Optimizer chooses
an index access method that requires many page reads and generates long-running
queries with response times that vary from seconds to several minutes. Selecting an
alternative index can give instant 'correct' query executions with response times of
milliseconds. This problem usually occurs only for particular tables and indexes that
contain certain data spreads and index statistics.
In the rare situations where it is necessary, you can direct Navision to use index
hinting for such problematic queries. When you use index hinting, Navision adds
commands to the SQL queries that are sent to the server. These commands bypass
the normal decision making of SQL Server's Query Optimizer and force the server to
choose a particular index access method.
Note
. . . . . . . . . . . . . . . . . . . . . . . . . . . . . . . . . . . . . . . . .
This feature should only be used after all the other possibilities have been exhausted,
for example, updating statistics, optimizing indexes or re-organizing column order in
indexes.
. . . . . . . . . . . . . . . . . . . . . . . . . . . . . . . . . . . . . . . . .
The index hint syntax is:
IndexHint=<Yes,No>;Company=<company name>;Table=<table
name>;Key=<keyfield1,keyfield2,...>; Search Method=<search method
list>;Index=<index id>
45
Chapter 3. Other Issues
Each parameter keyword can be localized in the "Driver configuration parameters"
section of the .stx file.
The guidelines for interpreting the index hint are:
· If IndexHint=No, the entry is ignored.
· All the keywords must be present or the entry is ignored.
· If a given keyword value cannot be matched the entry is ignored.
· The values for the company, table, key fields and search method must be
surrounded by double-quotes to delimit names that contain spaces, commas etc.
· The table name corresponds to the name supplied in the Object Designer (not the
Caption name).
· The key must contain all the key fields that match the required key in the Keys
window in the Table Designer.
4 The search method contains a list of search methods used in FIND statements,
that must be one of '-', '+', '=', or '!' (for the C/AL GET function).
The index ID corresponds to a SQL Server index for the table: 0 represents the
primary key; all other IDs follow the number included in the index name for all the
secondary keys. Use the SQL Server command sp_helpindex to get information
about the index ID associated with indexes on a given table. In this example we are
looking for index information about the Item Ledger Entry table:
sp_helpindex 'CRONUS International Ltd_$Item Ledger Entry'
When Navision executes a query, it checks whether or not the query is for the
company, table, current key and search method listed in one of the IndexHint entries.
If it is, it will hint the index for the supplied index ID in that entry.
Note that:
· If the company is not supplied, the entry will match all the companies.
· If the search method is not supplied, the entry will match all the search methods.
· If the index ID is not supplied, the index hinted is the one that corresponds to the
supplied key. This is probably the desired behavior in most cases.
· If the company/table/fields are renamed or the table's keys redesigned, the
IndexHint entries must be modified manually.
Here are a few examples that illustrate how to add an index hint to the table by
executing a statement in Query Analyzer:
EXAMPLE 1
INSERT INTO [$ndo$dbconfig] VALUES
('IndexHint=Yes;Company="CRONUS International Ltd.";Table="Item
Ledger Entry";Key="Item No.","Variant Code";Search Method="+";Index=3')
46
3.5 Configuration Parameters
This will hint the use of the $3 index of the CRONUS International Ltd_$Item Ledger Entry
table for FIND('-') and FIND('+') statements when the Item No.,Variant Code key is set as
the current key for the Item Ledger Entry table in the CRONUS International Ltd. company.
EXAMPLE 2
INSERT INTO [$ndo$dbconfig] VALUES
('IndexHint=No;Company="CRONUS International Ltd.";Table="Item
Ledger Entry";Key="Item No.","Variant Code";Search Method="+";Index=3')
The index hint entry is disabled.
EXAMPLE 3
INSERT INTO [$ndo$dbconfig] VALUES
('IndexHint=Yes;Company="CRONUS International Ltd.";Table="Item
Ledger Entry";Key="Item No.","Variant Code";Search Method="+";Index=')
This will hint the use of the Item No.,Variant Code index of the CRONUS International Ltd_$Item
Ledger Entry table for FIND('-') and FIND('+') statements when the Item No.,Variant
Code key is set as the current key for the Item Ledger Entry table in the CRONUS International
Ltd. company. This is probably the way that the index-hinting feature is most commonly used.
EXAMPLE 4
INSERT INTO [$ndo$dbconfig] VALUES
('IndexHint=Yes;Company=;Table="Item Ledger Entry";Key="Item
No.","Variant Code";Search Method="-+";Index=3')
This will hint the use of the $3 index of the CRONUS International Ltd_$Item Ledger Entry
table for FIND('-') and FIND('+') statements when the Item No.,Variant Code key is set as
the current key for the Item Ledger Entry table for all the companies (including a non-company
table with this name) in the database.
EXAMPLE 5
INSERT INTO [$ndo$dbconfig] VALUES
('IndexHint=Yes;Company="CRONUS International Ltd.";Table="Item
Ledger Entry";Key="Item No.","Variant Code";Search Method=;Index=3')
This will hint the use of the $3 index of the CRONUS International Ltd_$Item Ledger Entry
table for every search method when the Item No.,Variant Code key is set as the current key for the
Item Ledger Entry table in the CRONUS International Ltd. company.
Lock Granularity
When Navision is reading data from tables it places forced ROWLOCK hints, by default.
These rowlock hints prevent SQL Server from automatically determining the
47
Chapter 3. Other Issues
granularity (row, page or table) of the locks that it places. This can lead to a high
locking overhead on the server, even though concurrency is optimum.
To allow SQL Server to determine the granularity of the locks that it places, the
DefaultLockGranularity parameter can be used in the database configuration
table.
The syntax of the DefaultLockGranularity parameter is:
DefaultLockGranularity=<Yes,No>
When the parameter is Yes, SQL Server will choose the granularity of the locks that it
places. When the parameter is No, Navision will override SQL Server and place
ROWLOCKs.
This section has been copied from the Application Designer’s Guide.
48
Appendix A
Object List
This appendix contains a list of all the objects in the fob files
described in the Performance Troubleshooting Guide.
Appendix A. Object List
A.1 PERFORMANCE TROUBLESHOOTING O BJECT LIST
The following tables list all the objects contained in the .fob files described in this
document:
Session Monitor (Navision Server).fob
Table
150010
Session Monitor Setup
Table
150011
Session Information
Form
150010
Session Monitor (Navision Server)
Form
150011
Session Monitor Lines
Form
150012
Session Monitor Setup (SQL)
Form
150013
Sessions
Codeunit
150010
Session Monitor Mgt.
Session Monitor (SQL Server).fob
Table
150012
Session Monitor Setup (SQL)
Table
150013
Session Information (SQL)
Table
150014
Session (SQL)
Form
150014
Session Monitor (SQL Server)
Form
150015
Session Monitor Lines (SQL)
Form
150016
Session Monitor Setup (SQL)
Form
150017
Sessions (SQL Server)
Codeunit
150011
Session Monitor Mgt. (SQL Server)
Table
150000
Activity Log Entry
Table
150001
Table Size Change
Form
150000
Activity Log
Form
150001
Table Size Changes
ActivityLog.fob
Sample Use of Activity Log.fob
Codeunit
150000
Sample Use of Activity Log
Client Monitor.fob
50
Table
150020
Client Monitor
Table
150021
Client Monitor Setup
Table
150022
Code Coverage Line
A.1 Performance Troubleshooting Object List
Table
150023
Transaction
Table
150024
Transaction Lock
Table
150025
Locking Rule
Table
150026
Potential Deadlock
Table
150027
Locking Rule Violation
Form
150020
Client Monitor
Form
150021
Client Monitor Setup
Form
150022
Client Monitor (Key Usage)
Form
150023
Client Monitor (Cache Usage)
Form
150024
Client Monitor (Multi-User)
Form
150025
Transactions
Form
150026
Transaction Locking Order
Form
150027
Transactions (Locking Rules)
Form
150028
Locking Rule Violations
Form
150029
Locking Order Rules
Form
150030
Potential Deadlocks (Navision)
Form
150031
C/AL Code – Code Coverage
Form
150032
C/AL Code – Adv. Code Coverage
Report
150020
Code Coverage
Dataport
150020
Export Client Monitor
Dataport
150021
Export/Import Code Coverage
Dataport
150022
Import/Export Locking Rules
Codeunit
150020
Client Monitor Mgt.
Codeunit
150021
Client Monitor to C/AL Code
Codeunit
150022
Transaction Mgt.
Codeunit
150023
Transaction to C/AL Code
Codeunit
150024
Transaction Lock to C/AL Code
Codeunit
150025
Locking Order Rules Mgt.
Codeunit
150027
Deadlock to C/AL Code
Codeunit
150028
Deadlock to C/AL Code 2
51
Appendix A. Object List
52
INDEX
A
activity log
time measurements . . . . . . . . . . . . . 15
C
client
hardware setup . . . . . . . . . . . . . . . . .
Client Monitor
cache usage . . . . . . . . . . . . . . . . . . .
exporting data to Excel . . . . . . . . . . .
Find/Next function . . . . . . . . . . . . . . .
key usage . . . . . . . . . . . . . . . . . . . . .
locking . . . . . . . . . . . . . . . . . . . . . . . .
next statements . . . . . . . . . . . . . . . . .
profiling a task . . . . . . . . . . . . . . . . . .
N
Navision Database Server
deadlocks . . . . . . . . . . . . . . . . . . . . . 26
locking order rules . . . . . . . . . . . . . . . 28
locking record sets . . . . . . . . . . . . . . 42
warming up . . . . . . . . . . . . . . . . . . . . . 3
35
32
21
19
30
25
32
17
D
database server
hardware setup . . . . . . . . . . . . . . . . . 34
deadlocks
minimizing . . . . . . . . . . . . . . . . . . . . . 41
Navision Database Server . . . . . . . . 26
F
Find/Next function
Client Monitor . . . . . . . . . . . . . . . . . . 19
H
hardware setup
client . . . . . . . . . . . . . . . . . . . . . . . . . 35
database server . . . . . . . . . . . . . . . . 34
I
index hinting
examples . . . . . . . . . . . . . . . . . . . . . . 46
SQL Server . . . . . . . . . . . . . . . . . . . . 45
K
key usage
Client Monitor . . . . . . . . . . . . . . . . . . 30
keys and queries
defining . . . . . . . . . . . . . . . . . . . . . . . 39
L
locking
Client Monitor . . . . . . . . . . . . . . . . . . 25
differences in the code . . . . . . . . . . . 43
record sets . . . . . . . . . . . . . . . . . . . . 41
record sets on Navision Database Server
42
single records . . . . . . . . . . . . . . . . . . 41
SQL Server . . . . . . . . . . . . . . . . . . . . 42
locking order rules
Navision Database Server . . . . . . . . 28
P
performance
keys and queries . . . . . . . . . . . . . . . . 39
Performance Monitor
counters to monitor . . . . . . . . . . . . . . 34
performance problems
common causes of . . . . . . . . . . . . . . . 6
locking . . . . . . . . . . . . . . . . . . . . . . . . . 6
profiling a task
Client Monitor . . . . . . . . . . . . . . . . . . 17
R
reading problems
SQL Server . . . . . . . . . . . . . . . . . . . . 31
record sets
locking . . . . . . . . . . . . . . . . . . . . . . . . 41
S
Session Monitor
Navision Database Server . . . . . . . . 10
SQL Server . . . . . . . . . . . . . . . . . . . . 11
Session Monitor (SQL Server)
logging blocks . . . . . . . . . . . . . . . . . . 11
SQL Server
error log . . . . . . . . . . . . . . . . . . . . . . . 37
index hinting . . . . . . . . . . . . . . . . . . . 45
index hinting, examples . . . . . . . . . . 46
locking . . . . . . . . . . . . . . . . . . . . . . . . 42
monitoring errors . . . . . . . . . . . . . . . . 37
reading problems . . . . . . . . . . . . . . . 31
warming up . . . . . . . . . . . . . . . . . . . . . 3
SQL Server Option
keys that cause problems . . . . . . . . . 30
performance counters to monitor . . . 34
T
test environment
setting up . . . . . . . . . . . . . . . . . . . . . . 3
time measurements
activity log . . . . . . . . . . . . . . . . . . . . . 15
W
warming up
Navision Database Server . . . . . . . . . 3
SQL Server . . . . . . . . . . . . . . . . . . . . . 3
Windows Performance Monitor
counters to monitor . . . . . . . . . . . . . . 34
Index