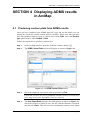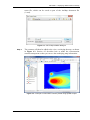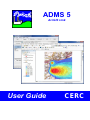
1
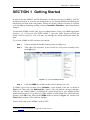
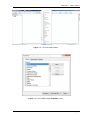
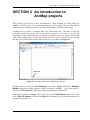
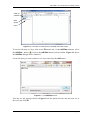
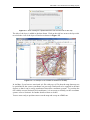
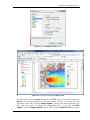
ADMS 5
ArcGIS Link
User Guide
CERC
ADMS 5 ArcGIS
Link
User Guide
November 2012
Cambridge Environmental Research Consultants Ltd
3 King’s Parade
Cambridge
CB2 1SJ
Telephone: +44 (0)1223 357773
Fax: +44 (0)1223 357492
Email: [email protected]
Web: http://www.cerc.co.uk
ADMS – ArcGIS Link User Guide
Page i
CONTENTS
SECTION 1
Getting Started .................................................................................1
SECTION 2
An introduction to ArcMap projects..............................................3
SECTION 3
Setting up an ADMS run using ArcMap........................................ 6
3.1 Overview ..........................................................................................................6
3.2 Displaying existing sources and receptors .......................................................7
3.3 Creating point sources ......................................................................................7
3.4 Creating area sources........................................................................................ 8
3.5 Creating line sources ........................................................................................8
3.6 Creating volume sources ..................................................................................9
3.7 Creating jet sources ..........................................................................................9
3.8 Defining an output grid ....................................................................................9
3.9 Adding receptors ..............................................................................................10
3.10 Completing the input file..................................................................................10
3.11 Changing the symbology..................................................................................10
3.12 Saving your project ..........................................................................................11
SECTION 4
Displaying ADMS results in ArcMap.............................................13
4.1 Producing contour plots from ADMS results...................................................13
4.2 Generating Transparent Filled Contours and Iso-Concentration Contours......15
4.3 Spatial Analyst settings used by the ADMS link .............................................17
4.4 Reclassify the Concentration Layer .................................................................17
SECTION 5
Displaying Maximum Concentration Values................................. 18
5.1 Importing ADMS Output Files.........................................................................18
5.2 Clip Points by Boundary ..................................................................................18
5.3 Display Maximum Concentration Values ........................................................19
SECTION 6
Making a hard copy .........................................................................21
6.1 Creating a layout ..............................................................................................22
6.2 Printing a layout ...............................................................................................24
6.3 Saving a layout for a report ..............................................................................24
6.4 Using Saved Projects as a Template................................................................. 24
SECTION 7
Georeferencing images..................................................................... 25
7.1 Set map coordinates using a *.tfw World file ..................................................25
7.2 Set map coordinates using the georeferencing toolbar.....................................26
ADMS – ArcGIS Link User Guide
Page ii
SECTION 1 – Getting Started
SECTION 1 Getting Started
In order to use the ADMS 5 ArcGIS Extension you will need a copy of ADMS 5, ArcGIS1
and Spatial Analyst. If you have not already done so, you should install them following the
instructions provided with each product. Ensure the Spatial Analyst extension is switched
on in ArcMap by launching ArcMap, selecting Customize, Extensions… and ticking Spatial
Analyst.
To install the ADMS ArcGIS Link, log on as administrator, locate your ADMS application
directory, e.g. C:\Program Files\CERC\ADMS 5, open the folder Support\ArcGIS and
double click on Setup.exe. This will take you through the install wizard and install the
links.
To view the ADMS ArcGIS extension you should:
Step 1
Launch ArcMap by double-clicking on the ArcMap icon.
Step 2
Then right click anywhere on the tool bar for a list of the available tools.
See Figure 1.1.
Figure 1.1 – List of ArcMap toolbars.
Step 3
Click the ADMS tool and the toolbar will be added to the view.
If ADMS is not in the list then select Customize… at the bottom of the list, as shown in
Figure 1.2. Then select the Add from file… button. This will launch a browser dialogue;
locate the file ADMS_URBAN_ArcGISLink.dll, which should be in your ADMS-ArcGIS
application directory C:\Program Files\CERC\ADMS-ArcGIS\ADMS. You will be shown a
message, click OK to this, then tick the ADMS toolbar as shown in Figure 1.3. Finally click
Close and the toolbar will be added to ArcMap.
You are now ready to use ADMS 5 with ArcGIS.
1
Check cerc.co.uk for the full list of supported ArcGIS versions.
ADMS – ArcGIS Link User Guide
Page 1
SECTION 1 – Getting Started
Figure 1.2 – List of ArcMap toolbars.
Figure 1.3 – The ArcMap toolbar Customize screen.
ADMS – ArcGIS Link User Guide
Page 2
SECTION 2 –An introduction to ArcMap projects
SECTION 2 An introduction to
ArcMap projects
This section provides only a brief introduction to using ArcMap, so before using the
ADMS 5 ArcGIS tools, it is recommended that the user completes the ArcMap tutorial
supplied with the software in order to become accustomed to ArcMap terminology.
ArcMap has two modes of working: data view and layout view. The latter is used for
producing layouts for reports and is described in Section 5. In order to use the full
capabilities of the ADMS link, the user must be working in data view, which is the default
view when ArcMap opens. If you are not in the data view, you can switch to it by selecting
the data view button shown at the bottom of the screen, as shown in Figure 2.1.
Data view
Figure 2.1 – The data view in the ArcMap Project screen.
ArcMap work is saved in ArcMap Documents (.mxd files). Figure 2.1 shows a Document
Window within the ArcMap interface, which at present is untitled. To give the project a
title click on File, Save As... and choose a directory and title for the project.
Map data is entered into Layers. These layers are stored in Data Frames which can be seen
in the Table Of Contents, as shown in Figure 2.2 (currently your ArcMap document will
not contain any layers).
ADMS – ArcGIS Link User Guide
Page 3
SECTION 2 –An introduction to ArcMap projects
Table of
contents
Data
Frame
Layer
Figure 2.2 – The table of contents in the ArcMap data view screen.
To load an OS map as a layer click on the File menu and, via the Add Data submenu, select
the Add Data… button
or select the Add Data button from the toolbar. Figure 2.3 shows
the Add Data dialogue that is launched.
Locate the data you want to add as a new layer and select the Add button.
Figure 2.3 – The Add Data screen.
You may see the message shown in Figure 2.4 if the spatial reference has not been set, in
this case just click OK.
ADMS – ArcGIS Link User Guide
Page 4
SECTION 2 –An introduction to ArcMap projects
Figure 2.4 – Error message if a Spatial Reference has not been set for the map.
The title of the layer is added to the data frame. Click on the tick box next to the layer title
to switch the view of the layer off and on as shown in Figure 2.5.
Figure 2.5 – An example of an OS data tile loaded into ArcMap.
In ArcMap, if you have no associated .tfw file with your .tif file, then the map data may not
be positioned at the correct coordinates on your map. Data tends to be supplied in decimal
degrees so that it can be easily transformed into other coordinate systems. To position the
tile with the correct National Grid coordinates, it is necessary to initially set the coordinate
system: refer to Section 6 for further details on how to do this.
You are now ready to position sources on the map and set up an ADMS run.
ADMS – ArcGIS Link User Guide
Page 5
SECTION 3 – Setting up an ADMS run using ArcMap
SECTION 3 Setting up an ADMS run
using ArcMap
3.1 Overview
Once your map image is registered, you are ready to position sources on the map and
set up an ADMS run.
The ADMS ArcGIS extension is controlled from buttons on the ADMS toolbar. The
toolbar is shown in Figure 3.1, and the buttons are described in Table 3.1 .
Figure 3.1 – The ADMS toolbar.
Button
Button Name
Action
Show ADMS
Activates the ADMS interface
Add Point Source
Adds a new ADMS point source where you click
Add Area Source
Adds a new ADMS area source where you click (double-click to
end the area source)
Add Line Source
Adds a new ADMS line source where you click (double-click to
end the line source)
Add Volume
Source
Adds a new ADMS volume source where you click (doubleclick to end the volume source)
Add Jet Source
Adds a new ADMS jet source where you click
Add Receptor
Adds a new ADMS receptor point for generating output
concentrations
Define Contour
Area
Defines an ADMS output grid over the rectangle drawn
Refresh All Data
Updates the ArcMap display with all the sources in the current
ADMS apl file
Generate
Contours
Creates a contour layer of concentrations based on ADMS
output and adds it to the View
Import ADMS
Output
Imports an ADMS output file into ArcMap
Clip Point To
Boundary
Clips a point layer according to the boundaries in a polygon
layer
Report Max Values
Displays the maximum concentration values in a point layer
ADMS – ArcGIS Link User Guide
Page 6
SECTION 3 – Setting up an ADMS run using ArcMap
Button
Button Name
Save Shapefile
with Aliases
Adjust
Transparency
Save Current
Symbology as
Default
Action
Saves a Shapefile and associated layer file in the same location,
for the selected layer. This ensures any column aliases are saved
with the data.
Adjusts the transparency of the selected layer
Saves the current symbology properties of the sources as the
default
Table 3.1 – Brief description of toolbar buttons in the ArcMap extension for ADMS.
3.2 Displaying existing sources and receptors
ArcMap will display the locations of any sources and specified receptor points that
are included in the ADMS input file (.apl). A separate layer will be added for each
source type. Point, jet, line, area and volume sources are displayed, along with
specified receptor points. Buildings are not displayed and cannot be created or edited
using the ADMS-ArcGIS link.
If you have an existing ADMS input file, then click on the Refresh button
display all the sources in the file, and any specified receptor points.
to
If you wish to add new sources, follow the appropriate instructions in sections 3.3 to
3.9.
3.3 Creating point sources
Follow the steps below to create a point source from within ArcMap.
Step 1
Click the Add Point Source button.
Step 2
Click on the map window at the location where you want to position your
point source.
Step 3
A new point source is created and displayed in the ADMS Source screen.
The source coordinates will have been filled in automatically, but you will
need to enter the other parameters for the source. Refer to the ADMS User
Guide for further details.
Step 4
To add another point source, return to ArcMap by clicking on the ArcMap
window title bar, and repeat steps 2 and 3.
Step 5
The location of the point source(s) should automatically be added to the
map. If for any reason they are not, click the refresh button.
ADMS – ArcGIS Link User Guide
Page 7
SECTION 3 – Setting up an ADMS run using ArcMap
3.4 Creating area sources
Follow the steps below to create an area source from within ArcMap.
Step 1
Click the Add Area Source button.
Step 2
Click on the map at the position of one of the vertices. Then, moving
around the source clockwise or anticlockwise, click at the position of the
remaining vertices, double-clicking at the final vertex. An area source can
have between three and fifty vertices.
Hold down the right mouse button and move the cursor around the map to
pan while drawing.
Step 3
A new area source is created and displayed in the ADMS Source screen.
The source geometry will have been filled in automatically, but you will
need to enter the other parameters for the source. Refer to the ADMS User
Guide for further details.
Step 4
To add another area source, return to ArcMap by clicking on the ArcMap
window title bar, and repeat steps 2 and 3.
Step 5
The location of the area source(s) should automatically be added to the
map. If for any reason they are not, click the refresh button.
3.5 Creating line sources
Follow the steps below to create a line source from within ArcMap.
Step 1
Click the Add Line Source button.
Step 2
Click on the map at the position for one end of the source. Then, double
click the mouse button to position the other end. A line source must be a
simple line and can only have two vertices.
Hold down the right mouse button and move the cursor around the map to
pan while drawing.
Step 3
A new line source is created and displayed in the ADMS Source screen.
The source geometry will have been filled in automatically, but you will
need to enter the other parameters for the source. Refer to the ADMS User
Guide for further details.
Step 4
To add another line source, return to ArcMap by clicking on the ArcMap
window title bar, and repeat steps 2 and 3.
Step 5
The location of the line source(s) should automatically be added to the
map. If for any reason they are not, click the refresh button
.
ADMS – ArcGIS Link User Guide
Page 8
SECTION 3 – Setting up an ADMS run using ArcMap
3.6 Creating volume sources
Follow the steps below to create a volume source from within ArcMap.
Step 1
Click the Add Volume Source button.
Step 2
Click on the map at the position of one of the vertices. Then, moving
around the source clockwise or anticlockwise, click at the position of the
remaining vertices, double-clicking at the final vertex. A volume source
can have between three and fifty vertices.
Hold down the right mouse button and move the cursor around the map to
pan while drawing.
Step 3
A new volume source is created and displayed in the ADMS Source
screen. The source co-ordinates will have been filled in automatically, but
you will need to enter the other parameters for the source. Refer to the
ADMS User Guide for further details.
Step 4
To add another volume source, return to ArcMap by clicking on the
ArcMap window title bar, and repeat steps 2 and 3.
Step 5
The location of the new source(s) should automatically be added to the
map. If for any reason they are not, click the refresh button
.
3.7 Creating jet sources
Follow the steps below to create a jet source from within ArcMap.
Step 1
Click the Add Jet Source button.
Step 2
Click on the map window at the location where you want to position your
jet source.
Step 3
A new jet source is created and displayed in the ADMS Source screen. The
source co-ordinates will have been filled in automatically, but you will
need to enter the other parameters for the source. Refer to the ADMS User
Guide for further details.
Step 4
To add another jet source, return to ArcMap by clicking on the ArcMap
window title bar, and repeat steps 2 and 3.
Step 5
The location of the jet source(s) should automatically be added to the map.
If for any reason they are not, click the refresh button.
3.8 Defining an output grid
Follow the instructions below to define an output grid from within ArcMap.
Step 1
Click the Define Contour Area button.
ADMS – ArcGIS Link User Guide
Page 9
SECTION 3 – Setting up an ADMS run using ArcMap
Step 2
Click on the map at one of the corners of the output grid area and, while
holding down the mouse button, drag the mouse to the opposite corner of
the area. A rectangle will appear on the map while you drag the mouse.
When the rectangle reaches the size you require, release the mouse button.
Step 3
You are then asked “Do you wish to use this area for the ADMS output
grid?” If the correct area has been selected then click Yes. Otherwise,
click No and select a new output grid. Click Yes when you have selected a
suitable area.
Step 4
The ADMS Grids screen will appear with the new output grid coordinates.
You may modify the grid coordinates and number of points by hand if you
wish.
3.9 Adding receptors
Follow the steps below to define receptors (also known as “specified points”) using
ArcMap.
Step 1
Click the Add Receptor button.
Step 2
Click on the map at the position for the new receptor point.
Step 3
The ADMS Grids screen appears, showing your new specified point with
the coordinates of the point at which you clicked. You should provide a
name for the point.
Step 4
To add another receptor, return to ArcMap by clicking on the ArcMap
window title bar, and repeat steps 2 and 3.
Step 5
The location of the receptor source(s) should automatically be added to the
map. If for any reason they are not, click the refresh button.
3.10 Completing the input file
Complete the remainder of the ADMS model set-up (met. data, pollutant data,
emission rates etc.) in the ADMS interface. Refer to the ADMS User Guide for
further details.
Save and run the ADMS model as normal.
You are now ready to display your ADMS results in ArcMap.
3.11 Changing the symbology
The appearance of the ADMS layers can be changed, either by right clicking on the
layer and selecting the Properties... option, or by double clicking on the layer. This
opens the Layer Properties screen. Select the Symbology tab as shown in Figure 3.2.
ADMS – ArcGIS Link User Guide
Page 10
SECTION 3 – Setting up an ADMS run using ArcMap
Figure 3.2 – The Symbology tab of the Layer Properties screen.
You can change the colour and style by clicking the box in the Symbol frame and
choosing a new colour. Once you are happy with the appearance click OK to return to
the map, or click Cancel to discard any changes and return to the map.
To save your chosen colours and styles as the defaults, click the Save Current
Symbology as Default button
. From now on the ADMS layers will appear in the
new colours and styles in all your ArcGIS projects.
3.12 Saving your project
If ArcMap contains any ADMS layers when you close the project you will be asked
whether you want to save the ADMS shapefiles under a different name so that they
are not deleted, as shown in Figure 3.3.
Figure 3.3 – Closing project warning message.
ADMS – ArcGIS Link User Guide
Page 11
SECTION 3 – Setting up an ADMS run using ArcMap
If you click No, the project will close and none of the ADMS shapefiles will be
saved. If you click Yes then you will be returned to your project where you can save
the files.
ADMS shapefiles are deleted each time ArcMap is closed because they contain the
data that is currently loaded in the ADMS user interface. These files are therefore
always changing and do not remain fixed for a given project. If you wish to view
sources from a particular apl you must either have it loaded in the interface, or save
the sources to a shapefile so they can be viewed without using the ADMS link. This
can be useful when creating layouts for a report.
If you want to save the shapefiles, right click on an ADMS layer, select Data, then
click Export Data… as shown in Figure 3.4. The Export Data dialogue will appear.
Select the location where you wish to save the shapefile, give it an appropriate name
and click OK. You will be shown a message asking if you want to display the
exported file as a layer in your map, click Yes. You will have to repeat this for all the
layers. You can now remove the ADMS layers from the project and save it. When
you close the project you will no longer see any warnings.
Remember that the saved files will contain a ‘snapshot’ of the data currently loaded
in the ADMS user interface, if you change the apl you may want to resave the
shapefiles.
Figure 3.4 – The Layer options menu.
ADMS – ArcGIS Link User Guide
Page 12
SECTION 4 – Displaying ADMS results in ArcMap
SECTION 4 Displaying ADMS results
in ArcMap
4.1 Producing contour plots from ADMS results
Once you have completed your ADMS input file (.apl) and run the model, you can
display the results by creating contour plots in ArcMap. Please note that you must
have used gridded output to create a contour plot. On the Grids screen the Receptor
type option must be either Gridded or Both.
Follow the steps below to produce a contour plot.
Step 1
In the ArcMap interface, press the Generate Contours button.
Step 2
The ADMS Contour Plotter screen will appear, as shown in Figure 4.1.
Figure 4.1 – The ADMS Contour Plotter screen.
Step 3
Select the output file you wish to contour and click on Plot.
Check that you have the correct pathname and that you have selected short
term, long term or time-dependent results as required.
Step 4
The Save Output Raster dialogue box then appears as shown in Figure 4.2.
Select the location in which to save the file, edit the filename if required
and then click Save. This will save the concentration contours in an output
ADMS – ArcGIS Link User Guide
Page 13
SECTION 4 – Displaying ADMS results in ArcMap
raster file, which can be saved as part of the ArcMap document file
(*.mxd).
Figure 4.2 – Save Output Raster dialogue.
Step 5
The contours will then be added to the view, overlaying the map, as shown
in Figure 4.3. Section 4.2 describes how to make the concentration
contours transparent so that you can see the underlying map information.
Figure 4.3 – Example concentration contours plotted using Spatial Analyst.
ADMS – ArcGIS Link User Guide
Page 14
SECTION 4 – Displaying ADMS results in ArcMap
4.2 Generating Transparent Filled Contours and IsoConcentration Contours
Use the following instructions to increase the transparency of the contour layers so
that the background map and ADMS sources and receptors are visible beneath them.
Step 1
Double click on the concentration layer to view the Layer Properties
screen, or right click on the layer and select the Properties… button.
(Figure 4.4 shows the Layer Properties screen for the NOx_ug_m3 layer of
Figure 4.3)
Step 2
Select the Symbology tab. Double click on the dark blue colour for the
lowest range, then select the No Color option and click OK. You are now
able to see a lot more of the map where the values were either zero or very
low.
Step 3
Select
the
concentration
layer
in
the
Effects
Layer
menu
then select the Adjust Transparency
button. Adjust the slider until the transparency is about 25%. This makes
the contour layer more transparent so that you can see the data underneath,
as shown in Figure 4.5.
Figure 4.4 – The Symbology tab of the Layer Properties screen.
ADMS – ArcGIS Link User Guide
Page 15
SECTION 4 – Displaying ADMS results in ArcMap
Figure 4.5 – The map with overlaid shaded contours.
It is also possible to view iso-concentration contour lines (e.g. to show the contour
for a specific concentration), as shown in Figure 4.6. To do so, ensure the Spatial
Analyst toolbar is open by right clicking on the main toolbar and selecting Spatial
Analyst. Make sure the selected layer in the Spatial Analyst toolbar is the appropriate
concentration layer, e.g. NOx_ug_m3. Click on the create contour tool , then click
anywhere on the grid and a contour will be produced that matches the concentration
at that location.
Figure 4.6 – The map with shaded contours and iso-concentrations.
ADMS – ArcGIS Link User Guide
Page 16
SECTION 4 – Displaying ADMS results in ArcMap
4.3 Spatial Analyst settings used by the ADMS link
The ADMS link uses ESRI Spatial Analyst to interpolate the concentration data. It is
recommended that the user allow this to be done automatically. The concentration
data is interpolated using the gridding method known as inverse distance weighting.
However, the details of the interpolation process can be selected manually if the user
wishes. For full details refer to the ESRI Spatial Analyst help.
4.4 Reclassify the Concentration Layer
You might want to reclassify the concentration layer grid so that you can compare
different files on the same scale. This can be done by double clicking on the
concentration layer to view the Layer Properties screen, or by right clicking on the
layer and selecting the Properties… button, as shown in Figure 4.4.
Under the Layer Properties window you can select the Classify… button and change
the number of breaks, limits and colours.
ADMS – ArcGIS Link User Guide
Page 17
SECTION 5 – Displaying Maximum Concentration Values
SECTION 5 Displaying Maximum
Concentration Values
The ADMS Link provides the facility to calculate the maximum concentration values in an
ADMS output file outside, or inside, a site boundary. Typically you would run the
following three options in order: import an ADMS output file, following the instructions in
Section 5.1; delete points from the imported ADMS output file, following the instructions
in Section 5.2; and finally display the maximum concentration values of the remaining
points, following the instructions in Section 5.3.
5.1 Importing ADMS Output Files
ADMS output files (.glt, .gst, .gtd, .plt, .pst, .ptd) need to be converted into point
shapefiles, in order to be viewed or used within ArcMap. The attributes of the points in
the shapefile are provided by the ADMS output values and coordinates for that point.
Step 1
Click the Import ADMS Output button
Output screen, as shown in Figure 5.1.
to display the Import ADMS
Figure 5.1 – The Import ADMS Output screen.
Step 2
Use the top browse button
to locate the ADMS output file to import.
Step 3
Use the second browse button to define the output shapefile’s location and
filename, or accept the default.
Step 4
Click OK
5.2 Clip Points by Boundary
The Clip Point by Boundary button deletes points from a point shapefile. The points are
compared against a set of polygons in a boundary shapefile and excluded depending on
whether you wish to keep points inside or outside the boundary. ADMS area or volume
source layers can be used as boundary shapefiles.
Step 1
Ensure the point and boundary shapefiles are open in ArcMap.
ADMS – ArcGIS Link User Guide
Page 18
SECTION 5 – Displaying Maximum Concentration Values
Step 2
Click on the Clip Point by Boundary button
Boundary screen, as shown in Figure 5.2.
to display the Clip Points by
Figure 5.2 – The Clip Points by Boundary screen.
Step 3
Select the layer containing the constraining polygons from the Boundary
Layer dropdown.
Step 4
Select the layer containing the point data from the Point Layer dropdown.
Step 5
Choose whether to keep only the points inside the boundary, or only the
points outside the boundary.
Step 6
Click OK
5.3 Display Maximum Concentration Values
The maximum value for each category (e.g. short-term NOx concentration) within a
point shapefile and the coordinates of the points at which these maximum values occur
can be displayed. To do so, follow the instructions below:
Step 1
Click the Report Max Values button
screen, as shown in Figure 5.3.
to display the Display Max Values
Step 2
Select the point layer in the dropdown to display a list containing the
maximum values for each attribute recorded in the shapefile.
Step 3
The information in the list is also automatically copied, ready to paste into
another program, e.g. Microsoft Word.
Figure 5.3 – The Display Max Values screen.
ADMS – ArcGIS Link User Guide
Page 19
SECTION 5 – Displaying Maximum Concentration Values
Step 4
Click a row’s Highlight button to highlight that row’s maximum value
point(s) on the map.
Step 5
Click OK to close the dialogue.
ADMS – ArcGIS Link User Guide
Page 20
SECTION 6 – Making a hard copy
SECTION 6 Making a hard copy
There is a facility to create layouts of your project for reports in ArcMap. It is
straightforward to create a default layout which can then be edited. To make a layout of
the current view, click on the View menu, then Layout View, or select the Layout View
button at the bottom of the map, as shown in Figure 6.1.
Layout
view button
Figure 6.1 – The Layout View button
The screen will change to the layout view with the current map framed and the Layout
toolbar launched, as shown in Figure 6.2. Instructions for creating a layout can be found in
Section 6.1. Once you are happy with your layout, it can be printed (refer to Section 6.2 for
further details) or saved as an image file (refer to Section 6.3 for further details). The
printout and image file will appear exactly as seen in the layout view.
ADMS buttons will appear grey when working in layout view, as the user must be in data
view to use the full capabilities of the ADMS link described in sections 3 and 4.
Figure 6.2 – The layout view.
ADMS – ArcGIS Link User Guide
Page 21
SECTION 6 – Making a hard copy
6.1 Creating a layout
If you have any default layouts defined you can select them by clicking the Change
on the layout toolbar and following the wizard. Refer to section
Layout button
6.4 for further details. If you don’t have existing default layers then you can create
your own. This section provides an example.
Change the page layout by selecting the File menu, clicking Page and Print Setup…
and selecting the Orientation: Landscape before clicking OK. Drag the edges of the
frame so that they fit on the page. Select the Insert menu and click Legend…. Select
the layers that you want in the legend, as shown in Figure 6.3, then complete all the
sections of the Legend Wizard before clicking Finish. Drag the legend into a suitable
position and resize if necessary.
Figure 6.3 – The Legend Wizard screen.
You can change the number of decimal places or significant figures in your legend, if
any layers are showing too many, or too few. Double click on the layer to open the
Layer Properties screen. Select the Symbology tab and click on the Label heading,
before selecting Format Labels…; the Number Format screen opens, as shown in
Figure 6.4. Select the Numeric category, then change the Rounding type and number
of digits to the option you wish to display. Click OK to keep any changes then click
OK on the Layer Properties screen to close it and apply the changes to your legend.
ADMS – ArcGIS Link User Guide
Page 22
SECTION 6 – Making a hard copy
Figure 6.4 – The Number Format screen.
Figure 6.5 – The layout view with Legend added.
To add a title, select the Insert menu and click Title. Then type your title and press
Return. To edit the properties of the title, double click it. To change the font
properties of the title, click the Change Symbol… button, then choose the font, text
size, style and colour. To change the background colour of the title, click Edit
Symbol... from the Symbol Selector screen. Then click the Advanced Text tab, before
ADMS – ArcGIS Link User Guide
Page 23
SECTION 6 – Making a hard copy
ticking the Text Background box and selecting the Properties… button beneath it.
Finally, select the Symbol… button and change the fill to the colour you wish the title
background to have. Click OK until you return to the layout view. An example report
layout can be seen in Figure 6.5.
6.2 Printing a layout
To make a hard copy, click the Print button
or select the File menu, then click
Print…. Select a colour printer set on a high resolution for best results.
6.3 Saving a layout for a report
The layout image may also be exported in various image file formats, such as EMF,
for use in other applications, such as Microsoft Word. This is generally the
recommended option as it results in documents with low memory-usage that print
quickly in high quality. To export the layout image, select the File menu then click
Export Map.... Choose the image file type, properties and export location then click
Save to export the image.
6.4 Using Saved Projects as a Template
Report layouts in any saved ArcGIS projects can be imported to the current project
as a template. To do this, click the Change Layout button
on the Layout toolbar.
and browse for the project document (.mxd file) you
Click the open file button
wish to use as a template. Click Finish on the wizard and the custom layout will be
applied.
ADMS – ArcGIS Link User Guide
Page 24
SECTION 7 – Georeferencing images
SECTION 7 Georeferencing images
When using raster image map data in ArcGIS, the coordinates and scale of the map must
be specified before it can be used as a basis for entering source locations. In other words,
the map image must be georeferenced. There are several ways to position a map image in
ArcGIS. Two of these methods are discussed: using a pre-prepared *.tfw World file, and
using the georeferencing toolbar.
7.1 Set map coordinates using a *.tfw World file
Images are stored as raster data, where each cell in the image has a row and column
number. Shapefiles are stored in real-world coordinates. In order to display images
correctly it is necessary to establish an image-to-world transformation that converts
the image coordinates to real-world coordinates. This transformation information is
typically stored with the image.
Some image formats, such as ERDAS, IMAGINE, BSQ, BIL, BIP, GeoTIFF, and
grids, store the georeferencing information in the header of the image file. ArcGIS
uses this information if it is present. However, other image formats store this
information in a separate ASCII file. This file is generally referred to as the world
file, since it contains the real-world transformation information used by the image.
World files can be created with any editor.
tfw world files for every OS map tile are available to download from the OS website
(www.ordnancesurvey.co.uk). To do this, visit the website, select the appropriate
product (e.g. 1:50000 Colour Raster) and click on the link to ‘Georeferencing’. Click
on the link to download a WinZip file containing all .tfw files for the selected
product.
Follow these steps to load and geo-reference your map image:
Step 1
Ensure that your map image file and associated .tfw file are located in the
same directory, with the same file name.
Step 2
Click on the File menu and, from the Add Data submenu, select the Add
Data… button
or click the Add Data button on the toolbar. Figure 7.1
shows the Add Data dialogue that is launched.
Step 3
Locate the data you want to add as a new layer and select the Add button.
ADMS – ArcGIS Link User Guide
Page 25
SECTION 7 – Georeferencing images
Figure 7.1 – The Add Data dialogue screen.
Step 4
The image should appear in view in the correct location.
7.2 Set map coordinates using the georeferencing
toolbar
Coordinate systems can be set in ArcCatalog, which is opened by pressing the
button on the main toolbar. ArcCatalog helps you organise and manage all your GIS
information (maps, globes, datasets, models, metadata, services, and so on). It
includes tools for processing data and enables you to check that data will be added
with the correct format.
Once the ArcCatalog screen is open, as shown in Figure 7.2, locate the map image
file you wish to use in the Catalog Tree. An example map tile can be located in the
Data folder of the program install directory called SS79R.tif. Then either double click
the file name in the catalog tree, or right click the file name and select the
Properties… button. You will now see the Raster Dataset Properties window (Figure
7.3).
ADMS – ArcGIS Link User Guide
Page 26
SECTION 7 – Georeferencing images
Figure 7.2 – ArcCatalog screen.
Figure 7.3 – Raster Dataset Properties screen.
If no coordinate system has been set for this map tile, the Spatial Reference will be
<Undefined>. To set a coordinate system, select the Edit… button next to the Spatial
Reference heading to open the Spatial Reference Properties window (Figure 7.4).
From here, the coordinate system for your map tile can be set to a predefined
coordinate system by clicking Select…, an imported coordinate system by clicking
ADMS – ArcGIS Link User Guide
Page 27
SECTION 7 – Georeferencing images
Import..., or a new user-defined coordinate system by selecting New.... Once the
coordinate system has been selected, click OK to add it to the Raster Dataset
Properties page. Click OK to close the page.
For example, to set the coordinate system for the map file SS79R.tif, click on the
Select… button to select a predefined coordinate system. Select Projected Coordinate
Systems, then National Grids, Europe, British National Grid.prj, and then click the
Add button, as shown in Figure 7.5. This will return you to the Spatial Reference
Properties screen shown in Figure 7.4.
Figure 7.4 – The Spatial Reference Properties screen.
ADMS – ArcGIS Link User Guide
Page 28
SECTION 7 – Georeferencing images
Figure 7.5 – Selecting a coordinate system in the Browse for Coordinate System screen.
To add the map to the data view, drag and drop the map file name from the Catalog
tree to the Table Of Contents.
Once the map has been added, you may need to set the correct distance units in the
display. To do this, right click on the Layers Data Frame and select Properties… or
select the View menu and click Data Frame Properties…. This opens the data frame
properties screen, shown in Figure 7.6. Select the General tab and change the Map
Units and Display Units appropriately, e.g. Meters for SS79R.tif, then select OK.
Figure 7.6 – The Data Frame Properties screen.
ADMS – ArcGIS Link User Guide
Page 29
SECTION 7 – Georeferencing images
Once the units have been set, you will need to georeference your map tile so that the
correct coordinates and scale are set. If you know the correct map coordinates of two
reference points on your map tile, then this can be done using the Georeferenceing
toolbar. To open this toolbar, right click anywhere on the main toolbar then select
Georeferencing from the menu. The Georeferencing toolbar will appear, as shown
in Figure 7.7.
Figure 7.7 – The Georeferencing toolbar.
To set the reference points, select the Add Control Points button
. Click the first
reference point on your image, e.g. the bottom left corner of the map for SS79R.tif,
before clicking any other point on the screen. This will highlight the control point by
a red cross, as shown in Figure 7.8. Repeat this procedure for the second reference
point, e.g. the top right corner for SS79R.tif.
Figure 7.8 – Selecting georeference points in the ArcMap data view screen.
Now click the View Link Table button
to view the selected coordinates and their
links, as shown in Figure 7.9. Enter the correct map coordinates for your reference
points in the X Map and Y Map boxes. For example, the map coordinates for SS79R.tif
are: (271000,194000) for the bottom left corner, and (276000,199000) for the top
right corner. This tells ArcMap to move the point defined by the X and Y source
coordinates to the X and Y map coordinates. Click OK to set the reference points.
ADMS – ArcGIS Link User Guide
Page 30
SECTION 7 – Georeferencing images
Figure 7.9 – The Link Table screen.
The image will now have been set to the correct position. Right click on the map
layer and select Zoom To Layer to centre the data view on the map. If you move the
mouse around over the image and look at the coordinates in the bottom right corner
of the screen you will see that they are now shown in the correct coordinates. Select
the Georeferencing drop down menu and select Update Georeferencing. This removes
the red crosses that were created. If you look in the same folder as the image file you
will see that a .tfw file has been created to retain the information about the projection.
ADMS – ArcGIS Link User Guide
Page 31