1
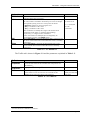
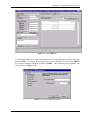
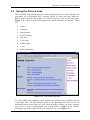
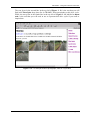
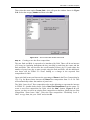
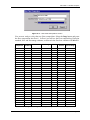
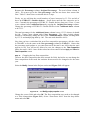
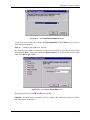
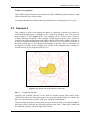
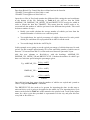
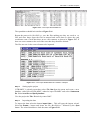
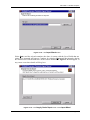
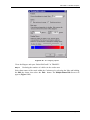
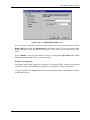
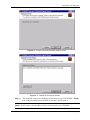
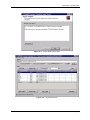
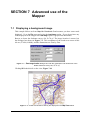
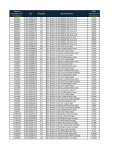
TRAMEC
Department for Transport
TRAMAQ Emissions Calculator
User Guide
TRAMEC
The Department for Transport’s
Traffic Management and Air Quality (TRAMAQ)
Emissions Calculator
User Guide
Version 1.0.0, September 2004
Cambridge Environmental Research Consultants Ltd.
3, King’s Parade, Cambridge, CB2 1SJ
Tel: 01223 357773 Fax: +44 1223 357492
Email: [email protected] Web: www.cerc.co.uk
Contents
SECTION 1
Introduction to TRAMEC
1.1 About the TRAMAQ Research Programme ..............................................................1.1
1.2 About the TRAMEC emissions calculator ................................................................1.1
SECTION 2
Getting Started
2.1 About this User Guide ...............................................................................................2.1
2.2 User Interface conventions ........................................................................................2.2
2.3 System requirements..................................................................................................2.2
2.4 Installing TRAMEC...................................................................................................2.2
SECTION 3
Using the Emissions Calculator
3.1 Launching TRAMEC .................................................................................................3.1
3.2 The TRAMEC screens...............................................................................................3.5
3.3 Using the Picture book.............................................................................................3.10
SECTION 4
Using the Mapper
4.1 Starting the TRAMEC Mapper..................................................................................4.1
4.2 The menu bar .............................................................................................................4.2
4.3 The TRAMEC Mapper toolbar..................................................................................4.3
4.4 The TRAMEC Mapper Windows..............................................................................4.5
4.5 Viewing and editing data using the TRAMEC Mapper ............................................4.7
SECTION 5
Worked examples
5.1 Example 1 ..................................................................................................................5.1
5.2 Example 2 ................................................................................................................5.11
SECTION 6
Importing data
6.1 Preparing the data files ..............................................................................................6.1
6.2 Importing the road link data ......................................................................................6.5
SECTION 7
Advanced use of the Mapper
7.1 Displaying a background image ................................................................................7.1
7.2 Copying and Saving the Map View ...........................................................................7.2
7.3 Editing, copying and pasting the legend ....................................................................7.2
7.4 Adding a north arrow to the Map View .....................................................................7.3
SECTION 8
Exporting data
8.1 Exporting to ArcView shape files..............................................................................8.1
8.2 Exporting emissions to ADMS-Urban.......................................................................8.2
APPENDIX A Import codes for the picture book
A.1 Introduction............................................................................................................... A.1
A.2 TRAMAQ emission datasets .................................................................................... A.1
TRAMEC User Guide
Page 1.1
SECTION 1 Introduction to TRAMEC
1.1 About the TRAMAQ Research Programme
The TRAMEC emissions calculator is a software tool for local authority air quality and
traffic management teams that has been created as part of the DfT’s Traffic
Management and Air Quality (TRAMAQ) programme, project UG218. The UG218
project team comprised TTR (Transport and Travel Research Ltd.), CERC (Cambridge
Environmental Research Consultants) and Millbrook. CERC are responsible for the
distribution and support of the software tool.
The TRAMAQ research programme began in 1998 and is due to finish in 2004. It
researched the effects of traffic management schemes on air quality and vehicle
emissions i.e. the effect of schemes on driver behaviour that in turn affects vehicle
operation, emission rates and pollutant concentrations.
The various TRAMAQ projects have covered the following topics:
•
Traffic management including during high pollution episodes
•
Emission measurements
•
Traffic composition
•
Cold start emissions
•
Sources of particulate matter
•
Primary NO2 emissions
•
Vehicle operating profiles
•
Driver behaviour
•
Emissions modelling
For further details about the TRAMAQ research programme see the DfT web site:
www.dft.gov.uk/stellent/groups/dft_roads/documents/page/dft_roads_508003.hcsp
1.2 About the TRAMEC emissions calculator
TRAMEC, the TRAMAQ Emissions Calculator, is an emissions model that allows
users to take into account the impact of traffic management schemes on vehicle
emissions. There are 37 different traffic management schemes or drive cycles
developed under TRAMAQ project UG214. The main categories are:
TRAMEC User Guide
Page 1.1
SECTION 1 –Introduction to TRAMEC
•
speed humps
•
traffic calming
•
bus lanes
•
cycle lanes
•
traffic lights
•
1-way flow
•
mini-roundabouts
The scheme closest to the actual scheme can be selected using the TRAMEC Picture
book which contains series of photographs. When a drive cycle is selected, the model
calculates the corresponding emissions. The HGV emissions were measured as part of
the TRAMAQ project UG216. For all other vehicles the NAEI average speed
emissions are used.
TRAMEC User Guide
Page 1.2
SECTION 2 Getting Started
2.1 About this User Guide
This TRAMEC User Guide is both a manual and a technical summary.
Section 2
gives details of document and interface conventions and
instructions on how to install TRAMEC
Section 3
is an introductory guide to using TRAMEC. It explains the userdefined input parameters for each screen option, basic
manipulation of the data and use of the Picture book
Section 4
is a guide to using the TRAMEC Mapper
Section 5
contains worked examples which you should work through in
order to become familiar with TRAMEC
Section 6
describes how to use the Import Wizard as a rapid way to import
data about many road links
Section 7
describes some more advanced use of the Mapper
Appendix A
describes the sources of the emissions data used by TRAMEC
2.1.1 User Guide conventions
To make this User Guide simpler to use, certain conventions have been followed
with regard to layout and style.
•
Keys that you need to press are written in BOLD CAPITAL
LETTERS, like this: the ENTER key.
•
Anything you need to type is written in a computer-style typeface,
like this: Type install at the command prompt.
•
All interface controls, including the menus and their options, are shown
in a bold sans-serif style, e.g. the Plot button, the Select installation type
dialogue box, the New Scenario… option from the File menu.
•
All file, directory and path names are shown in italics, e.g. Sample.mdbc,
C:\TRAMEC.
•
Any additional useful hints and pieces of information are written as
notes, like this:
Use the Table of Contents to find your way around this User Guide.
TRAMEC User Guide
Page 2.1
SECTION 2 –Getting Started
•
References to other sections of the TRAMEC User Guide are shown like
this: See Section 4.2.
•
References to other documents are written in italics, like this: See the
ArcView Tutorial for further guidance.
2.2 User Interface Conventions
In the user interface there are some options where the user can specify different sets of
parameters for the model to use and switch between them.
Greyed data items are uneditable, and usually calculated by the model.
2.3 System requirements
TRAMEC requires a Pentium PC with at least 128 Mbytes of RAM, running Microsoft
Windows 98, NT 4.0, 2000 or XP. There must be at least 500 Mbytes of disk space
free.
A monitor with a colour resolution of greater than 256 colours is required.
You will find it useful to ha ve access to a printer.
2.4 Installing TRAMEC
To install follow the step-by-step procedure described below. Note that on some
operating systems you may be prompted to restart your computer during this procedure.
If this occurs the installation will resume automatically following the restart
Step 1
If you are running Windows NT, 2000 or XP, log on to your PC as
Administrator. Note that if you are prompted to restart your computer during
the install you should log in again as Administrator.
Step 2
Insert the installation CD into your CD-ROM drive.
Step 3
If your computer is set up to auto-run CDs, then the installation program will
start automatically on closing the drive. Otherwise click on the Windows
Start menu button, select Settings and then Control Panel . Double-click on
Add/Remove Programs and then click on the Install… button and Browse to find
setup.exe on the CD. Click on Finish .
Step 4
Follow the instructions given by the TRAMEC Installation Wizard.
TRAMEC User Guide
Page 2.2
SECTION 3 Using the Emissions
Calculator
This section guides you around the TRAMEC interface and explains how to enter data, use
the Picture book to select a drive cycle, calculate emissions and change parameters to test
different traffic management scenarios.
3.1 Launching TRAMEC
Double-click on the TRAMEC icon to launch the program. When TRAMEC opens you
have the choice of opening an existing file or creating a new file, Figure 3. 1.
Figure 3. 1 – Select whether to open an existing file or create a new file
3.1.1 Opening and viewing an existing database
To open an existing file select Open an existing file when the screen shown in
Figure 3. 1 appears. Navigate to the file you want to open. (Sample.mdb is an
example file supplied on the TRAMEC CD in the TrainingMaterial directory
that you could open if you have no other files prepared.) When TRAMEC has
opened the file you will see a screen similar to that in Figure 3. 2.
At the top of the screen is the Menu bar where you will see the File , Data and Help
menus. Table 3. 1 lists the commands available from the menu bar.
Under the Menu bar there is a section for the Project settings i.e. those
parameters that are common to all the road links in the file. This section
includes:
•
a Title which may be up to 255 characters long. You should try to record
information here about the data in this file that will remind you when you
reopen the file what was being calculated.
TRAMEC User Guide
Page 3.1
SECTION 3 –Using the Emissions Calculator
•
Specifying shows whether this file specifies road link Locations i.e. road
geometry, or link lengths, Lengths.
•
Fleet Component shows whether this file uses Level 1 (3 vehicle categories)
or Level 2 (8 vehicle categories)
•
Factors, the Emission factors being used, whether they are the NAEI Average Sp eed
factors or TRAMAQ UG216. The TRAMAQ UG216 factors use the detailed HGV factors
for the different drive cycles (traffic management schemes).
•
Year, the year of the Emission Factors and Fleet Composition
•
The Modify… button lets the user change the Factors and/or Year for this file.
Figure 3. 2 – an existing file which has been opened in TRAMEC
Menu
Command
Explanation
File
New
Resets the data parameters to their default values,
starting a new database
Open
Allows you to open a previously saved model file
Close
Closes the current database
Mapper
Launches the TRAMEC Mapper
Compact database
Compacts the TRAMEC database
Exit
Quits TRAMEC
Diurnal periods
Here the user defines the diurnal profile, percentage of
the day for the AM peak, PM peak and off-peak counts.
The diurnal profile defined here is applied to all roads
Fleet compositions
Displays all the fleet compositions, those supplied as
default data and those created here by the user
Data
TRAMEC User Guide
Page 3.2
SECTION 3 –Using the Emissions Calculator
Help
Emission factors
Displays the emission factor data. These cannot be
changed by the user
About…
Displays information about the model version
Table 3. 1 – Commands available from the TRAMEC Menu bar
After the Project parameters there is a section of the screen containing data on the
Links . This section includes:
•
a table that shows the Name of each road link, Length in metres, the
average number of Vehicles/Hour , Fleet Composition and then the emissions
of CO, NOX, PM10 , VOC and CO2 in tonnes per year (t/yr). There is one
row for each road link. The final row of the table shows the TOTALS from
all the road links.
•
The Add Link… button adds a new row to the table for a new road link.
This will automatically open the more detailed screen for that link.
•
The Delete Link… button deletes a row from the table, deleting the data for
that road link
•
The Edit… button allows you to edit the data for a highlighted link.
Double clicking on the row you wish to edit also opens the details for
that link.
•
The Diurnal period displays the period relating to the emission totals
displayed in the table. Choose from the drop down list whether to view
the AM peak, PM peak, Off-peak or Overall . When AM Peak is selected here
the emissions shown will be the annual emissions due to the AM Peak
period and similarly when PM Peak and Off-peak are selected. The Overall
emissions are the sum of the emissions over the 3 periods.
At the bottom of the screen are four buttons:
•
Import Links... launches the Import Wizard to import road link data from
ArcView shp, MapInfo mif and csv text files which is described in more
detail in Section 6.
•
Export Links... gives the user the choice of exporting the road link data to
an ArcView shp file or to an ADMS-Urban (dispersion model) emissions
inventory. See Section 8.
•
Copy Table copies the table, for instance for pasting into Excel or a
document for reporting
•
Calculate... calculates the emissions for each road link and gives the total.
After changes to any road link or to the overall project parameters the
emissions will be deleted from the table and it will be necessary to
recalculate the emissions by clicking this button.
TRAMEC User Guide
Page 3.3
SECTION 3 –Using the Emissions Calculator
3.1.2 Creating a new file
To create a new file select Create a new file when the screen shown in Figure 3. 1
appears. You are then prompted to name the file you are about to create, Figure
3. 3.
Figure 3. 3 – Naming a new file
You then are asked two questions. Firstly, you are asked to choose whether to
use 3 traffic counts (Level One: light vehicles, heavy vehicles, motorcycles) or 8 traffic
counts (Level Two: motorcycles, petrol cars, diesel cars, petrol LGV, diesel LGV, rigid
HGVs, articulated HGVs, buses), Figure 3. 4
Figure 3. 4 – Select 3 or 8 traffic counts, Level One or Level Two
When you have selected Level One or Level Two you are asked whether you will
specify just the length of each road link, Specify lengths , or if you will specify the
location of the road links, Specify locations, Figure 3. 5.
TRAMEC User Guide
Page 3.4
SECTION 3 –Using the Emissions Calculator
Figure 3. 5 – Choose whether to specify lengths or locations
After selecting to specify lengths or specify locations you will see a screen
similar to that shown in Figure 3. 6. You are now ready to add data to
TRAMEC and calculate emissions, as described in Section 3.2.
Figure 3. 6 – A new file just created in TRAMEC
3.2 The TRAMEC screens
Clicking Add Link… on the main TRAMEC screen brings up the screens for a new road
link, as shown in Figure 3. 7. The parameters from the left hand side of the window are
described in Table 3. 2 and the parameters on the Geometry tab are described in Table
3. 3.
TRAMEC User Guide
Page 3.5
SECTION 3 –Using the Emissions Calculator
Figure 3. 7 – The Source data screen and Geometry tab
SCREEN AREA
Source Name
Year
Length (m)
Vehicles per
hour
Drive Cycle
Location
Close
Cancel
Apply
DESCRIPTION OF FUNCTION
Allows the source name to be defined/edited. The name must be
unique within the database. If this screen has been launched
when adding a new source to a group, the name will need to be
changed from the default, which is simply based on the current
date and time.
Year associated with the parent group, which therefore applies to
all the sources it contains.
The length of the road in metres. This value is calculated by
TRAMEC using the vertices data (see the Vertices tab) or entered
by the user.
Enter AM Peak, PM Peak and Off-peak counts. If you just
have AADT enter AADT/24 in each of the 3 boxes. The overall
Average is calculated automatically.
Select the driving cycle for the road from the drop-down list box
of options that correspond to those shown in the Picture book. To
look at the drive cycles in the picture book select the Picture
Book… button.
A text description of the location of the road.
RESTRICTIONS
Up to 20 characters.
Not editable.
Editable if the user
is specifying road
link length.
Up to 200
characters.
Save any changes, close this screen and return to the calling
screen, e.g. the TRAMEC link screen.
Reject changes to data (that have not been saved using the Apply
button).
Update the screen as a result of changes to data but do not close
the screen.
Table 3. 2 – The Source data
TRAMEC User Guide
Page 3.6
SECTION 3 –Using the Emissions Calculator
Geometry tab
DESCRIPTION OF FUNCTION
Road Width (m) The width of the road in metres.
Elevation (m)
The height of the road above the ground in metres. This is
Canyon Ht. (m)
Gradient
usually zero, but is non-zero for overhead by-passes, etc.
The average height of buildings at the side the road in metres.
This is needed in urban areas when the emissions data are to be
used in a dispersion calculation using ADMS-Urban.
Gradient of road in per cent.
RESTRICTIONS
5m ≤ x ≤ 100m
0 ≤ x ≤ 2000m
0 ≤ x ≤ 100m
0 ≤ x ≤ 50%
Table 3. 3 – The Geometry tab
The Vertices tab is shown in Figure 3. 8 and the parameters are explained in Table 3. 4.
Figure 3. 8 – The Vertices tab
TRAMEC User Guide
Page 3.7
SECTION 3 –Using the Emissions Calculator
Vertices tab
Edit Vertices
<Table>
Add
Delete
DESCRIPTION OF FUNCTION
This check box must be checked in order to edit the vertices data
contained in the table (see below).
The table lists the vertices for the road, listed in sequence along
the road, which is assumed to be made up of a series of straightline segments joining successive vertex points in the list.
Sequence: Number of vertex along the road.
X(m): x-coordinate of the vertex
Y(m): y-coordinate of the vertex
The coordinates are usually the 6-figure OS National Grid
coordinates of the point (i.e. Eastings and Northings,
respectively), or 7-figure UTM 1 coordinates.
If the vertices data are modified, the road length may be
recalculated by means of the Apply button.
When Edit Vertices is checked, this button adds a vertex (row) to
the list of vertices above the vertex where the cursor is currently
positioned.
When Edit Vertices is checked, this button deletes the vertex
(row) from the list of vertices where the cursor is currently
positioned.
RESTRICTIONS
Maximum number
of vertices is 50.
0 ≤ x ≤ 9,999,999
for both
coordinates.
Table 3. 4 – The Vertices tab
The Traffic tab is shown in Figure 3. 9 and the parameters explained in Table 3. 5.
Traffic tab
Fleet
composition
View fleet
composition …
<Table>
DESCRIPTION OF FUNCTION
The drop-down list box allows the fleet composition for this
road to be selected from the available fleet compositions for
this database.
Displays the Fleet composition screen.
The table percentage of the fleet in each Fleet component.
There will be 3 rows if Level One was selected for this
database and 8 rows if Level Two was selected.
RESTRICTIONS
0 ≤ x ≤ 2.4×10⁶
veh/day for each fleet
component.
Table 3. 5 – The Traffic tab
1
Universal Transverse Mercator coordinates.
TRAMEC User Guide
Page 3.8
SECTION 3 –Using the Emissions Calculator
Figure 3. 9 – The Traffic tab
To edit detailed data for a single road link select the road link from the main screen and
then click Edit… To change the parameters for several road links at once use the SHIFT
key to select multiple road links and then click Edit… this will bring up the multiple edit
screen shown in Figure 3. 10.
Figure 3. 10 – The multiple edit screen
TRAMEC User Guide
Page 3.9
SECTION 3 –Using the Emissions Calculator
3.3 Using the Picture book
The TRAMAQ Picture book helps users select an appropriate drive cycle, and hence the
appropriate set of TRAMAQ HGV emission factors, for their road link. When the
Picture book is launched by opening PictureBook.html users first see the Index page,
Figure 3. 11. There are nine main categories for which emissions are supplied. These
are:
•
Urban
•
Suburban
•
Speed humps
•
Traffic calming
•
Bus lanes
•
Cycle lanes
•
Traffic lights
•
1-way
•
Mini-roundabouts
Figure 3. 11 – The Picture book index
To assess which road condition is most suitable users should select a scheme from one
of the hyper links. The links listed in purple on the right hand side of the screen will
position the main screen at the top of the selected category. When you select a scheme
you will see a series of photographs such as that shown in Figure 3. 12. Double
clicking on any of the images brings up an enlarged view, as in Figure 3. 13.
TRAMEC User Guide
Page 3.10
SECTION 3 –Using the Emissions Calculator
The text given in the second line in the top left of Figure 3. 12, is the text that you will
find in the Drive Cycle drop down list in TRAMEC that corresponds to this drive cycle.
While, the text given in the fourth line in the top left of Figure 3. 12, labelled as Import
code, is the text that you will need to use to represent this drive cycle if you want to
import data.
Figure 3. 12 – An example series of photographs, here for a cycle lane
TRAMEC User Guide
Page 3.11
SECTION 3 –Using the Emissions Calculator
Figure 3. 13 – Enlarged image from the cycle lane series of photographs
other way of viewing the drive cycle pictures is the select the Picture Book… button
shown on the detailed link screen see Figure 3. 9. This will open the pictures for the
drive cycle that you have selected.
The
TRAMEC User Guide
Page 3.12
SECTION 4 Using the Mapper
The TRAMEC Mapper can be used to display the data held, to colour shade the road links
according to their emission rate, to select road links and edit link properties one link at a time.
4.1 Starting the TRAMEC Mapper
To launch the Mapper select File, Mapper from the TRAMEC menu bar, or double click
the Mapper icon,
, on the desktop. Use File, Open database from the menu bar, or
click the Open icon,
, to open a TRAMEC database, see Figure 4. 1.
Figure 4. 1 – The TRAMEC Mapper after opening a database
Click on the + sign to expand the Road links folder on the left of the screen and show the
list of fleet compositions. Many databases will only have one fleet composition listed
here if the user has specified that all roads have the same vehicle fleet mixture.
Clicking on the names of fleet compositions displays the roads with each composition in
different colours, Figure 4. 2.
TRAMEC User Guide
Page 4.1
SECTION 4 –Using the Mapper
Figure 4. 2 – Mapper with roads of different fleet composition displayed
The Mapper consists of the Menu bar and tool bar at the top of the window and then the
Database Explorer, Map View and Selections windows. These are described in more detail
in Sections 4.4.1 to 4.4.3 respectively.
The relative size of the Database Explorer , Map View and Selections windows can be
changed by clicking and dragging the separators above the relevant window.
Section 4.5 describes how the Mapper can be used to display data and edit road link
data.
4.2 The menu bar
There are two menus: File and View. The File menu options allow the opening of database
files, the import of background image files, and gives the user the option to Exit the
TRAMEQ Mapper. The View menu options allow the user to change the display: for
example, background images such as TIFF files can be switched on and off. In addition,
the View menu gives the options to copy the Map View to the clipboard, or save the map to
a file. The menu options are summarised in Table 4. 1.
TRAMEC User Guide
Page 4.2
SECTION 4 –Using the Mapper
Menu
File
View
Option
Use
Open Database…
Allows the user to browse for a TRAMEC database to open.
Load Image…
Loads a background image file (TIFF, JPEG, CompuServe GIF
and BMP formats accepted). This is explained in more detail in
Section 7.
Exit
Exits the TRAMEC Mapper.
Show Source List
Makes the Selections window visible/invisible.
Show North Arrow
Makes the north arrow visible/invisible.
Show Images
Makes any background images visible/invisible.
Save Map View…
Allows the user to save the sources and images currently
displayed in the Map View as a BMP file.
Save Map View (high
resolution)… **
As above, except the Map View is saved to a higher resolution.
Copy Map View…
Allows the user to copy the sources and images currently
displayed in the Map View to the clipboard, for pasting into other
packages such as Microsoft Word.
Copy Map View (high
resolution)… *
As above, except the Map View is copied to a higher resolution.
Refresh Map
Refreshes the contents of the Map View window, for instance
after editing data in the TRAMEC interface. Note that if new
groups or inventories have been added in the TRAMEC
interface these will not be displayed unless the database is
reopened in the Mapper.
*The ‘high resolution’ maps contain significantly more data than the standard maps; these actions therefore
require more computer memory and may be slow if running on a minimum specification PC.
Table 4. 1 – Menu options in the TRAMEC Mapper.
4.3 TRAMEC Mapper Toolbar
The toolbar contains buttons for controlling the display and selection of the source data.
The TRAMEC Mapper tools are summarised in Table 4. 2. Section 4.5 shows how
these tools are used to view and manipulate data.
Right clicking on the toolbar allows the user to turn on or off the text that appears on the
buttons of the toolbar, but most users will find it helpful to have the text on the buttons
as a reminder of what they do. As an additional reminder, as you move the cursor
across the tool bar, tooltips appear below the buttons give more detail about the function
of each button.
TRAMEC User Guide
Page 4.3
SECTION 4 –Using the Mapper
Mapper
Tool
Map
Cursor
Use when activated
n/a
Allows the user to browse for a TRAMEC database to open.
(It has the same effect as the menu option File, Open
TRAMEC Database...)
n/a
Enable/disable editing tools. When the Edit DB button is
down (depressed) data for a selected source can be changed
The cursor changes to a small box in which part of the source
to be selected must be placed. A single click on the source
selects it and displays the source name in the Selections
window. Selected sources are shown in red
When Edit DB is on, double clicking on a source displays the
TRAMEC link form for that source.
This button allows the selection of sources within a specified
polygon. A left click on the mouse defines the vertices of a
closed polygon; a right click signals the last vertex. Sources
must be wholly contained within the polygon to be selected.
This button allows the selection of sources within a specified
circle. It operates in a similar way to the Area tool. Click
and drag the mouse to define the circle. Release the mouse
button to complete the selection. Sources must be wholly
contained within the circle to be selected.
Allows the user to move the map around within the Map
View window, allowing different parts to be viewed. The
map remains at the same scale.
This tool allows the user to ‘zoom in’ on the Map View
window. A single mouse click within the Map View window
causes a magnified display of the region clicked. You can
also click and drag the mouse to zoom to a particular
rectangle.
When the cursor is positioned within the Map View window
a mouse click causes the display centred at the click to be
shrunk (‘zooming out’).
TRAMEC User Guide
Page 4.4
SECTION 4 –Using the Mapper
This tool can be used to measure distances in the Map View
window. The first click on the left mouse button indicates
the starting point of a line to be measured; subsequent clicks
define vertices on the line, and a right mouse click indicates
the end of a line. The total length of the line in metres is
given in the status bar at the bottom of the Mapper window.
n/a
This button ‘zooms’ the Map View window to show all
sources in the currently visible groups.
n/a
This button ‘zooms’ the Map View window to show all
sources in the currently selected fleet composition.
Table 4. 2 – TRAMEC Mapper tools available on the toolbar.
4.4 The TRAMEC Mapper Windows
4.4.1 Database Explorer
The Database Explorer window, on the far left of the TRAMEC Mapper, displays
the contents of the current TRAMEC database, by fleet composition, using a
format very similar to the directory tree structure shown in Windows Explorer.
The display incorporates, at the bottom of the scheme, a key indicating the
colours and shading used to display each fleet composition in the Map View
window.
Clicking on a fleet composition within the Database Explorer window causes that
group of road links to be displayed. This is also indicated by the fleet
composition name being displayed in bold. Clicking on a fleet composition in
the Database Explorer window also causes that group of road links to become the
“active” group, and its name, together with the colour used to display it in the
Map View window, are shown in the box beneath the Database Explorer window .
If the database being displayed used road link Lengths , rather than Locations, the road
links will all be displayed as running east from (0,0). As no location data were entered
for the road links the Mapper will have limited use in this case.
Clicking on the coloured button pops up the Color palette dialogue box, Table 4.
2, so that the colour in which the sources are displayed can be changed.
The Visible check box may be used to show or hide the active group and in this
way the user can control what appears in the Map View window.
TRAMEC User Guide
Page 4.5
SECTION 4 –Using the Mapper
Figure 4. 3 - Colour palette dialogue box.
Clicking on the Options… button shows the Shading/filter controls screen, Figure 4.
4, which allows the user to display the active sources in terms of their emissions
of each pollutant. Firstly, sources can be filtered such that only those with
emissions above and below certain limits will be displayed in the Map View
window. Secondly, sources can be shaded in different colours, depending on
their emissions. This is a useful tool that can be used for investigating where
emissions are highest or as a rapid visual check to identify errors that may have
occurred during the compilation of the road links data.
Figure 4. 4 – The filtering and shading screen
The units used to scale the shading of source by emission are g/km/s.
TRAMEC User Guide
Page 4.6
SECTION 4 –Using the Mapper
4.4.2 Map View window
The Map View window is in the centre of the TRAMEC Mapper interface. This
window shows all visible sources. A background image is displayed if one has
been loaded. The selection tools,
,
and
, may be used in the Map View
window to edit sources and the pan,
, and zoom tools,
,
,
and
are used to view different areas. The location of the cursor in the Map View
window is given on the status bar (in metres).
Further details about displaying a background image, saving and copying data
from the Map View can be found in Section 7.
4.4.3
Selections window
This window lists all the sources from the active fleet component that are
currently selected. Selected sources are displayed in red in the Map View window.
4.5 Viewing and editing data using the TRAMEC Mapper
This section shows, by way of a worked example, how the TRAMEC Mapper can be
used to view and edit road link emissions data.
When viewing data the TRAMEC interface can be open at the same time as the Mapper.
However, to edit data, the Edit DB button must be down and when it is down the
TRAMEC interface cannot also be open.
Step 5
Start the TRAMEC Mapper, and open the Sample2.mdb database. Click on
Road links and the TRAMAQ Level 1 2004 fleet composition to display the group
of roads with this fleet composition.
Step 6
Use the Options… button to colour shade the roads from blue to green
according to emissions of NOX. You should now see a map like that shown
in Figure 4. 5.
Step 7
In this view, roads with higher emissions are indicated in green. One road
stands out as having a much higher emission than the others. This is not
expected and needs further investigation. Click the Select button,
, and
click on the road with the highest emission. The road will be highlighted in
red and its name will be displayed in the Selections window on the right of the
screen. It is the A465(T). We need to investigate whether the very high
emissions are correct or not by looking at the data held in TRAMEC.
Step 8
Press the Edit DB button,
, and double click the A465(T) road link so that
the TRAMEC data screen pops up. Go to the Traffic tab, Figure 4. 6.
TRAMEC User Guide
Page 4.7
SECTION 4 –Using the Mapper
Figure 4. 5 – Road links colour shaded according to emissions of NO X.
Figure 4. 6 – Traffic tab showing spurious HGV data
TRAMEC User Guide
Page 4.8
SECTION 4 –Using the Mapper
Step 9
In the Traffic tab, the traffic counts for the AM peak, PM peak and off-peak
periods seem reasonable, but the percentage of heavy goods vehicles, 92%,
seems to be incorrect. Checking the original data shows that the percentage
of HGVs should be 10%. Edit the percentage of HGVs to be the correct
value of 10% and then click Close to close the TRAMEC screen.
Step 10
The new emissions for the A465(T) won’t be displayed unt il the emissions
have been recalculated in TRAMEC. Press the Edit DB button,
, so it is no
longer “down”. Now open TRAMEC to view Sample2.mdb. You will see
that there are no emissions shown on the main screen, Figure 4. 7.
Figure 4. 7 – The main TRAMEC screen, emissions must be recalculated
Step 11
Click Calculate… to recalculate the emissions.
Step 12
Switch back to the Mapper by using the Windows Taskbar to make the
Mapper active, by clicking on a visible part of the Mapper or using
ALT+TAB as usual to switch between applications.
Step 13
Use File, Open database from the menu bar, or click the Open icon,
open Sample2.mdb.
Step 14
Use the Options… button as in Step 2 to colour shade the roads according to
NOX emission rate. The A465(T) no longer has a spuriously high emission
rate of NOX.
, to re-
A similar approach could be used to check the geometry of the road links against a
background map or aerial photo. If a road link was found to be incorrectly located, use
Edit DB to pop up the TRAMEC screen and edit the data on the Vertices tab.
TRAMEC User Guide
Page 4.9
SECTION 5 Worked examples
This section shows by way of worked examples, how to build a project using TRAMEC and
the Mapper. The first example is going to investigate the expected change in emissions to the
centre of Salisbury on the introduction of a new Park and Ride car park. The second example
is going to model the change in emissions by introducing a congestion charging area to a
central area of Bristol.
5.1 Example 1
We want to investigate the expected change in emissions in the centre of Salisbury
when a new Park and Ride scheme is introduced. The new park and ride will increase
the number of Park and Ride buses in circulation from 3 to 12. These will all be new
EURO IV double-decker buses. Road restrictions can also be introduced to ensure that
the buses travel as quickly as possible into and out of the centre.
Step 15
Setting up the project
Once you have opened TRAMEC you will be led through a series of set up screens.
Initially Figure 5.1 will appear where you have to choose either to create a new file or
open an existing file. In this case choose to create a new file by pressing the OK button.
Figure 5.1 – The screen that appears when you open TRAMEC
The screen in Figure 5.2 will then appear where you select the location in which to save
the database.
TRAMEC User Guide
Page 5.1
SECTION 5 –Worked examples
Figure 5.2 – A save dialog screen
In this case the database has been called “Salisbury.mdb”. Once the Save button is
pressed the Choose fleet components screen will appear Figure 5.3. This is the screen
where you select the type of traffic count data that you are going to use.
Figure 5.3 – The Choose fleet components screen
The choice is either Level One which consists of three vehicle counts for each link, light
vehicles, heavy vehicles and motorcycles, or Level Two which has eight vehicle counts
for each link, petrol cars, diesel cars, petrol LGV, diesel LGV, rigid HGV, articulated
HGV, motorcycles and buses and coaches.
For this example we have data for the eight vehicle counts so select Level Two and click
the OK button.
Finally the Road link options needs to be chosen, see Figure 5.4.
TRAMEC User Guide
Page 5.2
SECTION 5 –Worked examples
Figure 5.4 – The Road link options screen
TRAMEC has the capability to calculate emissions either based on the road length
without the need for geographical coordinates or by using the geographical coordinates.
In this case choose Specify lengths because we don’t have any detailed geographical
information about the roads and click OK.
At this point the database is created with the options you have chosen and it may take a
moment.
Give the project the Title “Salisbury city centre 2004”.
Step 16
Entering the road links
There are five roads that have been identified as having potential emission problems.
The road details are listed in Table 5.1.
Percentage of fleet composition
AM-peak PM-peak Off-peak
Length veh/hr
veh/hr
veh/hr
Exeter St
430
1493
1813
1231
Milford St
200
673
883
418
Fisherton St 475
641
789
602
Brown St
425
627
1163
863
Minster St
200
464
577
518
M/C
1.3
0.9
2.0
0.8
1.2
D car P LGV D LGV
12.4
1.2
7.1
12.8
1.0
6.2
11.2
1.6
10.0
11.9
1.1
6.9
11.2
1.1
6.8
Rigid Artic
3.4
0.3
3.6
0.0
4.5
0.2
7.6
0.1
8.6
0.2
Bus
2.3
1.1
5.3
2.1
5.9
Table 5.1 – Salisbury road data
Select the Add Link... button and enter the road details for Exeter Road from Table 5.1.
Leave the Road Width as the default of 5 meters and select the Traffic tab (Figure 5.5) to
enter the Fleet Compositions. When you have entered the data select Apply. Note that the
Average number of vehicles per hour is calculated and the number of Petrol Cars is
automatically generated.
TRAMEC User Guide
Page 5.3
P car
72.0
74.3
65.1
69.3
65.0
SECTION 5 –Worked examples
Figure 5.5 – The road link screen
Select Close and add the remaining four links in the same manner.
Step 17
Changing the diurnal period
The diurnal period needs to be adjusted to show the percentage of time for the different
periods. Select Data from the menu bar followed by the Diurnal Periods button and the
screen shown in Figure 5.6 will appear.
Figure 5.6 – The Diurnal period percentage screen
In Salisbury the AM peak period runs from 7am to 9am and the PM peak from 4pm until
6pm. The diurnal periods are based on a 24 hour clock so change the AM peak and PM
TRAMEC User Guide
Page 5.4
SECTION 5 –Worked examples
peak percentages to 8.33%. Notice how the Off-peak automatically adjusts. Select the OK
button.
Step 18
Changing the drive cycle
Open the picture book by double clicking on “PictureBook.htm” or by selecting the
Picture Book… button on the links screen. Each of the roads needs to have a specific drive
cycle. Currently the first drive cycle in the list will be selected if no alternative has been
chosen.
Select a drive cycle by examining the pictures and using the descriptions given below.
Exeter Street – a two way street running from a large roundabout on the ring road to
the city centre. There is a side road on the right hand side about one third of the way
down as you head towards the centre. There are no bus lanes or calming features and the
speed limit is 30 m/h.
Milford Street - a two way street linking the centre to the ring road on the east side of
the city centre. There is a crossroads halfway down. There are no bus lanes or calming
features and the speed limit is 30 m/h.
Fisherton Street – a two way street running from a mini roundabout near the station
towards the centre. There are two table speed bumps with zebra crossings and the speed
limit is 20 m/h.
Brown Street – a one-way street running out of the centre. It has a crossroads halfway
down and no other road features, but has a school on it so becomes congested with the
school run and the speed limit is 30 m/h.
Minster St – a one-way street in the heart of the centre and the speed limit is 30 m/h.
Return to TRAMEC and select a link by either double clicking on it or selecting the link
and pressing the Edit… button. Select the most appropriate drive cycle from the
dropdown list on the left of the link data screen. Select Apply and Close.
Figure 5.7 – The list of Drive Cycles
If more than one link has the same drive cycle then you can select multiple links by
holding down the Shift key, then selecting Edit…. This will open the Multiple Source Edit
screen (Figure 5.8).
TRAMEC User Guide
Page 5.5
SECTION 5 –Worked examples
Figure 5.8 – The Multiple Source Edit screen
Select the Data Field, Drive Cycle and then select the appropriate drive cycle from the drop
down. When you select OK this will change all the sources you had selected.
Step 19
Calculating the results
Return to the main screen and select the Calculate… button. This will calculate the
emissions for all the periods. Select the AM peak from the Diurnal period drop down menu
and select the Copy Table button. Open Excel and select the Paste button.
If any values are larger than 1000 then Excel will automatically display them in
scientific notation. To change this to a standard format, select the cells that you which
to change or select the whole spreadsheet by clicking on the square between the A and 1
as shown in Figure 5.9.
Notice that the diurnal period, emission factors, year, fleet composition and level have
been copied along with the link information. Return to TRAMEC, change the Diurnal
period to PM peak and copy these results. Repeat this process for all the periods and
examine them in Excel. You should note that the Overall period is the sum of the other
three periods.
Figure 5.9 – Highlighting a worksheet in Excel
TRAMEC User Guide
Page 5.6
SECTION 5 –Worked examples
Then select the menu option Format, Cells… this will open the window shown in Figure
5.10. Select the category Number and then select OK.
Figure 5.10 – The Format Cells window from Excel
Step 20
Creating a new bus fleet composition
The new Park and Ride is expected to be introduced by 2006. There will be an increase
of 9 buses in circulation throughout the day travelling to and from the centre and the
Park and Ride. This will increase the overall number of buses by 33% and reduce the
number of petrol cars due to more people using the Park and Ride. All the additional,
new buses will be EURO IV+ buses leading to a change in the expected fleet
composition for 2006.
Open each link in turn and increase the percentage of Buses in the Fleet Composition by
33%. E.g. for Brown Street increase the Buses fleet composition from 2.1 to 2.8. This
will automatically reduce the number of petrol cars.
The 2006 “lower level” fleet composition also needs adjusting to represent the increase
in EURO IV+ double-decker buses. Select Data, Fleet Compositions from the menu. To
create a new fleet composition for 2006, select the New… button. Figure 5.11 will
appear, you have to select an existing fleet composition to build on. Name the new fleet
composition “Extra buses 2006”, select the fleet composition “TRAMAQ Level 2
2006” to copy from, the year “2006” and select OK.
TRAMEC User Guide
Page 5.7
SECTION 5 –Worked examples
Figure 5.11 – New Fleet Composition screen
You are now ready to select the new fleet composition. Select the Copy button and paste
the fleet composition into Excel. In Excel you will see the Fleet composition, Emission
standard, Size and Percentage columns, as shown in the first four columns of Table 5.2.
Fleet
Emission
component standard
Buses
Buses
Buses
Buses
Buses
Buses
Buses
Buses
Buses
Buses
Buses
Buses
Buses
Buses
Buses
Buses
Buses
Buses
Buses
Buses
Buses
Buses
Buses
Buses
Buses
Buses
Buses
Buses
Pre-1988
Pre-1988
Pre-1988
Pre-1988
1988-1993
1988-1993
1988-1993
1988-1993
EURO I
EURO I
EURO I
EURO I
EURO II
EURO II
EURO II
EURO II
EURO III
EURO III
EURO III
EURO III
EURO IV
EURO IV
EURO IV
EURO IV
EURO IV+
EURO IV+
EURO IV+
EURO IV+
Size
Percentage
<17 seats
17 to 35 seats
>35 seats
Double decker
<17 seats
17 to 35 seats
>35 seats
Double decker
<17 seats
17 to 35 seats
>35 seats
Double decker
<17 seats
17 to 35 seats
>35 seats
Double decker
<17 seats
17 to 35 seats
>35 seats
Double decker
<17 seats
17 to 35 seats
>35 seats
Double decker
<17 seats
17 to 35 seats
>35 seats
Double decker
0.06
0.53
1.49
0.86
0.10
0.91
2.57
1.48
0.14
1.33
3.76
2.17
0.64
6.08
17.18
9.92
0.92
8.69
24.55
14.17
0.05
0.44
1.24
0.72
0.00
0.00
0.00
0.00
Additional
New
buses
percentage
Total
0.06
0.53
1.49
0.86
0.10
0.91
2.57
1.48
0.14
1.33
3.76
2.17
0.64
6.08
17.18
9.92
0.92
8.69
24.55
14.17
0.05
0.44
1.24
0.72
0.00
0.00
0.00
33.33
133.33
0.04
0.40
1.12
0.65
0.07
0.68
1.93
1.11
0.11
1.00
2.82
1.63
0.48
4.56
12.89
7.44
0.69
6.52
18.41
10.63
0.03
0.33
0.93
0.54
0.00
0.00
0.00
25.00
100.00
Table 5.2 – Original percentage and new percentage for the bus fleet composition
TRAMEC User Guide
Page 5.8
SECTION 5 –Worked examples
Rename this Percentage column, Original Percentage. The total of that column is
100%. We want to get to the New percentage, after the new buses have entered the
fleet. Table 5.2 shows how to calculate this in 2 steps.
Firstly, we are told that the overall number of buses increases by 33.33% and all of
these are EURO IV+ Double deckers . Scroll down until the bus categories are in
view. Currently the percentage of EURO IV+ Double deckers (last row) is zero. Create
a new column called Additional buses by copying the Original Percentage column.
Change the percentage of EURO IV+ Double deckers in the Additional buses column
to be 33.33.
The total percentage for the Additional buses column is now 133.33 whereas it should
be 100. Create a new column called New Percentage. The values in this column
should be calculated by taking the ones in the Additional buses column, dividing them
by 133.33 and multiplying them by 100. The new total should be 100%.
Now that you have recalculated the new fleet composition percentages, edit the values
in TRAMEC to be the same as the New percentage column in Table 5.2. Notice that
the percentage total updates as you enter data and if the total is not 100% then the total
appears in red. You will not be allowed to save the changes to the Fleet Composition
unless the total is 100%. Once all the values have been entered select Apply and Close the
Fleet Composition screen.
Step 21
Changing the bus fleet composition
The new bus fleet composition has been created for 2006, but before we can change the
fleet composition of the roads the emission factors need to be changed to be the same
year.
Select the Modify…button in the Project section and Figure 5.12 will appear.
Figure 5.12 – The Modify project properties screen
Change the year to 2006 and select OK. The fleet composition now needs to be changed
to a 2006 composition (Figure 5.13). Select “Extra buses 2006” from the drop down
menu and select OK.
TRAMEC User Guide
Page 5.9
SECTION 5 –Worked examples
Figure 5.13 – The Select Fleet Composition screen
If you now open a link and examine the Fleet Composition in the Traffic tab you will see
that it has been changed.
Step 22
Changing the number of vehicles
By 2006 the total number of vehicles is expected to increase by 10%. Select all the links
and click the Edit… button and change the Hourly Count to be 110% of the present value,
then select OK (Figure 5.14).
Figure 5.14 – The Multiple Source Edit screen
Repeat the process for the PM and Off peak periods.
Calculate… the totals and copy them to Excel. Compare the emissions to those for 2004,
has there been a reduction?
TRAMEC User Guide
Page 5.10
SECTION 5 –Worked examples
Further investigations:
If the NAEI emission factors were used instead of the TRAMAQ emission factors, what
effect would this have on the results?
Investigate the difference made to the emissions factors by changing the drive cycles.
5.2 Example 2
This example is going to investigate the change in emissions to Bristol city centre if a
congestion-charging zone is introduced. The congestion charging zone will cover an
area of about 1.5 km2 (Figure 5.15). The charging will be in place from 7.30am to
6.30pm, Monday to Saturday. The charging will be staggered with a more expensive
charge in the AM and PM peak periods and a reduced charge in the middle of the day. It
is expected that the introduction of the charge will cause a 25% reduction in traffic in
the peak periods and a 15% reduction in the middle of the day. There is expected to be
an increase in traffic in the charging area outside of the charging times causing an
overall increase in the off peak period by 15%.
Figure 5.15 – Bristol city centre with the cordon area
Step 1
Organising the data
Currently the available data are in the form of annual average daily traffic flows
(AADT) for each road. These data need to be converted into the number of vehicles per
hour for each of the time periods, (AM peak, Off-peak and PM peak.)
The percentage of the day for each time period is needed as well as the typical length of
each time period. In Bristol the AM peak typically runs from 7.30am until 9.00am and
the PM peak typically runs from 5pm until 6.30pm.
TRAMEC User Guide
Page 5.11
SECTION 5 –Worked examples
Data from Bristol City Council has been collated and can be found in
\TRAMEC\TrainingMaterial\Bris2000.csv and
\TRAMEC\TrainingMaterial\Bris2005.csv.
Open the csv files in Excel and examine the different fields, noting the road coordinates
at the bottom of the file. Referring to Table 6.2 you will see that the fields
AMPEAK_VH, PMPEAK_VH, OFFPK_VH and DRIVECYCLE need to be added in
order to import the data into TRAMEC. This means that the AADT needs to be
converted into the number of vehicles per hour for the different time periods. This could
be done a number of ways:
•
Ideally you would calculate the average number of vehicles per hour from the
measured number of vehicles over each time period.
•
You might know the typical percentage of vehicles that travel in each period
which you could then use to proportion the AADT for all the roads.
•
You could simply divide the AADT by 24.
In this example we are going to use the typical percentage of vehicles that travel in each
period. For this example approximately 10% of the total daily number of vehicles travel
between 7.30 am and 9am and 15% of the total travel between 5pm and 6.30 pm.
Add four new columns to Bris2000.csv with the headings, AMPEAK_VH,
PMPEAK_VH, OFFPK_VH and DRIVECYCLE. Calculate the number of vehicles per
hour over each time period using the percentages given.
E.g. AMPEAK_VH =
(10% × AADT )
PMPEAK_VH =
(15% × AADT )
OFFPK_VH
=
1.5 hours
1.5 hours
(75% × AADT )
21hours
Once this has been done ensure that the number of vehicles are copied and “pasted as
values” using the Paste Special… command.
The DRIVECYCLE also needs to be present for importing the data. At this stage a
universal drive cycle is going to be applied to the whole city. The importing drive cycle
names can be found in Table A.1 of the manual or the picture book. Look up the import
name for a drive cycle that you think is representative for the city and paste this into
every link in Bris2000.csv.
TRAMEC User Guide
Page 5.12
SECTION 5 –Worked examples
Figure 5.16 – The import file ‘Bris2000.csv’
The spreadsheet should look similar to Figure 5.16.
Repeat the process for Bris2005.csv, save the files making sure they are saved as csv
files and close them. Open the files in notepad and scroll down to where the road
coordinates start. Check that there are no extra commas as shown in Figure 5.17. If
there are extra commas at the end of the rows then they should be deleted.
The files are now in the correct format to be imported.
Figure 5.17 – The import file Bris2000.csv viewed in notepad
Step 2
Setting up the project
If TRAMEC is already open then select File, New from the menu and create a new
database called “Bristol2000.MDB”, otherwise open TRAMEC and select Create a new
file . Select Level One and Specify locations.
Give the project the Title “Bristol city centre 2000”.
Step 3
Importing the data
To import the data select the button Import Links…. This will open the import wizard.
Select the Browse… button and locate the file “Bris2000.csv” followed by the Open
button. The wizard should now look the same as Figure 5.18.
TRAMEC User Guide
Page 5.13
SECTION 5 –Worked examples
Figure 5.18 – The Import Wizard screen
Select Next > and the wizard examines the data. A screen with the list of fields that are
going to be imported will appear. Continue by selecting Next > until the integrity checks
are carried out. If all the data were in the correct format then Figure 5.19 will appear. If
any errors occur then details will be given.
Figure 5.19 – The Integrity Checks Report screen of the Import Wizard
TRAMEC User Guide
Page 5.14
SECTION 5 –Worked examples
Select Import Now followed by Exit, a progress window will appear on the screen while
the links are imported, this may take a moment. Once the links have been imported you
will be able to see them on the main screen. They can be edited either by double
clicking on a selected link or pressing the Edit… button.
Step 4
Changing the emission factors
The emission factors default is “TRAMAQ UG126 2004”. Initially we are considering
the year 2000 so we want to change the emission factors to this year. Select the button
Modify… and the Modify project properties screen appears. (Figure 5.20)
Figure 5.20 – Modify project properties screen
Select the Year 2000 from the drop down menu then press OK. The Select Fleet
Composition screen appears, so that you can select the appropriate fleet composition.
There is only the TRAMAQ Level 1 2000 available because no custom built
compositions have been created. Select OK and you will notice that the emission factor
details have changed on the front screen.
Figure 5.21 – The Select Fleet Composition screen
TRAMEC User Guide
Page 5.15
SECTION 5 –Worked examples
Step 5
Changing the diurnal period
The diurnal period needs to be adjusted to represent Bristol. Select Diurnal Periods from
the Data menu and the screen shown in Figure 5.22 will appear.
Figure 5.22 – The Diurnal period percentages screen
Change the AM peak and PM peak percentages to 6.25%. Notice how the Off-peak
automatically adjusts. Select the OK button.
Step 6
Calculating the totals
Select the Calculate… button, this calculates all the totals. Change the diurnal period to
AM peak and press the Copy Table button. Open Excel and paste the emissions. Return to
TRAMEC and change the diurnal period to PM peak and press the Copy Table button
again and paste the data into Excel. Repeat this for the Off-peak and Overall periods.
Examine the results noticing that the Overall period is a sum of the other periods.
Step 7
Calculating Bristol 2005 data
•
Select File, New from the menu and create a new database called
“Bristol2005.MDB”. Select Level One and Specify locations .
•
Import “Bris2005.csv” by selecting the Import Links… button and following the
wizard.
•
Once the data has been imported change the emission factors year to 2005 and
the fleet composition to “TRAMAQ Level 1 2005” by selecting the Modify…
button.
•
Change the diurnal profile to be the same as Step 5.
•
Calculate… the totals and then copy the Overall period and compare with the 2000
data. You will notice that all the emissions have reduced by 2005 except for
CO2 . You might not expect this since the number of vehicles per hour has
increased but the emission factors take account of the uptake of new fuels and
the changes in technology.
Step 8
Viewing the data in the Mapper
TRAMEC User Guide
Page 5.16
SECTION 5 –Worked examples
Close TRAMEC and open the TRAMEC Mapper. Select the Open button and an open
dialog window will appear. Locate the database “Bristol2005.mdb”. In the Database
Explorer window expand the Road Links folder and select “TRAMAQ Level 1 2005”.
The screen should look like Figure 5.23.
Figure 5.23 – The links from Bristol2005.mdb viewed in the Mapper
Use the Enlarge and Pan buttons to zoom in on the centre. Use the Circle button to select
most of the links shown in red in Figure 5.24. Then press the Select button hold down
the Ctrl key and select or deselect links until you have selected all the links shown in
Figure 5.24. You will notice that the names of the selected links appear on the right.
TRAMEC User Guide
Page 5.17
SECTION 5 –Worked examples
Figure 5.24 – The Mapper showing the links with in the cordon area in red
The roads that have been selected are the roads that fall within the cordon area. Make a
note of the names of these roads. Select the Options… button and Figure 5.25 will
appear. Choose the pollutant PM10 from the drop down menu. Tick the Filter emissions by
range and the Shade by emissions boxes. Set the lower limit to zero and the upper limit to
0.01. Change the number of shades to 12 by sliding the marker, then select OK. You will
notice that there are two roads which are very red in the cordon area, select these and
note their names.
TRAMEC User Guide
Page 5.18
SECTION 5 –Worked examples
Figure 5.25 – The mapping options
Close the Mapper and open “Bristol2005.mdb” in TRAMEC.
Step 9
Reducing the number of vehicles in the cordon area
Select then names of the roads within the Cordon area by selecting the links and holding
the Shift key down, then select the Edit… button. The Multiple Source Edit Screen will
appear (Figure 5.26).
TRAMEC User Guide
Page 5.19
SECTION 5 –Worked examples
Figure 5.26 – The Multiple Source Edit screen
We are going to apply the restriction of the cordon area to the selected sources. Select
Hourly Count and ensure the Diurnal period is AM peak, enter 75% of the current value.
Repeat this process for the PM peak and enter 115% of the current value for the Offpeak.
Select Calculate… and copy the results to Excel by selecting the Copy Table button. What
difference has this made to the overall emissions?
Further investigations:
Investigate what would happen to emissions if you banned HGV vehicles entering the
cordon area in the AM and PM peak periods by creating a new fleet composition.
View the results in the Mapper and notice how the different fleet components are shown
in different colours.
TRAMEC User Guide
Page 5.20
SECTION 6 Importing Data
6.1 Preparing the data files
If you have data for more than a few roads it may be convenient to import the data from
ArcView shape (shp), MapInfo (mif) and comma separated text (csv) files, rather than
typing the data into the interface.
Table 6. 1 and Table 6. 2 show valid fields, or column headings, for the data files.
From Table 6. 2 you will see that the following fields are required:
•
ROADNAME
the name of the road (no more than 20 characters)
•
WIDTH
width of the road in metres
•
CANYON
height of buildings along the road in metres
•
HEIGHT
height of the road above local ground level – usually this
will be zero but might be 10m, say, for a flyover
•
DRIVECYCLE
name of a valid drive cycle selected from the Picture book
•
AMPEAK_VH
hourly vehicle count during the morning peak period
•
PMPEAK_VH
hourly vehicle count during the evening peak period
•
OFFPK_VH
hourly vehicle count during the off peak period
If you do not have information on the variation of the traffic throughout the day (the
diurnal profile) but just have the AADT, the annual average daily traffic count, divide the
AADT by 24 to give a constant hourly traffic count. Then set the AMPEAK_VH,
PMPEAK_VH and OFFPK_VH all equal to the hourly traffic count. If you have a daily
traffic count based on 18 hours then the total should be divided by 18, not 24.
From Table 6. 1 you will see that one of the following sets of names are required. If the
TRAMEC file is set up to use Level One Fleet Components, these fields are required:
•
PCNTMC
the percentage of motorcycles in the fleet
•
PCNTHGV
the percentage of HGVs in the fleet
The percentage of Light vehicles in the fleet will be calculated by TRAMEC so that the
total is100%.
If the TRAMEC file is set up to use Level Two Fleet Components, these fields are
required:
•
PCNTMC
the percentage of motorcycles in the fleet
•
PCNTDCAR
the percentage of diesel cars in the fleet
TRAMEC User Guide
Page 6.1
SECTION 6 –Importing Data
•
PCNTPLGV
the percentage of petrol LGVs in the fleet
•
PCNTDLGV
the percentage of diesel LGVs in the fleet
•
PCNTRHGV
the percentage of rigid HGVs in the fleet
•
PCNTAHGV
the percentage of articulated HGVs in the fleet
•
PCNTBUS
the percentage of buses in the fleet
The percentage of petrol cars in the fleet will be calculated by TRAMEC so that the
total is100%.
The following sets of field names from Table 6. 2 are optional.
•
GRADIENT
the gradient of the road in percentage from 0%-50%. The
gradient will not be used by TRAMEC but can be
exported for use, for instance, in noise modelling
•
DESCRIPT
text description, up to 200 characters
If users add other fields to the shp, mif and csv files they will be simply be ignored by
TRAMEC.
Fleet components
Vehicle type
Column heading
Level One
Motorcycles
PCNTMC
Level One
Light vehicles*
-
Level One
Heavy vehicles
PCNTHVY
Level Two
Motorcycles
PCNTMC
Level Two
Petrol cars*
-
Level Two
Diesel cars
PCNTDCAR
Level Two
Petrol LGVs
PCNTPLGV
Level Two
Diesel LGVs
PCNTDLGV
Level Two
Rigid HGVs
PCNTRHGV
Level Two
Articulated HGVs
PCNTAHGV
Level Two
Buses
PCNTBUS
Table 6. 1 – Valid Fleet Component field names. * will be calculated automatically to make
100%
Figure 6. 1 shows an example csv file, Import.csv. This file is also supplied with
TRAMEC as an example.
Note that in the csv files the road geometry data follows the other road link data. In the
geometry data there is one line for each vertex of each road. If importing from shp or
mif files the road geometry will be stored in ArcView and MapInfo format respectively
and does not have to be specified, vertex by vertex, by the user. Each road can have up
to 50 vertices.
TRAMEC User Guide
Page 6.2
SECTION 6 –Importing Data
Column heading
Data
ROADNAME
WIDTH
HEIGHT
CANYON
DRIVECYCLE
Unique name of source
Road source width
Height of road above ground
Canyon height
Drive cycle
text
m
m
m
text
AMPEAK_VH
Hourly vehicle count during
the morning peak period
Hourly vehicle count during
the evening peak period
Hourly vehicle count during
the off-peak period
Description of source
Gradient of road
Unique name of source
X-location of source vertex
Y-location of source vertex
PMPEAK_VH
OFFPK_VH
DESCRIPT
GRADIENT
CSV FILES ONLY
(data following the
above)
ROADNAME
X
Y
Units
Restrictions
Required?
Default
Yes
Yes
Yes
Yes
Yes
-
vehicles/hour
20 characters maximum
5 – 100m
0 – 2000m
0 – 100m
10 characters, must be a
valid drive cycle (see
Picture book)
0-100,000
Yes
-
vehicles/hour
0-100,000
Yes
-
vehicles/hour
0-100,000
Yes
-
text
-
200 characters maximum
0 – 50%
No
No
blank
0
text
m
m
20 characters maximum
0 – 9,999,999m
0 – 9,999,999m
Yes
Yes
Yes
-
Table 6. 2 – TRAMEC Import Wizard column headings. The data under the heading “CSV FILES ONLY” must be included in .csv files for import
immediately below the columns of source data
TRAMEC User Guide
Page 6.3
SECTION 6 –Importing Data
Figure 6. 1 – Example csv file for import
TRAMEC User Guide
Page 6.4
SECTION 6 –Importing Data
6.2 Importing the road link data
Step 10
With the chosen file open in TRAMEC, launch the TRAMEC Import Wizard
by clicking the Import Links… button.
Step 11
You will be prompted to specify the path name of the file containing the data
to be imported, Figure 6. 2. Enter the full path name of the input file in the
text box under File name or use the Browse… button and navigate to the correct
file.
Figure 6. 2 – Select the file from which data will be imported
Step 12
Click on Next> and a screen will then appear that displays the fields to be
imported, Figure 6. 3.
Step 13
If the input file does not contain all the required fields, for example, if it is
missing the PMPEAK_VH field (number of vehicles per hour in the PM peak) a
warning message will appear, Figure 6. 4.
Step 14
If this happens, the data cannot be imported and the user is advised to exit the
Import Wizard. Click OK to return and then click yes when the Exit Wizard
Confirmation shown in Figure 6. 5 appears.
Step 15
If all the required fields are present click Next > on the screen shown in Figure
6. 3.
Step 16
Click Next > when the screen shown in Figure 6. 6 appears. The integrity
checks then begin and a progress bar will be displayed if you are importing
many road links. The Import Wizard will check that road link names are not
duplicated, that no road names are longer than 20 characters and that the
number of fleet components (3 or 8 vehicle categories) is compatible with the
choice of Level One or Level Two in the file.
TRAMEC User Guide
Page 6.5
SECTION 6 –Importing Data
Figure 6. 3 – Summary of fields to be imported
Figure 6. 4 – Warning message if a required field is missing
Figure 6. 5 – Prompt to exit the Import Wizard
Step 17
The results of the integrity checks are shown in a screen similar to the one in
Figure 6. 7. If one or more of the sources have been rejected, then the user
can choose whether to import just the valid sources by clicking Import Now, or
to Cancel the import altogether. The best option may be to Cancel, exit the
Import Wizard and go back and recheck the input data file. You can use Save
Report to save the report as a text file.
Step 18
When the data have been imported the final report is shown, Figure 6. 8.
Click Save Report if you wish to save the report as a text file. Click Exit to
finish. You will then see a progress bar whilst TRAMEC automatically
compacts the database.
TRAMEC User Guide
Page 6.6
SECTION 6 –Importing Data
Figure 6. 6 – Prompt to proceed with data integrity checks.
Figure 6. 7 – Results of the integrity checks
Step 19
The imported sources are displayed in the main screen of TRAMEC, Figure
6. 9, ready for analysis as described in Section 3 and Section 4.
The import process can be stopped at any time prior to the final screen by clicking
Cancel . If this is done, then no data will have been transferred to TRAMEC.
TRAMEC User Guide
Page 6.7
SECTION 6 –Importing Data
Figure 6. 8 – Import Wizard final report
Figure 6. 9 – Imported sources
TRAMEC User Guide
Page 6.8
SECTION 7 Advanced use of the
Mapper
7.1 Displaying a background image
This example follows on from Step 10 of Section 4.5 and assumes you have some roads
displayed. Go to the File menu and select the Load Image option. If you do not have any
roads displayed in the Mapper the Load Image option is greyed and unavailable.
Browse to locate the Ordnance survey tile, Ss79r.tif. The image location is entered via
the dialogue box shown in Figure 7. 1. The coordinates of the south west corner of this
tile are (271000,194000), and the dimensions are 5km by 5km.
Figure 7. 1 – Enter image location dialogue box with the coordinates and dimensions of the
Neath Ordnance Survey tile, Ss79r.tif .
Clicking OK loads this tile to the view, Figure 7.10.
Figure 7. 2 – Roads and Ordnance Survey tile displayed in the Map View window
TRAMEC User Guide
Page7.1
SECTION 7 –Advanced use of the Mapper
7.2 Copying and Saving the Map View
It is possible to copy all the components in the Map View of the TRAMEC Mapper to the
clipboard, for use in other applications such as Microsoft Word, by selecting the View
menu and choosing either Copy Map View or Copy Map View (high resolution); the image can
then be pasted into another package such as Microsoft Word. Similarly, the Save Map
View and Save Map View (high resolution) can be used to save the Map View to a bitmap
(BMP) file.
Users may also wish to copy or save the map (not including the background image), the
legend or the north arrow separately. The map can be copied (or saved to a file) by right
clicking in the Map View; this action activates the list of options shown in Figure 7. 3.
The Copy map to clipboard command can be used to copy and paste the map into another
package as a Windows metafile (WMF file); the Save map to file… can be used to save
the map as a BMP or a WMF file.
Figure 7. 3 – The list of options enabled by right clicking in the Map View
Note that the format of the plot created using the three options:
•
Copy Map View (from the View menu),
•
Copy Map View (high resolution) (from the View menu), and
•
Copy map to clipboard (by right clicking in the Map View)
are all slightly different in terms of resolution and formats; similarly, the corresponding
save commands all create slightly different files. Users are advised to spend a bit of time
investigating the different formats in order to decide which is most suitable for their
purpose.
7.3 Editing, copying and pasting the legend
Right clicking on the legend in the Map View allows users to edit, copy or save the
legend: the option list shown in Figure 7. 4 is displayed. The legend can be edited in the
following ways:
•
the legend can be resized (using the Resize legend box command), and
•
the legend font can be changed (using the Change legend font… command).
Figure 7. 4 – The list of options enabled by right clicking in the map legend (before editing the
size of the legend)
TRAMEC User Guide
Page 7.2
SECTION 7 –Advanced use of the Mapper
After the legend box has been resized, the Stop resizing legend box option can be selected from
the list of options activated by right clicking on the legend (options shown in Figure 7. 5). Alternatively,
clicking with the left mouse button anywhere in the Map View away from the legend deactivates the
Resize legend box command.
Figure 7. 5 – The list of options enabled by right clicking in the map legend (after editing the
size of the legend)
The Copy legend to clipboard and Save legend to file… commands shown in Figure 7. 5
behave in a corresponding way to the Copy map to clipboard and Save map to file… commands
described above.
Finally, the legend can be moved around the Map View by ‘clicking’ (using the left mouse button) and
‘dragging’, as required.
7.4 Adding a north arrow to the Map View
It is sometimes useful to include a north arrow on a map. This can be done by selecting
the View menu and choosing the Show North Arrow option. By default, the north arrow is displayed
in the top left hand corner of the Map View. Using the left mouse button, the north arrow can be dragged
to any location in the Map View; right clicking on the north arrow activates the option list shown in Figure
7. 6.
Figure 7. 6 – The list of options enabled by right clicking in the north arrow (before editing the
size of the arrow)
The Resize north arrow command is analogous to the Resize legend box command
described above, with the option to Stop resizing north arrow corresponding to the Stop
resizing legend box. Similarly, the Copy arrow to clipboard and Save arrow to file… commands
work in the same way as the Copy map to clipboard and Save map to file… options discussed
above.
TRAMEC User Guide
Page 7.3
Appendix A Data
A.1 Introduction
The objectives of this research project were to carry out emission measurements on a range of
heavy-duty vehicles including buses under conditions that reflect various types of traffic
management schemes. The test cycle used for measuring the emissions data where those
developed in the UG214 project (Latham et al, 2001). A total of 50 vehicles were tested, with
a focus on newer vehicles UG216. The data collected has been processed in order for it to be
used to form or supplement an emissions model database. These are the data that have been
used in the UG218 model.
In the analysis of the emissions data the UG216 project tried to get away from using average
speed to represent driving conditions and looked at a number of other factors. From the
analysis carried out the best indicator of driving conditions, for heavy duty vehicles, was
engine power requirements. These power requirements were derived from the measurements
on the chassis dynamometer when the emissions tests were carried out. Therefore the project
developed a power-based model for emissions that allowed the calculation of emissions from
a range of driving conditions based on the original drive cycles from UG214 and with a
correction for gradient.
The UG218 project has used the power-based model developed in UG216 to generate a
database of emissions factors for a range of driving conditions. These driving conditions are
related to the original 9 test cycles from UG214. Each of these nine basic cycles has been
subdivided into sub-cycles related to specific traffic management situations. This has given a
total of 37 driving conditions relating to traffic lights, one-way systems and so on, which the
user can choose from to represent the conditions on the road he/she is considering.
A.2 TRAMAQ emission datasets
The TRAMAQ data from UG216 is only available for heavy dut y vehicles (HGV’s and
Buses), there is no data available yet for the light duty vehicles. The standard NAEI data has
been included to supplement the TRAMAQ data and provide a light duty vehicle emissions
data set. Since the NAEI data is based on a speed emissions relationship an average speed
was needed related to each drive cycle to produce an NAEI emissions data point. This
average speed was derived from the original UG214 test data and was used to generate a set of
emissions factors comparable to that generated by the UG216 model. Table A.1 shows each
drive cycle, the import code, the average speed that was derived and a short description. The
average speeds were derived for three categories, car and motorcycles, LGV and HGV.
Therefore the model has two sets of emissions data, TRAMAQ and NAEI, which are chosen
through a defined drive cycle (or road condition) for each of the links or roads being
considered. So the whole model has moved away from needing to know about average speeds
to needing to know what types of roads you have.
TRAMEC User Guide
Page A.1
Name
Bus lane 1
Bus lane 2
Bus lane 3
Cycle Lane 1
Cycle Lane 2
Cycle Lane 3
Cycle Lane 4
Cycle Lane 5
Cycle Lane 6
Cycle Lane 7
Mini Round-about 1
Mini Round-about 2
One way 1
One way 2
One way 3
One way 4
Speed humps 1
Speed humps 3
Speed humps 4
Speed humps 5
Speed humps 6
Speed humps 7
Suburban 1
Suburban 2
Suburban 3
Suburban 4
Traff Calm (other) 1
Traff Calm (other) 3
Traff Calm (other) 4
Traff Calm (other) 5
Traffic Lights 1
Traffic Lights 2
Traffic Lights 4
Urban 1
Urban 2
Urban 3
Urban 4
Import Code
BusLane1
BusLane2
BusLane3
CycleLane1
CycleLane2
CycleLane3
CycleLane4
CycleLane5
CycleLane6
CycleLane7
MiniRound1
MiniRound2
OneWay1
OneWay2
OneWay3
OneWay4
Shumps1
Shumps3
Shumps4
Shumps5
Shumps6
Shump s7
Suburban1
Suburban2
Suburban3
Suburban4
TraffCalmO1
TraffCalmO3
TraffCalmO4
TraffCalmO5
Trafflght1
Trafflght2
Trafflght4
Urban1
Urban2
Urban3
Urban 4
Average speeds in mph
Cars & motorcycles
LGV
16
15
16
15
16
15
16
17
16
17
16
17
16
17
16
17
16
17
16
17
19
19
19
19
13
12
13
12
13
12
13
12
19
17
19
17
19
17
19
17
19
17
19
17
23
22
23
22
23
22
23
22
22
21
22
21
22
21
22
21
8
6
8
6
8
6
17
15
17
15
17
15
17
15
Description
HGV
28
8
22
20
17
23
31
24
9
5
15
12
16
13
12
4
9
16
19
12
12
12
13
15
13
14
13
18
17
20
17
10
13
29
16
24
20
Suburban 2 way traffic, 2 sets of pedestrian traffic lights, double yellow lines
Mostly 2 lanes, 1 way traffic, traffic lights, pedestrian crossing, double yellow lines
2 way traffic, central turning lanes, pedestrian crossing, double yellow lines
Speed cushion, junction traffic light and pedestrian crossing, no parked cars
2 way traffic, 40 speed limit, 1 traffic light
30 speed limit, speed camera, traffic light, double yellow lines
2 way traffic leading up to bus lane, single yellow line
1 lane leading to 2 lanes, single red line
Advisory cycle lane, pedestrian crossing, some double yellow lines
3 sets of traffic lights, pedestrian crossing
With cycle lane at entry
At a T junction
2 lanes expanding to 3, pedestrian crossings
1 side of dual carriageway
1 lane expanding to 2 lanes then 3 lanes
3 lanes beside major bus stop
Variety of calming measures, cycle lane, traffic lights, on road parked cars
Speed humps, tables, cycle lane, traffic lights, some cars parked on cycle lane
Widely spaced speed cushions, leading up to roundabout, no parked cars on road
Closely spaced speed cushions, sheltered parking + 20 zone
3 abreast speed cushions, speed cameras, leading to T junction
Raised tables, zebra crossing, cycle lane, cars parked in cycle lane, leading to mini roundabout
2 way traffic, 4 side roads, some parked cars
2 way traffic, 4 side roads, off road and sheltered parking, bus route
Sheltered parking, bus route leading to T junction
Dual carriageway, speed camera sign, double yellow lines
Cycle lane, traffic lights, speed camera sign, sheltered parking
20 zone with traffic islands, speed cushions, centre hatching, pedestrian crossing
Speed cushions winding suburban road leading up to T junction
Parking lane, double yellow lines on remainder, pedestrian crossing leading to roundabout
3 sets of traffic lights, multiple lanes
2 sets traffic lights on dual carriageway with bends
2 sets of traffic lights interspaced by a pedestrian crossing and zebra crossing
Dual-carriageway leading to roundabout
Bus and cycle lanes
Part dual carriageway
Dual carriageway
Table A.1 – the drive cycle import codes, average speeds and description
TRAMEC User Guide
Page A.2