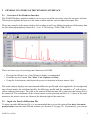
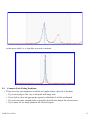
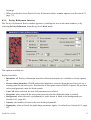
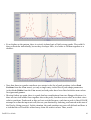
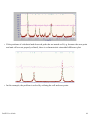
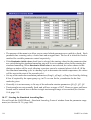
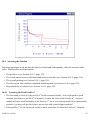
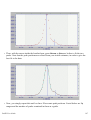
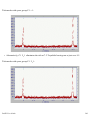
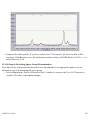
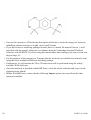
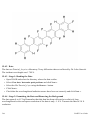
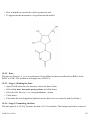
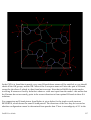
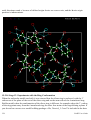
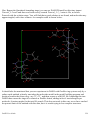
1
ABOUT THIS USER GUIDE
This user guide is a practical guide to solving crystal structures from powder diffraction data using
DASH. It includes instructions in using the Windows Interface as well as providing help on the
scientific issues relevant to structure solution. It is intended for readers who already have some
crystallographic experience, but perhaps with single-crystal rather than powder techniques.
Use the navigational buttons above to move between pages of the user guide and to access the full
table of contents (TOC) and index.
An extensive set of tutorials are also available for DASH. Tutorial 1 will guide you through the
process of structure solution in considerable detail; subsequent tutorial examples will be more
concise, but will introduce other, new aspects of the structure solution process. Tutorials can be
accessed by clicking on the Tutorials (see page 191) link on the bottom of this page.
The DASH user guide is divided into the following sections:
1
2
3
4
5
6
7
8
9
10
11
12
13
14
15
Introduction (see page 3)
General Features of the Windows Interface (see page 5)
Data Collection and Data Treatment (see page 31)
Preliminary Inspection of Profile (see page 37)
General Hints on Selecting, Fitting and Measuring Peaks (see page 47)
Indexing (see page 55)
Space Group Determination (see page 65)
Pawley Fitting (see page 69)
Building and Constraining Molecules (see page 93)
Structure Solution (see page 101)
Running DASH in Grid Mode or Batch Mode (see page 133)
Rigid-body Rietveld refinement. (see page 137)
Preparation of Single Crystal Data (see page 153)
Appendices (see page 157)
Tutorials (see page 191)
DASH User Guide
1
2
DASH User Guide
1
INTRODUCTION
1.1
The DASH Program
DASH solves crystal structures from powder diffraction data. It assumes that the molecular formula
of the compound being studied is known, and that the unit cell and space group can be determined by
indexing the powder pattern. It constructs a trial crystal structure by placing a 3D model of the
compound inside the unit cell. This 3D model will generally consist of rigid units connected by links
having unknown torsion angles, i.e. an accurate description of the molecule, but with an unknown
molecular conformation. The chances of choosing the correct conformation and positioning the
model at the correct point in the cell with the correct orientation are very small. However, DASH
checks how close a trial solution is to the correct structure by calculating diffraction data and
comparing it with the measured diffraction data. DASH uses simulated annealing to adjust the trial
structure until it agrees well with the measured data, thereby solving the crystal structure directly
from the powder diffraction data.
1.2
Basic Steps for Structure Solution
The basic steps involved in solving structures from powder data are:
•
•
•
•
•
Data collection and data treatment (see Section 3, page 31)
Cell indexing (see Section 6, page 55) and space group determination (see Section 7, page 65)
Extraction of reflection intensities by Pawley fitting (see Section 8, page 69).
Building and constraining the molecules (see Section 9, page 93)
Use of simulated annealing to solve the structure (see Section 10, page 101)
DASH User Guide
3
4
DASH User Guide
2
GENERAL FEATURES OF THE WINDOWS INTERFACE
2.1
Overview of the Windows Interface
The DASH Windows interface enables you to carry out all the necessary steps for structure solution.
This section explains the layout of the main window and the various input and output files.
This is an example of the main window after reading in an X-ray diffraction pattern of laboratory data
for Decafluoroquaterphenyl (Smrcok, L. et al., Z. Kristallogr. (2001) 216, 63-66):
There are three ways of accessing most functions in DASH:
• Through the Wizard, use of the Wizard is highly recommended.
• From the top level menu: File, Mode, View, Options and Help.
• Using the Icon buttons, which provide access to functions with one mouse click.
The main window displays the experimental diffraction profile and, when applicable, the background,
any selected peaks, the calculated profile, the difference profile and the cumulative χ 2, with various
colour coding conventions. The path to the current diffraction data file is shown at the bottom left of
the status bar. The coordinates of the current mouse-cursor position and the h, k, l values of the peak
nearest to the mouse cursor are shown at the bottom right of the status bar.
2.2
Input of a Powder Diffraction File
To input a powder diffraction file, it is recommended that you use the option View data / determine
peak positions from the main Wizard window (see Section 2.10, page 21). Alternatively, you can use
DASH User Guide
5
the Wizard option Preparation for Pawley refinement, or click on the following icon:
This leads to a pop-up window that shows all files in the selected directory with an extension that
match those of the file types that can be read by DASH. These include:
•
•
•
•
•
•
•
•
•
•
•
•
.raw - Bruker (more information about this file type is given below)
.raw - STOE (more information about this file type is given below)
.rd and .sd - Philips
.udf
.uxd
.xye
.cpi - Sietronics
.mdi - Materials Data Inc.
.pod - Daresbury
.x01 - Bede
.txt - ThermoARL
.asc - Rigaku
Simply:
• Click on the file icon/filename (this places the filename in the box).
• Click on Open.
When a Bruker .raw file is opened, DASH scans the file for data ranges. When only one is found, it
is loaded, but when more than one is found, the data ranges to be summed can be selected through the
following dialogue window:
6
DASH User Guide
By default all data ranges are selected and clicking OK reads in all data ranges.
DASH sums the data ranges as follows:
1.Per 2θ value (= data point), the number of raw counts and the number of seconds that has been
counted for is stored.
2.The combined list of 2θ values from all data ranges is sorted in ascending order.
3.If two 2θ values are closer together than the smallest 2θ step used in any of the patterns being
summed they are merged by summing their raw numbers of counts, summing their counting
times and averaging their 2θ values. This process is repeated until the original smallest step size
is restored.
4.The intensities are scaled to Counts Per Second by dividing the total raw number of counts per 2θ
value by the total number of seconds counted for that 2θ value. The esds are calculated as (total
raw number of counts)1/2 / (total number of seconds counted for).
It is possible to implement an optimised data collection strategy (see Section 3.1.12, page 34) using
multiple data ranges in Bruker .raw files. In an optimised data collection strategy data points at
higher 2θ, which on average have less intensity, are measured longer than data points at lower 2θ. The
Variable Counting Time scheme used for the above file would have been:
DASH User Guide
7
2θ range
counting time
(seconds per step)
5.0 - 15.0
0.5
15.0 - 25.0
1.0
25.0 - 35.0
2.0
35.0 - 45.0
4.0
45.0 - 55.0
8.0
55.0 - 65.0
16.0
The third step is performed to smooth the seams between two adjacent data ranges, but it also allows
reading in of data that has been collected using the following Variable Counting Time scheme,
entirely equivalent to the previous one:
2.3
2θ range
counting time
(seconds per step)
5.0 - 65.0
0.5
15.0 - 65.0
0.5
25.0 - 65.0
1.0
35.0 - 65.0
2.0
45.0 - 65.0
4.0
55.0 - 65.0
8.0
Format of Diffraction Data
DASH recognises two formats of diffraction data within the file type with extension .xye (the file
should be a normal ASCII text file):
• 2θ, counter reading, estimated standard deviation of the count.
• 2θ, counter reading.
If no standard deviation is given in the input file DASH recognises this and sets the standard
deviation to be the square root of the count. The start of an example file, where the diffractometer step
size is 0.004 degrees 2θ, is given below:
8
DASH User Guide
5.000
5.004
5.008
5.012
5.016
81.96
71.25
72.40
76.87
63.58
10.952
10.284
10.343
10.661
9.695
Optionally, the wavelength can be included in the file as the very first line.
2.4
Inspecting Diffraction Data
The main window shows the diffraction data plotted as observed counts versus 2θ. There are
numerous keyboard and mouse facilities for selecting ranges of 2θ, scaling of peak height, and
generally zooming into a region of the profile for closer examination (see Section 4, page 37). The
next stage for consideration is removal of the background from the data (see Section 2.4.1, page 9).
2.4.1
Removing the Background from Diffraction Data
It is recommended that the background is subtracted through the Wizard (see Section 2.10, page 21).
Alternatively the background can be subtracted choosing the following icon from the menu bar:
The method of background removal is a Monte Carlo low-pass filter, which has advantages of being
mathematically robust. It is recommended that you let DASH take care of the background subtraction
at this stage. If you choose to leave the background fitting to later, it will be included in the Pawley
fitting process, using a shifted Chebyshev polynomial (see Section 8.5.1, page 79).
Note: If your data set is of laboratory origin, or there is noticeable non-uniform background then it is
best to remove the background using the Monte-Carlo method. Poor quality data sets that are not
background-subtracted at this stage (i.e. sets where the discrimination between peaks and background
is poor) can give rise to problems at the Pawley Fitting stage, due to correlation between the
polynomial background and the very weak intensities.
DASH User Guide
9
• The pass filter value is set at 100 by default.
• Select Preview to run the fitting; the display now shows the background fitted as a green line.
Check that it looks reasonable and is not removing any significant intensity from the peaks. A
close-up view of a fitted background on a laboratory data set is given below:
• If you are not happy with the background you can try smaller or larger values of the Low-pass
filter window size. This value is related to the number of data points per degree, and larger values
tend to give a smoother, more featureless background, whilst smaller values allow the program
to give a varying background more accurately. A closer look at the above example shows that
whilst the background estimate is excellent there are a few ripples in the background line.
Increasing the low-pass filter window size and applying it will smooth out these ripples. Select a
value that suits your data, remembering to look closely at the high angle estimates, where the
peaks are weak.
• Select Accept if satisfactory; DASH now subtracts the background from the data, as will be seen
in the updated display.
10
DASH User Guide
2.5
Pawley-Fit Files
DASH keeps a record of progress while one is working on a chosen set of diffraction data. When you
start a new project, the only item in the directory will be your diffraction data file. After indexing the
cell, and extracting intensities by the Pawley fit procedure, DASH creates a file with extension .sdi
that is then known as the Pawley-Fit file (see Section 2.5.1, page 11). This contains all the
information needed for the last stage of the DASH process, i.e. structure solution using a molecular
model.
The default name is based on the diffraction data file; e.g. for a compound called hydrochlorothiazide,
we might have a data file hct.xye, producing a Pawley-Fit file hct.sdi. If you had a second set of
experimental data for hydrochlorothiazide, e.g. hctnew.xye and chose this as the input file, DASH
would create a new Pawley-Fit file called, by default, hctnew.sdi, but you can choose the names as
you wish.
2.5.1
Pawley-Fit File: an Example
The Pawley-Fit file contains the full file names for various types of data that are created by DASH as
the result of the Pawley refinement. It is not essential to know the details of these files, but it is
important to be aware of the data files that are used by the structure solution process. Each line lists a
file or some data that is identified by a keyword:
•
•
•
•
•
•
•
TIC: Tick-mark file, with hkl and 2θ positions of extracted intensities.
HCV: Extracted hkl intensities and reflection correlations.
PIK: Background-subtracted profile.
RAW: File name for the original data file.
DSL: Data type, wavelength, and peak shape parameters.
Cell: the unit cell parameters.
SpaceGroup: Space group selected for the Pawley refinement.
• PawleyChiSq: χ 2 fit achieved by the Pawley refinement.
An example of the file hct20.sdi is given below:
TIC .\hct20.tic
HCV .\hct20.hcv
HCV .\hct20.hkl
PIK .\hct20.pik
RAW .\hct20.raw
DSL .\hct20.dsl
Cell
9.93861
DASH User Guide
8.49849
7.31737
90.0000
111.1896
90.0000
11
SpaceGroup
PawleyChiSq
2.6
38
4:b
2.41
P 1 21 1
Viewing Data Attributes, Peaks and Crystal Symmetry
After you have proceeded with the cell indexing step and choice of space group, there are options for
viewing the current peak list etc. These items are selected from the top-level menu button View, as
follows:
•
•
•
•
2.6.1
Diffraction Setup: Type of data, wavelength etc. (see Section 2.6.1, page 12).
Peak Positions: 2θ for fitted peaks (see Section 2.6.2, page 13).
Cell Parameters: Cell dimensions, space group etc. (see Section 2.6.3, page 14).
Peak Widths: Parameters describing peak shape (see Section 2.6.4, page 15).
Viewing Diffraction Setup
The above Structural Information window appears after selecting Diffraction Setup from the View
menu. Information can be entered on:
• Radiation type: Laboratory or Synchrotron (DASH does not yet handle neutron data).
• Profile Range: this is for information only.
12
DASH User Guide
• Wavelength: the radiation wavelength used is entered here. For a synchrotron data set, you must
enter the wavelength in the entry field. For laboratory data, you can either type the wavelength
or use the pull down menu to select the appropriate radiation type.
2.6.2
Viewing Peak Positions
The above Structural Information window appears after selecting Peak Positions from the View menu.
This example shows a list of peaks fitted ready for cell indexing.
•
•
•
•
•
•
•
Position: the peak position in 2θ.
Esd: the estimated standard deviation of the position in 2θ.
Tick: the 2θ position calculated from unit cell (once entered).
Diff: the difference between the observed position and the tick-mark.
hkl: after unit cell indexing these are the Miller indices assigned to the peak.
Prob: probability of correctness of assignment.
Lattice parameters and Zero-point: these fields are filled in after a Pawley refinement, or when
an on-the-fly cell refinement has been performed. These are display fields only.
• The DICVOL... button can be used to create an input file ready for the DICVOL indexing
program, after fitting a number of peaks (see Section 6, page 55).
DASH User Guide
13
2.6.3
Viewing Unit Cell Parameters
The above Structural Information window appears after selecting Cell Parameters from the View
menu. This example shows a cell and space group ready for input to the Pawley Refinement:
•
•
•
•
•
•
•
14
a, b, c: unit cell lengths in units of Angstroms.
Alpha, beta, gamma: unit cell angles (degrees).
Volume: calculated volume of the unit cell (cubic Angstroms)
Zero-point: zero-point error of the powder pattern in degrees 2 theta (if known).
Crystal System: a list of the crystal systems.
Space Group: a list of space group symbols in various settings.
Clicking on the following icon clears the unit cell parameters:
DASH User Guide
2.6.4
Viewing Peak Widths
The above Structural Information window appears after selecting Peak Widths from the View menu.
There are six tabs that allow you to access details of the peak description parameters. These fields are
for display only. The fields are populated once a few peaks have been fitted, as reliable peak shape
parameters have been calculated by this stage. Inspection of the values can be useful in deciding
which peak shape parameters (if any) need to be varied in a Pawley refinement (see Section 8.6.2,
page 85).
DASH User Guide
15
2.6.5
Viewing Pawley/SA
The above Structural Information window appears after selecting Pawley / SA from the View menu.
This example shows several pieces of information about the last Pawley refinement. It is possible to
manually enter values that will be used for subsequent Pawley refinements, but this should not
usually be necessary.
2.7
Plot Options for Graphics
The DASH Plot Options window appears after selecting Options from the top-level menu:
16
DASH User Guide
• Character size: not currently active.
• Symbol size: not currently active.
• Show Error bars on Observed Profile: display of the error bars on data point may be toggled on
and off using this control.
• Show Background: display of the calculated background may be toggled on and off using this
control.
• Connect data points: display of lines connecting the data points of the powder pattern may be
toggled on and off using this control.
• Show peak fit difference: display of the difference between measured and fitted peaks may be
toggled on and off using this control.
• Show Error Bars on Difference Profile: display of the error bars on a data point in the difference
profile may be toggled on and off using this control.
• Error Multiplier: Used to control the value of the multiplier applied to error bars.
• Divide difference by ESDs: when ticked, the points of the difference curve are divided by the
ESDs of the observed number of counts and multiplied by the average ESD.
• Show cumulative chi-sqd: display of the cumulative chi-sqd during Pawley refinement and
simulated annealing may be toggled on and off using this control.
DASH User Guide
17
• Colours: these buttons may be used to alter the default colours used by DASH for display of the
profile. Selecting any one of the buttons brings up a colour chooser, from which you may select
a colour by clicking on the appropriate square:
18
DASH User Guide
2.8
Configuration
• Viewer: the viewer used for viewing Z-matrices and solutions. The viewer will display crystal
structures from .cif, .pdb or .mol2 files.
• Arguments for viewer: If using built-in Mercury the command line argument to load-allfiles is supplied by default. This ensures that when .cif files are written for structures to be
overlaid, all structures are loaded and displayed simultaneously. If MercuryCSD is used to view
structures, supplying the command line argument -client will load each structure selected
into a single instance of MercuryCSD. If, within MercuryCSD, the Multiple Structures check
box is ticked, the structures will be displayed simultaneously.
• Mogul: If access to Mogul is available then enter the path to the Mogul executable here or click
on the Browse button.
• DICVOL: If DICVOL04 is available for indexing then enter the path to the DICVOL executable
here or click on the Browse button.
• McMaille: If McMaille is available for indexing then enter the path to the McMaille executable
here or click on the Browse button.
• TOPAS: If TOPAS is available for Rietveld refinement then enter the path to the TOPAS
DASH User Guide
19
•
•
•
•
•
•
2.9
executable or click on the Browse button.
EXPGUI Tcl: If GSAS is available for Rietveld refinement then enter the path to the
tcl84+.exe (in the expgui folder) here or click on the Browse button.
RIETAN: If RIETAN is available for Rietveld refinement then enter the path to the RIETAN
executable here or click on the Browse button.
Colour flexible torsions: when selected, flexible torsion angles are colour coded when viewing a
Z-matrix.
Write wavelength to .xye files: If checked the wavelength entered or selected when reading in a
powder pattern will be automatically written to the .xye file.
Write CIF for Viewer: If checked, individual .cif files will be written for all structures chosen
to be overlaid. If using built-in Mercury, these files will be automatically displayed
simultaneously. If MercuryCSD is used, the .cif files will be loaded but to display the
structures simultaneously, the Multiple Structures dialog has to be invoked.
Run single instance of built-in Mercury: When ticked, only one copy of built-in Mercury will be
opened and all structures will be loaded into that instance of Mercury. Unticking the check box
will cause a fresh copy of built-in Mercury to be opened each time a structure is selected for
viewing.
Online Help
The online version of this user guide is available by clicking the Help button, the
using the keyboard command Ctrl-H. The following features are available:
icon or by
• DASH Help: allows you to view a copy of the current user guide and also provides access to the
Tutorials.
• DASH Tutorials: allows you to view a set of Tutorials for DASH. Clicking on any of the tutorials
will cause a window to pop up prompting the user to supply a directory in which to save the files
for the specific tutorial. Clicking on the “..” feature will cause the browser to go up a level within
the directory structure for navigation purposes.
20
DASH User Guide
• About DASH: gives the DASH version number.
2.10 The DASH Wizard
The DASH Wizard has been designed to guide you through the structure solution process, which is
performed in a series of steps:
• View data/determine peak positions (see Section 2.10.1, page 22)
• Preparation of single crystal data (see Section 13, page 153)
DASH User Guide
21
• Simulated annealing structure solution (see Section 10, page 101)
• Analyse solutions (see Section 10.9.4, page 129)
• Rietveld refinement (see Section 12.1, page 137)
It may be called up at any time by clicking the
icon in the main window.
2.10.1 View Data / Determine Peak Positions
• Select the first option View data / determine peak positions and click Next >.
• Click Browse...
• Select a data file, e.g. Example.xye, and the diffraction data will be loaded into DASH and
displayed.
• You are given the opportunity to rebin the data by choosing Rebin >, otherwise click Next >.
22
DASH User Guide
• Check that the radiation type and wavelength have been set correctly.
• Click Next >.
DASH User Guide
23
• Enter the 2θ angle at which the pattern should be truncated at the beginning. This gives the
possibility to remove the part of the pattern affected by the beam stop.
• Enter the 2θ angle at which the pattern should be truncated at the end. This gives the possibility
to truncate the data to a certain resolution (see Section 8.4, page 75).
• Click Next >.
• Adjust the width of the window to match the curvature of the background.
• Smooth: Checking this box will smooth the profile before the background is subtracted, using a
window size of x data points, where x is specified in Window. The intensity at point I will be
recalculated to be the average intensity of points I-x to I+x, where x is the window size.
• Click Next >.
24
DASH User Guide
2.10.2 Selecting an Indexing Package
After you have picked some peaks for indexing:
• Selection of the check-box Index pattern will take you to an interface to DICVOL91.
• Selection of the check-box External DICVOL (04 or later) will take you to an interface to
DICVOL04 (peaks from impurities allowed).
• Selection of the check-box Stand-alone McMaille will take you to an interface to McMaille.
• Click Next>
If you already know the cell parameters then:
• Selection of the check-box Enter known unit cell parameters will take you to the Unit Cell
Parameters window where the parameters can be entered.
• Click Next >.
DASH User Guide
25
2.10.3 Interface to DICVOL91
•
•
•
•
26
If known, enter the experimental zero-point error.
Select the appropriate crystal systems. Note that Triclinic might take a long time.
Click Run >.
Clicking on Previous Results will return you to the Results window, showing parameters
obtained from a previous indexing.
DASH User Guide
2.10.4 Interface to DICVOL04
•
•
•
•
•
If known, enter the experimental zero-point error.
If known, enter the maximum number of impurity lines to be tolerated.
Select the appropriate crystal systems. Note that Triclinic might take a long time.
Click Run >.
Clicking on Previous Results will return you to the Results window, showing parameters
obtained from a previous indexing.
DASH User Guide
27
2.10.5 Interface to McMaille
• Select which group of symmetries you would like to explore and whether a grid search is
required.
• Indexing in the triclinic crystal system may take a long time with McMaille .
• Click Run>
• Once McMaille has finished running, you will be prompted to type a character and press return.
The results from the indexing will then be presented in a text window. Closing this window will
return you to DASH where you can enter your chosen cell parameters into the Unit Cell
Parameter wizard window.(see Section 2.6.3, page 14)
28
DASH User Guide
2.10.6 Importing Unit Cell Parameters
• Select the appropriate solution by selecting the button next to it in the Import column.
• Clicking Next > will take you automatically to the Unit Cell Parameters wizard window .
• Fill in details of the unit cell parameters and space group (see Section 2.6.3, page 14).
DASH User Guide
29
• The unit cell parameters can also be read in at this point from a crystal structure file by clicking
on the Browse... button.
• Click Next >.
• Proceed with peak selection for indexing as described in Section 6.2, page 55.
• Click Next >.
Pawley refinement is the next step (see Section 8, page 69) followed by structure solution (see
Section 10, page 101).
30
DASH User Guide
3
DATA COLLECTION AND DATA TREATMENT
3.1
3.1.1
Hints for Collecting Data
Synchrotron versus Laboratory Data
• DASH is capable of solving structures from both synchrotron and laboratory X-ray data.
• Synchrotron X-ray powder diffraction stations offer better instrumental resolution and positional
accuracy, coupled with a vastly superior incident flux. These benefits manifest themselves best
with nicely crystalline samples, where peaks that are overlapped in the laboratory X-ray pattern
become well resolved in the synchrotron pattern.
• The collection of synchrotron X-ray powder diffraction data is indicated when laboratory data
has failed to provide a solution, or when a precise high-resolution structure solution is required.
3.1.2
Choice of Detector Type
• Of the two common types of detector, scintillation detectors give better resolution but linear
PSDs (position sensitive detectors) offer vastly better counting statistics. Use of either is likely
to yield good results.
• If the sample line widths are well matched to the resolution of the PSD, there is little to be
gained by switching to a scintillation detector.
• Most high-resolution powder diffractometers at synchrotrons currently use one or more
scintillation detectors. Increasingly, though, image plates are being used to shorten data
collection times and provide better counting statistics. The choice of which to use depends very
much upon the prevailing instrumental set up; the station scientist is in the best position to advise
you on such matters.
3.1.3
Required Resolution
• Global optimisation methods of structure solution do not require data collected to such a high
angle as do direct methods of structure solution. Typically, if data can be collected to
approximately 1.5 Å resolution, then structure solution will be feasible (Note that we are
speaking here of spatial resolution within the data set). The 2θ value corresponding to this
resolution can be easily calculated from:
2θ1.5Å = 2*sin-1(λ / 3.0 Å)
• Data should be collected to as low a 2θ value as possible since the low-resolution reflections
help with the indexing process. Generally, this low angle limit is imposed by the diffractometer,
because there is a risk of damage to the detector from the straight-through beam at 2θ values
close to zero.
DASH User Guide
31
3.1.4
Obtaining Monochromatic Radiation in the Laboratory
• The radiation source should ideally be monochromatic.
• In decreasing order of preference, monochromatisation can be achieved by:
• Use of a primary monochromator, i.e. one that lies between the X-ray tube and the sample.
For a copper X-ray tube, this eliminates CuKα2 and CuKβ, leaving only CuKα1.
• Use of a secondary monochromator, i.e. one that lies between the sample and the detector.
These usually eliminate only CuKβ, leaving both CuKα1 and CuKα2. The CuKα2 contribution
then needs to be stripped out algorithmically, which is a complication best avoided.
• The use of filters to achieve monochromatisation is considered to be inappropriate for
structure solution work.
3.1.5
Choice of Wavelength
• It is doubtful if any particular wavelength offers an advantage when dealing with organic
powder samples. Whilst longer wavelengths spread out the pattern and would seem to decrease
the chances of peak overlap, the peaks themselves widen and thus no advantage is gained.
• In situations where it is possible to select a wavelength (e.g. at a synchrotron), it should be
chosen to maximise the incident flux, unless compelling reasons (such as absorption) dictate
otherwise.
3.1.6
Data Collection Geometry
• Transmission geometry is recommended, with the sample in a rotating capillary.
• It is also possible to collect diffraction data in transmission mode when the sample is held as a
thin film in a suitable attachment. Reflection geometry may be used, but there is a high risk of
preferred orientation having a significant impact on the diffraction pattern. Whilst a small degree
of preferred orientation can be tolerated in a structure solution, it is a complication that is best
avoided.
3.1.7
Background Reduction
You should endeavour not to introduce any additional background scattering. For example, it may be
appropriate to use borosilicate capillaries rather than glass or quartz, in order to avoid seeing the
amorphous scattering from the capillary manifest itself as a background hump.
3.1.8
Zero-Point Calibration
Although it is possible to refine instrumental zero-point errors in the whole pattern fitting stage, it is
always preferable to calibrate the instrument prior to a structure solution using a well defined
standard sample, e.g. NBS silicon.
32
DASH User Guide
3.1.9
One Long Scan versus Several Short Scans
It is generally better to perform several short scans and sum them together using the data reduction
software, rather than collecting a single long run. For example, four one-hour runs are preferable to
one four-hour run. Prepare each sample fresh in order to reduce preferred orientation.
3.1.10 Choice of Step Size
• Ideally, you should have plenty of points across every peak in the diffraction pattern in order to
accurately describe the underlying peak shape.
• If you use a step size that is too large, you risk missing subtle features such as peak shoulders
that may be critical at the indexing stage.
• If there is any doubt, it is better to collect data on a finer grid, since a coarser grid can always be
constructed later by re-binning the data; the converse is obviously not true.
3.1.11 How Long to Count For
• Obviously, the longer the time spent on collecting data, the more closely it will resemble the true
diffraction pattern.
• For each doubling of the collection time, the estimated standard deviations are improved by a
factor of 21/2. Eventually, a stage is reached where substantial increases in collection times are
required in order to achieve modest improvements in the signal-to-noise ratio.
DASH User Guide
33
• As a general guide, the data should be collected sufficiently long that reflections can be clearly
distinguished from the background at around 1.5Å spatial resolution. Not all samples will
diffract strongly to this resolution, but it remains a useful rule of thumb.
3.1.12 Optimising Use of Data Collection Time
• For a given data collection time, the question arises of how to optimise the use of that time. A
common formula is:
Time per step = (expt duration in seconds) / ((2θmax – 2θmin) / step size)
• This scheme gives equal weighting to all data points and takes no account of the fact that the
diffracted intensities at low angle will be much stronger than those at high angle. In many cases,
this may be sufficient, but a more sophisticated data collection strategy is described in J. Mater.
Chem. (1997) 7, 569-572. Implementing such a data collection scheme is a simple matter and is
strongly recommended when using scintillator detectors on a laboratory or a synchrotron source.
3.1.13 Neutron Data
DASH does not currently handle neutron diffraction data.
3.2
3.2.1
Hints for Treating Data
Lorentz Correction
DASH always corrects the data for Lorentz effects, so no correction should be applied to the data in
advance.
3.2.2
Polarisation Correction
• In the case of synchrotron data, DASH assumes that the incident radiation is vertically polarised
and, provided that the Synchrotron radiation option is turned on when the radiation wavelength
is entered, no pre-processing of the data is necessary.
• In the case of laboratory X-ray data, DASH applies an appropriate polarisation correction
provided that the Laboratory radiation option is turned on when the radiation wavelength is
entered, and no pre-processing of the data is necessary.
34
DASH User Guide
• The exact form of the polarisation correction applied is suitable for instruments equipped with a
primary monochromator. Whilst not exactly correct for different instrumental geometries, it is
still a good enough approximation to be useful.
• It is always possible to fully correct for the polarisation effects of particular geometries, if your
data processing software allows it, before inputting the corrected data into DASH. Within
DASH, the data should then be treated as having been obtained using monochromatic
synchrotron radiation.
• A Lorentz correction should never be applied in advance.
3.2.3
Kα2 Stripping
• DASH is able to handle data collected using monochromatic radiation only. The use of more
than one incident wavelength is a serious complication that should be avoided when tackling
problems of structure solution.
• However, it is possible that your diffractometer software may provide suitable Kα2 stripping
routines that allow you to export a data file from which the Kα2 contribution has been removed
algorithmically. In such cases, the exported file may be treated within DASH as a
monochromatic laboratory X-ray data set.
• NB: Stripping algorithms inevitably introduce some degree of uncertainty into the data.
3.2.4
Esds
• Each (2θ, count) data point must be accompanied by an estimated standard deviation (esd).
Ideally the diffraction data set input into DASH should consist of three columns of data:
<2θ> <count> <estimated standard deviation>
• Many diffractometers will output such a listing. However, if only
<2θ> <count>
are available in the input file, DASH will automatically calculate the esd values from counting
statistics.
3.2.5
Background Subtraction
• Some diffractometer software may offer the possibility of background subtraction. However, it
is better to leave modelling of the background to DASH, unless there is a good reason to do
otherwise e.g. if you have an appropriate physical model for the background and therefore can
remove the background with confidence.
• DASH provides a robust Monte-Carlo background fitting option that is recommended for use
with most data sets.
DASH User Guide
35
3.3
Checklist for Diffraction Data
•
•
•
•
Use synchrotron or monochromatic laboratory X-ray radiation.
If possible, collect data to at least 1.5 Å resolution.
Use transmission capillary geometry.
Do not apply Lorentz or polarisation corrections, or subtract the background, before entering
DASH. DASH will assume raw data and perform these steps itself.
• Esds are preferable in the input file i.e.
<2θ> <count> <estimated standard deviation>
If only <2θ> <count> is available, DASH will automatically calculate esds.
36
DASH User Guide
4
PRELIMINARY INSPECTION OF PROFILE
Unfortunately, it is not possible to guess whether a structure will solve just by looking at the
diffraction data. However, a preliminary visual inspection of the data is always worthwhile, as it may
give clues about possible problems. Things to look out for are:
•
•
•
•
•
•
4.1
Signal-to-noise ratio (see Section 4.2, page 38).
Esds (see Section 4.3, page 42).
Background shape (see Section 4.4, page 42).
Peak shapes (see Section 4.5, page 43).
Balance of peak intensities (see Section 4.6, page 44) and (see Section 4.7, page 45).
Useful 2θ range (see Section 4.8, page 45).
How to Use the Interface to Inspect a Profile
When you input a diffraction data file to DASH, the default display is of the complete data set, over
the full range of 2θ. There are several methods for examining chosen areas of the data set.
4.1.1
How to Zoom in to a Chosen Area
• The simplest way to zoom is to use the left mouse button; ensure that you are in Zoom mode
(this is the default mode) by selecting Default from the Mode menu, or depressing the icon on
the menu bar.
• Click and hold the left mouse button and drag out a rectangle around the area that you want to
zoom in on.
• To zoom out, simply select the Home key on the keyboard. This example shows the effect of
zooming in on two peaks that lie just either size of 10° 2θ. You will see that DASH plots both the
intensity and the error bars.
DASH User Guide
37
• A useful keyboard short-cut for zooming in on the 2θ axis is to select Shift -↑. Selecting Shift -↓
will zoom out on the 2θ axis.
• A useful command to re-scale the intensity axis to the maximum peak height in the selected
range is to select Ctrl - ↑
4.1.2
How to Zoom Out to the Full Data Set
To zoom out and display the full data set, simply select the Home key on the keyboard.
4.1.3
How to Move the View Window Left/Right or Up/Down
You can use the left and right cursor keys to move up left or right through the data in 2θ, (the
horizontal axis). Selecting the Shift key in conjunction with the left or right cursor keys allows the
same movement, but with a smaller step size. The up and down cursor keys allow you to move the
window up and down in the intensity range (the vertical axis).
4.2
Signal-to-Noise Ratio
• How easy is it to distinguish the Bragg peaks from the background? Obviously, the noisier the
data, the less certain we can be of obtaining a definitive crystal structure.
• The following examples should help give you some idea of what good, average and poor quality
diffraction patterns look like:
4.2.1
Example of a Good Profile
This is synchrotron data from a nicely crystalline sample, with an incident wavelength of 0.6 Å. The
background is low and the peak-to-background ratio is excellent, even at high angles. Individual esds
of each point (displayed as vertical bars) are relatively small, showing that data have been collected
for a sufficiently long time:
38
DASH User Guide
DASH User Guide
39
4.2.2
Example of an Average Profile
This is laboratory data (1.7889 Å wavelength) for a nicely crystalline sample (data by permission of
Dr. L. Smrcok). The background counts are higher and the profile generally noisier than the example
synchrotron pattern, but the background-to-noise ratio is still reasonable. The profile is significantly
worse than the synchrotron example at high angle, but peaks are still sufficiently well defined to
produce useful information for structure solution:
40
DASH User Guide
4.2.3
Example of a Poor Profile
This is laboratory data (1.54056 Å wavelength) for a rather poorly crystalline sample (data by
permission of Dr. J. P. Attfield), the peaks are fairly broad and background is high, with little
diffracted intensity beyond about 25o:
DASH User Guide
41
Note: The above data were actually sufficient to solve a problem involving 7 variable torsion angles.
Remember that weak peaks, provided that they are sufficiently well determined, are just as powerful a
constraint on the solution as strong peaks.
4.3
Initial Assessment of Esds
• The error bars on the data points should look similar to those shown in the example profiles. If
they look significantly bigger, then there could be a problem with the esds.
• If you have been given a data set and you suspect that the esds are incorrect, then you can always
replace them with the square roots of the counts, or delete them from the input file and let DASH
calculate them.
4.4
Initial Assessment of Background Shape
• Backgrounds may be largely flat, sloping, or rising-and-falling, as illustrated in the example
42
DASH User Guide
profiles.
• During data input, a Monte-Carlo background estimation routine gives you the chance to fit and
remove the background. You should normally use this background removal option.
• During Pawley fitting, a 2nd order polynomial is then sufficient to represent the background. If
you did not take the background subtraction option, then a higher order polynomial will be used.
The more complex the background, the more terms might have to be used in this polynomial.
4.5
Initial Assessment of Peak Shapes
DASH is able to fit the majority of peak shapes that you will encounter in diffraction from organic
compounds, including asymmetry at low angles due to axial divergence.
Asymmetry due to axial divergence at low angle:
Symmetric peaks at moderate resolution:
DASH User Guide
43
• When visually assessing a diffraction pattern, it is useful to remember that, at low angles, peaks
appear broadened by asymmetry. At high angles, peaks begin to overlap. Thus, it is probably
best to assess the overall peak sharpness from the low to mid range section of the diffraction
pattern, where the probability of diffraction peaks being the result of individual Bragg
reflections is much higher than at high angle.
• Sharp diffraction peaks are obviously preferable, because the sharper the peaks, the less overlap
there will be between adjacent peaks in the pattern.
• The most obvious reason for broad peaks in a diffraction pattern is that the compound under
study possesses intrinsically broad peaks. Frequently, recrystallisation of the sample can
improve matters, but normally we are stuck with the sample as-is and must accept the broader
peaks.
• It is always possible that peaks that appear broad are actually doublets (i.e. closely spaced pairs
of peaks).
• If any of the peaks are noticeably sharper than the others, this can indicate hkl-dependent line
broadening (i.e. some classes of reflections are sharper than others). If only relatively few
reflections are affected and the broadening is not excessive, this will not preclude structure
solution.
4.6
Patterns Dominated by a Few Strong Peaks
If your diffraction pattern is dominated by just a few very strong peaks, the following possibilities
exist:
• The distribution of intensities may be correct. For example, this type of pattern will result if a
planar molecule is lying so that the bulk of its scattering power is concentrated within a few hkl
planes.
• Weak peaks, provided that they are sufficiently well determined, are just as powerful a constraint
on the structure solution as strong peaks.
• The distribution of intensities may be indicative of preferred orientation, i.e. the crystallites in
the powder sample were not randomly oriented with respect to the incident radiation, but tended
to be aligned along a certain direction. Preferred orientation is not usually a big problem if
transmission capillary data has been collected. Whilst, in principle, the direction and extent of
preferred orientation within the sample can be determined as part of the structure solution
process, in the current version of DASH only the extent of the preferred orientation can be
optimised during the simulated annealing.
• In rare cases, a large peak may turn out to be an instrumental artefact e.g. a spike in the detector
electronics. Such rogue points can normally be edited out by hand.
44
DASH User Guide
4.7
Flattened Peak Tops
If strong peaks in your diffraction pattern appear to have flattened tops, it is likely that the detector
has been saturated during the data collection. If the flattening has seriously truncated the height of the
peak, you will not be able to obtain an accurate intensity value for the peak during Pawley fitting.
4.8
Initial Assessment of Useful 2θ Range
• A simple rule of thumb for assessing the useful data range obtained in a powder diffraction
experiment is to take all the data from the lowest 2θ value to the highest value at which Bragg
peaks are still clearly discernible from the background.
• There is little point in including data in the Pawley refinement that is above the useful range; it
will merely slow the refinement down without adding useful information. In extreme cases, it
may actually hinder structure solution, as unreliable information has been introduced into the
problem.
• Structure solution does not normally require as much data as structure refinement. Diffraction
data up to 1.5 Å resolution are normally sufficient for a successful structure solution, though in
many cases, data to 2.0 Å or even lower resolution will suffice.
• DASH will handle up to a total of around 600 refinable intensities during the Pawley fitting
process.
DASH User Guide
45
46
DASH User Guide
5
GENERAL HINTS ON SELECTING, FITTING AND MEASURING PEAKS
Selecting peaks in DASH is necessary for two different reasons. Firstly, it is necessary for measuring
accurate positions of low-angle peaks for input to a cell indexing program. Secondly, it is necessary to
fit the shapes of a number of peaks across a wide 2θ range before performing a Pawley refinement.
This section is applicable to both situations and gives some general advice on:
•
•
•
•
5.1
How to use the interface to select peaks (see Section 5.1, page 47).
The basics of peak fitting (see Section 5.2, page 47).
Fitting multiple peaks and shoulders (see Section 5.3, page 49).
Common problem situations (see Section 5.4, page 51).
How to use the Interface to Select Peaks
• Zoom in to the area around the peak.
• Sweep out an area using the right mouse button, in this example move to about 6.85o 2θ, click
right and hold down as you sweep right to about 7.05o before releasing the right button. The
hatched area now covers the peak and enough background either side to allow an accurate
estimate of the peak parameters. If you are not happy with the area that you've swept out, simply
put the mouse cursor inside the hatched area and select the Delete key on the keyboard to remove
the current selected area, then try again.
5.2
Basic Peak Fitting
• When you first read experimental data into DASH, it will be displayed in the resizable graph
DASH User Guide
47
window. Identify the first peak in the diffraction pattern and zoom in on it, remembering to
include a little baseline either side of the peak if possible:
• Sweep out a selection area by clicking and holding the right mouse button, remembering to
include a little baseline either side of the peak if possible:
• To fit the peak in a hatched area, either press Return or Enter with the cursor positioned inside
that area, or press the following Fit peaks button from the toolbar:
48
DASH User Guide
Selecting this button will fit all areas that have not yet been fitted. The peak is fitted and the fit
displayed as a solid green line. The peak position is indicated by a vertical blue line:
• The program will tell you if you select too small an area for peak fitting.
• If you select a larger area than is necessary for defining the baseline around a peak, no harm is
done, as long as you do not stray into the next peak along. The fitting process simply takes
longer as more points have to be considered in the fit.
5.3
Fitting Multiple Peaks and Shoulders
• More than one peak can be fitted at once. Select an area and give the program the position of the
first peak in the region by moving the cursor over the top of the first peak and selecting 1 on the
keyboard. Move on to the top of the second peak and select 2. Alternatively, new peak positions
can be added by pressing the Insert key. Continue until all the peaks you think are present are
accounted for. Upon selecting Enter, all peaks are fitted and their true positions indicated:
DASH User Guide
49
• Care must be taken to correctly fit peak shoulders due to very closely spaced Bragg reflections:
• Selecting an area containing several diffraction peaks, but fitting only one peak (i.e. the default
fit), results in a poor fit. This can range from the obvious i.e. an entire independent peak is
missed out:
50
DASH User Guide
to the more subtle i.e. a shoulder on a peak is missed:
5.4
Common Peak Fitting Problems
• There are a few circumstances in which you might obtain a poor fit to the data:
• If you are trying to fit a very weak peak with large esds.
• If you fail to select an appropriate region in which the fit will be performed.
• If you do not enter enough peaks to properly describe the data in the selected area.
• If you enter far too many peaks in the selected region.
DASH User Guide
51
• In such circumstances, the peak fitting algorithm may converge to a local rather than a global
minimum. This is usually obvious, as the calculated peaks fail to match the data. It is trivial to
delete a poorly fitted region and try again.
• By way of reassurance, here are some extreme examples where the peak fitting algorithm has
still produced a useful result:
Selected range too short on the right
Three closely spaced weak peaks
Two very weak peaks with large esds
52
DASH User Guide
Selected range too short on both sides
DASH User Guide
53
54
DASH User Guide
6
INDEXING
6.1
Overview of Indexing
• Correct indexing of the powder pattern (i.e. determination of the unit cell dimensions) is crucial:
you cannot solve the structure if the pattern is not indexed properly. DASH can help you with
indexing by allowing you to determine peak positions with great accuracy. However, DASH
does not do the actual indexing itself. For this, you must use one of the many, freely available
cell-indexing programs. DASH does provide an interface for DICVOL (see Section 6.2.6, page
58), which is convenient for many users.
• However, it is strongly recommended that one should use at least two indexing programs. The
freely available CRYSFIRE suite of Shirley provides a rudimentary interface to most of the
popular indexing programs, e.g. DICVOL and ITO and is currently available for download from
http://www.ccp14.ac.uk.
The steps involved in indexing are:
• Selecting the first 20 or so low-angle peaks and measuring their positions for input to the
indexing program. Of course, only the positions of the lines are important for indexing, not their
intensities. It therefore follows that weak peaks carry just as much weight as strong ones in the
indexing process (see Section 6.2, page 55).
• Indexing the pattern to find a plausible set of cell dimensions (see Section 6.3, page 59).
• Checking for possible cells of higher symmetry (see Section 6.4, page 61).
• Checking the cell in DASH by comparing observed and calculated peak positions (see Section
6.5, page 61).
6.2
6.2.1
Selecting Peaks for Indexing
Overview of Peak Selection for Indexing
• You should select the lowest-angle peaks available, regardless of their intensity, to ensure that
the indexing program has a chance to find the correct cell.
• In general, you should pick the first 20 peaks or so (including shoulders), trying not to miss any.
• As long as a peak is clearly present, you should pick it, even if it is weak; but if you are not sure
the peak is significantly above the background, you can leave it. On balance, if you are at all
uncertain about a peak or shoulder, it is probably better to include it in the first instance. You can
easily edit it out of the peak list later if the pattern fails to index.
• As successive peaks are selected, DASH will refine the peak shape parameters.
• Submit these peaks to a cell-indexing program such as DICVOL or McMaille in order to obtain
a preliminary unit cell and crystal system.
DASH User Guide
55
6.2.2
•
•
•
•
6.2.3
How to Use the Interface to Select Peaks for Indexing
Zoom in to well resolved single peaks, working from lowest 2θ upwards.
Pick the peak using the right mouse button as described in Section 5.1, page 47.
Continue picking peaks (the peak count appears beside the blue peak position line).
Finish peak picking when you have between 20-25 peaks.
Auto peak picking for indexing
• DASH contains a heuristic algorithm for automatic peak picking. The algorithm first smoothes
the powder pattern by window integration in a fixed 2θ range of ±0.012o around each point in
the profile. The window width has been determined by experimentation with several sample
patterns; it seems that this width offers a good trade-off between effective smoothing for patterns
collected at narrow 2θ step sizes and masking of peaks in patterns collected with broader step
sizes.
• Next, the pattern is scanned for regions where the intensity is greater than 8 times the residual
background. Auto-peak selection is habitually applied after background subtraction in DASH,
and will not work well on patterns where background has been left in place. In regions where
intensity is greater than 8 times the residual background, high points in the smoothed intensity
are detected and peaks are assigned to these locations. In cases where multiple peaks are found
that are close in 2θ, peaks are merged.
• Using Auto Peak is easy. In the Indexing Wizard, the user reaches the following window: The
user can click on the Auto Select Peaks button and DASH will attempt to fit ranges
automatically. The feature is designed not to be a ‘black box’; after completion, the user is
encouraged to review the assignments made as the heuristics in the algorithm are not perfect.
56
DASH User Guide
• The peaks fitted can be modified and/or deleted after automatic peak fitting by hand. Further, the
user can add in more peaks manually if they so wish.
• Automatic peak picking is not perfect, and as such should not be treated as a black box; often the
peaks picked are sufficient for indexing purposes, but still the user should review the results
carefully after use. The following caveats exist:
• Shoulders on peaks are rarely detected by the current algorithm
• Occasionally, a single actual peak can be assigned 2 or more peak positions, particularly when
said peak is broad (e.g. a t low 2θ)
• Unfitted background renders the algorithm useless
• We occasionally miss weaker peaks
• Some strong pairs of peaks are sometimes misinterpreted as a single peak. This case is a bug
in the code which remains unresolved at time of writing.
• Only the first 20 peaks are fitted: this means the results for the 18th - 20th peaks can appear
strange when the 20th peak overlaps with other higher angle peaks (it can appear that the
algorithm has missed the higher angle peaks as they will lie in the fitting range, but in fact, the
algorithm has decided to ignore the higher angle peaks.)
6.2.4
How to View Peak Positions
• Switch to viewing peak positions by selecting Peak Positions from the View menu:
DASH User Guide
57
6.2.5
How to Cut and Paste Peak Positions to External Programs
Note that if you want to copy the set of peak positions into the notepad for feeding to other programs,
you can easily get the peak positions out of DASH and into a file as follows:
• Select View from the Peak Positions menu and then click on the word Position at the top of the
peak position column. This selects the entire column.
• Use Ctrl-C to copy the entire column to the clipboard.
• Once inside an appropriate editor such as Notepad or Wordpad, use Ctrl-V to paste the column
into a file.
6.2.6
•
•
•
•
•
58
How to create a DICVOL91 input file
Switch to viewing peak positions by selecting Peak Positions from the View menu.
Create an input file for DICVOL using the DICVOL... button (see below).
Fill in the information required on maximum values allowed for cell axes and volume.
Click Save DICVOL File... button. Give a file name e.g. hctpeak21.dat.
Run the DICVOL program with this file as input.
DASH User Guide
• The menu for creating a DICVOL91 file is shown here. In the example below, values have been
entered such that: minimum cell volume = 0 Å3, maximum cell volume = 3000 Å3. The
maximum cell axial length is set to 30 Å, and the maximum monoclinic cell angle is 125o. All
crystal systems except triclinic will be searched, and the wavelength has been set as 1.1294 Å.
As it is synchrotron data, DASH has set the peak position error to 0.02 by default (0.03 for
laboratory data). The other values have been left at their default setting, and will not affect the
DICVOL result.
Alternatively, indexing may be performed using the Wizard (see Section 2.10.1, page 22).
6.3
Running the Indexing Program
• DASH provides an automated interface to DICVOL91, just click Run DICVOL.
• DASH also provides an interface to DICVOL04(and later) and McMaille. The interfaces to
these programs can be accessed through the Peak Picking wizard window.(see Section 2.10.1,
page 22)
• There is no automated interface between DASH and indexing programs other than DICVOL91,
DICVOL04 and McMaille, i.e. it is necessary to set up the input files for the programs by hand.
However, this task is facilitated by copying the peaks from the DASH Peak Positions listing into
the notepad (see Section 6.2.5, page 58).
DASH User Guide
59
• Each indexing program has its own strengths and weaknesses. We have found DICVOL,
TREOR and ITO to be useful when indexing organic crystal structures, but this is not to say that
other programs will not be equally successful.
• Frequently, one program will successfully index a pattern where another has failed. It is
therefore always worth trying at least two indexing programs on each problem.
• Before running an indexing program, it is useful to get some idea of the size of cell you might
expect, given the molecular formula. For example, a molecule comprising 20 non-hydrogen and
25 hydrogen atoms will occupy about 450 Å3 (allowing 20 Å3 for each of the non-H atoms and 2
Å3 for each of the H atoms). Therefore, a good starting point would be to search for cells of up to
~2000 Å3 in volume, as a cell of this size will accommodate four molecules i.e. Z=4, a likely
number when dealing with organic structures. You can always increase this size limit later if you
do not get any reasonable cells from the initial runs.
• The majority of indexing programs were designed for use with relatively small unit cells.
Advances in structure solution mean that people are tackling larger and larger crystal structures,
thus stretching indexing programs to their limits and beyond. For example, it is not unheard of
for TREOR to suggest that a unit cell is too large and that the data should be checked, even when
the cell is correct. A useful trick here is to simply divide all the line positions by two and try
again. The cell that results will be 8 times too small, but you simply double the axial lengths to
recover the correct cell. DASH offers this option through the use of a scale factor.
• By default, DASH creates a DICVOL input file in which the axis lengths is limited to 30 Å or
less. Since organic structures may contain a cell axis of length >30, you may need to alter this
default if initial indexing fails. Similarly, you may need to increase the volume limit beyond
3000 Å if you are dealing with a large structure or a centred cell.
• The majority of organic crystal structures crystallise in monoclinic, orthorhombic and triclinic
space groups and you should check these symmetries first. Within DICVOL and McMaille, the
crystal symmetries are searched in order, from highest to lowest symmetry. As the symmetry
falls, the cell searches take longer to execute. It can take quite a while (possibly 2-3 hours, even
on a fast processor) to find triclinic cells using DICVOL or McMaille. This is the main reason
why triclinic cells are not searched by default, so don’t forget to try triclinic if your initial
indexing attempts fail.
• Some indexing programs (e.g. TREOR) will report if they have located a non-primitive unit cell
whereas other simply report the equivalent primitive cell.
• Like most indexing programs, DICVOL gives two figures of merit, M(#lines) and F(#lines), for
identifying the best solution. For synchrotron data, M(20) values of 50 or more and F(20) values
of 100 or more are encouraging. Values for laboratory data will be generally lower – an M(20)
of, say, 20 or more might be considered reasonable and worthy of pursuit. McMaille reports a
number of figures of merit for its solutions and even suggests cells that it judges to be worth
investigation.
• Multiple solutions (i.e. several possible unit cells) are a common occurrence, especially when
60
DASH User Guide
the input data are not especially good. However, even when the data are good, a program may
report two or more unit cells that apparently match the data. In such circumstances, the solutions
should be closely examined. If all the cells have almost identical cell volumes, then they are
likely to be alternative settings of the same cell, and any one of them could be used. This can be
checked by cell reduction. If, however, the cells are markedly different in volume, then they are
likely to be unrelated and each one needs to be examined more closely.
• If you find several cells, all with good figures of merit, the correct cell is likely to be the one of
highest symmetry.
• A large number of low figure-of-merit solutions is normally a bad sign – it indicates that the
input positions are sufficiently vague that a number of cells match to within experimental error.
• If you have trouble finding a cell, it is sometimes worth deleting the last 3 or 4 peaks from the
input, e.g. try with the first 16 rather than the first 20 peaks. Or try deleting very weak peaks or
dubious shoulders. It is important to realise that DICVOL is more tolerant of missing lines than
it is of spurious lines. Most importantly, try another program.
6.4
Searching for Cells of Higher Symmetry
• Once a plausible cell has been obtained from an indexing program, it is worth performing cell
reduction, using a program such as TRACER, to check whether it corresponds to a cell of higher
symmetry.
• Searching for cells of higher symmetry is particularly important when the cell from the indexing
program is triclinic. This is especially true when the indexing program lists a lot more calculated
than observed peaks, since this suggests systematic absences.
• Cell reduction is also useful for identifying equivalent solutions, i.e. cells from the indexing
program that appear to be different but actually correspond to the same reduced cell.
6.5
Checking the Cell in DASH
• Once a pattern has been indexed and a preliminary cell identified, you can return to DASH and
input the profile and the cell. You will need to specify a space group: start with the space group
of the crystal system that has no systematic absence (e.g. P2 for monoclinic). The pattern is
displayed with tick marks indicating the reflection positions predicted from the input cell and
space group:
DASH User Guide
61
62
DASH User Guide
• The first thing to do is to check that the tick marks actually correspond to the pattern, i.e. that the
unit cell is correct. The correspondence shown below is very good, indicating that the cell is
probably correct. The excess tick marks are probably systematic absences, indicating that the
correct space group has a higher symmetry than the one currently being assumed.
DASH User Guide
63
64
DASH User Guide
7
SPACE GROUP DETERMINATION
Once the pattern has been indexed, you have a putative cell and crystal system. The next step is to
determine the space group.
•
•
•
•
7.1
Probabilistic approach to space group determination (see Section 7.1, page 65).
Identifying systematic absences (see Section 7.2, page 66).
An example of identifying systematic absences (see Section 7.3, page 67).
Dealing with space group ambiguities (see Section 7.4, page 68).
Probabilistic Approach to Space Group Determination
• DASH provides an interface to Extinction Symbol, a program that identifies the most probable
space groups for a set of reflections and their intensities (see Appendix H: References, page
189). In order to furnish Extinction Symbol with the required information a Pawley fit to the
diffraction data must be obtained, in the most general extinction group of the crystal system
under consideration. For more information about the Extinction Symbol program please look at
the product manual which includes a reference to the published research paper.
• Once the crystal system and unit cell parameters have been entered, click on Space Group in the
DASH Wizard: Unit Cell Parameters window. DASH automatically sets the space group to the
most general for the crystal system chosen.
• Proceed to the Pawley Refinement window (see Section 8.2, page 69). Select 6-10 individual
peaks distributed over the whole 2θ range of the pattern. Once DASH has stable values for the
unit cell and peak shape parameters, the DASH Wizard : Pawley Refinement Status window will
automatically pop-up.
• Obtain a good Pawley fit to the data by refining the background, unit cell and zero-point
parameters. When satisfied with the fit, launch the space group determination program by
pressing the Run> button.
• The console window for Extinction Symbol appears. Once the program has finished running the
results of the extinction symbol determination they can be viewed by pressing Enter on the
keyboard. The most probable extinction symbols, along with their probabilities, are displayed in
descending order in the right hand column.
• When the results window is finished with, close the window. In the Pawley Refinement window
click <Back. The files that have been generated during space group determination, including the
table of results can be removed at this point by clicking Yes in the Confirm dialogue box. The
files will not be deleted if No is chosen.
• The space group associated with the most probable extinction symbol can now be selected from
the Space Group drop down menu. Occasionally there will be a choice of space groups for the
extinction symbol returned.
DASH User Guide
65
• For guidance, a table listing the extinction symbols with their associated space groups is
available (see Appendix E: Extinction Symbols and their Space Groups, page 176). It may be
also be useful to refer to the table of most probable space groups when deciding which space
group to try first (see Appendix D: Frequency of Occurrence of Space Groups, page 159).
• Check the agreement between the calculated Bragg reflections of the chosen space group as
shown by the tick marks and the peak positions of the experimental pattern. Please note that the
purpose of Extinction Symbol is to provide guidance in identifying the space group; it is not a
substitute for good judgement.
• Perform a Pawley Refinement in the chosen space group, as normal.
7.2
Identifying Systematic Absences with DASH
• Systematic absences can be identified in DASH by comparing, for different possible space
groups, the observed peak positions with those calculated from the cell and postulated space
group. These are represented by tick marks at the top of the profile display.
• Even if you already have clues about the space group, it is probably best to start by selecting the
primitive space group of the appropriate crystal system with no systematic absences (e.g. P2 for
monoclinic). Look to see if the gaps in the pattern match the gaps in the tick marks.
• Zooming the picture helps a lot when assessing whether a peak is matched by a tick mark.
• Do not worry about tick marks that are not matched by peaks in the profile: they could be
systematic absences or weak peaks. However, peaks with no corresponding ticks are a warning.
If you do see a peak in the profile with no matching tick mark, the cell is probably wrong,
though impurities or instrument spikes should not be ruled out.
• Having examined the space group with no absences, you can now try space groups of higher
symmetry to account for any systematic absences in the pattern. Browse through the space
groups comparing calculated and observed peak positions.
• A useful technique is to cycle through space groups with just one cause of systematic absence
(e.g. A2, B2, C2, I2, etc.) since this may enable you to eliminate a complete set (e.g. all Ccentred space groups) quickly.
• It is necessary to look separately at different settings of the same space group, e.g. P21/c, P21/n
and P21/a, since the cell from the indexing program could correspond to a non-standard setting.
• Although you are looking mainly for peaks in the observed pattern that do not have matching
tick-marks (since this virtually eliminates that space group), do remember to look for the
opposite discrepancy. If there are a lot of calculated peaks that are not observed, you may be
looking for a space group with more systematic absences.
• Another way of identifying systematic absences is to perform a Pawley fit in the space group
with no systematic absences. At the end of the Pawley fitting procedure, the output file polyp.hkl
can be examined for systematic absences and the space group deduced from these absences.
66
DASH User Guide
7.3
Identifying Systematic Absences: an Example
• The tick marks in the following figure correspond to the space group P2:
• The peak around 7.6o 2θ appears to be absent. If the user changes the space group to P 1 21 1 (a
likely choice) the graph is updated with a new set of tick marks:
• The predicted peak at 7.6o is an absence in P 1 21 1; other predicted peaks are consistent with the
observed data and so the fit can be performed in P 1 21 1.
DASH User Guide
67
• If you pick the wrong space group, it is often obvious. The following display results if the space
group is changed to P 1 c 1. This choice of space group is clearly wrong, since the strong peak at
about 7.0o would need to be systematically absent:
7.4
Space Group Ambiguities
• If it is difficult to decide which of two space groups is a better match to the pattern, you can try
toggling between them several times to identify subtle differences between the calculated peak
positions. For example, you might find a point at which one of the space groups has two tick
marks and the other has only one. If the peak underneath is unusually broad, this indicates that
the former space group is slightly more likely.
• Inevitably, there will be many cases where the space group cannot be determined
unambiguously. In this situation, there is little choice other than to try each possibility in turn,
starting with the space group that has the highest statistical probability of occurrence (see D.1
Space Groups Listed by Frequency of Occurrence, page 159). In extreme cases, it may be
necessary to attempt Pawley fitting and even structure solution in all possible space groups.
• Appendix D: Frequency of Occurrence of Space Groups (see page 159) lists space groups in
decreasing order of their frequency of occurrence in the Cambridge Structural Database. A
separate listing is given for chiral space groups, if you know that your structure is
enantiomerically pure (see D.2 Chiral (Sohnke) Space Groups Listed by Frequency of
Occurrence, page 161).
• Of course, there are space groups that have identical systematic absences. In such cases, the
powder diffraction data alone are insufficient to determine the true space group. In principle, the
distribution of structure factors can distinguish between centrosymmetric and noncentrosymmetric space groups, but in practice, powder diffraction data are rarely of sufficient
quality to permit this distinction.
68
DASH User Guide
8
PAWLEY FITTING
8.1
Overview of Pawley Fitting
The aim of Pawley fitting in DASH is to fit the observed powder profile in the absence of a structural
model using: (a) a polynomial representing the background, (b) a set of parameters describing peak
shape, (c) zero-point and cell-dimension parameters, and (d) estimates of the individual reflection
intensities. The overall fit between the resulting calculated profile and the observed profile is
displayed graphically and expressed by a number of goodness-of-fit statistics, including χ 2. Provided
the fit is good enough, the refined reflection intensities can then be used for structure solution.
The final Pawley fit to the data represents the best fit to the data that you can obtain. As such, it serves
as a reference value to aim for during the structure solution process. The final Pawley fit chi-squared
can be viewed throughout the rest of the structure solution process by selecting Pawley / SA from the
View menu (see Section 2.6.5, page 16).
This section covers how to perform Pawley fitting of your data, including:
• An overview of the usual sequence of steps (see Section 8.2, page 69).
• Truncating the profile (i.e. identifying the 2θ value beyond which there is little or no useful
Bragg intensity) (see Section 8.4, page 75).
• Selecting and fitting peaks so as to obtain good estimates of peak-shape and cell parameters
prior to performing the initial Pawley fit (see Section 8.5, page 79).
• Performing an initial Pawley fit of the background and reflection intensities (see Section 8.6,
page 83).
• Improving the fit by refining the cell, zero-point and, possibly, peak-shape parameters (see
Section 8.7, page 85).
• Assessing the quality of a Pawley fit (see Section 8.8, page 87).
• Dealing with numerical instabilities (see Section 8.9, page 90).
8.2
Sequence of Operations in Pawley Fitting
The usual sequence of operation in Pawley fitting, as implemented in DASH, is:
• Truncate the data to a suitable range for structure solution (see Section 8.4, page 75).
• Specify a space group and initial values for the cell parameters (see Section 7, page 65). The
Pawley fit can be performed in the default space group (i.e. a group with no systematic absences)
of the appropriate crystal system, or in the true space group if it is known.
• Select about 8 peaks from across the 2θ range, choosing (as far as possible) strong, single
reflections (see Section 8.5, page 79). As the peaks are selected, DASH automatically refines the
cell dimensions and the peak-shape parameters. Note that the automatic cell refinement does not
DASH User Guide
69
•
•
•
•
8.3
commence until sufficient reflections with non-zero values of h, k and l have been sampled.
Once the program is satisfied with the stability of these parameters, it allows simultaneous
refinement of (a) a polynomial representing the background, and (b) the reflection intensities.
The cell parameters, zero-point and peak-shape parameters are kept fixed during this stage of the
procedure (see Section 8.6, page 83).
If the fit looks promising, then it is usual to run more cycles of refinement allowing the cell
parameters and zero-point to vary (see Section 8.7, page 85).
Finally, some or all of the peak-shape parameters may be refined, though this is rarely necessary
(see Section 8.8, page 87).
The results of the Pawley refinement (crucially, the reflection intensities and their covariances)
can then be saved for use in structure solution (see Section 10, page 101).
How to Use the Interface for Pawley Fitting
There are two methods for setting up the information needed for the Pawley Refinement:
• The DASH Wizard which will help ensure that items are not forgotten (see Section 2.10, page
21).
• The main Window option, for more experienced DASH users (see Section 8.3.1, page 70).
8.3.1
•
•
•
•
•
•
•
•
•
•
•
8.3.2
Using the Main Window to Prepare for Pawley Refinement
Load an X-ray diffraction powder pattern (see Section 2.2, page 5).
Subtract the background (see Section 2.4.1, page 9).
Select View from top-level menu.
Select Diffraction Setup from tab bar.
Input type of data e.g. Synchrotron, Wavelength etc. (see Section 2.6, page 12)
Click Apply.
Select Cell Parameters from tab bar.
Fill in details of the cell dimensions and space group.
Click Apply.
Click OK.
Proceed to pick peaks (see Section 5.1, page 47).
Picking of Peaks for Pawley Refinement
• Zoom in to isolated single peaks, working from low to high 2θ (see Section 4.1, page 37).
• Fit the peaks using the right mouse button as described in Section 5.1, page 47.
• Continue picking peaks, remembering that you need to sample a total of about 8 over the whole
70
DASH User Guide
2θ range.
• When 8 peaks have been fitted a Pawley Refinement Status window appears (see Section 8.3.3,
page 71).
8.3.3
Pawley Refinement Interface
The Pawley Refinement Status window appears by clicking the icon in the main window, or by
selecting Pawley Refinement from the top-level Mode menu.
The options available are:
Refined variables:
• Intensities: all Pawley refinements treat the reflection intensities as variables in a least-squares
fit.
• Re-use refined intensities: DASH utilises the intensities extracted from the previous cycle as a
starting point for the next cycle. Deselection of this option causes DASH to ignore the previous
values and generate a new set from scratch.
• Unit Cell: when selected, the unit cell parameters are refined.
• Zeropoint: when selected, the zero-point correction for the diffraction data is refined.
• Background: when selected, a polynomial of order shown is fitted to the background (see
Section 8.6.1, page 83).
• N(back): the number of terms to be used in the polynomial.
• Sigma(size): when selected, the peak shape parameter sigma-1 is refined (see Section 8.6.2, page
85).
DASH User Guide
71
• Sigma(strain): when selected, the peak shape parameter sigma-2 is refined (see Section 8.6.2,
page 85).
• Gamma(size): when selected, the peak shape parameter gamma-1 is refined (see Section 8.6.2,
page 85).
• Gamma(strain): when selected, the peak shape parameter gamma-2 is refined (see Section 8.6.2,
page 85).
Fixed Parameters:
• Overlap Criterion: this controls when closely overlapping peaks are treated as a single variable
in the Pawley fit, rather than as discrete variables. The default value of 1.0 is sufficient for fitting
most data sets.
• Damping: Setting this factor to a value of e.g. 0.1 might help stabilise very unstable refinements.
Refinement Status:
The lower section of the window displays the current status of the refinement:
• Cycle number: the spinner gives control over the maximum number of cycles of refinement that
are performed upon selecting the Refine button.
• Refinement number: this simply records a sequential number for each refinement that has been
run.
The bottom line of boxes reports the results of a refinement run:
• Reflections: this is the number of extracted reflection intensities.
• Points: this is the number of profile data points used.
• Rwp: this is the weighted profile R-factor (see Appendix C: Definitions of DASH Figures of
Merit, page 157).
• R(exp): this is the expected profile R-factor (see Appendix C: Definitions of DASH Figures of
Merit, page 157).
• Chi2: this is the profile χ 2 (see Appendix C: Definitions of DASH Figures of Merit, page 157).
Buttons:
• Refine: start the Pawley refinement.
• Close: close the window.
• Accept: accept the results of the refinement that has just completed.
• Reject: reject the results of the refinement that has just completed.
• Save as... : save the refinement results as a Pawley-Fit file ready for structure solution (see
Section 8.3.5, page 74).
72
DASH User Guide
• Solve: proceed to the Structure Solution stage (see Section 10, page 101).
8.3.4
Pawley Refinement: an Example
Using the Example.xye file, the unit cell parameters and space group information, and having selected
8 peaks (see Section 8.3.2, page 70) you will arrive at a window as shown in Section 8.3.3, page 71.
• In this example, we have assumed that the background has been fitted by the Monte-Carlo
background subtraction routine. If the background had not already been subtracted, the only
difference would be that N(back) would be automatically set to 10.
• The data has been truncated to a resolution of 2.0 Å.
• In the initial Pawley refinement, only the terms describing the background and the terms
corresponding to individual reflection intensities are refined, using the previously refined unit
cell and zero-point.
• When you select Refine 3 cycles of least squares are performed.
• This should return figures similar to the ones given below:
89 reflections 6950 points Rwp= 33.52 Rexp = 9.22 χ 2 = 13.210
• Select Accept to accept the results of this refinement, the fit is displayed.
• Now click in the main window and select Home to see how well the data are fitted. The
(observed minus calculated) plot is shown in pink and emphasises any misfit in the data. If you
look closely at the data, you are likely to see something like this:
DASH User Guide
73
The next stage is to refine Background, Intensities, Unit Cell and Zeropoint. DASH assumes that after
the initial background and intensities fit, you will automatically want to refine the unit cell and zeropoint. Accordingly, tick marks are automatically set in the menu boxes. Normally 5 cycles of
refinement are sufficient. Click the Refine button and then the Accept button to store the results of
refinement. The Pawley Refinement Status window now looks like this:
8.3.5
Saving the Results of Pawley Refinement (Pawley-Fit files)
• In the example shown in Section 8.3.4, page 73 the χ 2 of 3.087 is very good, so you would then
save the results of this refinement as the basis for structure solution.
• Select Accept and then Save as...; the Save Diffraction Information for structure solution window
appears into which you can enter a file name, e.g. Example.sdi; click Save.
• You can save the results of several independent Pawley refinements, each in its own Pawley-Fit
file, with extension .sdi.
8.3.6
Mathematical Problems with Pawley Refinement
For poor quality data sets there can be problems in fitting the background with the polynomial
mathematical procedure. When this happens an Errors detected during Pawley fit window will
appear:
74
DASH User Guide
View fit list file shows the output of the fitting program. If you look at the last few lines of this file
there are messages as to why the procedure failed. Do not accept the results of this refinement. Check
the following:
• 2θ range: consider if there is really any useful data above a certain 2θ, and truncate(see Section
8.4, page 75).
• Overlap Criterion: it is always worthwhile re-running the refinement with a larger value of the
Overlap Criterion (see Section 8.3.3, page 71). For heavily overlapped, weak data, a value of 2.0
may suffice to stabilise the refinement.
8.4
Truncating the Data
• DASH limits the number of reflections that can be refined in a Pawley refinement to around 350.
This is all that you will need to solve the majority of organic structures. Accordingly, it may be
necessary to truncate the data, i.e. throw away counts above a certain 2θ value.
• The actual truncation of the data must be done before the Pawley refinement stage, either by
manually editing the input data file or by using the Wizard.
• You must judge the point in the profile at which the significant information ends.
• As a general rule, if data can be used up to 1.5 Å, there will generally be enough information to
solve most organic structures; i.e. for CuKα1 radiation (wavelength l = 1.54056 Å):
θ = sin-1(l/2d)
Therefore:
θ = sin-1(1.54056/ (2 * 1.5) ) ≅30o
Therefore:
2θ ≅60o
DASH User Guide
75
Sometimes, the powder pattern will not contain useful data to this high angle. In such cases, it is
better to cut the data down to lower resolution e.g. 2.0 Å or even 2.5 Å.
• Examples are provided illustrating some suitable cut-off points for:
• A high resolution profile (see Section 8.4.1, page 76).
• A medium resolution profile (see Section 8.4.2, page 77).
• A low resolution profile (see Section 8.4.3, page 78).
8.4.1
Truncating High Resolution Data: an Example
• Synchrotron dataset, with an incident wavelength of 1.1 Å; thus data were collected to maximum
2θ = 60o, equating to 1.1 Å spatial resolution:
• There are 418 reflections in this data range, which is slightly more than DASH will handle by
default. However, a significant proportion (nearly 25%) of these reflections occur in the last 5%
of data:
76
DASH User Guide
• Although the crystal is still diffracting quite strongly at this point (sufficiently well for the
information content to be useful in structure refinement) it is clear that the extent of reflection
overlap is high. If we cut the data limit back 5o to 55o, we simplify the problem by reducing the
number of reflections to be refined to only 323, at the cost of only 0.1 Å loss in spatial
resolution. In fact, this structure can easily be solved from data extending to 1.0 Å resolution
(43o 2θ) and the total number of reflections in this range is then only 163.
8.4.2
Truncating Medium Resolution Data: an Example
• Synchrotron dataset with an incident wavelength of 0.85 Å, so 1.5 Å resolution equates to
around 2θ = 33o
• It is clear that diffraction is still strong at the high-angle end:
DASH User Guide
77
• There are around 350 reflections in the full data range and this can easily be fitted, so truncation
is not necessary.
8.4.3
Truncating Low Resolution Data: an Example
• Synchrotron dataset with an incident wavelength of 1.15 Å; thus, 1.5 Å spatial resolution
equates to a 2θ value of 45o. However, it is clear that the diffraction data is fading long before
this point:
• Given the poor signal to noise ratio, there is little point in fitting the data beyond about 30o,
which equates to about 2.2 Å resolution (this is sufficient to solve the structure):
78
DASH User Guide
8.5
Choosing Peaks Prior to Initial Pawley Fitting
The first step in Pawley fitting is to select some peaks for refining the peak-shape parameters and the
unit cell dimensions. Once enough peaks have been selected (usually 8 to 10), and stable estimates of
these parameters have been obtained, an initial Pawley refinement of the background and reflection
intensities can be performed. Guidelines for peak selection are:
• If possible, choose strong, well-defined reflections that, collectively, span a broad 2θ range.
• They should include at least one or two peaks at low 2θ, so that any low-angle peak asymmetry
is well described in the refinement of the peak-shape parameters.
• If possible, isolated reflections should be chosen. These can be identified by looking at the tick
marks at the top of the display, which show the reflection positions calculated from the cell and
space group you have specified. However, it is valid to fit multiple peaks if necessary.
• As selection of peaks proceeds, DASH will update peak shape parameters, and then cell
parameters, and then indicate that it is ready to perform the initial Pawley refinement.
8.5.1
Choosing Peaks Prior to Initial Pawley Fitting: an Example (see page 79)
8.5.1
Choosing Peaks Prior to Initial Pawley Fitting: an Example
The following example of peak selection for Pawley refinement illustrates some of the situations you
will encounter:
• Fitting the first three peaks in the pattern. These peaks are all fairly strong and well separated
and can be fitted easily. Inclusion of these peaks helps subsequent cell refinement (as they
correspond to low order reflections) and gives a good parameterisation of any asymmetry
DASH User Guide
79
present:
• Looking further up the pattern, there is a strong peak that could be selected, but it has a weak
satellite peak to the right, which would need to be fitted simultaneously. The weak peak is not
strong enough to provide useful peak parameterisation information in its own right, but it is
strong enough to affect parameterisation of the strong peak, so would have to be included in the
fit. There are almost certainly better choices at other points in the pattern, so do not use these
peaks:
• Still further up the pattern, there is a strong isolated peak that can easily be used. The triplet and
the doublet on either side of it could be selected too, but we really want to sample peaks
throughout the 2θ range in order to parameterise the peak shape right across the pattern. By
fitting the triplet, we simply get three peaks telling us about the local peak shape around 2θ =
11.37o. Fitting the single peak at ~11.56o gives us exactly the same information:
80
DASH User Guide
• Even further up the pattern, there is a nicely isolated pair of fairly strong peaks. We could fit
these reflections individually, but as they overlap a little, it is better to fit them together as a
doublet:
• Note that these two peaks contribute two entries in the list of peak positions (select Peak
Positions from the View menu) yet only a single entry in the lists of peak shape parameters
(select Peak Widths from the View menu) as both peaks have been fitted with the same values
for sigma and gamma.
• Moving further up again, there is a peak that has contributions from two Bragg reflections (i.e.
there are two tick-marks close together above the peak), but there are no clues as to their exact
relative positions. Peaks such as this are best avoided because, each time a peak is fitted, DASH
attempts to refine the input unit cell (the one you obtained by indexing, and entered at the start of
the Pawley fitting process). In this situation, the peak positions are not well defined and there is
a risk that the cell could be refined away from the correct values. Thus, avoid:
DASH User Guide
81
• Next, we find a moderately strong reflection which is sufficiently isolated to allow fitting, even
with a narrow selection range. The very weak peak on the left is not strong enough to interfere:
• This is the 7th peak selected; thus we have accurate peak shape descriptors and peak positions for
7 peaks throughout the pattern. This is sufficient information for a least-squares cell refinement
to be performed on this monoclinic cell, and DASH will do this automatically. A sign that lattice
parameter refinement has commenced is that the tick mark above the peak jumps closer to the
peak after fitting; this indicates that the cell has been updated to incorporate the latest peak
position.
• DASH has automatic settings that determine the best point at which to attempt a full Pawley
refinement. At this time, it automatically displays the Pawley Refinement Status window. In this
example, the window is not yet displayed, so we continue picking peaks.
82
DASH User Guide
• Further up the pattern, there is another isolated peak which is easily fitted. Now, with a total of 8
peaks fitted, the Pawley Refinement Status window is displayed automatically.
8.6
Initial Pawley Fitting of Intensities and Background
• Once enough peaks have been selected and the program has stable estimates of the cell
dimensions and peak-shape parameters, you can perform an initial Pawley fit of the reflection
intensities and the background. This will be indicated by the appearance of a pop-up window.
• Usually, you should keep the cell dimensions and peak-shape parameters fixed in this initial
refinement. Allowing them to vary is likely to destabilise the refinement.
• The following subsections cover:
• Background fitting (see Section 8.6.1, page 83).
• Reflection-intensity fitting (see Section 8.6.2, page 85).
8.6.1
Background Fitting of Raw Data in the Pawley Refinement
• Note that in this example, we have assumed that the background has not been fitted by the
Monte-Carlo background subtraction routine. This is by way of illustrating use of the Pawley
refinement for a raw data set.
• Background intensity is primarily due to amorphous content in the sample and scattering from
experimental components such as a glass capillary or cryostat chamber.
• The background is fitted to a polynomial which, by default, has 10 terms.
• It is undesirable to use more background terms than necessary to describe the data, since high
order polynomials can begin modelling genuine peak intensity. This leads to high correlations
between the background and peak intensities, especially at high angles.
• A polynomial with as few as 5 terms might be enough for a flat or gently curving background; at
DASH User Guide
83
the other extreme, you should never have to use more than about 15. Normally, the simplest
policy is to try the default of 10 and accept it if the fit looks satisfactory.
• The following example profile has a very non-uniform background:
• In this case, a total of 10 background terms were used and the Pawley fit returned Rwp=5.9,
Rexp=2.5 and χ 2 = 5.6. Some misfit (though not much) is evident between the peaks at high
angles:
• Increasing the number of background terms to 15 brings about a significant improvement, with
Rwp=5.65, Rexp=2.5 and χ 2 = 5.15:
84
DASH User Guide
• A further increase to 20 background terms improves the fit slightly, but the high angle plot is
virtually indistinguishable from that with 15 parameters, so the gains in going to 20th order are
not worth it (In fact, the fit with a 10th order polynomial is sufficient to solve the structure).
8.6.2
Reflection-Intensity Fitting
• In fitting the individual reflection intensities, a peak shape description function is centred at the
calculated 2θ of each reflection. The parameters used in the function (σ 1, σ 2, γ1, γ2) have already
been determined from the initial set of peaks you selected and should not be varied at this stage.
They can be refined later, once the unit cell and zero-point have been fully optimised.
• The fitting procedure not only estimates the individual reflection intensities but also their
covariances.
• If a group of reflections are too close together, then the observed intensity for that clump of
reflections is treated as a single variable, with the resultant intensity partitioned equally between
the component reflections.
• Look at the output file polyp.lis to get information about which reflections have been merged
together in this way. The file also lists the total number of reflections and other diagnostic
information.
8.7
Hints for Improving the Pawley Fit
Once a reasonable initial Pawley fit has been obtained, it can usually be improved by:
• Adding into the refinement the cell dimensions and zero-point (see Section 8.7.1, page 86).
• Refining some or all of the peak-shape parameters (see Section 8.7.2, page 86).
DASH User Guide
85
8.7.1
Cell Dimension and Zero-Point Refinement
An initial Pawley fit can almost always be improved by adding into the refinement the cell
dimensions and zero-point.
• The cell dimensions will now be refined against the whole of the profile rather than the small
number of peaks you chose initially.
• The zero-point (origin of 2θ axis) may have been measured experimentally for the instrument on
which data were collected, but it is always desirable to refine it anyway. A refined absolute value
of 0.01o would not be atypical.
• An error in the zero-point may manifest itself on the profile difference plot by a systematic shift
in peak positions.
8.7.2
Peak Shape Refinement
• Unless and until the peak-shape parameters are explicitly included in the Pawley refinement,
their values will be based only on the few peaks you chose when setting up the initial
refinement.
• Normally, you should not need to refine the peak shapes further. However, if you notice that
certain peaks are not well fitted, it may be worth including them directly in the peak shape
estimation process. Sweep out an area to select the peak and fit as before. The overall peak shape
description will be updated and you can re-run the Pawley fit with the updated parameters.
• The peak shape used within DASH is a full Voigt function (a convolution of a Lorentzian and a
Gaussian function) which uses 2 parameters (σ 1 and σ 2) to describe the angle-dependent
Gaussian component:
σ 2 = σ 12 sec2 θ + σ 22 tan2 θ
and 2 parameters (γ1 and γ2) to describe the angle-dependent Lorentzian component:
γ = γ1 sec θ + γ2 tan θ
There are also two asymmetry parameters, HPSL and HMSL, but these are fully defined by the
peak fitting procedure and cannot be refined during the Pawley fitting.
• The refined values of the peak-shape parameters may be seen by selecting Peak Widths from the
View menu. The values should all be positive, though small negative values are occasionally
obtained.
• There may be some cases (usually those that involve some anisotropic line broadening) in which
it is useful to refine the peak parameters within the least squares of the Pawley fit. In general,
only peak shape parameters of sizeable magnitude should be refined; there is little to be gained
by refining a single parameter that is very close to zero, as its contribution to the overall
magnitude of the composite width will be negligible. Refinement of small peak shape
86
DASH User Guide
parameters may lead to numerical instabilities.
8.8
Assessing the Quality of the Pawley Fit
The quality of a Pawley fit must be judged in two different ways, both of which are important:
• How good are the goodness-of-fit parameters ? (see Section 8.8.1, page 87)
• How do the observed and fitted profiles compare visually ? (see Section 8.8.2, page 87)
8.8.1
Interpreting Pawley Fit Parameters
• The parameters Rwp, Rexp and χ 2 are a guide to the quality of a Pawley fit (see Appendix C:
Definitions of DASH Figures of Merit, page 157).
• Ideally, Rwp should be close to Rexp and χ 2 should be close to 1.0.
• However, this ideal is often not met in practice, particularly before the cell and zero-point have
been refined, and particularly with laboratory data. For example, four recent Pawley fits in a
laboratory gave χ 2 values of about 1, 5, 15 and 30. These were all synchrotron data sets;
generally you should expect higher χ 2 values with laboratory data.
• A χ 2 < 1.0 indicates that the esds on the data set are not quite correct (specifically, they have
been overestimated).
• You should not rely solely on the fit parameters; visual inspection of the fit is essential.
8.8.2
Visual Assessment of Pawley Fit
• There is no substitute for examining by eye the fit of observed and calculated profiles; figures of
merit which pertain to the entire pattern do not highlight local problems, such as peaks that
might not be fitted at all (e.g. impurity peaks).
• The following example shows a good fit. The pink difference plot shows no marked areas of
misfit:
DASH User Guide
87
• Zooming in on the fit to the data in the mid range of the pattern shows an excellent fit to the data:
• The same is true at high angle:
88
DASH User Guide
• If the positions of calculated and observed peaks do not match well (e.g. because the zero-point
and unit cell are not properly refined), there is a characteristic sinusoidal difference plot:
• In this example, the problem is solved by refining the cell and zero-point:
DASH User Guide
89
• Slightly too narrow peak widths result in a rise; dip; rise difference plot. This is often seen as a
weak trace around very strong peaks:
• A small misfit in tails is not serious: you should start to worry if the misfit is somewhere
approaches one-third of the peak height.
• If a dip; rise; dip difference signature is seen, the calculated peak is too wide.
8.9
Numerical Instability in Pawley Refinement
Sometimes, a Pawley refinement will diverge and DASH will display an error message. Possible
ways of removing the numerical instability include:
90
DASH User Guide
• Truncating the data a bit more (see Section 8.4, page 75).
• Reducing the number of background parameters.
• Taking advantage of the automatic background subtraction that DASH offers (see Section 2.4.1,
page 9).
DASH User Guide
91
92
DASH User Guide
9
BUILDING AND CONSTRAINING MOLECULES
9.1
Overview of Building and Constraining Molecules
DASH solves structures by taking a model of the molecule (or molecules) in the asymmetric unit and
moving it (them) around, subject to the constraints of space-group symmetry, until it finds a good
match between calculated intensities and those derived from the Pawley fitting. If necessary, rotatable
torsion angles in the molecule(s) are allowed to vary, either through a complete 360o range or through
a smaller range defined by the user. If the asymmetric unit contains more than one molecule, they are
moved independently of one another.
A requirement for solving structures, therefore, is to input appropriate 3D models of the molecule(s).
Important things to consider are:
• Building molecules in third-party programs (see Section 9.2, page 93).
• Converting molecules to Z-matrices (see Section 9.4, page 95).
• Reading molecules into DASH and defining the ranges through which bonds can be rotated (see
Section 9.5, page 96).
• Treatment of rings (see Section 9.6, page 96).
• Treatment of stereoisomers (see Section 9.7, page 97).
• Molecules on special positions (see Section 9.8, page 98).
• Structures with more than one molecule in the asymmetric unit (see Section 9.9, page 98).
9.2
Building Molecules in Third-Party Programs
There are several programs available for building 3D models of molecules, so DASH does not
provide this capability (see Appendix B: Programs for Building 3D Molecules, page 157). Points to
remember when building molecules are:
• Ensure that the bond lengths, bond angles and ring conformations have reasonable values, since
they will not normally be allowed to vary during simulated annealing. This is most easily
achieved by using a fast force-field type minimisation in a modelling package.
• Tables of standard bond lengths may be found in Volume C of International Tables for X-Ray
Crystallography.
• Torsion angles around single, acyclic bonds can usually be set to any value, since they will be
varied during the simulated annealing process.
• Stereochemistries will not be altered during simulated annealing, so if a molecule has more than
one chiral centre, it is important that the relative stereochemistries are correct. (If you do not
know what is correct, there may be no choice other than to try simulated annealing with each
possibility in turn). Absolute stereochemistry does not matter.
• The positions of hydrogen atoms will make little difference to fitting X-ray powder patterns, so
DASH User Guide
93
protonation states and torsion angles involving H atoms are not critical. (In practice you may
often omit H-atoms entirely.)
• Write molecules out as mol or mol2 files. These can then be read into the DASH program for
conversion into the Z-matrix format that DASH requires (see Section 9.4.1, page 95).
• Check the geometry of similar molecules in the CSD (see Section 9.3, page 94).
9.3
Using the Cambridge Structural Database (CSD) to Check Models
• Most molecular model building programs start from a user-created 2D diagram with bond types,
from which to construct an approximate 3D model. This is then minimised from this starting
point using various force-fields at whatever level of sophistication is available in the program.
• For many molecules there will be no ambiguity as to the final 3D-model as regards the rigid
portions, and the settings of any flexible torsion angles will not matter as DASH will recognise
these and automatically set these as variable parameters in the structure solution search.
• However, when ring systems are involved, or unusual combinations of elements in functional
groups, the user is strongly advised to check for similar molecules in the Cambridge Structural
Database (CSD), using the ConQuest search program. For example, this may reveal that a
particular ring conformation is favoured in the experimental structures, and so one can adjust the
3D-molecular model accordingly.
• It is worthwhile checking the bond lengths and bond angles for any unusual groups for
significant deviation from the CSD average. It is probably wiser in such cases to construct the
first trial model by taking accurate CSD values than to trust results from force-field energy
minimisation. Indeed, for metal complexes the CSD examples are almost essential for good
model building.
• Torsion angle distributions may be easily obtained from the CSD using the ConQuest program,
and searching on the appropriate fragments, or by using the direct link to Mogul, a molecular
geometry database, from DASH (Mogul forms part of the CSD System which is available from
the CCDC). The user may decide to reduce the flexibility of the model in DASH during the
solution search by placing limits in the torsion angle ranges, or even fixing at certain values as in
cases of intramolecular H-bonding.
• In cases of ions such as chloride, there is much information in the CSD knowledge base, IsoStar,
of intermolecular group…group interactions. This can be used in certain cases to predict the
likely distance of an ion from a group in the main molecule, and can greatly improve the chances
of solution.
• H-bonding motifs may be important in certain structures with more than one molecule per
asymmetric unit. It may be possible to find examples in CSD which would allow one with
confidence to fix the relation ship of the second molecule to the first by H-bonding, e.g.
carboxylic acid centrosymmetric dimers, or chains with expected geometry.
In summary, use the CSD to check:
94
DASH User Guide
•
•
•
•
•
•
9.4
Bond lengths
Bond angles
Torsion angles ranges
Ring conformations
Small ions
H-bond motifs (intra- and intermolecular)
Converting Molecules to Z-Matrix Format
• Molecules built in third-party programs can be read by DASH and converted automatically into
Z-matrix files (see Section 9.4.1, page 95).
• By default, the DASH will assign every single, acyclic bond as being rotatable (meaning that it
will be varied during simulated annealing). This can be over-ridden, either by editing the Zmatrix file, or in DASH at the time of setting variable parameters for SA structure solution (see
Section 10.3.6, page 109).
9.4.1
Using the Interface to Create Z-Matrix files
• Select Structure Solution either from the Mode menu, or by clicking the icon.
• Select a .sdi file from the Molecular Z-Matrices window that appears by clicking on the
Browse... button.
• The allowed input formats for molecular model files are .res, .cssr, .pdb, .mol2, or
DASH User Guide
95
.mol.
•
•
•
•
9.5
Click on the
icon.
Select from displayed files (in working directory).
Click Open.
This has created a file with extension .zmatrix which can then be used by DASH (see
Section 9.5, page 96).
Reading Molecules into DASH and Defining Rotatable Bonds
• DASH reads molecules as Z-matrices. These can be created externally, or created internally by
DASH when it reads a .mol or .mol2 file (see Section 9.4, page 95).
• The number of copies of a Z-matrix can be entered in the column labelled Number.
• DASH automatically recognises all flexible torsion angles in the molecule for non-hydrogen
atoms.
• By default, the torsion angles around single, acyclic bonds will be varied through the full range
of –180 to +180o during simulated annealing.
• However, it is desirable to limit the number of variable parameters and their allowable ranges,
since this will reduce the search space and increase the chances of structure solution. This is
frequently possible with torsion angles. For example, a search of the Cambridge Structural
Database shows that acyclic esters are invariably within 10o of the trans-conformation. Thus, the
O=C-O-C torsion angle can be constrained to a range of, say, 10 to +10o, or even fixed at 0o.
• Do not vary torsion angles that only affect the positions of H atoms, e.g. the torsion angles of
OH, NH2 and CH3 groups. The data will not be sensitive to changes in these angles.
• Many other torsion constraints can be inferred from the Cambridge Structural Database.
• The best choice of constraints may depend on the quality of the data. For example, it is usually
sensible to allow amides some flexibility by setting a range of –10 to +10o for the central torsion
angle C-N-C=O. However, if the data is poor, it is probably better to fix the torsion at exactly
zero.
• It is sometimes useful to make repeated attempts at structure solution with torsion angles
constrained to various likely ranges.
9.6
Treatment of Rings
Rings can be handled in two ways in DASH:
• You can input a likely ring conformation, obtained by looking at examples in the Cambridge
Structural Database or by minimising in a modelling package, and keep the ring geometry fixed
96
DASH User Guide
during simulated annealing. If the structure fails to solve, you can then try an alternative ring
conformation.
• You may have to postulate the positions of ring substituents too. For example, in the molecule
below, 1,4-dichloro-1,4-dinitroso-cyclohexane, it is not only necessary to set the ring
conformation (presumably chair) but also to decide whether the substituents are axial or
equatorial:
• Alternatively, you can break one of the ring bonds and treat the resulting chain as a sequence of
rotatable, acyclic torsion angles. This technique might be necessary if the ring is unusual and
you have no idea about its probable conformation. However, it increases the number of variables
significantly and also means that you are not taking advantage of the constraints imposed by ring
closure. Thus, effectively, you are making the search space much larger.
9.7
Treatment of Stereoisomers
• If a molecule has several possible stereoisomers, you may need to try simulated annealing with
each in turn. e.g. cimetidine shown here, there are possible cis or trans positions of the CN
group:
• Sometimes, of course, you may be able to infer the probable stereochemistry from the chemical
DASH User Guide
97
synthesis or from spectroscopic evidence.
• You will not be able to determine absolute configuration from powder data.
9.8
Molecule Translation and Rotation; Special Positions
• Molecules will normally be allowed to translate and rotate freely in the unit cell, subject, of
course, to the constraints of space group symmetry. This normally adds six degrees of freedom
for each chemically discrete entity in the asymmetric unit, so solving structures with Z’>1 is
much harder than solving structures with Z’=1.
• Rotation is expressed as quaternion numbers Q0 – Q3. Rotations can be restricted to a single
axis (see Section 10.3.4, page 107). There are four of these, but they are not mutually
independent and actually contribute only three degrees of freedom to the problem, (see
Appendix H: References, page 189).
• Fixed positions are sometimes required for molecules that occupy a special position in a space
group. A common example is when a centrosymmetric molecule has its centre at the origin in a
centrosymmetric spacegroup. This has to be handled by introducing a dummy atom into the Zmatrix. For example, a molecule can be constrained to sit on a centre of symmetry by including
a dummy atom (of any element type but with a very low site occupation factor, e.g. 0.00001).
This atom is positioned on the inversion centre (0.0, 0.0, 0.0) and anchored there by clicking the
fixed box in the translation parameter list. A bond must be input from this dummy atom to any
atom in the molecule, to allow the concept of the Z-matrix to be maintained. Rotations will still
be allowed for this molecule, using this atom as the molecular origin reference point.
• The easiest way to create the Z-matrix is to build a model with a model-building program, place
a dummy atom at the centroid, and draw a bond to the nearest normal atom. The input this model
file (mol2 or pdb format) in the normal way to the DASH Z-matrix conversion program. Then
examine the Z-matrix file and edit the file to set this dummy atom to be the origin reference atom
for the molecule (see Appendix G: Z-matrix format, page 185).
• There are cases where one might want to specify a certain fixed distance to be maintained
between a small molecule or ion; see the example in Section 9.9, page 98.
9.9
Structures with >1 Molecule per Asymmetric Unit
If the structure contains more than one chemically-bonded unit (molecule or ion) in the asymmetric
unit, each must be built separately and input to DASH. However, although you can vary the positions
of more than one molecule or ion in the simulated annealing process, this has the disadvantage of
significantly increasing the number of variables and so increases the complexity of the problem.
Ways of avoiding this include:
• Ignore one of the molecules: if you have two molecules, one of which is relatively small and so
responsible for less than (say) 10% of the scattering, (i.e. only 10% or less of the sum of all the
electrons in the asymmetric unit are in the smaller molecule), then DASH may be able to find a
98
DASH User Guide
reasonable solution for just the larger residue. Typical examples would include leaving out water
of crystallization, or an ethanol molecule in presence of a large molecule like a steroid.
• If this succeeds (i.e. produces a solution with a profile χ 2 slightly higher than that expected from
a complete solution with all atoms present), the resulting model can be converted into a new Zmatrix. DASH can then be instructed to use the first atom in the molecule as an anchor point, all
the torsion angles being constrained to the values found in the simulated annealing run. A
second structure solution can then be attempted, optimising only the rotational orientation of the
main molecule and both the position and the position and orientation of the small molecule. If
certain H-bonds can be assumed to be present it may be possible in fact to tether a water
molecule to be at a certain distance from a donor or acceptor atom on the main molecule.
• Sometimes it is possible to guess the location of a small ion relative to a larger one. For example,
in the following ion pair, it is highly likely that the chloride will be hydrogen bonded to the N-H
group. Examination of the CSD database presented in IsoStar for an NH central group
approached by a Cl- ion shows an average distance of 3.1 Å.
• The method of constraining such an ion in the DASH SA procedure is best explained by this
example. Using a model building program, construct a Cl atom at the required position relative
to the N atom, draw a dummy-bond to the N atom, and output as a .mol2 or .pdb file. On
reading into the DASH Z-matrix conversion program this produces a single Z-matrix file, where
the Cl atom is now tethered to the N atom. The actual distance from N to Cl can of course be
modified by directly editing the Z-matrix file, as can a dummy-bond angle. In this case the
torsion angle involving Cl is not meaningful and can be set as fixed in the parameter list.
DASH User Guide
99
100
DASH User Guide
10 STRUCTURE SOLUTION
10.1 Overview of Structure Solution
DASH solves structures by altering the positions, orientations and (where appropriate) conformations
of the molecules in the unit cell, subject to the constraints of space group symmetry, until a good
match is obtained between calculated and observed intensities. This process is a search for a global
minimum in a multi-dimensional parameter space, the parameters being positions, rotations
(expressed as quaternions) and torsion angles. This search is performed using a simulated annealing
algorithm. This section covers:
•
•
•
•
•
•
•
•
The basics of simulated annealing (see Section 10.2, page 101).
Using the interface for structure solution (see Section 10.3, page 102).
Simulated annealing parameters (see Section 10.5, page 117).
Monitoring the progress of structure solution (see Section 10.8, page 124).
Assessing the final answer (see Section 10.9, page 127).
Troubleshooting (see Section 10.10, page 130).
Final Rietveld refinement (see Section 10.11, page 130).
Limitations of DASH (see Section 10.12, page 131).
10.2 Fundamentals of Simulated Annealing
• The algorithm starts by assigning random values to the parameters (molecular position,
orientation and conformation).
• Agreement between calculated and observed (Pawley) intensities is assessed by computing a χ 2
goodness-of-fit statistic.
• One of the parameters is randomly altered and the χ 2 value recalculated.
• The algorithm accepts the new parameter value if the χ 2 value has gone down (i.e. the fit has
been improved). If the χ 2 value has gone up, then the new value is either rejected or accepted,
subject to a Boltzmann distribution. The probability of accepting such an uphill move depends
on the current temperature of the system; the higher the temperature, the more likely it is that an
uphill move will be accepted.
• This procedure is repeated many times, each parameter being altered in turn.
• At the end of a predetermined set of moves, the temperature is lowered, thus decreasing the
chances of acceptance of uphill moves; the above process is then repeated.
• The algorithm terminates when the system converges to a minimum (hopefully, global) in χ 2
space, or when a maximum number of moves is reached.
DASH User Guide
101
In essence, the algorithm tries to move downhill in χ 2 space, but occasionally allows uphill moves in
order to let the system escape from local minima.
10.3 Using the Interface for Structure Solution
In order to use the interface for structure solution you can either:
• Call the Wizard by clicking on the following icon:
• Either select Simulated Annealing Structure Solution
• Or select Structure Solution from the top-level Mode menu
• Or click on the following icon:
This will bring up the DASH Wizard : Molecular Z-Matrices window, shown below, which you can
use to:
•
•
•
•
•
•
•
102
Input Z-matrices (see Section 10.3.1, page 103).
Edit Z-matrices (see Section 10.3.3, page 106).
Edit Z-matrix rotations (see Section 10.3.4, page 107).
Look at preferred orientation (see Section 10.3.5, page 109).
Check and set parameter ranges (see Section 10.3.6, page 109).
Access Mogul, if available, via the Parameter Bounds window (see Section 10.4.2, page 113).
Start the simulated annealing run (see Section 10.3.7, page 110).
DASH User Guide
• Select the Pawley-Fit file, with extension .sdi, saved after the Pawley refinement. Either type
in the file name, or browse for files with extension .sdi.
• The main window now displays the diffraction data with tick marks.
• Proceed to input Z-matrix files for the molecule(s) (see Section 10.3.1, page 103).
10.3.1 Input of the Z-Matrices
• Click on the
•
•
•
•
•
icon. This will display all files available with the extension .zmatrix,
.mol2, .mol, .ml2, .pdb, .cssr, .cif or .res.
Select the file and click Open.
When a Z-matrix file is successfully read in the number of parameters set up is displayed to the
right of the open-folder button. The first molecule should show that at least 6 parameters are
created. Each rotatable torsion angle adds 1 to the total parameters.
If there is more than one molecule in the asymmetric unit, repeat the loading process for the next
Z-matrix file.
Select View to view a Z-matrix. Flexible torsion angles can be colour coded by ticking the
Colour flexible torsions check box under Options | Configuration...
Select Edit... to edit a Z-matrix (see Section 10.3.3, page 106).
• Click on the
icon to clear a Z-matrix you have loaded but do not want to use.
• Then click Next > (see Section 10.3.6, page 109).
DASH User Guide
103
10.3.2 Atom tethering
• DASH features the ability to apply tethers between unassociated atoms in the solution process.
The main function for atom tethering is to allow a user to break a ring in a molecule to make it
flexible. A tether can then be used to make the code force ring closure while allowing the rings
internal torsion angles to vary.
• The intensity χ 2 is biased by the tether: Two atoms A and B are separated by a distance of dAB. If
the ideal distance of separation is dideal and there is a permitted tolerance of t, then the modified
χ 2 is given by
χ 2 = χ 2 + qW( MAX(0.0,[ |dideal -dAB| - t] ) )2
• Where W is a user supplied weight, and q is an annealing factor: the annealing factor scales
linearly from 0 to 1 as the simulated annealing progresses.
• It is also possible to tether atoms in different z-matrices to one another, to allow the user to input
information regarding the presence of a given interaction.
• Atom tethering of independent z-matrices will rarely improve the success rate of the solution
search for good quality data, and in certain cases may even degredate performance due to the
addition of barriers into the monte carlo search process, but may be useful with poorer patterns
where there is higher uncertainty in the reflection intensities.
• To use, click the Set Fragment Restraints in the Parameter Bounds window.
• This will launch a dialog: The user can select atoms from each fragment and a separation
distance between them for 1 or more pairs of atoms, either within a single fragment or between
104
DASH User Guide
fragments. The user here also specifies the ideal distance between the pair of fragment atoms. A
default weight is specified as 100.0.
DASH User Guide
105
10.3.3 Editing a Z-Matrix
This window allows various atomic properties to be modified:
• The list of atoms displayed allows you to delete individual atoms from the Z-matrix and allows
you to change the label, element, Biso and occupancy of each individual atom.
• Biso’s and occupancies can be changed for groups of atoms using the Set button.
• Re-order re-orders the atoms carbon atoms first, followed by the remaining elements in
alphabetical order, and hydrogen atoms last.
• Re-label re-labels the atoms as element + sequential number, e.g. C7 and Br24.
• Rotations... displays the Edit rotations / Z-matrix dialogue box (see Section 10.3.4, page 107).
• Save As... allows saving of the edited Z-matrix with a new name.
• View displays the edited Z-matrix.
106
DASH User Guide
• Save saves the edited Z-matrix.
• OK returns you to the DASH Wizard : Molecular Z-Matrices window, keeping all changes. If
atoms have been deleted, DASH will try to assemble a new Z-matrix from the remaining atoms.
• Cancel returns you to the DASH Wizard : Molecular Z-Matrices window, discarding all changes.
10.3.4 Editing Z-Matrix Rotations
This window allows full control over the way orientations of a Z-matrix are handled during simulated
annealing. It is recommended that the .sdi file has been loaded first, so that the unit-cell parameters
are available for visualisation of the centre of rotation and the initial orientation.:
• The origin of rotation can be specified in the same manner as in the .zmatrix file (see Section
9.8, page 98) and can be checked visually by pressing View and switching on the display of the
cell-axes in your viewer. When using Mercury, select Show cell axes (lower right) rather than
Packing (lower left).
• The rotations of molecules that lie on a rotation axis or in a mirror plane can be restricted to that
DASH User Guide
107
rotation axis or to the axis perpendicular to the mirror plane. When restricting rotations to a
single axis, the initial orientation of the molecule with respect to the unit cell needs to be
specified. This can be done by entering the Euler angles or quaternions.
• If the axis of rotation is specified either as the line through two atoms or as the normal to the
plane defined by three atoms (i.e. if the axis of rotation can be specified from the molecule
alone) it is also possible to choose the initial orientation such that the axis of rotation is aligned
with an axis specified in fractional coordinates. The initial orientation can be checked by
pressing View and switching on the display of the cell-axes in your viewer. When using Mercury,
select Show cell axes (lower right) rather than Packing (lower left).
The single axis of rotation is specified by the origin of rotation of the molecule and one other vector,
which can be any of the following:
• The vector between two atoms. Just enter the numbers of the atoms. An easy way of finding out
what the number of an atom is, is to relabel the atoms first using Re-label and then displaying the
atom labels in Mercury.
• Fractional co-ordinates, e.g., 0,0,1 would restrict the rotation of the molecule to be parallel to the
c-axis.
• Normal to a plane defined by three atoms in the molecule. Just enter the numbers of the atoms.
An easy way of finding out what the number of an atom is, is to relabel the atoms first using Relabel in the previous screen and then displaying the atom labels in Mercury.
• OK returns you to the Edit Atomic Properties / Z-Matrix window, keeping the changes that have
been made. Note that clicking Cancel in the Edit Atomic Properties / Z-Matrix window will also
cancel changes made in the Edit rotations / Z-Matrix window.
• Cancel returns you to the Edit Atomic Properties / Z-Matrix window, discarding the changes that
have been made.
• View displays the Z-matrix. The unit-cell axes are included, allowing you to check the origin and
initial orientation of the molecule. To display the unit-cell axes when using Mercury, select Show
cell axes (lower right) rather than Packing (lower left).
108
DASH User Guide
10.3.5 Preferred Orientation
The March-Dollase preferred orientation correction can be used. The direction of the preferred
orientation must be entered in this window, the magnitude is optimised during the simulated
annealing. All preferred orientation parameters are written out to all molecular output files.
10.3.6 Checking and Setting Parameter Ranges
You arrive at the DASH Wizard : Parameter Bounds window after loading the Z-matrix files as in (see
Section 10.3.1, page 103).
DASH User Guide
109
• The purpose of the menu is to allow you to control which parameters are variable or fixed. Each
parameter has a starting value, a lower limit and an upper limit. The box F is ticked for fixed or
unticked for variable parameter control respectively.
• If the Randomise initial values check box is selected, the starting values for the parameters that
are varied during the simulated annealing step will be set to random values before starting the
simulated annealing. When Randomise initial values is not selected, the values shown in this
dialogue window will be used, allowing a previous run to be restarted where it left off. (If the
first simulated annealing cycle is a dummy cycle to determine the initial temperature, the values
will be reset at the start of the second cycle.).
• Set any of the molecular translation parameters x(Frag1), y(Frag1), z(Frag1) as fixed by clicking
F-box if required by the space group e.g. in P21 we can fix the y-translation for the first
molecule given.
• Generally it is not necessary to fix any of the molecular rotation parameters Q0, Q1, Q2, Q3.
• Torsion angles are not normally fixed, and will have a range of 360o. However upper and lower
bounds can be entered here to define a single torsion angle range to be searched (see Section
10.4, page 111).
10.3.7 Starting the Simulated Annealing Run
You will reach the DASH Wizard : Simulated Annealing Protocol window from the parameter range
menu (see Section 10.3.6, page 109).
110
DASH User Guide
This allows the user to set the variables that control the simulated annealing run.
• Default values are provided which are usually satisfactory. To accept these values simply click
the Next > button. The meaning of these parameters is discussed in Section 10.5, page 117.
• Maximum number of SA runs: the default setting is 10 runs. It is generally advisable to try
several SA runs using different random number seeds; this is done for you automatically if you
specify the number here. The best solution from each run is stored in suitably numbered files
(see Section 10.9.4, page 129).
• Maximum number of moves per run: the default setting is 10,000,000. When this number of
moves is reached, the run is terminated, whatever the value of χ 2 (see Section 10.5.4, page 118).
• Profile chi-squared multiplier: the default setting is 5.0. This means that if the SA profile χ 2 falls
below a value 5.0 times that of the Pawley-fit χ 2, and the minimum number of moves has been
exceeded, the run is terminated. (see Section 10.5.4, page 118).
• The Print... button will pop up a text editor window containing a summary of the current
simulated annealing parameters. This text file can be edited, saved and printed.
10.4 Setting torsion angle ranges
10.4.1 Manually entering torsion angle ranges
• Torsion angles are not normally fixed, and will have a range of 360o. However upper and lower
DASH User Guide
111
bounds can be entered here to define a single torsion angle range to be searched such as -10 to
10o. If DASH has access to Mogul, appropriate torsion angle ranges can be explored by hitting
the Modal button (see Section 10.4.2, page 113). Mogul is a molecular geometry database which
forms part of the CSD System and is available separately from the CCDC. If Mogul is not
accessible, modal torsion angle ranges can be defined in the Modal Torsion Angle Ranges
dialogue that will appear on hitting the Modal button.
• The Modal Torsion Angle Ranges dialogue box allows bimodal and trimodal torsion angle
ranges to be defined. The radio buttons at the top of the dialogue box are used to choose
whether bimodal or trimodal torsion angle ranges are required.
• In the boxes labelled Upper and Lower enter the upper and lower bounds of a single torsion
angle range, thus if a bimodal search of the torsion angle space of 30 - 90o and -30 to -90o is
required, enter 30.0 in the Lower box and 90.0 in the Upper box. The complementary range is
automatically determined and displayed. Torsion angles within both of the displayed ranges
will be generated during the simulated annealing run. Planar torsion angle ranges (centred
around 0o and 180o) can be searched by defining a bimodal range such as -20o to 20o. The
complementary range determined and displayed will be -160o to 160o. If a trimodal range is
chosen then torsion angles will be sampled from the defined space and two further ranges at
+/- 120o.
• To accept the defined torsion angle ranges, press OK. This will return you to the main
Parameter Bounds dialogue box, and the torsion angle to which modal ranges have been
applied will be highlighted in red.
• Hitting Cancel will result in all edits, since the last accepted modal range, being ignored.
• Hitting Non Modal will return you to the Parameter Bounds dialogue box and the full 360o
torsion angle range will be applied. A non-modal torsion angle range is shown in black.
112
DASH User Guide
• Torsion angles may be fixed at a value. Click the F-box, and then type in the required value in
the initial box e.g. 0.0
• When all parameter ranges are set click Next > (see Section 10.3.7, page 110).
10.4.2 Using DASH with Mogul
• If DASH has access to Mogul, appropriate torsion angle ranges can be explored using this
program. Mogul is a molecular geometry database which forms part of the CSD System and is
available separately from the CCDC. If Mogul has been installed in the default location, DASH
should automatically find the path to the executable and this path will be displayed in the
Configuration window (see Section 2.8, page 19). However, if DASH does not find the path to
the Mogul executable it is possible to enter a path to Mogul in the Configuration window.
• Once a path to Mogul is present in the Configuration window, hitting the Modal button will
launch Mogul and a histogram of the distribution of angles obtained from structures within the
CSD for the chosen torsion angle will be displayed. It should be noted that the Mogul histogram
displays all torsion angles, positive and negative on a positive axes, i.e. 0-180. The structures
that contribute data to the histogram can be examined by clicking on the View Structures tab in
the Mogul window.
DASH User Guide
113
• Upon closing the Mogul window the Modal Torsion Angle Ranges dialogue will be displayed
and, if the torsion angle had a distribution that DASH recognised, a recommended range of
torsion angle values will be shown in the Upper and Lower sample range boxes. It is
recommended that the user check that the suggested ranges are appropriate before accepting
them. The lower and upper bounds on the ranges can be edited if different ranges are thought to
be more suitable.
• To accept the defined torsion angle ranges, press OK. This will return you to the main Parameter
Bounds dialogue box, and the torsion angle to which the modal ranges have been applied will be
highlighted in red.
• Hitting Cancel will result in all edits, since the last accepted modal range, being ignored.
• Hitting the Non Modal button will return you to the Parameter Bounds dialogue box and the full
360 torsion angle range will be applied. A non-modal torsion angle range is shown in black.
114
DASH User Guide
10.4.3 Mogul Data Biasing
• Mogul data biasing (MDB) is an alternative way of using MOGUL to improve retrieval of
correct answers in searching. MDB uses Mogul distributions to bias the sampling in searching to
tend to favour regions of space where Mogul indicates there is a high likelihood.
• The underlying code works by modifying the Maxwellian distribution used for each step. In
simulated annealing, each trial move is calculated by first taking a number at random from a
maxwellian distribution: The maxwellian tends to favour particular moves dependent on the
current annealing temperature. In MDB, the maxwellian distribution is modified to favour
moves to torsion angles into regions of space that are heavily populated in the corresponding
mogul distribution.
• This is summarised below. The maxwellian is binned and multiplied by the respective bin in the
mogul (The mogul distributions are first modified so that no bin contains zero hits; this ensures
that no parameter space is completely excluded from the maxwellian)
• MDB can have benefit, but on occasion can detract from the solution process. By using MDB,
the user is assuming that the torsion angles in the correct solution lie within the most commonly
observed ranges of torsion angles. In some structures, this clearly will not be the case; in such
situations MDB will tend to bias the search algorithm away from the correct answer. Tactically,
it is best to use MDB in initial runs. If, however, the structure fails to solve, still consider reDASH User Guide
115
running the solution SA without MDB as a fall back, in case your structure contains an unusual
torsion angle.
• The drawbacks are mercifully rare: MDB has a beneficial effect in > 90% of the test cases that
we use it for, either in speeding up the search by reaching the global minimum more quickly. In
some large structures we find that MDB makes the solution process succeed in more runs than
without MDB.
• MDB can be enabled by clicking the Set MDB button in the Parameter Bounds wizard window.
The choice of distributions to use can be controlled by increasing or decreasing the minimum
hits; the higher the number of hits, the more populated a mogul distribution has to be to be used
in MDB. The default of 10 observations may seem a little low: Note, however, that due to the
nature of the algorithm used, using distributions with low numbers of observations in fact makes
little difference to the solution process, as the weight of bias to the maxwellian distribution is in
proportion to the number of hits in the distribution. A distribution with only 10 observations in
will not really change the sampling for a given torsion by a great amount.
• DASH also supports reading SA input settings directly from 'DBF' files. This, in principle, could
allow the user to set up searches with data distributions from other sources. A given torsion
angle can be biased by specifying a parameter & range for the given torsion in the input DBF file
in the following form:
-65.95955 MDB -180.00000 180.00000 18 0 0 0 0 2 7 10 5 0 0 0 0 0 0 0 0 2 14
Here, the parameter's start value is first, followed by the control keyword 'MDB'. Subsequently
we have the maximum & minimum value range for the parameter followed by the number of
bins in the associated histogram. Finally we have the histogram itself. Clearly the histogram
116
DASH User Guide
could easily be altered to reflect, say, the range of torsion angles observed in a conformational
analysis for the associated molecule.
10.5 Simulated Annealing Parameters
10.5.1 Starting Temperature
• If the search space is complex (i.e. contains many local minima), the starting temperature must
be high so that the algorithm will make many uphill moves in the early stages. This will ensure
that the search space is explored thoroughly.
• Setting T0 to zero in the interface instructs DASH to select the starting temperature
automatically. This is recommended, at least in the first simulated annealing run, until you get a
feel for the problem.
• DASH selects the starting temperature by performing a brief simulated annealing run at high
temperature and monitoring the variance of the χ 2 value as random moves are made in parameter
space. Based on the results, the starting temperature is set to a value that will allow the algorithm
to escape deep local minima at the outset of the search (i.e. the higher the variance in χ 2, the
higher the starting temperature).
• The optimum starting temperature is very data dependent; it could be 25 K in a good case (a
simple response surface with few local minima), but much higher (>1000 K) for a complex
problem.
10.5.2 Cooling Rate
• DASH typically uses a fixed, conservative cooling rate of 0.02 K (i.e. the rate at which the
temperature is reduced) for the annealing process. The temperature reduction is applied at the
end of each cycle of annealing.
• The cooling rate is not constant as the annealing proceeds. If DASH detects large fluctuations in
χ 2 (implying that the algorithm is in an interesting region of parameter space) it automatically
reduces the cooling rate to ensure a thorough search.
• The slower the cooling rate, the more thorough the search of parameter space and the greater the
chances of finding the global minimum. However, a slow cool obviously takes longer.
10.5.3 Number of Moves
The values of N1 and N2 determine the number of moves (random parameter changes) that are made
at each temperature. Specifically, if there are N variable parameters (positional, rotational,
conformational), the simulated annealing performs N1*N2*N moves at each temperature. Default
values are N1 = 20 and N2 = 25; these will only need to be increased in difficult cases.
DASH User Guide
117
10.5.4 Convergence Criteria
How does DASH know when it has a correct answer, and thus when to stop the annealing process?
The χ 2 obtained from the Pawley fit represents very much the best fit that can be obtained from the
data (all intensities are treated as being variables in the least-squares process) and so if DASH comes
close to achieving this profile χ 2 in the annealing process, there is a good chance that the answer is
correct.
There are a number of reasons as to why you will not obtain as good a fit in the structure solution
process as you did with the Pawley fit:
• Your input model is based on a number of chemical assumptions, some of which may not be
entirely accurate.
• the assumption is that all non-H atoms have fixed temperature factors.
• There may be some preferred orientation in the sample.
Accordingly, DASH realises that if the profile χ 2 comes within a preset multiple (default value = 5.0)
of the Pawley χ 2, then there is a good probability that this structure is worth examining. For example,
with the default multiplier setting, if you achieved a Pawley χ 2 of 3.7, then the SA process would
terminate when the SA profile χ 2 fell below a value of 18.5. The multiplier setting is user controllable
via a field on the SA control panel.
There is always a chance that the SA process may become trapped in a local minimum with a profile
χ 2 value above the pre-set cut-off. In such circumstances, the SA could in principle, run forever. For
that reason, there is a pre-set maximum of 10,000,000 SA moves in DASH. The majority of structures
will solve well before this number of moves is reached! You can reduce the maximum number of
moves if required, but note that there is a pre-set minimum of 1000 moves.
10.5.5 Random Number Seeds
• Simulated annealing is a random process that depends on computer-generated random numbers.
Random-number generators use a set of seeds which determine the sequence of random numbers
used within the program. Changing the seeds will change the sequence and thus alter the route
taken by the algorithm through χ 2 space.
• Different seeds used for otherwise identical runs will generate different paths. Conversely,
keeping the same set of seeds between otherwise identical runs will result in identical paths. This
can be useful in demonstrating situations, as a set of random seeds that produces an answer
quickly can be noted and used again.
• Note that when you ask for multiple runs, DASH automatically calculates a new set of random
seeds for each run.
118
DASH User Guide
10.6 Simulated Annealing Options
• Hydrogens: The Absorb option (default) takes account of the electron density of hydrogen atoms
by increasing the occupancy value of their riding atom by the appropriate amount. Alternatively,
since the scattering power of hydrogen atoms is low, contributions from hydrogens can be
ignored. If you wish to take account of the hydrogen positions directly, then the Explicit option
can be used.
• Auto Local Minimise: when selected, the χ 2 of each final solution is minimised using a simplex
algorithm before the solution is written out. If Use Hydrogens is selected, hydrogens are included
in the local minimisations of the final solutions.
• Auto Align: when selected the molecules of the final solution are aligned before the solution is
written out.
• Use crystallographic centre of mass: when selected each atom is assigned a weight of Z-2 when
the molecular centre of rotation is calculated, where Z is its number of electrons. Otherwise, no
weights are applied.
• Create batch file: Click this button to write files that can be submitted to a grid, or to write files
that can be used to run DASH in batch mode.(see Section 11.2, page 133)
Options for saving files are as follows:
• Write out .dash file at end: enables you to save all solutions plus the diffraction pattern and the
Pawley fit in one binary file with the extension .dash. This file is written once the simulated
DASH User Guide
119
annealing run is complete. The .dash files can be reopened within DASH to view solutions
obtained from previous runs of DASH.(see Section 10.9.4, page 129)
• You may also choose to write out a file at the end of each simulated annealing run that contains
the coordinates of the best solution obtained, i.e. the solution with the lowest χ 2 value. This file
will be given a default name using the Pawley-fit File name selected, e.g. sucrose55.sdi will
produce a file sucrose55.pdb for example. The structure files also contain the intensity and
profile χ 2 values of the solution. Options for file formats are:
• .pdb: Additional information contained in this file includes the DASH simulated annealing
parameters as well as the translations, Q-rotations and torsion angles.
• .cssr: a file is written in .cssr format.
• .ccl: a file is written in .ccl format
• .cif: a file is written in .cif format
• .res: a file is written our in .res format
• pro: when selected a file with the extension. .pro is written out which contains 2θ, the
observed profile, the calculated profile for the best solution and the original esds. The file is
written out in ASCII format and can be imported into a spreadsheet package such as Excel
• Output Chi-squared vs. moves at end: when selected a graph of the profile χ 2 versus moves is
written out to a file in ASCII format with the extension .chi, at the end of the simulated
annealing, This can be imported into a spreadsheet package such as Excel.
• Output parameters at end: when selected a.tbl file is written at the end of the simulated
annealing run: this file contains the translations, the Q-rotations and the torsion angles of all
solutions. This can be exported into a spreadsheet package such as Excel.
• If you wish to keep the results for several runs started with different values of the parameterranges (see Section 10.3.6, page 109), or simulated annealing protocol (see Section 10.3.7, page
110), you are given the option to input a new name for each run. This occurs in a popup menu
immediately on the first display of the Simulated Annealing Status window (see Section 10.7,
page 121).
120
DASH User Guide
• For example you might want to do separate runs keeping torsion angles 3 or 4 fixed, and give
file names like this: sucrose.tor3fixed, sucrose.tor4fixed, etc., which will output best solution
files: sucrose.tor3fixed.pdb, sucrose.tor4fixed.pdb, etc.
10.7 Status Display of Simulated Annealing Run
You will reach this menu after clicking Solve >in the Simulated Annealing Protocol window (see
Section 10.3.7, page 110). It enables you to monitor the progress of the Simulated Annealing Run.
DASH User Guide
121
Status information:
• Simulated annealing run number: in the above example current run 3 of a set of 10.
• Temperature: the current SA temperature value.
• Minimum chi2: the minimum χ 2 for the integrated intensities i.e. the quantity that is being
minimised by the SA.
• Average chi2: the average value of the minimum χ 2 for the integrated intensities.
• Profile chi2: the χ 2 for the diffraction profile, and it is directly comparable with the χ 2 for the
Pawley fit.
• Total moves: the total number of moves in the SA run so far.
• Moves/iteration: the total number of moves performed (NS times NT times number of
parameters) before a temperature reduction is applied.
• Downhill/Uphill/Reject: the number of downhill/uphill/rejected moves in last iteration of 4000
moves.
Buttons:
• Pausing the Simulated Annealing Run
The Pause button simply pauses the DASH program to free up processor time for some other
purpose. Click OK to continue with DASH.
• Starting the next Simulated Annealing Run
When in a multi-run, the Start next button terminates the current run and starts the next.
• Stopping the Simulated Annealing Run
The Stop button stops the simulated annealing run immediately and advances to the DASH
Wizard : Analyse Solutions window (see Section 10.9.4, page 129).
• Editing the Simulated Annealing Parameters
The Edit button stops the simulated annealing run immediately and returns you to the DASH
Wizard : Parameter Bounds window (see Section 10.3.6, page 109)
• Simplex Optimisation of the Best Solution
• This Local minimisation button pauses the run, and takes the parameter values for the best
122
DASH User Guide
solution to date as a starting point for as Simplex minimisation (see Appendix H: References,
page 189). A pop-up window appears giving the improved value of the χ 2 for the integrated
intensities, which can be compared with the minimum χ 2 in the Simulated Annealing Status
window. You can then continue from this improved position by clicking Yes, or ignore this by
clicking No.
• Since the DASH implementation of simulated annealing varies one parameter at a time in the
random path, this local minimisation point can have a dramatic effect in speeding up the final
stage of the process of finding the lowest χ 2 point. However it will have no useful effect until
the search has reached a point reasonably near to the global minimum. Therefore, it is
generally used once a good fit to the data has been achieved, in order to quickly take the
structure to the best minimum in the vicinity of the current structure.
• Viewing the 3D Structure of the Best Solution
• As the simulated annealing run proceeds DASH keeps a record of the best solution found to
date. The View button opens up the default 3D-Visualiser immediately for the current version
of this best solution.
• The CCDC visualiser program Mercury is supplied with DASH, an example image is shown
here of the best solution found for cimetidine (see Tutorial example 4). It is easy to display
hydrogen bonds for quick checking and here it can be seen that all expected donors and
acceptors are satisfied. By clicking on the ends of H-bonds one can see the connected
molecules and assess the H-bond networks pattern. It is important here also to check quickly
for any impossibly close contacts between atoms.
• The 3D visualiser is not automatically kept up-to-date with the best solution. In order to look
at the latest solution, you must click View again.
DASH User Guide
123
• The choice of visualiser is controlled via Configuration... which can be selected from the
Options menu bar.
10.8 Monitoring the Progress of Structure Solution
As a simulated annealing run proceeds, DASH displays a number of diagnostic statistics, the most
important of which are:
• Various χ 2 statistics (see Section 10.8.1, page 124).
• The current temperature, the total number of moves made so far, the number of downhill moves,
and the number of uphill moves that are accepted or rejected (see Section 10.8.2, page 125)
• Whether or not to stop a Simulated Annealing run (see Section 10.8.3, page 125).
• Monitoring the progress of structure solution (see Section 10.8.4, page 126).
10.8.1 Interpreting χ 2 Statistics
DASH displays the minimum and average values of the correlated integrated-intensities χ 2 and the
best value of the profile χ 2 for the structural model. The Pawley fit χ 2 can be viewed by selecting
Pawley / SA from the View menu.
124
DASH User Guide
• The minimum correlated integrated-intensities χ 2 is the quantity that is actually being
minimised. This is the minimum value obtained so far of the χ 2 statistic that measures the fit
between the reflection intensities calculated from the structural model and the intensities
extracted from the Pawley fit.
• The average χ 2 is the average value of the correlated integrated-intensity χ 2 at the current
temperature.
• The profile χ 2 for the structural model measures the fit between the powder profile calculated
from the best structural model so far and that observed experimentally. This χ 2 value is on the
same scale as the Pawley fit χ 2, which makes it the most useful statistic for assessing how close
the structure solution is to the best fit possible.
• If the profile χ 2 for the structural model is well above the χ 2 obtained from the Pawley fit, the
structure is some distance from the true crystal structure.
• If the profile χ 2 for the structural model is close to the Pawley χ 2 (within a factor of 2-5) the
structure is probably solved.
• Note however, that sometimes the profile χ 2 may be up to 10 times the value of the Pawley χ 2,
and the structure is still basically correct. The exact ratio depends upon many factors, such as
accuracy of the input model and extent of preferred orientation.
10.8.2 Interpreting Current Temperature and Number of Moves
• A great many moves (perhaps several million) may be needed for the structure solution of a
large flexible molecule, and it is not unreasonable to leave DASH running overnight.
• Ideally, you should get about an equal proportion of uphill, downhill and rejected steps early on
in the annealing.
• If the starting temperature was too low, you will find that the number of accepted uphill moves is
small, even though the profile χ 2 for the structural model is still much higher than the Pawley χ 2.
This means that the search is trapped in a local minimum and you should stop the run and restart
at a higher starting temperature.
10.8.3 Deciding Whether to Stop a Simulated Annealing run
The Pawley fit χ 2 can be viewed by selecting Pawley / SA from the View menu.
• Use of the Local minimisation button at any time during structure solution activates a simplex
minimisation from the current best position. This allows you search the area around the current
minimum in order to assess the best attainable χ 2 in the vicinity of the current well (i.e. the
minimum in search space that is currently being explored). You should normally only invoke
this search if the current profile χ 2 is within a factor of 5-6 times the value of the Pawley χ 2 and
DASH User Guide
125
you want to accelerate the final stages of the search. If the simplex search brings the intensity χ 2
down significantly (NB: the simplex warning box currently reports the Intensity χ 2, not the
profile χ 2) then the structure will have been pulled in very close to the final answer, so you can
accept the results of the simplex and stop the annealing. If not, just hit No and allow the
annealing to continue from the position it occupied prior to the simplex.
• DASH can automatically test for early termination. Early termination testing tries to speed up
searching by attempting speculative local minimisation of DASH runs when a given run's profile
χ 2 gets to within a threshold of the fitted pawley χ 2. The user specifies an early termination
criterion in the simulated annealing. If the SA gets within twice of this threshold, then new good
solutions are minimised; if the minimised structure has a profile χ 2 less than the specified
termination criterion the solution is accepted and the SA run is terminated.
• If the χ 2 is a large multiple of the Pawley χ 2 (say, a factor of 10 or higher) and a reasonable
proportion, say 10%, of uphill moves are still being accepted, then the annealing has not
converged and it should therefore be left running.
• If the number of rejected uphill moves is about 50% of the total moves being made, and the
profile χ 2 is still very high, then the search is probably trapped in a local minimum. You should
stop it and start again at a higher starting temperature.
• Note that DASH can spend a long time apparently stuck at one χ 2 value, but remember that it is
continually sampling parameter space, so as long as uphill moves are being accepted at a decent
rate, be patient!
• For very large molecules it may be necessary to leave the program running overnight to achieve
solutions.
10.8.4 Monitoring the Progress of Structure Solution
A graph of Profile χ 2 vs. Number of Moves is plotted as the simulated annealing runs progress. The
end point of the simulated annealing run, the product of the Pawley χ 2 and the multiplier chosen in
the Simulated Annealing Protocol window is shown on the graph as a horizontal line. The graph can
be zoomed in on using the left mouse button and the Home key resets the view to full scale.
126
DASH User Guide
10.9 Assessing the Solution
Important questions to ask are has the data been fitted and, subsequently, does the structure make
sense. You therefore need to examine:
•
•
•
•
•
The profile χ 2 (see Section 10.9.1, page 127).
The visual match between calculated and observed profiles (see Section 10.9.2, page 128).
The crystal packing (see Section 10.9.3, page 128).
The files saved from multiple simulated annealing runs (see Section 10.9.4, page 129).
Reproducibility of solution (see Section 10.9.5, page 130).
10.9.1 Assessing the Final Profile χ 2
• The first thing to look at is the profile χ 2 for the structural model. As a rough guide a good
solution should have a profile χ 2 of around 2-3 times the value of the Pawley χ 2. Accurate
models will give small multiples of the Pawley χ 2, but if your starting model is not particularly
accurate, you may still get the correct answer but with a much higher multiple.
• If the profile χ 2 for the structural model is much more than 10 times the Pawley χ 2, then the
DASH User Guide
127
structure is almost certainly wrong, even though there may be elements of truth in it.
• The χ 2 value can be forced up by a variety of effects:
• Your data may have a systematic problem (e.g. preferred orientation, Kα2 contributions for
laboratory data).
• You may not be modelling all of the scattering in the unit cell (e.g. there might be a solvent, or
perhaps the compound is not exactly what you think it is).
• You may have truncated the data at the wrong point.
• You may have fixed parts of the molecule in the wrong conformation.
• Your estimates of particular bond lengths / angles may be significantly in error.
10.9.2 Visual Comparison of Observed and Calculated Profiles
• Visually compare the observed and calculated profiles. Are there any peaks that are very poorly
fitted? For example a strong peak for which there is little or no calculated intensity? This is a
warning sign, although it could always be due to an impurity, an instrument spike, or preferred
orientation.
• At high angle, there may be a reasonable fit to the data but an overall mismatch of intensities due
to an incorrect overall isotropic temperature factor. Systematic forfeiting of the high angle data
implies that the temperatures factors for the atoms have been set too low, whilst underfitting
implies that the temperature factors, B, are too high. The DASH default values of B = 3.0 for
non-hydrogen atoms and B = 6.0 for hydrogen atoms are normally sufficiently close to allow
structure solution. These defaults can always be altered in the input Z-matrix.
10.9.3 Inspecting the Crystal Packing
An important indicator of whether a solution is correct is the network of interactions that are formed
in the structure:
128
DASH User Guide
• Check that there are no unreasonably close intermolecular contacts in the crystal. An occasional,
marginally short contact (e.g. an H…H distance of just under 2 Å) may be expected, given that
the structure is effectively of low resolution, but anything more extreme indicates that the
solution is at least partially wrong.
• Large void spaces are equally unlikely, unless you suspect the presence of, e.g., solvent which
has been left out of the calculation.
• Check that likely interactions are formed: for example, it is extremely rare for an N-H or O-H
group not to be involved in a hydrogen bond. Remember that, in the majority of cases, hydrogen
atoms will have been placed in assumed positions and will not be subject to adjustment, other
than as a consequence of adjustments made to the main backbone of the molecule. Hence, an OH group that does not appear to H-bond might well do so if the H atom is rotated to a new
position.
• Finally, remember to check the molecular conformation: does it compare well with similar
molecules in the Cambridge Structural Database?
10.9.4 Files saved from multiple runs of SA
If multiple runs of the SA procedure have been requested (see Section 10.6, page 119), the program
will keep a record for each run of the lowest χ 2 found, and the name of the corresponding solution coordinate file. The solution files names are created from the given name of the run with the text suffix
_001, _002, … The solutions are sorted into ascending order of Profile Chi-squared in the display:
• Selecting the View button for a specific solution allows you to view the crystal structure and the
calculated profile. The overlay check boxes allow you to select the solutions for which the
crystal structures are to be shown overlaid in a single unit cell.
DASH User Guide
129
• Any of the simulated annealing solutions can be Rietveld refined by clicking the appropriate
Rietveld button. Usually, this will only be done for the best solution.
• Save... allows you to save the solutions as .pdb, .cssr, .ccl, .cif, .res and .pro.
You can also save the final values of the SA parameters and the χ 2 progress.
• Save solutions... enables you to save all solutions plus the diffraction pattern and the Pawley fit in
one binary file with the extension .dash.
• Load solutions... enables you to load solutions with the extension .dash.
• Resume SA allows you to resume the simulated annealing where it left off. New runs will be
appended to the existing one.
• Delete last run: enables you to delete the last solution listed in the summary window. A .dash
file saved after solutions have been deleted will not include the solutions deleted.
• Selecting a solution’s Restart button starts the simulated annealing with this solution’s
parameters as the initial parameters. The initial parameters are not randomised and existing runs
are overwritten.
10.9.5 Reproducibility of Solution
A good indicator is the reproducibility of the structure solution using different starting seeds. If the
process keeps converging to the same minimum after multiple simulated annealing runs, you can
have increasing confidence in the solution.
10.10 Things to Try When Structure Solution Fails
• Review the original data; e.g. do the esds look reasonable; have all corrections been applied?
• Review the indexing and the Pawley fit; if necessary, try solving the structure in a different space
group.
• Check the molecular stereochemistry, or ring conformation, or whatever else might be relevant.
Might there be solvent present and are you sure of the molecular structure?
• Have you frozen any torsion angles around single bonds? If so, consider releasing them.
• Conversely, if the number of parameters is large, try reducing the search space by fixing torsion
angles to likely values or, at least, to smaller ranges.
• Try altering the non-hydrogen atom temperature factors.
• Persevere: if the data are reasonably good, Z’=1, and the number of rotatable torsions is < 10,
DASH should be able to solve the structure with ease.
10.11 Final Rietveld Refinement
• The solution found by DASH may be verified by Rietveld refinement using a program such as
TOPAS, GSAS, FullProf or RIETAN. DASH provides an interface to TOPAS, GSAS and
RIETAN.
130
DASH User Guide
• It is also possible to do a rigid-body Rietveld refinement in DASH (see Section 12.1, page 137).
• Initially, try refining only the scale factor and a global temperature factor.
• Following this, if necessary, you can attempt to use highly constrained Rietveld refinement of
the atomic positions and isotropic temperature factor and/or refine preferred orientation.
• You should consider using all the available data for the Rietveld refinement.
There are a great many packages capable of performing Rietveld refinement of an output structure.
Many of these are commercial and are shipped with diffractometers so consult your diffractometer
manufacturer for details. There are also several freely available packages, such as DBWS, CCSL,
GSAS, and FullProf. A good starting point is to visit http://www.ccp14.ac.uk,where many of the
programs can be downloaded, together with examples and tutorials.
10.12 DASH Limitations
• Generally, given reasonable data, DASH is routinely successful on structures containing one
molecule in the asymmetric unit and up to 10 flexible torsion angles. With more flexible
molecules, or with structures containing two molecules in the asymmetric unit, the solution is
often found if care is taken.
• Hard limits: 300 atoms, 600 reflections, 15000 data points.
• Although DASH is at the heart of the structure solution process, it is not completely stand-alone.
You will need to use some other programs, all of which can be obtained easily and with little or
no expense. Specifically, you will need programs for:
• Checking for possible unit cells of higher symmetry (see Appendix A: Programs for Indexing
and Cell Reduction, page 157).
• Building molecules in 3D (see Appendix B: Programs for Building 3D Molecules, page 157).
DASH User Guide
131
132
DASH User Guide
11 RUNNING DASH IN GRID MODE OR BATCH MODE
11.1 Overview of DASH in Batch/GRID Mode
Structure solution can now be performed by DASH using distributed processing to speed up the
procedure. This can be achieved in a number of ways depending on the resources at your disposal
whether this consists of a single-processor computer, a multi-core machine, or an entire network of
computers. The use of distributed computing can be particularly helpful when individual SA runs are
long due to a complex problem.
This section covers the following:
•
•
•
•
Setting up the input files (see Section 11.2, page 133))
Using DASH in batch mode (see Section 11.3, page 134)
Using DASH in GRID mode (see Section 11.4, page 135)
Post-processing of the results (see Section 11.5, page 135)
11.2 Setting up Input Files
During the process of setting up a series of SA structure solution runs there is the option of creating
batch files (see Section 10.6, page 119): clicking on the Create Batch File button will access the
Generating GRID batch files dialogue box. This section of the wizard will allow you to create the
input files necessary to run DASH in a distributed fashion.
The first step is to choose the total number of SA runs that are required; these runs are then split into
packages with a user-defined number of runs in each. If, for example, the user chooses 500 SA runs,
split into packages of 10 SA runs each, this will produce 50 packages. Each package is represented by
a .dbf file which gives DASH the instructions for that set of SA runs. A .grd file is also created
which lists the filenames for each of the separate packages. For running DASH across a GRID, it is
recommended to use packages containing just one SA run each, this allows greater flexibility when
assigning packages to different nodes of the network.
DASH User Guide
133
The .dbf files that are created store all of the parameters defined for the SA runs, so if a particular
option is chosen in the Simulated Annealing Options window then it will be adhered to in batch mode.
Note: The .dbf files are in simple text format and can be edited using a basic text-editor such as
Notepad or Wordpad in order to, for example, modify one parameter then re-run a set of SA runs.
To generate the input files, click on the Write > button. At this point you will be prompted for the
output directory and the filename for the .grd file. The.dbf files and the .dash files (when the jobs
are finished) will be named using this filename as the base along with a number corresponding to the
particular SA run package.
11.3 Using DASH in Batch Mode
11.3.1 Drag-and-Drop Running
Individual .dbf files can be dropped on to the DASH executable or the shortcut icon on your
desktop. In this mode DASH will run in the background without any displayed user interface.
Multiple SA packages can be run concurrently in this manner but no progress or final results will be
shown. The output files will be sent to the directory where the input files were residing (see Section
11.5, page 135)).
11.3.2 Multi-Core Processing with MDASH
For computers with multi-core processors there is also a currently unsupported tool called MDASH
which allows the controlled distribution of sets of SA runs across the system. The tool provides an
interface displaying the progress of the SA runs and will pop-up the DASH program to show the
results when completed. For further information on MDASH see the MDASH documentation within
134
DASH User Guide
the DASH 3.1\Unsupported Extras directory.
11.4 Using DASH in GRID Mode
For users with access to a GRID-enabled network of computers, DASH can also be run in GRIDmode. To achieve this it is necessary to set up the client PCs and the GRID servers for distributed
DASH. This application of DASH is not currently fully supported, but installers to set up the
computers to use DASH across the GRID are available from the DASH page of the CCDC website
(http://www.ccdc.cam.ac.uk/products/powder_diffraction/dash/) along with further documentation.
11.5 Post-Processing of Results
After running DASH in batch mode or in GRID mode there will usually be a large number of .dash
results files output. In order to process these results it is generally easier to combine all of the files
into one large .dash file. There are two ways of doing this:
• Open a command prompt and navigate to your results directory, then type “C:\Program
Files\CCDC\DASH 3.1\DASH.exe MERGE D:\Results Directory\ output.dash”.
This will automatically merge all the .dash files in the directory (D:\Results Directory)
to produce the file output.dash.
• Open a command prompt and navigate to your results directory, then type “C:\Program
Files\CCDC\DASH 3.1\DASH.exe MERGE”. A window will then appear which will allow
you to navigate to your results directory and give the name for your merged dash file.
DASH User Guide
135
136
DASH User Guide
12 RIGID-BODY RIETVELD REFINEMENT.
12.1 Rietveld Refinement in DASH
Rietveld refinement is a technique for minimising the differences between the modelled crystal data
and the experimental powder pattern. This means that it is a very useful method for validating DASH
solutions and for producing publication-quality crystal structures.
There are currently a large number of different programs available for performing Rietveld
refinement. Within DASH there is a built-in rigid-body refinement module and interfaces to three
external programs; TOPAS, GSAS and RIETAN. These interfaces are designed to facilitate the
transfer of structural data to the external program and allow an inexperienced user to carry out a basic
structural refinement. Each of the interfaces will not necessarily provide the best route through a
refinement for any specific structure, but are intended to offer a starting point for using the particular
program.
No support is provided for the external programs, which are supported to differing extents by their
own developers. The interfaces from DASH to each program, along with the built-in rigid-body
refinement module, will be supported.
Web-links for external programs:
• TOPAS - http://www.bruker-axs.de/index.php?id=topas
• GSAS - http://www.ccp14.ac.uk/solution/gsas/
• RIETAN - http://homepage.mac.com/fujioizumi/rietan/angle_dispersive/angle_dispersive.html
12.1.1 Options for Rietveld Refinement in DASH
There are currently four available options for Rietveld refinement in DASH.
Firstly, there is a built-in module for performing rigid-body Rietveld refinement which uses the rigid
bodies (Z-matrices) from the simulated annealing stage. The use of rigid bodies imposes a large
number of constraints on the atomic coordinates, which makes it more likely that the Rietveld
refinement will result in a chemically reasonable crystal structure. Another advantage of this
approach is that it is not necessary to include the atomic resolution data, so that the background and
peak shape parameters from the Pawley refinement can be used.
Rietveld refinement can also be carried out in a semi-automated way using the DASH interface to one
of three external programs; TOPAS, GSAS and RIETAN. These three interfaces prepare the reflection
data for the external programs, set up the refinement input files and facilitate refinement in a series of
pre-defined steps in order to carry out a basic structural refinement.
DASH User Guide
137
The interface between DASH and the refinement packages will only become available once the
relevant sections of the Configuration Window (Choose Options-> Configuration from the main
toolbar) in DASH have been completed.(see Section 2.8, page 19)
12.1.2 Starting Rietveld Refinement
There are two ways to start the Rietveld refinement:
• using the solution from a simulated annealing run.
• with the crystal structure from e.g. a .cif or a .res file.
The first option is recommended. Note that it is possible to save all solutions from the simulated
annealing and to read them back in at some other time (see Section 10.9.4, page 129).
In order to do a Rietveld refinement for a crystal structure that is not a simulated annealing structure
from DASH, choose Rietveld refinement in the main Wizard window. The following window will
appear:
138
DASH User Guide
It is also possible at this point to start an SA structure solution run using the given crystal structure
coordinates, without randomisation of initial coordinates, by clicking on the Start SA button.
Note that there can be ambiguities with respect to unit-cell settings and space-group settings: DASH
only knows one setting for P212121, and loading a crystal structure file with a different space group
setting will produce erroneous results.
12.2 Rigid Body Refinement
12.2.1 Rigid Body Refinement Dialogue Box
The Rigid-Body Rietveld Refinement dialogue box can be accessed from the Analyse Solutions
dialogue box after a simulated annealing run:
DASH User Guide
139
Refinable parameters are:
• positions and orientations of all Z-matrices
• torsion angles
• valence angles
• bond lengths
• global isotropic temperature pre-factor
• preferred orientation (if used during simulated annealing)
In order to refine a variable, its check box must be selected. The check boxes for positions/
orientations, torsion angles, valence angles and bond lengths are labelled V for variable and can be
switched on and off either individually or as a group by using the Clear and Set buttons.
Due to the low x-ray scattering power of Hydrogen, torsion angles, valence angles and bond lengths
involving one or more Hydrogen atoms are hidden by default and not refined.
The global isotropic temperature pre-factor is a factor that pre-multiplies the isotropic temperature
factors of the individual atoms. This allows different atoms (e.g., different elements) to have different
isotropic temperature factors.
Buttons:
Calculate: calculates the powder pattern with the current parameters without refinement.
Save as... allows you to save the current crystal structure to a .pdb, .res, .cssr, .ccl or
.cif file, and allows you to save the current powder pattern (both experimental +
140
DASH User Guide
calculated) to a .pro file.
Compare: displays the original crystal structure and the Rietveld refined crystal structure
superimposed.
Refine: performs a Rietveld refinement.
Close: closes the window.
View: displays the Rietveld refined crystal structure.
Axis... allows you to specify an axis to include the March-Dollase preferred orientation model.
Relabel: pressing Relabel relabels all atoms in all Z-matrices. This is useful for identifying e.g.
torsion angles if a molecular model used for building a Z-matrix did not have unique atom labels.
Note that it is possible to manually enter values for all refinable variables. These values will be
effective immediately.
12.2.2 Rigid-Body Refinement Steps
• When the Rigid-Body Rietveld Refinement dialogue box is launched, the Global isotropic
temperature factor check box is automatically selected, and hitting Refine will carry out the first
step of the Rietveld refinement. This step will not change the crystal structure, only the thermal
parameters are affected.
• The two most likely remaining candidates for refinement are the valence angles and the torsion
angles. The temperature factors tend to correlate with all other parameters, and it therefore best
not to refine the temperature factors in combination with other parameters. Therefore, the next
step is to deselect the Global isotropic temperature factor check box and to click on the Set
button for the valence angles, which will select all angles (except those involving Hydrogens) to
be refined.
• Next, deselect all angles by pressing the Clear button, then select all torsion angles (Set) and
refine those.
• Depending on how much the Chi-sqd values have changed, it may now be necessary to refine
the positions and orientations of the Z-matrices again (keeping all bond lengths, angles and
torsion angles fixed).
• Depending on the quality of your data (it must be good) and the quality of your initial model (if
you have reason to suspect it contains errors), you may try to refine some or all of the bond
lengths.
• Depending on how much the Chi-sqd values changed, you can return to the isotropic
temperature factor again, and repeat the whole cycle.
12.3 Preparation of data for Rietveld Refinement using TOPAS, GSAS or RIETAN
DASH User Guide
141
After choosing the refinement package you wish to use within the Rietveld Refinement Wizard and
selecting the required .sdi and crystal structure files, click Next >.
In order to perform the Rietveld refinement, it is necessary to do a Pawley or Le Bail fit within your
chosen refinement package using an input file generated by DASH. It may be advantageous to use a
142
DASH User Guide
different data set or data range for the Rietveld refinement to that used for structure solution, so it will
now be necessary to read in the diffraction data, click Next >.
Click Browse to find the diffraction data file that you want to use for Rietveld refinement and then
click on Next > to read the data into DASH.
DASH User Guide
143
• Check that the radiation type and wavelength specified are correct.
• If the data are monochromated, ensure that the Monochromated check box is ticked.
• If you are going to use GSAS for the refinement you have the opportunity to load in a GSAS
.ins file. You may want to do this if you have measured instrument parameters that you would
like to use in the refinement. Check the Load .ins file check box and browse to the location of the
file.
• Click Next > to continue.
144
DASH User Guide
The data range to be used can be modified at this point, but it is usual to utilise as much of the
diffraction pattern as possible during Rietveld refinement, hence the data truncation option has been
switched off by default. If you wish to truncate the data, enter the range to be used.
Click Next > to proceed.
12.4 Refinement using TOPAS
DASH User Guide
145
12.4.1 Preparation of Data for TOPAS Rietveld Refinement
Complete the steps of data preparation given (see Section 12.3, page 141). The final step before
sending the pattern to TOPAS is the Background Subtraction. This can be done within DASH, but it is
usually better to allow TOPAS to perform the background subtraction (using 20 background terms as
default).
Click Next >. A dialog will inform you when the first .inp file has been written and hence is ready to
be loaded into TOPAS.
Once TOPAS is open, launch the Kernal Mode (Launch-> Kernal Mode) and set the .inp file to the
.inp file written by DASH (Launch->Set INP file). To run the refinement hit the <play> button
146
DASH User Guide
(circled in red in the following screenshot) in the window called Launch Mode.
Once the cycle is complete, TOPAS will ask you whether you wish to update the .inp file with an
.out file. Hit No and return to DASH.
12.4.2 TOPAS Rietveld Refinement
The DASH interface for TOPAS will now guide you through the process of Rietveld refinement. At
any point you may exit the refinement process by clicking on Close.
DASH User Guide
147
The Rietveld Refinement with TOPAS wizard window will be displayed with the Anisotropic
broadening check box ticked. This is the first parameter to be refined.
• Hit Write and a new .inp file will be written, ready to be loaded into TOPAS.
• Return to TOPAS and hit the <play> button of the Launch Mode window. You will be asked
whether you wish to update the .inp file with the .out file. Hit No and return to DASH.
• Repeat the above cycle until all the parameters have been refined (six .inp files should be written
for a standard refinement). In the final cycle a .cif file of the solution will be written by
TOPAS.
Note: Default values for Weights on Restraints are provided but can be customised.
12.5 Refinement Using GSAS
148
DASH User Guide
12.5.1 Preparation of Data for GSAS Rietveld Refinement
Complete the steps of data preparation given (see Section 12.3, page 141). The final step before
sending the pattern to GSAS is the Background Subtraction. This can be done within DASH, but it is
usually better to allow GSAS to perform the background subtraction (using eight background terms
as default).
• Click Next > to save the GSAS .exp file. The Pawley fit will now automatically be performed
within GSAS, follow the on-screen instructions when prompted. Once the fit has been done, a
plot of the diffraction profile, the fit and the difference profile will be shown.
• Close this plot by clicking on File-> Quit. Return to DASH where you can continue with the
GSAS Rietveld Refinement.
12.5.2 GSAS Rietveld Refinement
DASH User Guide
149
The DASH interface for GSAS will now guide you through the process of Rietveld refinement. At
any point you may:
• view the structure (e.g. in Mercury) by clicking on View,
• switch to using EXPGUI for refinement by clicking on Launch an EXPGUI
• exit the refinement process by clicking on Close.
The right-hand side of the dialogue box shows the current refinement options - to start with only two
boxes are ticked to show that only the Scale and Background terms will be refined.
• Click on the Refine button and the .exp file will be automatically updated then submitted to
GSAS for the first step of refinement. When the cycle of refinement has completed you will be
returned to the DASH interface.
• The Refine options have been updated such that a Uiso parameter will be refined in the next
cycle of refinement. Continue this process of refinement until all the checkboxes have been
ticked.
• The final cycle of refinement will be followed by output of the final structure in .cif format.
Note: Default values for Weights on Restraints (FACTR) are provided but can be altered.
12.6 Refinement Using RIETAN
150
DASH User Guide
12.6.1 Preparation of Data for RIETAN Rietveld Refinement
Complete the steps of data preparation given (see Section 12.3, page 141). The final step, before
sending the pattern to RIETAN, is to choose the number of terms to be used by RIETAN for the
background subtraction; the default value is eight.
Click Next > to save RIETAN's .ins file. The pattern fitting will now be performed automatically
within RIETAN. Once the initial fit has been done, a plot of the diffraction profile, the fit and the
difference profile will be shown in gnuplot graph. The fitting of the pattern is a two step process:
closing the gnuplot window (File->Exit) will start the second step of the fitting. Once complete,
RIETAN will prompt you to save the .ins file.
12.6.2 RIETAN Rietveld Refinement
DASH User Guide
151
The DASH interface for RIETAN will now guide you through the process of Rietveld refinement. At
any point you may:
• view the structure (e.g. in Mercury) by clicking on View
• exit the refinement process by clicking on Close.
The right-hand side of the dialogue box shows the current refinement options - to start with, three
boxes are ticked, showing that only the Scale, Background and Biso terms will be refined.
• Click on the Refine button and the .ins file will be automatically updated, then submitted to
RIETAN for the first step of refinement. When the cycle of refinement has completed you will
be prompted to save the .ins file before being returned to the DASH interface.
• The Refine options will have been updated to include the atomic coordinates for the final cycle
of refinement. Click Refine to complete the refinement.
Note: Default values for the Number of cycles, Penalty parameter (TK) and TK increasing multiplier
(FINC) are provided but can be altered.
Note Output from RIETAN is written to a .lst file should you wish to look up the reported Rwp and
Rp values for the refinement cycles.
152
DASH User Guide
13 PREPARATION OF SINGLE CRYSTAL DATA
If you have poor single crystal data then it may be possible to solve the structure within DASH using
the simulated annealing protocol. This is often successful in cases such as limited hkl ranges from
high pressure cells, or just poorly diffracting crystals which do not give enough data for direct
methods phasing. DASH requires a file containing the h, k, l, F2 and σ (F2) values in the SHELX
format and a molecular model. Once the hkl data have been read in, the structure solution proceeds as
for powder diffraction.
• Select Preparation of single crystal data from the first DASH Wizard (see Section 2.10, page 21)
and click Next >.
• Enter the crystal system, space group and unit cell parameters in the boxes provided:
• Click Next >.
• This window allows the maximum resolution of the data to be set. In most cases the default
resolution of 1.75 Å will be appropriate:
DASH User Guide
153
• Click Next >.
• Open the file containing the h, k, l, F2 and σ (F2) values. The .hkl file is expected to be in
SHELX format:
154
DASH User Guide
• There are three options available for processing the data, and in most cases it is appropriate to
use the default values:
• Recalculate ESDs
• Discard F2 lower than 2.0 sigma
• Average Friedel related pairs
• Click Next >.
• Enter the file name of an .sdi file where the information required for structure solution will be
saved:
• This will bring up the DASH Wizard : Molecular Z-Matrices window. Proceed with entering a
molecular model and setting up simulated annealing runs as for normal powder data (see Section
10, page 101).
DASH User Guide
155
156
DASH User Guide
14 APPENDICES
14.1 Appendix A: Programs for Indexing and Cell Reduction
A good starting point for acquiring programs and advice is the Collaborative Computational Project
Number 14 (CCP14): http://www.ccp14.ac.uk.
In particular, http://www.ccp14.ac.uk/solution/indexing/ lists available software for powder indexing.
One simple way to cover all of the tried and tested indexing approaches is to retrieve and install the
CRYSFIRE indexing suite, which packages together a number of indexing programs under a common
interface. The CHEKCELL program may prove a useful tool for discriminating between multiple
solutions returned by an indexing program.
In our experience, DICVOL has proven to be a highly effective program for indexing powders. Note,
however, that it is not especially tolerant of spurious input lines. For example, the insertion of a single
spurious line into an otherwise accurate set of input lines can cause the solution to be missed. In
contrast, the absence of one or two correct lines from the input file does not necessarily mean that the
indexing solution will not be found.
14.2 Appendix B: Programs for Building 3D Molecules
Popular choices are:
• Chem3D Ultra - http://www.cambridgesoft.com/products/
• WebLabViewer - http://www.accelrys.com/viewer/
•
•
•
•
•
Cerius2 - http://www.accelrys.com/cerius2/index.html
SYBYL- http://www.tripos.com/software/sybyl.html
SPARTAN - http://www.wavefun.com/software/software.html
CORINA - http://www2.ccc.uni-erlangen.de/software/corina/
CONCORD - http://www.tripos.com/software/concord.html
It must be emphasised that you should examine the model created by such programs carefully. It is
quite possible to build a model that has poor bond-lengths and angles, which actually prevent you
from solving the structure. If in doubt always check the Cambridge Structural Database.
14.3 Appendix C: Definitions of DASH Figures of Merit
Figures of merit in DASH
Figures of merit for the Pawley fit to the profile:
DASH User Guide
157
Weighted profile R-factor
Expected profile R-factor
Where (N -P +C) = (number of observations) - (number of parameters) + (number of constraints).
∑ w (y
i
χ2 =
− yi(calc) )
2
i (obs)
i
(N − P + C)
Profile χ 2
Figures of merit for the Simulated Annealing Run
χ2 =∑ h
∑
k
[( I
h
− c Fh
2
)(V
−1
) hk ( I k −
c Fk
2
)]
χ 2 for the integrated intesities
where Ih,k is the extracted intensity from a Pawley refinement of the diffraction pattern, Vhk is the
covariance matrix from the Pawley refinement, c is the scale factor and Fh,k is the calculated structure
factor from the current trial structure.
158
DASH User Guide
∑ w (y
i
χ2 =
− yi(calc) )
2
i (obs)
i
(N − P + C)
Profile χ 2
14.4 Appendix D: Frequency of Occurrence of Space Groups
This appendix lists space groups by their frequency of occurrence in organic and organometallic
crystal structures.
14.4.1 D.1 Space Groups Listed by Frequency of Occurrence
This table lists all space groups that occur at least 40 times in the Cambridge Structural Database
(CSD), arranged in descending order of frequency. Since there were already over 250,000 structures
in the CSD when this list was compiled, any space group not included in the table is very uncommon.
Only the symbol for the standard setting is given for each space group in the list.
Number
14
P21/c
Occurrences
73151
Number
2
P-1
Occurrences
41639
19
P212121
18216
15
C2/c
15150
4
P21
11572
61
Pbca
7768
33
Pna21
3157
62
Pnma
3128
9
Cc
2075
1
P1
1848
60
Pbcn
1841
5
C2
1702
29
Pca21
1474
11
P21/m
1350
13
P2/c
1064
12
C2/m
1053
148
R-3
1044
18
P21212
970
7
Pc
760
56
Pccn
720
43
Fdd2
684
88
I41/a
671
92
P41212
522
20
C2221
393
36
Cmc21
362
64
Cmca
334
82
I-4
330
176
P63/m
325
146
R3
311
96
P43212
290
DASH User Guide
Symbol
Symbol
159
160
114
P-421c
289
57
Pbcm
285
86
P42/n
275
161
R3c
271
63
Cmcm
270
76
P41
240
167
R-3c
236
205
Pa3
226
152
P3121
222
85
P4/n
213
41
Aba2
211
147
P-3
194
31
Pmn21
188
70
Fddd
180
58
Pnnm
173
144
P31
168
52
Pnna
166
173
P63
149
45
Iba2
143
198
P213
143
169
P61
132
145
P32
131
8
Cm
126
87
I4/m
122
122
I-42d
114
78
P43
113
154
P3221
106
165
P-3c1
100
72
Ibam
99
59
Pmmn
92
68
Ccca
92
170
P65
90
155
R32
87
142
I41/acd
86
110
I41cd
85
130
P4/ncc
85
166
R-3m
84
54
Pcca
81
129
P4/nmm
79
160
R3m
78
55
Pbam
74
34
Pnn2
72
113
P-421m
71
143
P3
70
163
P-31c
62
225
Fm3m
62
121
I-42m
57
80
I41
56
79
I4
55
81
P-4
55
217
I-43m
55
23
I222
54
3
P2
53
10
P2/m
53
186
P63mc
53
118
P-4n2
49
126
P4/nnc
49
127
P4/mbm
49
194
P63/mmc
49
26
Pmc21
48
DASH User Guide
159
P31c
48
73
Ibca
47
178
P6122
47
94
P42212
46
136
P42/mnm
46
32
Pba2
44
17
P2221
43
40
Ama2
42
14.4.2 D.2 Chiral (Sohnke) Space Groups Listed by Frequency of Occurrence
This table lists all Sohnke space groups (i.e. space groups in which enantiomerically pure substances
can crystallise) that occur at least 40 times in the Cambridge Structural Database (CSD), arranged in
descending order of frequency. Since there were over 250,000 structures in the CSD when this lost
was compiled, any space group not in the table is very uncommon. Only the symbol for the standard
setting is given for each space group in the list.
Number
Symbol
Occurrences
Number
Symbol
Occurrences
19
P212121
18216
4
P21
11572
1
P1
1848
5
C2
1702
18
P21212
970
92
P41212
522
20
C2221
393
146
R3
311
96
P43212
290
76
P41
240
152
P3121
222
144
P31
168
173
P63
149
198
P213
143
169
P61
132
145
P32
131
78
P43
113
154
P3221
106
170
P65
90
155
R32
87
143
P3
70
80
I41
56
79
I4
55
23
I222
54
3
P2
53
178
P6122
47
94
P42212
46
17
P2221
43
14.4.3 D.3. Space Group Listing for DASH.
The Entry Number is an internal identifier used by DASH. The corresponding space group number,
setting and symbol are shown in the second column of the table. Within a DASH .sdi file, the space
group is stored as:
DASH User Guide
161
SpaceGroup entry_number sg#:setting symbol
For example:
SpaceGroup
or
SpaceGroup
39
4:b
P 1 21 1
52
9:b3
I 1 a 1
Entry number
162
SG#:setting
Symbol
1
1
P 1
2
2
P -1
3
3:a
P 2 1 1
4
4:a
P 21 1 1
5
5:a1
B 2 1 1
6
5:a2
C 2 1 1
7
5:a3
I 2 1 1
8
6:a
P m 1 1
9
7:a1
P b 1 1
10
7:a2
P n 1 1
11
7:a3
P c 1 1
12
8:a1
B m 1 1
13
8:a2
C m 1 1
14
8:a3
I m 1 1
15
9:a1
B b 1 1
16
9:a2
C n 1 1
17
9:a3
I c 1 1
18
9:-a1
C c 1 1
19
9:-a2
B n 1 1
20
9:-a3
I b 1 1
21
10:a
P 2/m 1 1
22
11:a
P 21/m 1 1
23
12:a1
B 2/m 1 1
24
12:a2
C 2/m 1 1
25
12:a3
I 2/m 1 1
26
13:a1
P 2/b 1 1
27
13:a2
P 2/n 1 1
28
13:a3
P 2/c 1 1
29
14:a1
P 21/b 1 1
30
14:a2
P 21/n 1 1
31
14:a3
P 21/c 1 1
32
15:a1
B 2/b 1 1
DASH User Guide
33
15:a2
C 2/n 1 1
34
15:a3
I 2/c 1 1
35
15:-a1
C 2/c 1 1
36
15:-a2
B 2/n 1 1
37
15:-a3
I 2/b 1 1
38
3:b
P 1 2 1
39
4:b
P 1 21 1
40
5:b1
C 1 2 1
41
5:b2
A 1 2 1
42
5:b3
I 1 2 1
43
6:b
P 1 m 1
44
7:b1
P 1 c 1
45
7:b2
P 1 n 1
46
7:b3
P 1 a 1
47
8:b1
C 1 m 1
48
8:b2
A 1 m 1
49
8:b3
I 1 m 1
50
9:b1
C 1 c 1
51
9:b2
A 1 n 1
52
9:b3
I 1 a 1
53
9:-b1
A 1 a 1
54
9:-b2
C 1 n 1
55
9:-b3
I 1 c 1
56
10:b
P 1 2/m 1
57
11:b
P 1 21/m 1
58
12:b1
C 1 2/m 1
59
12:b2
A 1 2/m 1
60
12:b3
I 1 2/m 1
61
13:b1
P 1 2/c 1
62
13:b2
P 1 2/n 1
63
13:b3
P 1 2/a 1
64
14:b1
P 1 21/c 1
65
14:b2
P 1 21/n 1
66
14:b3
P 1 21/a 1
67
15:b1
C 1 2/c 1
68
15:b2
A 1 2/n 1
69
15:b3
I 1 2/a 1
70
15:-b1
A 1 2/a 1
71
15:-b2
C 1 2/n 1
72
15:-b3
I 1 2/c 1
73
DASH User Guide
3:c
P 1 1 2
163
164
74
4:c
P 1 1 21
75
5:c1
A 1 1 2
76
5:c2
B 1 1 2
77
5:c3
I 1 1 2
78
6:c
P 1 1 m
79
7:c1
P 1 1 a
80
7:c2
P 1 1 n
81
7:c3
P 1 1 b
82
8:c1
A 1 1 m
83
8:c2
B 1 1 m
84
8:c3
I 1 1 m
85
9:c1
A 1 1 a
86
9:c2
B 1 1 n
87
9:c3
I 1 1 b
88
9:-c1
B 1 1 b
89
9:-c2
A 1 1 n
90
9:-c3
I 1 1 a
91
10:c
P 1 1 2/m
92
11:c
P 1 1 21/m
93
12:c1
A 1 1 2/m
94
12:c2
B 1 1 2/m
95
12:c3
I 1 1 2/m
96
13:c1
P 1 1 2/a
97
13:c2
P 1 1 2/n
98
13:c3
P 1 1 2/b
99
14:c1
P 1 1 21/a
100
14:c2
P 1 1 21/n
101
14:c3
P 1 1 21/b
102
15:c1
A 1 1 2/a
103
15:c2
B 1 1 2/n
104
15:c3
I 1 1 2/b
105
15:-c1
B 1 1 2/b
106
15:-c2
A 1 1 2/n
107
15:-c3
I 1 1 2/a
108
16
P 2 2 2
109
17
P 2 2 21
110
17:cab
P 21 2 2
111
17:bca
P 2 21 2
112
18
P 21 21 2
113
18:cab
P 2 21 21
114
18:bca
P 21 2 21
DASH User Guide
DASH User Guide
115
19
P 21 21 21
116
20
C 2 2 21
117
20:cab
A 21 2 2
118
20:bca
B 2 21 2
119
21
C 2 2 2
120
21:cab
A 2 2 2
121
21:bca
B 2 2 2
122
22
F 2 2 2
123
23
I 2 2 2
124
24
I 21 21 21
125
25
P m m 2
126
25:cab
P 2 m m
127
25:bca
P m 2 m
128
26
P m c 21
129
26:ba-c
P c m 21
130
26:cab
P 21 m a
131
26:-cba
P 21 a m
132
26:bca
P b 21 m
133
26:a-cb
P m 21 b
134
27
P c c 2
135
27:cab
P 2 a a
136
27:bca
P b 2 b
137
28
P m a 2
137
28:ba-c
P b m 2
139
28:cab
P 2 m b
140
28:-cba
P 2 c m
141
28:bca
P c 2 m
142
28:a-cb
P m 2 a
143
29
P c a 21
144
29:ba-c
P b c 21
145
29:cab
P 21 a b
146
29:-cba
P 21 c a
147
29:bca
P c 21 b
148
29:a-cb
P b 21 a
149
30
P n c 2
150
30:ba-c
P c n 2
151
30:cab
P 2 n a
152
30:-cba
P 2 a n
153
30:bca
P b 2 n
154
30:a-cb
P n 2 b
155
31
P m n 21
165
166
156
31:ba-c
P n m 21
157
31:cab
P 21 m n
158
31:-cba
P 21 n m
159
31:bca
P n 21 m
160
31:a-cb
P m 21 n
161
32
P b a 2
162
32:cab
P 2 c b
163
32:bca
P c 2 a
164
33
P n a 21
165
33:ba-c
P b n 21
166
33:cab
P 21 n b
167
33:-cba
P 21 c n
168
33:bca
P c 21 n
169
33:a-cb
P n 21 a
170
34
P n n 2
171
34:cab
P 2 n n
172
34:bca
P n 2 n
173
35
C m m 2
174
35:cab
A 2 m m
175
35:bca
B m 2 m
176
36
C m c 21
177
36:ba-c
C c m 21
178
36:cab
A 21 m a
179
36:-cba
A 21 a m
180
36:bca
B b 21 m
181
36:a-cb
B m 21 b
182
37
C c c 2
183
37:cab
A 2 a a
184
37:bca
B b 2 b
185
38
A m m 2
186
38:ba-c
B m m 2
187
38:cab
B 2 m m
188
38:-cba
C 2 m m
189
38:bca
C m 2 m
190
38:a-cb
A m 2 m
191
39
A b m 2
192
39:ba-c
B m a 2
193
39:cab
B 2 c m
194
39:-cba
C 2 m b
195
39:bca
C m 2 a
196
39:a-cb
A c 2 m
DASH User Guide
DASH User Guide
197
40
A m a 2
198
40:ba-c
B b m 2
199
40:cab
B 2 m b
200
40:-cba
C 2 c m
201
40:bca
C c 2 m
202
40:a-cb
A m 2 a
203
41
A b a 2
204
41:ba-c
B b a 2
205
41:cab
B 2 c b
206
41:-cba
C 2 c b
207
41:bca
C c 2 a
208
41:a-cb
A c 2 a
209
42
F m m 2
210
42:cab
F 2 m m
211
42:bca
F m 2 m
212
43
F d d 2
213
43:cab
F 2 d d
214
43:bca
F d 2 d
215
44
I m m 2
216
44:cab
I 2 m m
217
44:bca
I m 2 m
218
45
I b a 2
219
45:cab
I 2 c b
220
45:bca
I c 2 a
221
46
I m a 2
222
46:ba-c
I b m 2
223
46:cab
I 2 m b
224
46:-cba
I 2 c m
225
46:bca
I c 2 m
226
46:a-cb
I m 2 a
227
47
P m m m
228
48:1
P n n n:1
229
48:2
P n n n:2
230
49
P c c m
231
49:cab
P m a a
232
49:bca
P b m b
233
50:1
P b a n:1
234
50:2
P b a n:2
235
50:1cab
P n c b:1
236
50:2cab
P n c b:2
237
50:1bca
P c n a:1
167
168
238
50:2bca
P c n a:2
239
51
P m m a
240
51:ba-c
P m m b
241
51:cab
P b m m
242
51:-cba
P c m m
243
51:bca
P m c m
244
51:a-cb
P m a m
245
52
P n n a
246
52:ba-c
P n n b
247
52:cab
P b n n
248
52:-cba
P c n n
249
52:bca
P n c n
250
52:a-cb
P n a n
251
53
P m n a
252
53:ba-c
P n m b
253
53:cab
P b m n
254
53:-cba
P c n m
255
53:bca
P n c m
256
53:a-cb
P m a n
257
54
P c c a
258
54:ba-c
P c c b
259
54:cab
P b a a
260
54:-cba
P c a a
261
54:bca
P b c b
262
54:a-cb
P b a b
263
55
P b a m
264
55:cab
P m c b
265
55:bca
P c m a
266
56
P c c n
267
56:cab
P n a a
268
56:bca
P b n b
269
57
P b c m
270
57:ba-c
P c a m
271
57:cab
P m c a
272
57:-cba
P m a b
273
57:bca
P b m a
274
57:a-cb
P c m b
275
58
P n n m
276
58:cab
P m n n
277
58:bca
P n m n
278
59:1
P m m n:1
DASH User Guide
DASH User Guide
279
59:2
P m m n:2
280
59:1cab
P n m m:1
281
59:2cab
P n m m:2
282
59:1bca
P m n m:1
283
59:2bca
P m n m:2
284
60
P b c n
285
60:ba-c
P c a n
286
60:cab
P n c a
287
60:-cba
P n a b
288
60:bca
P b n a
289
60:a-cb
P c n b
290
61
P b c a
291
61:ba-c
P c a b
292
62
P n m a
293
62:ba-c
P m n b
294
62:cab
P b n m
295
62:-cba
P c m n
296
62:bca
P m c n
297
62:a-cb
P n a m
298
63
C m c m
299
63:ba-c
C c m m
300
63:cab
A m m a
301
63:-cba
A m a m
302
63:bca
B b m m
303
63:a-cb
B m m b
304
64
C m c a
305
64:ba-c
C c m b
306
64:cab
A b m a
307
64:-cba
A c a m
308
64:bca
B b c m
309
64:a-cb
B m a b
310
65
C m m m
311
65:cab
A m m m
312
65:bca
B m m m
313
66
C c c m
314
66:cab
A m a a
315
66:bca
B b m b
316
67
C m m a
317
67:ba-c
C m m b
318
67:cab
A b m m
319
67:-cba
A c m m
169
170
320
67:bca
B m c m
321
67:a-cb
B m a m
322
68:1
C c c a:1
323
68:2
C c c a:2
324
68:1ba-c
C c c b:1
325
68:2ba-c
C c c b:2
326
68:1cab
A b a a:1
327
68:2cab
A b a a:2
328
68:1-cba
A c a a:1
329
68:2-cba
A c a a:2
330
68:1bca
B b c b:1
331
68:2bca
B b c b:2
332
68:1a-cb
B b a b:1
333
68:2a-cb
B b a b:2
334
69
F m m m
335
70:1
F d d d:1
336
70:2
F d d d:2
337
71
I m m m
338
72
I b a m
339
72:cab
I m c b
340
72:bca
I c m a
341
73
I b c a
342
73:ba-c
I c a b
343
74
I m m a
344
74:ba-c
I m m b
345
74:cab
I b m m
346
74:-cba
I c m m
347
74:bca
I m c m
348
74:a-cb
I m a m
349
75
P 4
350
76
P 41
351
77
P 42
352
78
P 43
353
79
I 4
354
80
I 41
355
81
P -4
356
82
I -4
357
83
P 4/m
358
84
P 42/m
359
85:1
P 4/n:1
360
85:2
P 4/n:2
DASH User Guide
DASH User Guide
361
86:1
P 42/n:1
362
86:2
P 42/n:2
363
87
I 4/m
364
88:1
I 41/a:1
365
88:2
I 41/a:2
366
89
P 4 2 2
367
90
P 42 1 2
368
91
P 41 2 2
369
92
P 41 21 2
370
93
P 42 2 2
371
94
P 42 21 2
372
95
P 43 2 2
373
96
P 43 21 2
374
97
I 4 2 2
375
98
I 41 2 2
376
99
P 4 m m
377
100
P 4 b m
378
101
P 42 c m
379
102
P 42 n m
380
103
P 4 c c
381
104
P 4 n c
382
105
P 42 m c
383
106
P 42 b c
384
107
I 4 m m
385
108
I 4 c m
386
109
I 41 m d
387
110
I 41 c d
388
111
P -4 2 m
389
112
P -4 2 c
390
113
P -4 21 m
391
114
P -4 21 c
392
115
P -4 m 2
393
116
P -4 c 2
394
117
P -4 b 2
395
118
P -4 n 2
396
119
I -4 m 2
397
120
I -4 c 2
398
121
I -4 2 m
399
122
I -4 2 d
400
123
P 4/m m m
401
124
P 4/m c c
171
172
402
125:1
P 4/n b m:1
403
125:2
P 4/n b m:2
404
126:1
P 4/n n c:1
405
126:2
P 4/n n c:2
406
127
P 4/m b m
407
128
P 4/m n c
408
129:1
P 4/n m m:1
409
129:2
P 4/n m m:2
410
130:1
P 4/n c c:1
411
130:2
P 4/n c c:2
412
131
P 42/m m c
413
132
P 42/m c m
414
133:1
P 42/n b c:1
415
133:2
P 42/n b c:2
416
134:1
P 42/n n m:1
417
134:2
P 42/n n m:2
418
135
P 42/m b c
419
136
P 42/m n m
420
137:1
P 42/n m c:1
421
137:2
P 42/n m c:2
422
138:1
P 42/n c m:1
423
138:2
P 42/n c m:2
424
139
I 4/m m m
425
140
I 4/m c m
426
141:1
I 41/a m d:1
427
141:2
I 41/a m d:2
428
142:1
I 41/a c d:1
429
142:2
I 41/a c d:2
430
143
P 3
431
144
P 31
432
145
P 32
433
146:H
R 3:H
434
147
P -3
435
148:H
R -3:H
436
149
P 3 1 2
437
150
P 3 2 1
438
151
P 31 1 2
439
152
P 31 2 1
440
153
P 32 1 2
441
154
P 32 2 1
442
155:H
R 32:H
DASH User Guide
DASH User Guide
443
156
P 3 m 1
444
157
P 3 1 m
445
158
P 3 c 1
446
159
P 3 1 c
447
160:H
R 3 m:H
448
161:H
R 3 c:H
449
162
P -3 1 m
450
163
P -3 1 c
451
164
P -3 m 1
452
165
P -3 c 1
453
166:H
R -3 m:H
454
167:H
R -3 c:H
455
146:R
R 3:R
456
148:R
R -3:R
457
155:R
R 32:R
458
160:R
R 3 m:R
459
161:R
R 3 c:R
460
166:R
R -3 m:R
461
167:R
R -3 c:R
462
168
P 6
463
169
P 61
464
170
P 65
465
171
P 62
466
172
P 64
467
173
P 63
468
174
P -6
469
175
P 6/m
470
176
P 63/m
471
177
P 6 2 2
472
178
P 61 2 2
473
179
P 65 2 2
474
180
P 62 2 2
475
181
P 64 2 2
476
182
P 63 2 2
477
183
P 6 m m
478
184
P 6 c c
479
185
P 63 c m
480
186
P 63 m c
481
187
P -6 m 2
482
188
P -6 c 2
482
189
P -6 2 m
173
174
484
190
P -6 2 c
485
191
P 6/m m m
486
192
P 6/m c c
487
193
P 63/m c m
488
194
P 63/m m c
489
195
P 2 3
490
196
F 2 3
491
197
I 2 3
492
198
P 21 3
493
199
I 21 3
494
200
P m -3
495
201:1
P n -3:1
496
201:2
P n -3:2
497
202
F m -3
498
203:1
F d -3:1
499
203:2
F d -3:2
500
204
I m -3
501
205
P a -3
502
206
I a -3
503
207
P 4 3 2
504
208
P 42 3 2
505
209
F 4 3 2
506
210
F 41 3 2
507
211
I 4 3 2
508
212
P 43 3 2
509
213
P 41 3 2
510
214
I 41 3 2
511
215
P -4 3 m
512
216
F -4 3 m
513
217
I -4 3 m
514
218
P -4 3 n
515
219
F -4 3 c
516
220
I -4 3 d
517
221
P m -3 m
518
222:1
P n -3 n:1
519
222:2
P n -3 n:2
520
223
P m -3 n
521
224:1
P n -3 m:1
522
224:2
P n -3 m:2
523
225
F m -3 m
524
226
F m -3 c
DASH User Guide
525
227:1
F d -3 m:1
526
227:2
F d -3 m:2
527
228:1
F d -3 c:1
528
228:2
F d -3 c:2
529
229
I m -3 m
530
230
I a -3 d
14.5 Appendix E: Extinction Symbols and their Space Groups
In order to use this table look up the extinction symbol returned by the space group determination
program, in the left-hand column of the table. The possible space groups for that extinction symbol
are then listed in the right-hand columns.
Monoclinic a axis
P -
1
1
P 2 1 1
P 21 1
1
P 21 1 1
P b
1
1
P m 1 1
P 21/m 1 1
P b 1 1
P 21/b 1 1
P c
1
1
1
P c 1 1
P n 1 1
P 21/n 1 1
1
1
C n
1
1
B -
1
1
B b
1
1
I -
1
1
I c
1
1
P 2/c 1 1
P 21/c 1 1
1
C -
P 2/b 1 1
P 21/b 1 1
P 21/c 1 1
P n
P 2/m 1 1
P 2/n 1 1
P 21/n 1 1
C 2 1 1
B 2 1 1
I 2 1 1
C m 1 1
C 2/m 1 1
C n 1 1
C 2/n 1 1
B m 1 1
B 2/m 1 1
B b 1 1
B 2/b 1 1
I m 1 1
I 2/m 1 1
I c 1 1
I 2/c 1 1
P 1 m 1
P 1 2/m 1
Monoclinic b axis
P 1
-
1
P 1
21 1
P 1
a
P 1 2 1
P 1 21 1
1
P 1 21/m 1
P 1 a 1
P 1 21/a 1
P 1
c
P 1 21/a 1
1
P 1 c 1
P 1 21/c 1
P 1
n
P 1 n 1
P 1 21/n 1
DASH User Guide
-
1
C 1
c
1
A 1
-
1
A 1
n
1
I 1
-
1
P 1 2/c 1
P 1 21/c 1
1
C 1
P 1 2/a 1
P 1 2/n 1
P 1 21/n 1
C 1 2 1
A 1 2 1
I 1 2 1
C 1 m 1
C 1 2/m 1
C 1 c 1
C 1 2/c 1
A 1 m 1
A 1 2/m 1
A 1 n 1
A 1 2/n 1
I 1 m 1
I 1 2/m 1
175
I 1
a
1
I 1 a 1
I 1 2/a 1
P 1 1 m
P 1 1 2/m
Monoclinic c axis
P 1
1
-
P 1 1 2
P 1
1
21
P 1 1 21
P 1
1
a
P 1
1 21/a
P 1
1
P 1
1 21/c
P 1
1
P 1
1 21/n
B 1
1
-
B 1
1
n
A 1
1
-
A 1
1
a
I 1
1
-
I 1
1
b
P 1 1 21/m
P 1 1 a
P 1 1 2/a
P 1 1 21/a
b
P 1 1 b
P 1 1 2/b
P 1 1 21/b
n
P 1 1 n
P 1 1 2/n
P 1 1 21/n
B 1 1 2
A 1 1 2
I 1 1 2
B 1 1 m
B 1 1 2/m
B 1 1 n
B 1 1 2/n
A 1 1 m
A 1 1 2/m
A 1 1 a
A 1 1 2/a
I 1 1 m
I 1 1 2/m
I 1 1 b
I 1 1 2/b
P m m 2
P m m m
Orthorhombic
P -
-
-
P 2 2 2
P m 2 m
P 2 m m
P -
-
21
P 2 2 21
P -
21 -
P 2 21 2
P -
21 21
P 2 21 21
P 21 -
-
P 21 2 2
P 21 -
21
P 21 2 21
P 21 21 -
P 21 21 2
P 21 21 21
P 21 21 21
P P P P -
a
a
b
n
-
P m 2 a
P 21 m a
P m m a
P m 21 b
P m 21 b
P 2 m b
P m m b
P m 21 n
P 21 m n
P m m n
P m a 2
P m a m
P 21 a m
P -
a
a
P 2 a a
P m a a
P -
a
b
P 21 a b
P m a b
P -
a
n
P 2 a n
P m a n
P -
c
-
P m c 21
P -
176
c
a
P 2 c m
P m c m
P 21 c a
P m c a
DASH User Guide
DASH User Guide
P -
c
b
P 2 c b
P m c b
P -
c
n
P 21 c n
P m c n
P -
n
-
P m n 21
P 21 n m
P m n m
P -
n
a
P 2 n a
P m n a
P -
n
b
P 21 n b
P m n b
P -
n
n
P 2 n n
P m n n
P b
-
-
P b m 2
P b 21 m
P b m m
P b
-
a
P b 21 a
P b m a
P b
-
b
P b 2 b
P b m b
P b
-
n
P b 2 n
P b m n
P b
a
-
P b a 2
P b a m
P b
a
a
P b a a
P b
a
b
P b a b
P b
a
n
P b a n
P b
c
-
P b
c
a
P b c a
P b
c
b
P b c b
P b
c
n
P b c n
P b
n
-
P b
n
a
P b n a
P b
n
b
P b n b
P b
n
n
P b n n
P c
-
-
P b c 21
P b n 21
P b c m
P b n m
P c m 21
P c 2 m
P c m m
P c
-
a
P c 2 a
P c m a
P c
-
b
P c 21 b
P c m b
P c
-
n
P c 21 n
P c m n
P c
a
-
P c a 21
P c a m
P c
a
a
P c a a
P c
a
b
P c a b
P c
a
n
P c a n
P c
c
-
P c
c
a
P c c a
P c
c
b
P c c b
P c
c
n
P c c n
P c
n
-
P c
n
a
P c n a
P c
n
b
P c n b
P c
c
n
P c c n
P c c 2
P c n 2
P c c m
P c n m
177
P n
-
-
P n m 21
P n m m
P n 21 m
P n
-
a
P n 21 a
P n m a
P n
-
b
P n 2 b
P n m b
P n
-
n
P n 2 n
P n m n
P n
a
-
P n a 21
P n a m
P n
a
a
P n a a
P n
a
b
P n a b
P n
a
n
P n a n
P n
c
-
P n
c
a
P n c a
P n
c
b
P n c b
P n
c
n
P n c n
P n
n
-
P n
n
a
P n n a
P n
n
b
P n n b
P n
n
n
P n n n
C -
-
-
P n c 2
P n n 2
C 2 2 2
C m m 2
P n c m
P n n m
C m m m
C m 2 m
C 2 m m
C -
-
C -
- (ab)
C -
c
21
C 2 2 21
-
C m 2 a
C m m a
C 2 m b
C m m b
C m c 21
C m c m
C 2 c m
C -
c (ab)
C 2 c b
C m c a
C c
-
C c m 21
C c m m
-
C c 2 m
C c
- (ab)
C c 2 a
C c m b
C c
c
C c c 2
C c c m
C c
c (ab)
-
C c c a
C c c b
B -
-
-
B 2 2 2
B m m 2
B m m m
B m 2 m
B 2 m m
B -
21 -
B -
-
b
B 2 21 2
B m 21 b
B m m b
B 2 m b
B - (ac)B - (ac)b
178
B m a 2
B m a m
B 2 c m
B m c m
B 2 c b
B m a b
DASH User Guide
B b
-
-
B b m 2
B b m m
B b 21 m
B b
-
b
B b 2 b
B b m b
B b (ac)-
B b a 2
B b c m
B b (ac)b
B b a b
B b a c
A -
-
-
A 2 2 2
A m m 2
A m m m
A m 2 m
A 2 2 m
A 21 -
-
A -
a
-
A 21 2 2
A m 2 a
A m m a
A 21 m a
A -
a
-
A m a 2
A m a m
A 21 a m
A -
a
a
A 2 a a
A m a a
A(bc)-
-
A b m 2
A b m m
A c 2 m
A c m m
A(bc)-
a
A c 2 a
A b m a
A(bc)a
-
A b a 2
A c a m
A(bc)a
a
A b a a
A ca a
I -
-
-
I 2 2 2
I m m 2
I m m m
I m 2 m
I 2 2 m
I -
- (ab)
I - (ac)I -
I m 2 a
I m m a
I m 2 b
I m m b
I m a 2
I m a m
I 2 c m
I m c m
c
b
I 2 c b
I m c b
I(bc)-
-
I b m 2
I b m m
I c m 2
I c m m
I c
-
a
I c 2 a
I c m a
I b
a
-
I b a 2
I b a m
I b
c
a
F _
_
_
I b c a
F 2 2 2
F m m 2
F m m m
F m 2 m
F 2 m m
DASH User Guide
F _
d
d
F 2 d d
F d
_
d
F d 2 d
F d
d
_
F d d 2
F d
d
d
F d d d
179
Tetragonal
P -
-
-
P4
P-4
P4/m
P 4 2 2
P 4 m m
P -4 2 m
P4/m m m
P -4 2 c
P42/m m c
P -4 m 2
P -
21 -
P 42 -
-
P 4 21 2
P42
P42/m
P 42 21 P 41 -
-
P -4 21
m
P 42 2 2
P 42 21 2
P41
P 41 2 2
P43
P 43 2 2
P 41 21 _
P 41 21 2
P 43 21 2
P -
-
c
P 42 m c
P -
21 c
P -
b
-
P 4 b m
P -
b
c
P 42 b c
P -
c
-
P 42 c m
P -
c
c
P 4 c c
P -
n
-
P 42 n m
P -
n
c
P 4 n c
P n
-
-
P -4 21 c
P -4 b 2
P42/m b c
P -4 c 2
P42/m c m
P4/m c c
P -4 n 2
P42/m n m
P4/ m n c
P4/n
P 42/n - -
P4/m b m
P4/n m m
P42/n
P n
-
c
P42/n m c
P n
b
-
P4/ n b m
P n
b
c
P42/n b c
P n
c
-
P42/n c m
P n
c
c
P4/n c c
P n
n
-
P42/n n m
P n
n
c
P4/n n c
I -
-
-
I4
I-4
I4/m
I 4 2 2
I 4 m m
I -4 2 m
I4/m m m
I -4 m 2
I 41 -
-
I -
-
d
I 41 m d
I -4 2 d
I -
c
-
I 4 c m
I -4 c 2
I -
c
d
I 41/a - -
I41
I41 2 2
I4/m c m
I 41 c d
I41/a
I a
-
d
I41/a m d
I a
c
d
I41/a c d
Trigonal
180
DASH User Guide
P -
-
-
P 31 - -
P3
P-3
P31
P3 2 1
P3 m 1
P-3 m 1
P3 1 m
P-3 1 m
P3 1 2
P31 2 1
P31 1 2
P32
P32 2 1
P32 1 2
P -
-
c
P 3 1 c
P-3 1 c
P -
c
-
P 3 c 1
P-3 c 1
R -
-
-
R -
-
c
R3
R-3
R32
R3m
R-3m
R3c
R-3c
P 6 2 2
P 6 m m
Hexagonal
P -
-
-
P6
P-6
P6/m
P-6 2 m
P6/mmm
P-6 m 2
P 63 -
-
P63
P 62 -
-
P62
P62 2 2
P64
P64 2 2
P61
P61 2 2
P65
P65 2 2
P 61 -
-
P63/m
P63 2 2
P -
-
c
P 63 m c
P-6 2 c
P63/mmc
P -
c
-
P 63 c m
P-6 c 2
P63/mcm
P -
c
c
P 6 c c
-
-
P6/mcc
Cubic
P -
P23
P 21(42) - P 41 -
Pm-3
P4 3 2
P21 3
P42 3 2
-
P-4 3 m
P m -3 m
P-4 3 n
P m -3 n
P41 3 2
P43 3 2
P -
-
n
P a
-
-
Pa-3
P n
-
-
Pn-3
P n
-
n
I -
-
-
P n -3 m
P n -3 n
I23
Im-3
I4 3 2
I-4 3 2
I m -3 m
I21 3
I 41 -
-
I -
-
d
I a
-
-
I a
-
d
F -
-
-
F 41 -
-
F -
c
-
I41 3 2
I-4 3 d
Ia-3
I a -3 d
F23
DASH User Guide
Fm-3
F4 3 2
F-4 3 m
F m -3 m
F-4 3 c
F m -3 c
F41 3 2
181
F d
-
-
F d
-
c
Fd-3
F d -3 m
F d -3 c
14.6 Appendix F: Using the Cambridge Structural Database
The Cambridge Structural Database (CSD) contains >430,000 crystal structures for organic and
organometallic molecules. The CSD is part of the CSD System which also includes software for:
• Search, retrieval and analysis of structures - ConQuest
• Crystal structure visualisation - Mercury
• Generation of in-house databases searchable alongside the CSD - PreQuest
• Data analysis - Vista
The CSD System also incorporates IsoStar, a library of intermolecular interactions, containing data
derived from both the CSD and PDB, and Mogul, a molecular geometry library.
For more information about the Cambridge Crystallographic Data Centre (CCDC) see:
http://www. ccdc.cam.ac.uk
14.6.1 F.1 Source of Geometry for Molecular Models
• The search program ConQuest allows one to retrieve all molecular fragments specified by
drawing chemical diagrams. The chemical environment of the fragments can be specified very
precisely using a variety of attributes such as number of hydrogens per atom, cyclicity of bonds,
etc. The geometry of these fragments may be saved as a list of geometric parameters defined by
the user, and displayed as histograms and scattergrams by the program Vista.
• DASH provides a direct link to Mogul, a molecular geometry database which forms part of the
CSD System and is available from the CCDC. Searches for molecular fragments, bond lengths,
bond angles and torsion angles can be performed quickly and easily.
14.6.2 F.2 Checking of Best Solutions against CSD Packing Motif
• The ConQuest program is also able to search for intermolecular interactions, and store
parameters in the same way as for intramolecular geometry, for examination by Vista, a
statistical analysis package. Examples of such useful information are H-bonds and chloride ion
interaction with charged nitrogen. The packing motifs of the retrieved structures can be
examined using the visualiser Mercury or Pluto. These programs are particularly useful for easy
exploration of H-bonding motifs.
• The IsoStar library of intermolecular interactions is also provided with the CSD system. This is
an extensive library of scattergrams of the intermolecular crystal environment of a set of wellknown chemical groups. Each group (termed the central group) has a set of pre-processed
182
DASH User Guide
scattergrams of interacting groups in the CSD, taking account of symmetry to produce an overall
picture. These scattergrams can be easily inspected using the Rasmol visualiser provided.
An IsoStar example is shown here of a central charged amine group, NH3+, approached by a chloride
ion, Cl-.
In the IsoStar contour view option, the scatterplot has been contoured to show the preferred positions
of the chloride at about 3.0 Å from the nitrogen.
14.7 Appendix G: Z-matrix format
Example molecule, Z-4-methoxybenzaldoxime, CSD reference code AANHOX:
There are two variable torsion angles about bonds C2-O16 and C1-C11.
DASH User Guide
183
184
DASH User Guide
EXAMPLE MOL2 file
#
#
#
File Created by: PC Spartan Pro Export
@<TRIPOS>MOLECULE
C:\motherwell\samoxime.mo2
20 20
SMALL
NO_CHARGES
@<TRIPOS>ATOM
1
C1
2
C2
3
C3
4
C4
5
C5
6
C6
7
H7
8
H8
9
H9
10
H10
11
C11
12
H12
13
N13
14
O14
15
H15
16
O16
17
C17
DASH User Guide
0.293217313
-0.008979730
0.488999937
-0.080645376
-0.223538726
0.344323476
0.737253557
-0.252034022
-0.504578299
0.508767609
0.389641286
-0.290524363
1.166972637
2.081028705
2.599746303
-0.183225243
0.050187143
0.250035865
0.027063995
-0.978777859
1.364432686
1.250142376
-1.088558606
-1.865934089
2.327749313
2.121804863
-2.061069866
0.420855758
1.180800541
-0.174090243
-1.042636861
-1.348446047
0.055644157
-1.157264365
1.069792204
3.852291799
1.703096616
1.825562143
3.211062816
3.092210833
1.127281963
1.352239204
3.797847048
3.544242324
-0.395989867
-0.819438688
-1.259879230
-0.672914357
-1.440188292
5.208123004
5.913234641
C.ar
C.ar
C.ar
C.ar
C.ar
C.ar
H
H
H
H
C.2
H
N.2
O.3
H
O.3
C.3
1
1
1
1
1
1
1
1
1
1
1
1
1
1
1
1
1
Molecule001
Molecule001
Molecule001
Molecule001
Molecule001
Molecule001
Molecule001
Molecule001
Molecule001
Molecule001
Molecule001
Molecule001
Molecule001
Molecule001
Molecule001
Molecule001
Molecule001
185
18
19
20
H18
H19
H20
@<TRIPOS>BOND
1
1
2
4
3
2
4
2
5
3
6
1
7
5
8
6
9
3
10
4
11
11
12
1
13
11
14
14
15
13
16
2
17
17
18
17
19
17
20
16
1.085947683
-0.655864517
-0.114861688
4
5
5
6
6
3
9
10
7
8
12
11
13
15
14
16
18
19
20
17
-1.491802143
-1.935183860
-0.961941388
5.793237167
5.604477331
6.977167021
H
H
H
1
1
1
Molecule001
Molecule001
Molecule001
ar
ar
ar
ar
ar
ar
1
1
1
1
1
1
2
1
1
1
1
1
1
1
Z-Matrix file created by DASH from the input MOL2 file
Zmatrix generated by Mercury
1.0 1.0 1.0 90.0 90.0 90.0
20
0
C
0.0000000 0
0.0000000
C
1.3962050 0
0.0000000
C
1.4009359 0 120.2814856
H
1.0863878 0 120.6861954
C
1.3974412 0 119.6071742
C
1.4788489 0 122.8266674
C
1.3954068 0 120.2386237
H
1.0849666 0 117.8853515
C
1.3975310 0 119.8880618
H
1.0869166 0 120.8934394
H
1.1042872 0 114.7967855
N
1.3055687 0 129.9435928
O
1.3672807 0 126.0945149
H
1.0877015 0 119.7165368
O
1.3908269 0 113.3670309
C
1.4222555 0 116.9284636
H
0.9753443 0 102.3173121
H
1.0950410 0 111.1884452
H
1.0949880 0 111.1155213
H
1.0942323 0 107.7617586
0
0.0000000
0
0.0000000
0
0.0000000
0 178.8814973
0
-1.5745262
0 -176.4571818
0
0.6027188
0 179.6006996
0
1.5806770
0 179.2769860
0 146.8411988
0 178.8979722
0 179.9304618
0 179.3664126
0
-3.8330576
0
1.6874795
0 -176.8034053
0
61.2946259
0 -124.4607417
0 117.7913565
0
0
0
0
0
0
0
0
0
0
1
0
0
0
0
1
0
0
0
0
0
1
1
1
2
2
3
3
5
5
6
6
7
9
12
13
15
16
16
16
0
0
2
2
1
1
1
1
2
2
2
2
3
5
6
7
12
13
13
13
0
0
0
3
3
5
2
7
1
9
1
11
1
2
2
3
6
7
18
18
3.0
3.0
3.0
6.0
3.0
3.0
3.0
6.0
3.0
6.0
6.0
3.0
3.0
6.0
3.0
3.0
6.0
6.0
6.0
6.0
1.0
1.0
1.0
1.0
1.0
1.0
1.0
1.0
1.0
1.0
1.0
1.0
1.0
1.0
1.0
1.0
1.0
1.0
1.0
1.0
3
1
6
7
4
11
2
10
5
8
12
13
16
9
14
17
15
18
19
20
C3
C1 C3
C6 C3 C1
H7 C3 C1 C6
C4 C1 C3 C6
C11 C1 C3 C4
C2 C6 C3 C1
H10 C6 C3 C2
C5 C4 C1 C3
H8 C4 C1 C5
H12 C11 C1 C3
N13 C11 C1 H12
O16 C2 C6 C3
H9 C5 C4 C1
O14 N13 C11 C1
C17 O16 C2 C6
H15 O14 N13 C11
H18 C17 O16 C2
H19 C17 O16 H18
H20 C17 O16 H18
The Z-Matrix format is commonly used in molecular modelling (see Appendix H: References, page
189). In this format we describe the molecular co-ordinates in terms of internal co-ordinates, namely
the bond-lengths, bond-angles, and torsion angles. The molecule is assembled by building up the
molecule atom-by-atom, and placing each atom at a given bond-length, bond angle and torsion angle
with reference to the earlier atoms. Each atom-line effectively gives the “instructions” for adding
another atom to the molecule. The atoms in this Z-matrix file are referred to by their sequence
186
DASH User Guide
numbers, I, J, K, L in this list. In the example above there are 20 atoms, which is specified as the first
item on line 2 of the file, NAT. (Note that the atoms are presented in a different order from the input
Cartesian co-ordinate file in mol2 or pdb format).
Line 1 Title line
Line 2 Is ignored
Line 3 NAT = the number of atoms following in the atom-list
IAT = the atom number to use as origin for DASH rotation parameters
= 0 is taken as using centre of mass as origin
Line 4 Atom-lines. These atoms are given sequence number I = 1 to NAT
Item 1 EL Element type
Item 2 BL Bond length in Angstroms to connect this atom to atom J (item 8 on line)
Item 3 FB Flag to signal fixed (=0) or variable (=1)
Item 4 BA Bond angle in degrees for angle I-J-K, where K is item 9 on line
Item 5 FA Flag to signal bond angle fixed/variable
Item 6 BT Torsion angle I-J-K-L, where atom L is item 10 on line
Item 7 FT Flag to signal torsion angle fixed/variable
Item 8 J atom number for bond I-J
Item 9 K atom number for angle I-J-K
Item 10 L atom number for torsion angle I-J-K-L
Item 11 Temperature factor to be used in DASH structure factor calculation
Item 12 Occupancy factor of atom, in range 0.0 to 1.0
Item 13 Original number
Item 14 Label of atom I in input Cartesian file
Item 15 Label of atom J in input Cartesian file
Item 16 Label of atom K in input Cartesian file
Item 17 Label of atom L in input Cartesian file
Notes:
• The flags FT for torsion angles are set as fixed or variable by the Z-Matrix generation program,
using the chemical knowledge of the bond type and hybridisation state. It is possible to over-ride
these settings, by locating the torsion angle with the help of the input atom labels e.g. O14-C11N13-C1. There may be a case where one wishes to make this a variable torsion angle, although
described as a double bond, by setting FT=1 and thus effectively allowing exploration of cisand trans-isomers in the search.
• Only those torsion angles flagged with FT=1 are displayed as parameters in the Simulated
annealing parameter setup window (see Section 10.3.6, page 109).
DASH User Guide
187
14.8 Appendix H: References
Original authors of the DASH program, before CCDC took over onward development and
distribution of the program:
David, W. I. F, Shankland, K.
Background estimation using a robust Bayesian Analysis
David, W.I.F.D. & Sivia, D.S. (2001). J. Appl. Cryst., 34, 318-324
Correlated integrated intensities (GA based search):
Shankland, K., David, W.I.F. and Csoka, T. (1997) Z Kristallogr., 212, 550-552
Correlated integrated intensities (SA based search i.e. DASH):
David , W. I. F, Shankland, K. and Shankland N. (1998) J. Chem. Soc. Chem.Commun., 931-932.
Extinction Symbol Program:
Markvardsen, A.J., David, W.I.F., Johnson, J.C., Shankland, K. (2001) Acta Cryst., A57, 47-54
Large pharmaceutical molecule structure solution (telmisartan, two polymorphs):
Dinnebier, R.E., Wagner, M., Peters, F., Shankland, K. and David, W.I.F. (2000) Z. Anorganische Und
Allgemeine Chemie, 626, 1400-1405
Mercury: visualisation and analysis of crystal structures:
Macrae, C.F., Edgington, P.R., McCabe, P., Pidcock, E., Shields, G.P., Taylor, R., Towler, M., van de
Streek, J. (2006) J. Appl. Cryst., 39, 453-457.
Mercury 2.0 - New features for the visualisation and investigation of crystal structures:
Macrae, C.F., Bruno, I.J., Chisholm, J.A., Edgington, P.R., McCabe, P., Pidcock, E., RodriguezMonge, L., Taylor, R., van de Streek, J., Wood, P.A. (2008) J. Appl. Cryst., (in press).
Pawley Refinement:
Pawley, G. S. (1981) J. Appl. Cryst., 14, 357
Retrieval of Crystallographically-Derived Molecular Geometry Information
Bruno, I.J., Cole, J.C., Kessler, M., Luo, J., Motherwell, W.D.S., Purkis, L.H., Smith, B.R.,Taylor, R.,
Cooper, R.I., Harris, S.E., Orpen, A.G. (2004) J. Chem. Inf. Comput. Sci., 44, 2133-2144.
Rotation of molecules (Quaternions):
Leach, A.R., Molecular Modelling: Principles and Applications (1996), Longman, Harlow (ISBN
0582239338), 382-385
188
DASH User Guide
Simulated Annealing:
Press, W.H., Flannery, B.P., Teukolsky, S.A. and Vetterling, W.T. Numerical Recipes (1986)
Cambridge University Press, Cambridge (ISBN 0521308119), 274-277 & 326-331
Simplex Method of Optimisation:
Press, W.H., Flannery, B.P., Teukolsky, S.A. and Vetterling, W.T. Numerical Recipes (1986)
Cambridge University Press, Cambridge (ISBN 0521308119), 289-293.
Two molecules in the Asymmetric Unit:
Bell, A.M.T., Smith, J.N.B., Attfield, J.P., Rawson, J.M., Shankland, K. and David, W.I.F. (1999) New
Journal Of Chemistry, 23, 565-567
Z-matrix:
Leach, A.R., Molecular Modelling: Principles and Applications (1996), Longman (ISBN
0582239338), 1-3
DASH User Guide
189
190
DASH User Guide
15 TUTORIALS
15.1 Tutorial 1 - Step by Step Structure Solution of Hydrochlorothiazide
15.1.1 Introduction
The object of this tutorial is to guide you through the process of structure solution, using the molecule
hydrochlorothiazide as an example. Tutorial 1 goes through the process in considerable detail;
subsequent tutorial examples will be more concise, but will introduce other, new aspects of the
structure solution process. This tutorial will take a novice user about 2 hours to complete and
experienced powder crystallographers considerably less time.
15.1.2 Data
The data set Tutorial_1.xye is a synchrotron X-ray diffraction data set collected at 20 K on Beamline
X7A of the Brookhaven National Synchrotron Light Source. The incident wavelength was 1.1294 Å
and the sample was held in a 0.7 mm glass capillary.
15.1.3 Stage 1: Reading the data
Open DASH by double clicking on the DASH icon.
The DASH Wizard will guide you through the structure solution process, which is performed in a
series of steps.
• Select View data / determine peak positions and click Next >.
• Click the Browse... button.
• Select the file Tutorial_1.xye (from, e.g. C:\Program Files\CCDC\DASH
3.1\Documentation\Tutorial1\Data files) and click Open. The diffraction data will be loaded into
DASH. Click Next >.
• Check that the wavelength and radiation source have been set correctly and click Next >.
DASH User Guide
191
• Truncate the data to a resolution of 1.75Å and click Next >.
• The default window size setting of 100 should be good enough for this simple background. Click
Next >.
15.1.4 Stage 2: Examining the Data
This section of the tutorial is purely descriptive so if you are familiar with handling powder
diffraction data, skip to Stage 3.
The data spans 5 to 44° 2θ. If you open the file Tutorial_1.xye in an ASCII text editor such as
Wordpad you’ll see that the wavelength of 1.1294 is given on the first line.
The data consists of three columns.
1.1294
5.000 81.96 10.952
5.004 71.25 10.284
...
<bulk of data omitted for clarity>
...
43.996 69.55 3.572
44.000 68.28 3.540
192
DASH User Guide
Column 1 = 2θ position
Column 2 = diffracted intensity (counts)
Column 3 = estimated standard deviation of the intensity
If you zoom in on the diffracted data as it is displayed in DASH, you will see that DASH displays
both the intensity and the error bars. The simplest way to zoom is to use the left mouse button. Click
and hold the left mouse button and drag out a rectangle around the area that you want to zoom in on.
To zoom out, simply press the Home key on the keyboard (Note that there are other ways to zoom in
on the data - see the DASH User Guide for details). Try zooming in on the two peaks that lie just
either side of 10° 2θ.
You can use the left and right cursor keys to move up and down the data in 2θ. Some other useful
keyboard shortcuts whilst examining data are:
Shift -↑
Shift -↓
Ctrl - ↑
: Zoom in
: Zoom out
: Rescale the y-axis to the maximum in the current range
Whilst browsing the data, note the following features:
• The peak asymmetry (elongated tails to the left hand side of the peaks) in the low angle peaks,
due to axial divergence.
• The flat background indicative of a lack of amorphous content.
• The sharp peaks, indicating a good crystalline sample.
DASH User Guide
193
• The excellent instrumental resolution. See, for example, the doublet of peaks around 12.17° 2θ.
• The use of a small step size commensurate with the instrumental resolution and the narrow
peaks, i.e. plenty of points across each peak.
• The fall off in diffracted intensity with increasing angle due to the Lorentz effect and thermal
effects.
• The increasing number of peaks per unit angle with increasing angle.
• The excellent signal to noise ratio, even at the maximum diffraction angle, i.e. peaks can still be
clearly discriminated from background.
15.1.5 Stage 3. Fitting the Peaks to Determine the Exact Peak Positions
We need accurate estimates of the 2θ positions of the first 20 or so peaks in the diffraction pattern in
order to index the diffraction data, i.e. determine the unit cell and hence the Laue class of the crystal.
DASH makes this process quick and easy by fitting entire peaks accurately. It is important to
emphasise that we are only interested in peak positions, not peak intensities, at this stage, so weak
peaks are every bit as important in indexing as strong ones. The first peak in the diffraction pattern is
at just under 7°. To fit this peak:
• Zoom in to the area around the peak.
• Sweep out an area using the right mouse button i.e. move to about 6.85° 2θ, click the right-hand
mouse button and hold down as you sweep right to about 7.05° before releasing the right button.
The hatched area now covers the peak and enough background either side to allow an accurate
estimate of the peak parameters. If you are not happy with the area swept out (e.g. if your finger
slipped as you were sweeping), simply put the cursor inside the hatched area and press the Delete
key on the keyboard to remove the current selected area, then try again.
194
DASH User Guide
• With the cursor in the hatched area, press the Return or Enter key to fit the peak.
• The solid green line indicates the fit to the data, whilst the vertical blue line indicates the peak
position. Selecting Peak Positions from the View menu shows the exact peak position:
DASH User Guide
195
• Do not worry if you do not have the exact same position, however it should be very close to this
value.
• Fit the next two peaks at around 9.5 and 10.3° 2θ in the same way.
• Zoom in on the doublet at 12.17° 2θ. It is clear from the shape of the peak that there are two
contributing reflections here.
• Sweep out an area covering the two peaks using the right mouse button.
• Now, you need to give two initial estimates for the peak position. This is easily done by moving
the cursor close to the top of the first peak, and pressing 1 on the keyboard to insert the first
estimate, then moving to the top of the second peak and pressing 2 to insert the second estimate.
196
DASH User Guide
• Then, with the cursor inside the hatched area, press Return or Enter as before to fit the two
peaks. Note that the peak positions are refined from your initial estimates, in order to give the
best fit to the data.
• Now, you simply repeat this until we have 20 accurate peak positions. Listed below are 2θ
ranges and the number of peaks contained in them as a guide.
DASH User Guide
197
Region / ° 2θ
Peaks in region
Cumulative peaks
below 13.5
5
5
13.5 to 14.6
3
8
14.6 to 16.4
4
12
16.4 to 17.5
1
13
17.5 to 18.5
2
15
18.5 to 20
4
19
20 to 20.9
3
22
20.9 to 21.3
2
24
• Here are the first 24 peak positions as returned by DASH, viewed by selecting Peak Positions
from the View menu:
6.9822
9.4942
10.3453
12.1847
12.2228
13.6925
13.7905
14.0003
15.2696
15.6883
15.7753
15.9581
16.8146
17.7552
18.0107
19.0501
19.1452
19.3479
19.7249
20.5468
20.6314
20.7735
21.0639
21.1688
• The only peak you might have struggled to see was the one at ~17.75° 2θ, as it is very weak.
198
DASH User Guide
15.1.6 Stage 4. Indexing
• Having selected 20 or so peaks we now want to index the pattern. There are an number of
options at this point, you can choose to index the pattern using the installed version of DICVOL,
use an external program (McMaille or DICVOL04) or enter known unit cell parameters. Index
pattern is already selected so click Next > to index using the internal version of DICVOL.
• Ensure that all crystal systems except Triclinic are selected.
• Select Run > to run the DICVOL indexing program (See the lists of available software for
powder indexing at http://www.ccp14.ac.uk/solution/indexing/).
For other Indexing Programs you can easily get the peak positions out of DASH and into a file by:
• Selecting Peak Positions from the View menu and then clicking on the word Position at the top of
the column containing the peak positions. This selects the entire column.
• Use Ctrl+C to copy the entire column to the clipboard.
• Inside an appropriate editor, such as Notepad or Wordpad, use Ctrl+V to paste the column into a
file.
• Save the line positions into a file with the correct format for your favourite autoindexing
program.
Your indexing program should return a monoclinic unit cell of volume ~576 Å3.
A typical run of DICVOL, if the selected peaks were very close to those given in the previous stage,
DASH User Guide
199
returns a monoclinic cell, with:
a = 9.9388 Å, b = 8.49954 Å, c = 7.31875 Å, b = 111.19°, V = 576.453 Å3
Figures of merit: M(24) = 131, F(24) = 446
With figures of merit as good as these, there is little doubt that the cell has been correctly indexed. It
is possible to change this cell into one with a conventional setting, but for the moment, we will
proceed with the cell as it is returned by DICVOL.
15.1.7 Stage 5. Stop and Think
Does the cell make sense? There is a very approximate method of estimating molecular volume using
15 Å3 per C, N, O atom, 25 Å3 for Cl, S, and 5 Å3 per hydrogen atom. So for this molecule
C7H4N3O2S2Cl we estimate the molecular volume to be 275 Å3, so 2 molecules per cell would need
a volume approximately 550 Å3. The DICVOL cell volume of 576 Å3 suggests that we have two
molecules per cell, and given that the cell is monoclinic, a likely space group is P21, since Z = 2 for
this space group.
15.1.8 Stage 6. Checking the Cell and Determining the Space Group
• Select the top solution from the Results from DICVOL window and import this into DASH by
selecting the button next to it in the Import column. If only one solution is obtained it will be
imported automatically into DASH.
• Click Next >.
You will see the data displayed as before, but this time, there are a series of tick marks at the top of the
plot to indicate where the Bragg reflections corresponding to the input cell occur.
• The first thing to do is to ensure that in general, the tick marks correspond to peaks within the
pattern.
• Any unaccounted for diffraction peaks are a warning that the determined unit cell might not be
correct, or that there is an impurity phase present.
• A quick glance at the Tutorial_1.xye pattern shows no unaccounted for peaks, but a few excess
tick marks. For example:
200
DASH User Guide
• The tick at just over 7.5° 2θ does not appear to correspond to anything other than background
intensity, which means that it probably corresponds to a systematic absence for the true space
group of the crystal.
• The tick at just over 9.5° 2θ may be another absence, although there is just a hint of a shoulder
present on the stronger peak.
• We already guessed that a likely space group is P21, so let us see if increasing the symmetry
from P2 to P21 eliminates likely absences whilst leaving no unaccounted for peaks.
• In the Unit Cell Parameters window select P21 from the Space Group pull down menu:
DASH User Guide
201
• Using the down arrow cursor key, move down the list, and watch the tick marks update to show
the reflection positions corresponding to the currently selected space group. Alternatively, you
can use the mouse to scroll down and select individual space groups.
• It’s pretty obvious that choices such as P 1 c 1 eliminate major peaks and clearly cannot be
correct.
202
DASH User Guide
Tick-marks with space group P 1 c 1:
• Alternatively, P 1 21 1 eliminates the tick at 7.5° 2θ whilst leaving one at just over 9.5.
Tick-marks with space group P 1 21 1:
DASH User Guide
203
• Examining the rest of the pattern, the correspondence between tick marks and peaks is excellent
and we can conclude that the peak at just over 9.5° 2θ is a very weak diffraction feature of a
crystal whose space group is P21, b axis unique.
• Click Apply in order to select the space group P21.
• Click Next >.
15.1.9 Stage 7. Extracting Intensities
Initially this is much like the indexing phase. We are aiming to model the entire diffraction pattern
and so we need to be able to fit peaks. We are confident that we have a reasonably accurate cell and
the correct space group. The criteria for peak fitting are slightly different from the ones used in
indexing and we need to:
• Fit a number of, preferably, isolated reflections.
• Sample peaks across the pattern in order to parameterise the peak shape across the pattern.
• Ensure that any peak asymmetry is modelled at the start of the pattern.
From the Pawley Refinement Step 1: Peak Picking window select Clear Peaks. Some suitable peaks
for this pattern are given below. Fit them by sweeping out areas over the peaks with the right mouse
button as before in the order they are given.
Peak
Approx. Location
1
6.97
2
9.49
3
14.0
4
16.8
5
20.78
6
22.75
7
27.8
8
31.85
Note
1Option
to Pawley refine
2L/parameter
3Pawley
refine starts
window appears
1) After three peaks have been fitted, you are given the chance to go to profile refinement directly by
pressing the following icon:
204
DASH User Guide
or choosing Pawley Refinement from the Mode menu. Ignore this option for the moment.
2) After six peaks have been fitted, DASH has sufficient information to allow a lattice parameter (4
parameters + zero point) refinement. The results of the refinement can be seen by selecting Peak
Positions from View menu. This improves the lattice constants in the majority of cases and greatly
improves the starting position for the Pawley refinement.
3) After eight peaks have been fitted, DASH has determined that the peak shape has been sufficiently
well defined to allow a full Pawley refinement to be performed. The Pawley Refinement Step 2
window will pop up automatically.
• In the initial Pawley refinement, only the terms describing the background and the terms
corresponding to individual reflection intensities are refined, using the previously refined unit
cell and zero-point.
• Select Refine; 3 cycles of least squares are performed.
• This should return figures similar to the ones below (or better).
204 reflections 9751 points Rwp = 22.25 R(exp) = 9.38 χ 2 = 5.6
• Click Accept to accept the results of this refinement, the fit is then displayed.
• Now click in the main window and press Home to see how well the data are fitted. The (obs
minus calc) plot is shown in pink and emphasises any misfit in the data. If you look closely at the
data, you are likely to see something like this:
DASH User Guide
205
The fit is very good, but the tell-tale sinusoidal misfit indicates that the unit cell and zero point are in
need of some further refinement.
• Going back to the Pawley window, note that the program has anticipated this and has flagged the
unit cell and zero-point for refinement.
• Select Refine to perform a Pawley refinement for 5 cycles, in which the background, intensities,
unit cell and zero point are all refined. The fit should improve to, for example:
204 reflections 9751 points Rwp = 16.2 R(exp) = 9.38 χ 2 = 3.0
• The figures of merit have improved, select Accept to see the improvement in the fit.
206
DASH User Guide
• Examine the whole profile. If you have achieved a χ 2 of around 3, the fit to the data will be
excellent. Click Save as to save the refinement results to disk as a DASH Pawley-Fit File (.sdi)
called Tutorial_1.sdi.
15.1.10 Stage 8. Revisiting Space Group Determination
Now that Pawley fitting and refinement has been introduced it is an appropriate point to try an
alternative way of determining the space group.
• Select < Back in the Pawley Refinement Step 2 window to return to the Unit Cell Parameters
window. This time, select Space Group>.
DASH User Guide
207
• In order to furnish the space group determination program with a required set of reflections and
intensities, a Pawley fit to the profile has to be obtained in the most general space group of the
crystal system under study. On pressing Space Group> DASH automatically selects the correct
space group.
• Select Clear Peaks from the Pawley Refinement Step 1: Peak Picking window and proceed
through the Pawley fitting process as before. Once a good Pawley fit to the data has been
achieved, press Run> to launch the space group determination program.
• The console window of Extinction Symbol will appear and once the calculations have finished,
press Enter on the keyboard to view the results. The space group P21 should be the most
probable space group found for the data and hence will be listed first with the highest probability
in the right hand column of the results table:
208
DASH User Guide
• Close the window showing the results and press <Back in the Pawley Refinement Step 2 window.
A dialogue box will pop-up asking whether the files generated during space group determination
should be removed: select Yes. Now from the Space Group pull down menu select the space
group determined to be the most probable (P21) and press Apply. Check the correspondence
between the tick-marks and the peak positions as before.
• The correct space group has been chosen and hence a Pawley refinement should be performed in
this space group. This step has already been performed previously and the .sdi file saved.
Hence the structure solution process can begin.
• You can exit DASH at this point, if you wish, by selecting Exit from the File menu.
15.1.11 Stage 9. Molecule Construction
The crystal structure of the molecule that we are trying to solve is given below:
DASH User Guide
209
• You need to construct a 3D molecular description of the above molecule using your favourite
modelling software and save it in pdb, mol or mol2 format.
• If you do not have a modelling package to hand, there is a model file named Tutorial_1.mol2
provided with the tutorial, taking the co-ordinates from the Cambridge Structural Database
reference code HCSBTZ. If you are using this model rather than creating your own you can now
skip to Stage 10.
• For the purposes of the tutorial, we’ll assume that the molecule was sketched (as indeed it was)
using the freely available ISIS/Draw sketching package.
• Furthermore, we will assume the 2D to 3D conversion will be performed using the widely
available WebLabViewer.
• Once the molecule is sketched within ISIS/Draw, select the whole molecule and copy it to the
clipboard using Ctrl+C.
• Within WebLabViewer, ensure that the following Import options (accessed from the View
menu) are enabled.
210
DASH User Guide
• Paste the 2D model into WebLabViewer using Ctrl+V.
• After pasting the molecule into WebLabViewer, the 2D chemical sketch is converted into a 3D
molecular model (in ball & stick display mode):
DASH User Guide
211
• Save the molecule coordinates in mol format as Tutorial_1.mol.
15.1.12 Stage 10. Setting up the Structure Solution Run
• Start DASH as before and select Simulated annealing structure solution from the Wizard. Click
Next >.
• Browse for the DASH project file that you saved at the end of Stage 7 and load the file that you
saved, e.g. Tutorial_1.sdi.
• Click on the
icon and read in the Tutorial_1.mol file, or the Tutorial_1.mol2 file.
• DASH will generate the internal format (Z-matrix) that it uses to describe the molecular
conformation.
• DASH analyses the molecule and automatically selects rotatable torsions. In this case, the bond
connecting the benzene ring to the SO2NH2 group is the only rotatable torsion in the molecule.
• Read in the newly created Z-matrix by clicking on the
window and selecting the file Tutorial_1.zmatrix.
212
icon in the Molecular Z-Matrices
DASH User Guide
• Note that DASH has determined that there are 7 independent degrees of freedom to be
determined if the crystal structure is to be solved i.e. 3 positional coordinates for the centre of
mass of the molecule, 3 parameters describing the orientation of the molecule within the unit
cell, and 1 internal torsion angle describing the molecular conformation.
• DASH now has the information it needs concerning the molecule, so click Next >.
The following menu allows you to fix or bound parameters. In this particular example, we are
allowed to fix the y coordinate of the centre of mass of the molecule at any position, as P21 is a polar
space group.
• Do this by clicking on F (short for fix) in the line corresponding to the y coordinate of the
molecular fragment (y(frag1)):
• Click Next >.
The resulting Simulated Annealing Protocol window that appears need not concern us here. In most
cases, the default values will suffice. See the DASH User Guide for more details. Click Nex t >.
The next window asks you to choose some options for the Simulated Annealing procedure. It is useful
at this stage to go over some of the details.
DASH User Guide
213
• Hydrogens: as the scattering power of hydrogens is low, hydrogens are ignored by default to
speed up the calculations. The Absorb option absorbs the electrons from the hydrogen in their
riding atoms. For single crystal data, the hydrogen atoms can be taken into account explicitly
during the SA.
Note:
By default hydrogens are always included during the local minimisation at the end of each
simulated annealing run.
During Rietveld refinement, hydrogen atoms are always included.
• Use crystallographic centre of mass: when selected each atom is assigned a weight of Z-2 when
the molecular centre of rotation is calculated, where Z is its number of electrons. Otherwise, no
weights are applied.
• Auto local minimise: when selected, the χ 2 of each final solution is minimised using a simplex
algorithm before the solution is written out. If Use hydrogens under Auto local minimise is
selected, hydrogens are included in the local minimisations of the final solutions.
• Auto align: when selected the molecules of the final solution are aligned before the solution is
written out. This only applies when more than one run has been selected.
• Output .pdb: when selected the crystal structure of the final solution is written out in pdb format.
• Output .cssr: when selected the crystal structure of the final solution is written out in cssr format.
• Output .ccl: when selected the crystal structure of the final solution is written out in ccl format.
• Output .pro: when selected a file with the extension. .pro is written out which contains 2θ, the
observed profile, the calculated profile for the best solution and the original esds. The file is
written out in ASCII format and can be imported into a spreadsheet package such as Excel.
• Output .cif: when selected the crystal structure of the final solution is written out in cif format.
214
DASH User Guide
• Output .res: when selected the crystal structure of the final solution is written out in res format.
• Output chi-squared vs. moves: when selected a graph of the profile χ 2 versus moves is written
out to a file in ASCII format with the extension .chi, at the end of the simulated annealing,
This can be imported into a spreadsheet package such as Excel.
Note that when more than 1 simulated annealing run is requested, the above options pertain to every
run. This can generate quite a number of files. Each option (except Use hydrogens) can be switched
on and off while the simulated annealing is running.
• Click Solve >.
• The simulated annealing run now starts.
15.1.13 Stage 11. Monitoring Structure Solution Progress
Full details of all the output from the structure solution run are given in the DASH User Guide. For
this tutorial, you need only watch:
• The Profile χ 2.
• The (obs - calc) plot i.e. the difference plot, shown by default in pink.
The profile χ 2 is on the same scale as the Pawley fit profile χ 2 that you obtained when fitting the data
in Stage 7. So if the current profile χ 2 is close to the value of the Pawley profile χ 2, you’ve probably
solved the structure.
DASH runs the SA process until the user intervenes by pressing one of the following buttons on the
SA output panel:
• Pause - Pauses the SA run until you hit OK. This can be useful to free up the processor
temporarily, as DASH is computationally intensive.
• Start next - When in a multi-run, the Start next button terminates the current run and starts the
next one.
• Stop - Stops the simulated annealing run immediately and returns you to the first Simulated
Annealing Protocol window.
• Click Edit to end a simulated annealing run and change parameters.
• Local minimisation - Invokes a simplex optimisation that takes the structure to the deepest
minimum in the vicinity of the current best structure.
• Click View to visualise the crystal structure of the best solution obtained so far for the current
run.
DASH User Guide
215
• Click Solutions to analyse the solutions found so far.
On a modestly specified PC (e.g. Pentium III 300 MHz) the structure solution process should take
less than 30 seconds to reach a profile χ 2 of around 12, by which point the structure is solved to a high
degree of accuracy (this is an ideal value the actual number you get may differ from this).
The profile χ 2 is 12.05, less than four times that of the Pawley profile χ 2, i.e. solved:
Examine the difference plot:
216
DASH User Guide
• The fit is excellent, even at high angle.
• Remember also that we have effectively only refined a scale factor to get to this point and the
structure is clearly solved.
• Click View to see the solution in the 3D-visualiser.
15.1.14 Stage 12. Examining the Output Structure
DASH can output 5 coordinate file formats describing the final answer output from simulated
annealing (see the Configuration... window). Here, we assume that the project filename was
Tutorial_1.sdi.
• Tutorial_1.pdb: protein data bank format file containing a Cartesian coordinate description of
the SA solution.
• Tutorial_1.cssr: Cambridge Structure Search and Retrieval format file containing a fractional
coordinate description of the SA solution.
• Tutorial_1.ccl: Cambridge Crystallographic Subroutine Library format file containing a
fractional co-ordinate description of the SA solution.
• Tutorial_1.cif: Crystal Information File format file containing a fractional coordinate description
of the SA solution.
• Tutorial_1.res: SHELX format file containing a fractional coordinate description of the SA
solution.
DASH User Guide
217
The Mercury visualiser supplied with DASH has options to display Packing and H-bonds. Using
these options your answer should look like that given below. You can see that all donors and
acceptors are satisfied:
Remember that the exact location of your molecule along b depends upon where you anchored the
molecule. In the above picture, the molecule was fixed at y = 0.5. The solution obtained is in excellent
agreement with that reported for hydrochlorothiazide at room temperature by Dupont & Dideberg
(1972).
15.1.15 Stage 13. Rietveld Refinement
• There are several options for Rietveld refinement in DASH including interfaces to external
refinement packages and a built-in module for refinement. For the purposes of this example, to
refine the structure in a meaningful manner we will use the built-in rigid-body Rietveld
refinement module (see Section 11.1 of the DASH User Guide). This implementation uses the
extracted intensities with their correlation matrix from the Pawley refinement stage, and is thus
limited to the resolution chosen in 2θ in Stage 1. Up to now the default setting in DASH has
been used which truncated the data to 2θ of 37.65, corresponding to a resolution of 1.75Å.
• Examination of the Pawley refinement carried out in Stage 7 will show the actual number of
218
DASH User Guide
extracted intensities e.g. 135. The Pawley refinement result values may be examined using the
View menu, and then selecting Pawley / SA. The low resolution of the data means that we cannot
expect to refine coordinates of this molecule in an unconstrained manner and obtain physically
reasonable values. The information is just not there!
• However, it is meaningful to fit the molecule as a sequence of rigid-body fragments, which is the
meaning of the Z-matrix description. The Z-matrix consists of instructions for constructing the
molecule atom-by-atom, each atom in this case being added according to the values given for a
bond-length to a preceding atom, a bond-angle to two preceding atoms, and finally a torsion
angle to three preceding atoms.
• In Stage 10 you ran a program which converted the Cartesian model of Stage 9 into a Z-matrix.
The program further identified, by examination of the chemical atom types, that only one torsion
angle should be treated as variable, namely N3:S1:C5:C6. The SA run explored the search space
with all other parameters of the Z-matrix fixed, which we have seen this gives a chemically
sensible result in our solution. The Rietveld refinement allows variation of any of the Z-matrix
parameters, for the chosen solution.
• The first stage of the Rietveld refinement is to keep all parameters fixed except the global
isotropic temperature factor scale. This allows the initial guess of the Biso values for each atom
in the Z-matrix to be adjusted by a global scale factor; the default values set by DASH are Biso
= 3.0 for all non-hydrogens and 6.0 for hydrogens. When the scale factor, K, is refined then the
Biso for each atom is simply K.Biso as input in the Z-matrix file.
• In single crystal X-ray refinement it is usual to set the value for Biso for hydrogens to about 1.25
times the parent heavy atom. In the case of powder data, for this size of molecule, there will be
little observable effect if we set all H-atoms to have the same value. The starting Biso hydrogen
value of 6.0 may be considered rather too large and could be adjusted to say 4.0. However the
value of Biso for non-hydrogen atoms is typical for this size of molecule at room-temperature.
• Choose the first solution in the Analyse Solutions dialogue box, click on the Rietveld then select
Rigid-body Rietveld refinement and click on Next >, this will launch the following window:
DASH User Guide
219
• You will see that the check-box for Global isotropic temperature factor is selected, click Refine.
The starting value of 1.000 with Chi-sqd 100.72 and Profile Chi-sqd 8.01 will change to
0.13902, 43.49 and 5.53 respectively. This very low value of the temperature factor scale
corresponds to the unusually low data collection temperature of 20K. Keep this temperature
factor fixed by deselecting the check box.
• Now switch on the check boxes marked V for the left hand column Translations and orientations
by clicking the Set button below this column. This specifies refinement of the translation
parameter for the molecule centre of mass, and the orientation of the molecule. In this space
group P21 the position along the y-axis is arbitrary, so switch off the y check box, and click
Refine. You will see the Chi-sqd values drop to 42.58 and 5.48, with slight change of
temperature scale to 0.13059.
• This is perhaps as far as is reasonable to refine this structure for publication. You can now output
a CIF file using the Save as... button, e.g. with filename Tut1-Rietveld-Biso, and choose output
file type .cif from the list of file formats.
• You can check that the Rietveld refinement is stable by allowing all torsion angles to vary; click
the Set button at the bottom of the Torsions column, deselect the Global isotropic temperature
factor, and clear the Translations and Orientations by using the Clear button underneath the
column. There will be very little change in the parameters with almost no reduction of the Chisqd values.
220
DASH User Guide
• As a further experiment you can also switch off refinement of the Translations and Orientations,
and Torsions by using the Clear button underneath each column, and deselect the Global
isotropic temperature factor box. Now allow all bond angles to vary. You see a small shift in
coordinates, with a small reduction in Chi-sqd to 36.82 and 5.22. You can compare this refined
structure to the starting value when you entered the Rietveld window by clicking Compare. The
Mercury display shows that there have been very small shifts in the coordinates (use the Zoomin feature). The resulting coordinates are not more significant than the previous coordinates
saved as the CIF file, but they do confirm that the refinement is stable, and you are in a local
minimum of the Chi-sqd surface.
• Similarly you could refine all the bond-lengths, and achieve a further small reduction in Chi-sqd,
but this is cannot be interpreted as an improved set of coordinates for this solution. There is
simply not enough data to justify these fine variations from the starting values of bond-lengths
and bond-angles. Another way of looking at the calculation is that you could achieve the same
low Chi-sqd values with a range of slightly different molecular models. At present you have no
information of the estimated standard deviations of the coordinates.
Note: As an experiment, that if you attempt to refine the Global isotropic temperature factor together
with a significant number of the torsions, angles or distances that the procedure takes a considerable
time to converge (e.g. 2-3 minutes), showing that the temperature factor is highly correlated with the
other parameters.
• Some insight may be obtained as to how individual parameters affect the calculated Ch-sqd by
manually setting any parameter value in the menu box and clicking on Calculate. This simply
calculates Chi-sqd at that point, e.g. changing the bond-length C2:C7 from 1.4297 to 1.4397
changes Chi-sqd by typically from 28.42 to 28.73, 4.01 to 4.03. Changing the position of a
heavier atom e.g. chlorine in Cl1:C4 generally produces a larger change to Chi-sqd for a shift of
0.01 in the bond-length.
15.1.16 Using maximum resolution
If this were a real example of refinement of an unknown structure, you would try to refine against the
maximum resolution data that the DASH intensity extraction can handle. This tutorial example so far
was carried out at a resolution of 1.75Å, using 135 extracted intensities. The current version of DASH
can use a maximum of 350 reflection intensities. In order to do this you must go back to Stage 1 and
read in the data with a higher truncation value in 2θ, e.g. 44.0 degrees corresponding to 1.507Å
resolution. This gives a Pawley fit of about 2.35 for 204 extracted reflections. When one ruins the SA
there are typically solutions with Chi-sqd about 7.04. The Rietveld refinement following the order of
refinement (a) Global Temperature Factor, (b) Translations and Rotations, gives a temperature factor
scale 0.211 and Chi-sqd 28.42, Profile Chi-sqd 4.01.
DASH User Guide
221
15.1.17 To refine from another SA solution
Close the Rietveld window with Close, this returns you to the main DASH window. Click on the
Mode pull-down menu, then select Analyse Solutions. This returns you to the list of solutions form
your last SA run. Note that if you exit completely from DASH this Analyse Solutions window is not
recoverable.
15.1.18 References
DICVOL Program:
D. Louer & M. Louer (1972) J. Appl. Crystallogr. 5, 271-275.
A. Boultif & D. Louer (1991) J. Appl. Crystallogr. 24, 987-993.
Extinction Symbol Program:
Markvardsen, A.J., David, W.I.F., Johnson, J.C., Shankland, K. (2001) Acta Cryst., A57, 47-54
Model Builder:
WebLabViewerLite Version 3.20 (12/8/98) Copyright 1998 Molecular Simulations, Inc.
Single crystal structure (CSD Refcode HCSBTZ):
L. Dupont & O. Dideberg (1972) Acta Crystallogr. B28, 2340-2347.
15.2 Tutorial 2 - Solving a Structure from a Low Resolution Data Set
15.2.1 Introduction
The aim of this tutorial is to guide you through the structure solution of chlorpropamide and it
assumes you have completed Tutorial 1. In this Tutorial you will learn how to:
• Handle structures that are more flexible than hydrochlorothiazide.
• Solve a structure from a low resolution data set.
• See one of the potential pitfalls of global optimisation i.e. local minima.
222
DASH User Guide
15.2.2 Data
The data set Tutorial_2.xye is a synchrotron X-ray diffraction data set collected on BM16 at the
European Synchrotron Radiation Facility. The incident wavelength was 0.800077 Å.
15.2.3 Stage 1: Reading the data
•
•
•
•
•
Open DASH and select the directory where the data resides.
Select View data / determine peak positions and click Next >.
Select the file Tutorial_2.xye using the Browse... button.
Click Next >.
Check that the wavelength and radiation source have been set correctly and click Next >.
15.2.4 Stage 2: Examining the data
Note that this data set was collected quickly at the end of a day’s beamtime, and so only extends to
22° 2θ. Hence the data set extends to a resolution of only ~2 Å. Truncate the data to start at 1.5° to
remove the data points affected by the beam stop and then subtract the background using the default
window value of 100 and click Next >.
15.2.5 Stage 3. Fitting the peaks to determine the exact peak positions
Select the first twenty peaks using the method described in Tutorial 1.
Here is a guide to the positions (° 2θ) of the first 20 peaks:
3.4383
6.1080
6.8792
8.5344
8.9466
9.4316
9.9800
10.1033
10.2499
10.3269
10.7041
11.1635
11.3767
11.5027
12.2579
12.3053
13.3092
13.4047
13.5143
13.5696
• Click Next >.
• Select Run> to run DICVOL or use another indexing program as described in Tutorial 1.
15.2.6 Stage 4. Indexing
Your indexing program may reveal a number of possible unit cells. The unit cell with the highest
figures of merit should be orthorhombic with a volume of ~1266 Å3. DICVOL, for example, returns
an orthorhombic cell with a = 26.66826 Å, b = 9.08435 Å, c = 5.22571 Å and volume = 1265.999 Å3
with figures of merit M(20) = 107.1 and F(20) = 506.6.
DASH User Guide
223
Closer inspection of the other unit cells that are suggested by the indexing program will reveal that
many of them are slight monoclinic distortions of the above unit cell, with almost identical volumes
and lattice parameters and beta ~90°. Other suggestions generally have much lower figures of merit
and can be ruled out immediately.
Considering that the orthorhombic unit cell has the best figures of merit, and that it is usually best to
try the simplest option first, we will proceed to the next stage assuming an orthorhombic unit cell,
with the lattice parameters given above.
15.2.7 Stage 5. Stop and Think
Does the cell make sense? In this case we estimate the molecular volume to be ~330 Å3, from the
formula C10H13N2O3SCl and approximate volumes C, N, O = 15 Å3, S, Cl = 25 Å3 and H = 5 Å3 in
the molecule. Therefore, given the unit cell volume of ~1266 Å3 we know from this very rough
approximation that the cell is most likely to accommodate 4 molecules. At this point, your knowledge
of space group frequencies should suggest that P212121 is a strong possibility. (A list of space groups
and their frequencies is given in Appendix D of the DASH User Guide.)
15.2.8 Stage 6. Checking the Cell and Determining the Space Group
The space group P222 will automatically have been selected. The presence of some excess tick marks
indicates probable systematic absences; this means that a space group of higher symmetry might be
more appropriate. Scroll through some of the possible space groups. You will see that some of the
space groups can be ruled out immediately; for example, face-centred and body-centred lattices leave
some peaks unaccounted for. Many of the primitive lattice space groups appear likely from the tick
mark positions. In this situation, where more than one possible space group exists, it is logical to
begin with the most frequently occurring space group. In this case, the most frequently occurring
orthorhombic space group is P212121, so select this (number 19), confirm visually that it matches the
data and click Next >.
15.2.9 Stage 7. Extracting Intensities
Choose 7 isolated peaks from across the pattern. Fit these peaks using the method described in
Tutorial 1 and then carry out the Pawley refinement. The initial 3 cycles of least squares refinement
only involve the terms corresponding to the background and to the individual reflection intensities,
accept these three cycles. The next 5 cycles of least squares refinement involve the terms describing
background, intensities, unit cell and zero point. These refinement details will be suggested
automatically by DASH.
When these cycles are complete check the difference line; this should be almost flat by this point. The
final Pawley χ 2 should be between 3 and 4.
224
DASH User Guide
Accept this Pawley fit and save it as Tutorial_2.sdi (Exit from DASH, if you wish, at this point in the
tutorial).
15.2.10 Stage 8. Molecule Construction
Construct a 3D molecular description of the molecule using your favourite modelling software and
save it in pdb, mol or mol2 format. This can be done, for example, by importing an ISIS/Draw sketch
into WebLabViewer (see Tutorial 1 for further details). Save this as Tutorial_2.pdb, Tutorial_2.mol
or Tutorial_2.mol2. (If you do not have a model building program to hand, there is a file supplied
with the tutorial, Tutorial_2.mol2)
15.2.11 Stage 9. Setting up the Structure Solution Run
• Start DASH as before and select Simulated annealing structure solution from the Wizard.
• Select the Tutorial_2.sdi file.
• Click on the
icon and select either Tutorial_2.pdb, Tutorial_2.mol, or Tutorial_2.mol2
(the file that you created in Stage 8); a Z-matrix file called Tutorial_2_1.zmatrix will be
generated automatically.
• Read in the Tutorial_2_1.zmatrix file and click Next >.
Note that as Z = 4 for P212121, it follows that Z’ = 1 because we know from Stage 5 that the cell is
most likely to accommodate 4 molecules. Therefore, only one Z-matrix is required.
At this point DASH will confirm that there are 12 independent parameters. These parameters are
listed when you click on Next >. There are 3 parameters describing the positional co-ordinates, 4 (of
which 3 independent) describing the molecular orientation within the unit cell and 6 variable torsion
angles. All F boxes are unticked by default, indicating that all 13 parameters are allowed to vary
during structure solution. Click Next > to proceed to the Simulated Annealing Protocol window. The
default values can be used for this example, so click Next >, then Solve > to begin the simulated
annealing.
NB: Keen chemists should resist the urge to restrict the torsional rotations pertaining to the two
bonds around the carboxyl group!
15.2.12 Stage 10. Monitoring Structure Solution Progress
The progress of the structure solution can be followed by monitoring the profile χ 2 and the difference
plot.
Once a profile χ 2 of approximately 10 - 12 or less is reached, you can be sure that a very good
structure has been found, as this value is only ~3 times the Pawley χ 2 value. Finalise the solution by
selecting the Local minimisation button and accepting the answer.
DASH User Guide
225
If your final profile χ 2 is a bit higher than 10, you are clearly close and perhaps only a single atom at
the end of the chain is slightly misplaced. Take a close look at the output structure and read the
section below.
15.2.13 Stage 11. Examining the Output Structure
View the structure using the View button in the Simulated Annealing Status window. The structure
should be chemically reasonable in terms of molecular conformation and intermolecular distances.
The potential for H-bonding is obvious.
We can examine similar structures in the Cambridge Structural Database, and observe that where
there are more acceptors, O, than donors NH, firstly the donors must be satisfied, and secondly,
bifurcation of the H-bonds is quite common. This is what we see below, using the Mercury visualiser
with Packing and H-bond switched on:
If you have time try doing several SA solution runs and compare the results. This is easy to do in
DASH, notice that in the Simulated Annealing Protocol window there is the option to start a set of
runs, each with a different seed for the random number sequence. If you identify that reasonable
termination criteria would be Max. number of moves / run = 2,000,000 and Multiplier for Pawley χ 2
as 3.5, the runs will terminate either at move number 2,000,000, or when the profile χ 2 falls below a
value of 3.5 times the χ 2 for the Pawley fit. The best solution files are stored in sequence, if you
called your run fit1 the output files are fit1_001.pdb, fit1_002.pdb, etc.
226
DASH User Guide
The accuracy of the solution can be assessed by comparing these independent solutions. An example
is given here of an output structure (red) a final profile χ 2 of only slightly higher than the lowest χ 2
solutions found in a set of runs.
In this case, it is a structure that differs only slightly from the correct structures, corresponding to a
local minimum with a profile χ 2 only slightly higher than that of the correct crystal structure. The Hbonding scheme is correct, but there are small differences in the terminal side-chain torsion angles.
15.2.14 Stage 12. Applying Modal Torsion Angle Restraints
In the following section the use of modal torsion angle ranges during the Simulated Annealing stage
is demonstrated using DASH, and also how this can be facilitated using the CSD System software
which now includes Mogul. Mogul is a molecular geometry database which forms part of the CSD
System and is available separately from the CCDC.
• Press <Back (from the Solution Summary dialogue) to return to the introductory Wizard
Window. Choose the option Simulated annealing structure solution. Reload the z-matrix file for
Tutorial 2 and then proceed to the Parameter Bounds dialogue box as before.
DASH User Guide
227
• Two methods of accessing torsion angle distributions from the CSD are provided:
Using DASH with Mogul (see page 228)
Using DASH with the CSD, ConQuest and Vista (see page 231)
Using DASH with Mogul
• If DASH has access to Mogul, the distributions of each torsion angle in the CSD will be
examined using Mogul and restricted ranges will be determined from these data will be applied.
Scroll down the parameters until the torsion angles are visible.
• The first torsion angle listed in the table is S8:N11:C12:O13. Click on the Modal button. If the
correct path to Mogul is present in the DASH Configuration window (access this from the toplevel menu by selecting select Options, then Configuration) then a histogram of the Mogul hits
for the selected torsion angle will appear. If a path to Mogul is not present in the Configuration
window, hit the Browse... button in this window and find the location of your installation of the
Mogul executable. If a standard installation of Mogul has been performed, DASH should
automatically pick up the path to Mogul from the Windows Registry:
228
DASH User Guide
• 47 hits for the torsion angle have been found by Mogul, and these can be viewed by clicking on
the View Structures tab in the Mogul window. If individual bars of the histogram are selected
(deselect all hits in histogram and then click on the histogram bars of interest) only these
structures are displayed in the View Structures window. For example, if the bars around 180o are
selected and the structures viewed then Refcodes QERXUK, TOHBUN and TOHBUN01 are
displayed.
• Returning to the histogram in the Results and analysis pane, it is clear that the torsion angle is
most often found to be around 0o with a very small percentage of structures found with torsion
angles of 180o. (It should be noted that the Mogul histogram displays all torsion angles, positive
and negative on a positive axes, i.e. 0-180o). Close the Mogul window (select File from the toplevel menu and click on Exit in the pull-down menu).
DASH User Guide
229
• The Modal Torsion Angle Ranges window of DASH will now be displayed. DASH performs a
very simple analysis of the distribution of torsion angles returned from Mogul and, if it
recognises the torsion angle distribution, will recommend a range of torsion angles to be
searched during the simulated annealing; these are displayed in the Sampling Ranges section of
the window.
• These ranges are only a recommendation and can be edited and altered. To alter the torsion angle
ranges, type the new value in the boxes labelled Lower and Upper. DASH will calculate the
other torsion angle ranges depending on whether the torsion angle has been chosen to be
bimodal or trimodal; these ranges are displayed in the grey boxes. To accept the torsion angles
displayed click on OK. To reject modal torsion angle ranges click on Non Modal. Clicking
Cancel will remove any edits made to the torsion angle ranges since OK was last clicked.
• In this case, the suggestion of torsion angle ranges of -20o to 0o and 0o to 20o is appropriate and
the ranges suggested by DASH should be accepted by clicking on OK. The Parameter Bounds
dialogue box will be displayed and the torsion angle S8:N11:C12:O13 will be displayed in red
indicating that modal torsion angle ranges have been applied.
• Next click on the Modal button for the next torsion angle, C15:N14:C12:N11. Again a histogram
generated by Mogul will appear and this time it will show a very clear distribution of torsion
angles around 180o. When the Mogul window is closed the Modal Torsion Angle Ranges
dialogue box will be shown with a recommended torsion angle distribution of Bimodal around
180 degrees. The torsion angle ranges displayed in the Sampling Ranges boxes are satisfactory
so click OK. This procedure should be repeated for all torsion angle ranges.
• For torsion angle C4:S8:N11:C12, the histogram displayed in Mogul shows a cluster of data
around 50o to 100o. Upon closing the Mogul window, DASH recommends a bimodal torsion
angle range of 45o to 135o. This range adequately covers the distribution returned by Mogul and
can be accepted by clicking OK. If you wish, the range can be narrowed by editing the Upper
bounds box.
230
DASH User Guide
• In the case of torsion angle C16:C15:N14:C12 DASH cannot process the torsion angle
distribution returned from Mogul as it does not recognise the shape of the distribution. Modal
torsion angle ranges can either be entered manually in the Sampling Ranges boxes (for example
a lower bound of 50o and an upper bound of 180o could be used) or no torsion angle ranges need
be applied. In this case, click the Non-Modal button.
• For torsion angle C3:C4:S8:N11 a bimodal distribution is recommended by DASH, 45o to 135o.
This covers the majority of the torsion angle distribution returned from Mogul. However, if this
range is accepted and OK is clicked a warning will pop-up stating that the initial value of the
torsion angle is not within the defined ranges. In this case it is acceptable to change the initial
value of the torsion angle to, for example 50o. Clicking OK now will apply the torsion angle
ranges.
• For torsion angle C17:C16:C15:N15 the histogram of Mogul shows peaks at approximately 60o
and 180o indicating a trimodal distribution. Upon closing the Mogul window DASH
recommends a trimodal distribution with ranges -150o to 150o, 30o to 90o and -30o to -90o.
These ranges are appropriate so click on OK to accept them.
• Out of the 6 torsion angles, modal ranges have been set for 5 of them. Proceed through the
simulated annealing, as before.
• A simulated annealing run with 10 starts, maximum number of moves 10 million, random seeds
315, 159 was performed with the modal torsion angle ranges recommended by DASH. Of the 10
runs, 8 had a value of profile χ 2 below 10 and the average number of moves required was 646
750. A similar run performed without modal torsion angles resulted in 7/10 solutions with a
profile χ 2 below 10 and the average number of moves required was 1, 828 450.
Using DASH with the CSD, ConQuest and Vista
• If you have access to the Cambridge Structural Database (CSD), Conquest and Vista you can
perform the following torsion angle searches for yourself. If not, results for the searches are
given. The first torsion angle listed in the Parameter Bounds dialogue box is S8:N11:C12:O13
and it has an initial value of 0.25o. Draw an appropriate fragment in Conquest and define the
torsion angle of interest. A screenshot of a query used is given below:
DASH User Guide
231
• By viewing in Vista the torsion angles returned it is clear that this torsion angle is well described
by a bimodal distribution at -160 to 160o and -20 to 20o:
232
DASH User Guide
• Return to the Parameter Bounds dialogue box in DASH, hit the Modal button in the row of the
S8:N11:C12:O13 torsion angle. The Modal Torsion Angle Ranges dialogue box will pop up and
it is here that the determined ranges can be entered:
• In the Lower box enter -20.00 and in the Upper box enter 20.00. Since the Bimodal radio button
is active (at the top of the dialogue box) the complementary bimodal range at -160.00 and
160.00o will be determined and displayed. Once you are satisfied that the correct ranges are
displayed, press OK. This will return you to the Parameter Bounds dialogue box and the row of
the S8:N11:C12:O13 torsion angle will be displayed in red, indicating that modal ranges are
active.
• Should you wish to define a trimodal torsion angle range, enter the upper and lower bounds of a
single range in the Upper and Lower boxes (for example -160o to 160o). Hitting the Trimodal
radio button will generate two further torsion angle ranges at +/- 120o from the initial range you
have specified (for example at 40 to 80o, and -40 to -80o).
• The following table details the results of searches performed in the CSD v5.24 for all the six
torsion angles of this molecule.:
Torsion Angle
Initial value (o)
Mode
Modal Ranges (o)
Number of
Observations
0.25
Bimodal
-160 to 160 and 20 to 20
97
C15:N14:C12:N11
179.72
Bimodal
-160 to 160 and 20 to 20
254
C4:S8:N11:C12
65.08
Bimodal
50 to 90 and -50
to -90
412
S8:N11:C12:O13
C16:C15:N14:C12
-179.37
Cannot define
43
C3:C4:S8:N11
27.90a
Bimodal
60 to 120 and -60
to -120
614
C17:C16:C15:N14
-178.54
Trimodal
-160 to 160,b40
to 80 and -40 to 80
71
a.
This initial value is determined from a sketched model and is reasonably far from the true angle for this
structure. If the bimodal ranges indicated are entered and Ok is pressed a dialogue box will pop up and inform
you that the initial value does not fall within the defined ranges. To proceed, change the initial value of this
torsion angle to for example, 70.00.
DASH User Guide
233
• Enter the above torsion angle ranges and start the simulated annealing process.
• In our hands a simulated annealing run started with random seeds 159 and 314 gave 10/10
solutions in an average of 1199250 moves when no restraints were applied. 3/10 solutions had a
profile χ 2 value below 10.0. With the above restraints applied and therefore the search space
reduced, 10/10 runs (starting with the same random seeds) solved and the average number of
moves required was 796250. There were 10 solutions found with a profile χ 2 below 10.0
• Thus if you have a problem that is proving difficult to solve, with no restraints applied during
simulated annealing, it may be valuable to see if there are torsion angle ranges that can be
defined (from a search of the CSD) to reduce the search space.
15.2.15 Stage 13. Conclusion
Global optimisation processes may locate local minima, particularly if (a) Z’ > 1 or (b) the data are of
limited resolution. Looking at the above example of a false minimum, it is clear that superficially,
they can look chemically sensible. This is hardly surprising, as they lie at a point on the χ 2
hypersurface very close to the global minimum of the crystal structure. Accordingly, it is always
prudent to run a structure solution multiple times (with different random number seeds) to ensure that
a consistent minimum is reached.
15.2.16 References
DICVOL Program:
D. Louer & M. Louer (1972) J. Appl. Crystallogr. 5, 271-275.
A. Boultif & D. Louer (1991) J. Appl. Crystallogr. 24, 987-993.
Model Builder:
WebLabViewerLite Version 3.20 (12/8/98) Copyright 1998 Molecular Simulations, Inc.
Single crystal structure (CSD reference code BEDMIG):
C.H. Koo, S.I. Cho, Y.H. Yeon (1980) Arch. Pharm. Res., 3, 37.
Retrieval of Crystallographically-Derived Molecular Geometry Information
Bruno, I.J., Cole, J.C., Kessler, M., Luo, J., Motherwell, W.D.S., Purkis, L.H., Smith, B.R.,Taylor, R.,
Cooper, R.I., Harris, S.E., Orpen, A.G.
(in press)
15.3 Tutorial 3 - Handling cis/trans Isomerism
15.3.1 Introduction
The object of this tutorial is to guide you through the structure solution of cimetidine, exploring the
problems of different molecular models and cis/trans isomerism (this tutorial assumes that you have
234
DASH User Guide
completed Tutorial 1). In this tutorial, you will learn how to:
• Handle a structure solution where the molecule has different stereoisomers.
• Investigate the success rate with different sources of molecular models.
• Learn a bit more about the Pawley fitting process.
There are possible cis/trans stereoisomers, and we will refer to cis- when the cyano group is on the
same side of the C=N double bond as the sulphur chain.
15.3.2 Data
The data set Tutorial_3.xye is a synchrotron X-ray diffraction data set collected on Station 8.3 of the
Daresbury SRS. The incident wavelength was 1.5285 Å.
15.3.3 Stage 1: Reading the Data
• Open DASH and select the directory where the data resides.
• Select View data / determine peak positions and click Next >.
• Select the file Tutorial_3.xye using the Browse... button.
DASH User Guide
235
• Click Next >.
• Check that the wavelength and radiation source have been set correctly and click Next >.
15.3.4 Stage 2: Examining the Data
The data spans 8.01 to 56.0° 2θ. Truncate the data to 2.0 Å resolution and subtract the background
using the default window value of 100. You can examine the background curve (green) in detail in the
usual way by zooming in on regions of the profile. Since this data has a very uniform low-level
background there are no problems, click Next >.
15.3.5 Stage 3. Fitting the Peaks to Determine the Exact Peak Positions
Select the first twenty peaks using the method described in Tutorial 1.
Here is a guide to the positions (° 2θ) of the first 20 peaks:
9.33
9.97
12.84
13.42
14.20
14.58
16.37
16.57
16.70
17.65
18.27
18.66
18.72
18.93
19.45
19.51
19.72
20.00
20.35
22.92
• Click Next >.
• Select Run> to run DICVOL or use another indexing program as described in Tutorial 1.
15.3.6 Stage 4. Indexing
If the selected peaks were very close to those given in the previous stage then the DICVOL program
returns a monoclinic cell with a = 10.3846 Å, b = 18.7995 Å, c = 6.8201 Å, beta = 106.44°, and
volume = 1277.04 Å3 with figures of merit M(20) = 80.4 and F(20) = 198.7. Only one other cell was
suggested, also monoclinic with almost identical volume, b and c axes, and alternative a = 10.687 and
beta = 111.29°.
15.3.7 Stage 5. Stop and Think
Does the cell make sense? In this case we estimate the molecular volume to be ~320 Å3, from the fact
that there are 17 non-Hydrogen atoms in the molecule, each volume approximately 15 Å3 and 16 H
each approximately 5 Å3, so (17 x 15 Å3) + (16 x 5 Å3) = 323 Å3. Therefore, given the unit cell
volume of ~1277 Å3 we know from this very rough approximation that the cell is most likely to
accommodate 4 molecules. At this point, your knowledge of space group frequencies should suggest
that P21/c is a strong possibility.
236
DASH User Guide
15.3.8 Stage 6. Checking the Cell and Determining the Space Group
The space group P2 will automatically have been selected. Although the most likely space group is
number 14, you should now check through the systematic absences by scrolling through all the space
groups, b-axis unique, which have Z = 4. You will have to decide which setting of space group 14 is
correct, P21/a, P21/c, or P21/n. For example, look at the peaks in the region 12 to 15°, P21/n creates a
tick mark at 13.8 where there is no peak and has no tick mark at 13.42 where there definitely is a
peak. P21/c also has no tick mark at 13.42 but creates a tick mark at 8.1 where there is no intensity.
You should examine other peaks and tick marks to confirm the choice of space group as P21/a.
15.3.9 Stage 7. Extracting Intensities
Choose 8 isolated peaks from across the pattern (e.g. 9.33, 12.84, 14.58, 17.65, 18.27, 19.72, 23.63,
26.10). Fit these peaks using the method described in Tutorial 1, then carry out the Pawley
refinement. The initial 3 cycles of least squares refinement only involve the terms corresponding to
the background (which actually has been removed, so notice only 2 polynomial terms are used). This
should give a Pawley χ 2 of about 76; accept these three cycles. The next 5 cycles of least squares
refinement involve the terms describing background, intensities, unit cell and zero point. This should
bring Pawley the χ 2 down to about 35.
Up to this point the Peak Shape parameters have not been refined. To refine these you fill in the tick
boxes Sigma(size), Sigma(strain), Gamma(size), Gamma(strain); it is best to try these options just one
at a time. DASH does not allow you to refine both sigma parameters simultaneously, or both gamma
parameters simultaneously. It’s a good idea to examine the values of the peak shape parameters
(Select Peak Widths from the View menu) and refine only the parameters that have large coefficients,
as these are the ones that impact upon the profile fit. In the case of cimetidine, refining just Gammastrain and setting the number of cycles to 10 rather than the default value of 5, produced a χ 2 of 20.0.
Your final Pawley χ 2 should be in the range 20 - 25.
If the χ 2 increased considerably after a refinement, select Reject and try refining with a different peak
shape parameter.
Accept your best Pawley fit, making a note of the χ 2, and save it as Tutorial_3.sdi.
15.3.10 Stage 8. Molecule Construction
Construct a 3D molecular description of the molecule using your favourite modelling software and
save it in pdb, mol or mol2 format. If you do not have a model building program to hand, there is a
file supplied with the tutorial, Tutorial_3-cis.mol2. (This model for the cis-isomer was created using
the Spartan program using default minimisation settings.) Select the file Tutorial_3-cis.mol2.
DASH User Guide
237
15.3.11 Stage 9. Setting up the Structure Solution Run
• Start DASH as before and select Simulated annealing structure solution from the Wizard.
• Select the Tutorial_3.sdi file.
• Click on the
icon and select Tutorial_3-cis.mol2 (the file that you created in Stage 8); a Zmatrix file called Tutorial_3-cis.zmatrix will be generated automatically.
• Read in the Tutorial_3-cis.zmatrix file.
• At this point DASH will confirm that there are 14 independent parameters. These parameters are
listed when you click on Next >. There are 3 parameters describing the positional coordinates, 4
(of which 3 independent) describing the molecular orientation within the unit cell and 8 variable
torsion angles. Note that in this model we are keeping the cis-configuration fixed.
• Click Next > to proceed to the Simulated Annealing Protocol window. Leave the parameters set
at the default values, click Next > again, then click Solve >. This will take a little longer than the
earlier Tutorial examples as there are more torsion angles allowed to vary: 8 compared with 6 in
Tutorial 2.
15.3.12 Stage 10. Monitoring Structure Solution Progress
The progress of the structure solution can be followed by monitoring the profile χ 2 and the difference
plot.
At some point in the run you should see a dramatic fall in the χ 2 value from about 1000 to around
200. At this point you can investigate if a local minimisation produces an improvement - the answer
will almost certainly be ‘Yes’, so accept this improved point. Have a look at the structure with the
View button. You should see that the H-bonding of groups is now quite plausible; always look first for
unsatisfied H-donor atoms. You will see also that the molecule has coiled around to form an intramolecular H-bond from the NH near the end of the chain to the acceptor N on the imidazole ring.
238
DASH User Guide
15.3.13 Stage 11. Examining the Output Structure
View the structure using the View button in the Results from Simulated Annealing window. All should
look reasonable, there should be no abnormal close contacts between molecules, except perhaps for
some H-atoms. The H-atoms contribute such a small percentage of the total scattering power of the
molecule that they have very little effect on the value of χ 2. The positions of methyl H atoms in
particular are poorly determined, as they have been placed in calculated positions and not allowed to
rotate. There is a crystal structure for this cis-isomer in the CSD (CIMEDT03); the H-bonding
scheme matches this exactly. There may appear to be an extra H-bond to the cyano-N in your
solution, but this will be just within the arbitrary limit set for distance scanning for H-bonds in the
visualiser. (The Mercury visualiser allows you to easily examine the H-bond network just by clicking
on the H-bonds.)
15.3.14 Stage 12. Experiments Altering the cis/trans Isomer
It is interesting to do the experiment of trying to solve the structure with the trans-isomer. You can
either build a model with the trans-configuration, save it as Tutorial_3-trans.mol2 (a trans-isomer
model file is provided with this Tutorial as Tutorial_3-trans.mol2), or use a more advanced feature of
DASH to allow the model to rotate about the relevant C=N double bond.
You will find that if you take a trans-isomer model the SA solution process will not get very far.
Using the multiple-run feature of DASH a typical set of 5 runs had final χ 2 of 367, 452, 647, 975,
624, with hopelessly tangled close contacts.
You can modify the previous cis-cimeditidine model to cover both cis- and trans- configurations. To
do this you need to make one small change to the Z-matrix file, Tutorial_3-cis.zmatrix. Look at the
DASH User Guide
239
labelling of the source molecular model provided with this Tutorial, Tutorial_3-cis.mol2, shown
below, hydrogens omitted.
• The relevant torsion angle we now want to vary is C3-N2-C1-N11. If you examine the Z-matrix
you will see the line that specifies this torsion angle, looking at the labels on the right, count up
15 from bottom. The torsion angle (column 6) is set at 1.4448765; the number 0 that follows is a
control indicator to tell DASH that this is a fixed torsion angle; if you change this to 1 this
indicates a variable torsion angle.
• Make this change and save your Z-matrix as a new file, e.g. cistrans.zmatrix. Now begin a
structure solution run loading this new matrix; look down the list of parameters in the Parameter
Bounds window. This angle is now freely variable from 0 to 360°, and the total DASH
parameter count is now 15. Go to the Simulated Annealing Protocol window, where there is the
option of performing multiple runs. If you do a set of 5 runs as before, with the maximum
number of moves per run 3,000,000 and χ 2 multiplier 3.0, you will get probably about 2 or 3
correct solutions out of 5.
• A typical set of runs gave χ 2 = 329, 200, 76, 199, 74. The low values 74 and 76 are very
satisfactory solutions; with variable torsion angle C3-N2-C1-N11 values around -6.0°, which is
the cis-conformation.
240
DASH User Guide
(The Z-matrix format is described in Appendix F of the DASH User Guide.)
15.3.15 Stage 13. Effect of Molecular Models on Simulated Annealing
Another interesting experiment is to see how much the fine detail of the model building affects the
chance of solution with DASH. Experiments were carried out with three models, the files are
provided with this Tutorial as Tutorial_3-ModelA.zmatrix, Tutorial_3-ModelB.zmatrix, Tutorial_3ModelC.zmatrix.
• Model A was prepared using the ISIS/Draw sketcher and WebLabViewer, with no energy
minimisation, exported as a mol file.
• Model B was prepared using Spartan to sketch and then do a simple energy minimisation,
exported as a mol2 file.
• Model C was the CIMETD03 structure taken from the CSD as a mol2 file. H-atom positions
were recalculated at ideal geometry using Rpluto.
Each model was used for a set of 30 SA runs, with Max. number of moves / run 3,000,000 and Profile
chi-sqd multiplier 3.0. The Pawley-fit χ 2 was 22.06. The solutions had profile χ 2 as follows:
A 18 x ~149*, 11 x ~282, 1 x 443
B 19 x ~103*, 11 x ~241
C 20 x ~83*, 10 x ~268
The solutions marked * are correct - with good H-bond patterns, and torsional geometry close to the
CSD. This gives us some confidence that the solution of structure with 8 torsion angles can be carried
out with a good likelihood of success. It is interesting that Model A, which had not been subjected to
energy minimisation, still gave correct solutions, but with a higher χ 2 than the other solutions. You
should try a multiple run with your own constructed cis-isomer model file.
15.3.16 Stage 14. Rietveld Refinement
In order to demonstrate the utility of the built-in rigid-body Rietveld refinement module, a refinement
on simulated annealing solutions generated from Model B will be outlined. A similar process could
be carried out using one of the interfaces to an external refinement package. Model B was generated
in PCSpartan Pro and a simple energy minimisation performed and therefore can be expected to have
bond angles and bond lengths that are only roughly in agreement with the crystal structure values.
• Carry out multiple simulated annealing runs with the molecular model described by Tutorial_3ModelB.zmatrix and random seeds 314 and 159. Once the simulated annealing is complete and
the Analyse Solutions dialogue box is displayed, click on the Rietveld button corresponding to
the best solution.
• The refinement of the best solution from these simulated annealing runs should take the structure
DASH User Guide
241
towards the solutions obtained for a refinement on Model C, the model generated from a single
crystal structure.
• In the runs performed here, the best solution had a profile χ 2 of 52.88 and an intensity χ 2 of
41.70. After allowing all the sets of parameters to refine, individually (for example Global
isotropic temperature factor, then torsion angles, then angles, then bond lengths and zmatrix) the
profile χ 2 and intensity χ 2 had reduced to 34.48 and 21.14, respectively.
• The following table lists selected angles in Model B solutions before and after Rietveld
refinement. The values found in the single crystal structure are also given for comparison. It can
be seen that the solution for Model B is moving towards the single crystal structure during
Rietveld refinement.
Angle
Before RR (o)
After RR (o)
Crystal Structure (o)
N11:C1:N5
111.53
117.54
123.89
N11:C1:N2
127.43
124.36
117.52
N2:C3:N4
176.98
170.13
170.34
N25:C24:C30
129.70
120.79
121.81
C20:S19:C16
96.47
99.07
105.50
• Not many refinement cycles are performed before changes in the χ 2 values become very small.
Like Tutorial 1, small changes can be brought about in the value of intensity χ 2 by repeatedly
refining the bond angles and bond lengths for example. However, given the resolution of the
data, these changes do not represent an improved set of coordinates for this structure.
15.3.17 Stage 15. Conclusion
• One can clearly distinguish between cis- and trans- isomers in this case.
• It is possible to use DASH to allow cis/trans as a variable torsion angle, giving the correct
solution.
• The accuracy of the molecular model does matter.
15.3.18 References
DICVOL Program:
D. Louer & M. Louer (1972) J. Appl. Crystallogr. 5, 271-275.
A. Boultif & D. Louer (1991) J. Appl. Crystallogr. 24, 987-993.
242
DASH User Guide
Model Builders:
WebLabViewerLite Version 3.20 (12/8/98) Copyright 1998 Molecular Simulations, Inc.
PC Spartan Pro Version 1.0.5 (16/8/2000) Copyright (1996-2000) Wavefunction, Inc.
Single crystal structure cis-cimetidine (CSD reference code CIMETD03):
R.J. Cernik, A.K. Cheetham, C.K. Prout, D.J. Watkin, A.P. Wilkinson, B.T.M. Willis, (1991) J. Appl.
Crystallogr. 24, 222-226.
Single crystal structure trans-cimetidine [CSD reference code CIMETD01].
L. Parkanyi, A. Kalman, B. Hegedus, K. Harsanyi, J. Kreidl (1984) Acta Crystallogr. C40, 676-679.
15.4 Tutorial 4 - Handling a Structure in Which There is a Space Group Ambiguity
15.4.1 Introduction
The object of this tutorial is to guide you through the structure solution of decafluoroquaterphenyl
(DFQP). It assumes that you have completed the previous tutorials. In this tutorial, you will learn how
to
•
•
•
•
Handle a structure solution in which there is a space group ambiguity.
Deal with a structure that has a potential centre of symmetry.
Deal with a more prominent background than you have encountered so far.
Handle a difficult Pawley fitting problem.
DASH User Guide
243
15.4.2 Data
The data set Tutorial_4.xye is a laboratory X-ray diffraction data set collected by Dr. Lubo Smrcok.
The incident wavelength was 1.789 Å.
15.4.3 Stage 1: Reading the Data
•
•
•
•
•
Open DASH and select the directory where the data resides.
Select View data / determine peak positions and click Next >.
Select the file Tutorial_4.xye using the Browse... button.
Click Next >.
Check that the wavelength and radiation source have been set correctly and click Next >.
15.4.4 Stage 2: Examining the Data and Removing the Background
The data spans 4 to 61° 2θ. Remember that this data has been collected at a relatively long
wavelength and so the real-space resolution of the data is only ~1.8 Å. Truncate the data to 2.0 Å
resolution.
244
DASH User Guide
Having examined the data, we really want to strip out the background. This is because the data, whilst
good, are nowhere near as good as the synchrotron data sets that you examined in Tutorials 1 and 2. If
we defer background modelling until the Pawley fit stage, we have an additional set of parameters to
worry about at that stage. With the weaker data at higher angles, there is always a chance that
correlations between the weak peaks and the background parameters may cause instabilities in the fit.
These can be avoided by removing the background at this stage.
Select Preview using the default value of 100 for the filter window size. Examine the background fit
carefully at all points in the pattern, but especially at the low and high angle regions. The fit is
excellent, with only a marginal underestimation at low angle. Try altering the window size to 50 and
select Preview. Note the better fit at low angle, and also the increased flexibility in the background
shape that decreasing the window size has brought about. Although you could proceed with either
value (as both give an excellent fit) return to the less structured background by changing the window
size back to 100 and click Apply to strip off the background. The background-subtracted pattern is
displayed. Examine it closely before proceeding to the next stage.
15.4.5 Stage 3. Fitting the Peaks to Determine the Exact Peak Positions
Select the first 22 peaks using the method described in Tutorial 1.
Here is a guide to the positions (° 2θ) of the first 22 peaks:
8.7661
17.3011
18.7498
20.7870
21.3166
21.5902
23.6311
24.4517
24.9854
25.4535
27.1252
27.7534
28.1742
29.1876
30.7017
33.5830
33.7804
34.1816
34.7082
34.9715
35.2415
35.4262
• Click Next >.
• Select Run> to run DICVOL or use another indexing program as described in Tutorial 1.
15.4.6 Stage 4. Indexing
Your indexing program may reveal a number of possible unit cells. The unit cell with the highest
figures of merit should be monoclinic with volume ~1794 Å3. The DICVOL program returns a
monoclinic cell with a = 24.04678 Å, b = 6.15668 Å, c = 12.42973 Å and beta = 102.753°, Volume =
1794.80 Å3 with figures of merit M(22) = 16.1 and F(22) = 29.3. Whilst not fantastic figures of merit,
we can note that there are nearly 100 calculated peaks for this cell, as against the 22 that were input.
This might indicate that there are a lot of systematic absences, or it may indicate that the cell is
DASH User Guide
245
wrong.
15.4.7 Stage 5. Stop and Think
Does the cell make sense? In this case, given that the molecule may well adopt a planar configuration,
it is difficult to estimate the likely molecular volume. Assuming 4 molecules per cell and dividing
1800 Å3 by 4, we get 450 Å3, which is certainly enough to accommodate the molecule’s backbone of
24 carbon atoms (15 Å3) + 10 fluorines (10 Å3) = 460 Å3. So the cell is worth checking.
15.4.8 Stage 6. Checking the Cell and Determining the Space Group
It is clear that there are a great many excess tick marks, indicating probable systematic absences, this
means that the space group must be of substantially higher symmetry than P2. Zoom into the 10 - 16°
region of the pattern and watch the correspondence between the tick marks and the observed
reflections as you scroll through some of the possible space groups. You will see that many of the
space groups can be ruled out immediately, for example, the primitive cells predict many peaks that
are not observed. A centred cell is therefore likely, and so C2/c is a likely choice (see Appendix D in
the DASH User Guide). Select this group and examine the pattern closely. Things look good at low
angle but the peak at ~24.5° is misplaced.
Altering the setting to I2/a results in excellent agreement throughout the pattern, so this appears to be
the best choice. Note, however, that Ia has the same systematic absences as I2/a and therefore gives
exactly the same level of agreement. Using the table in Appendix D of the DASH User Guide, the
centrosymmetric space group I2/a (C2/c) is about 7 times more common than the noncentrosymmetric space group Ia (Cc). As the molecule possesses a molecular centre of symmetry in
the middle of the bond between the two central rings, I2/a is certainly the more likely choice.
15.4.9 Stage 7. Extracting Intensities
Pawley fitting this pattern in either I2/a or Ia will give identical results (the absences are the same)
and so we will fit Ia. We want to delete the last group of 3 peaks as they are highly overlapped, in the
region of 35°, (sweep this range and select the Delete key). The program now detects that it has peaks
available for unit cell refinement and so the Pawley Refinement Status window appears automatically,
as the peaks widths for all the indexing peaks that you fitted earlier are still available to DASH.
Select Refine. The initial 3 cycles of least squares refinement only involve the two terms
corresponding to the linear background and to the individual reflection intensities; accept these three
cycles. Using the cell constants listed in Stage 4, the Pawley χ 2 is about 2.7. Proceed and refine the
unit cell and zero-point along with the background and the intensities. You may get a warning from
DASH stating that errors have been detected due to instabilities in the Pawley fit. If so, reject the fit
and increase the Overlap criterion to 2.0. Select Refine and you should get a stable refinement with a
Pawley χ 2 of about 1.9.
246
DASH User Guide
Accept your best Pawley fit and save it as Tutorial_4.sdi.
15.4.10 Stage 8. Molecule Construction
Construct a 3D molecular description of the molecule using your favourite modelling software and
save it in pdb, mol or mol2 format. This can be done, for example, by importing an ISIS/Draw sketch
into WebLabViewer (for further details, see Tutorial 1). Save this as Tutorial_4-full.pdb, Tutorial_4full.mol or Tutorial_4-full.mol2. The remainder of this tutorial is based upon a Z-matrix constructed
importing the above ISIS/Draw sketch of the molecule into WebLabViewer and exporting it as a mol
file. (If you do not have a model builder to hand there are files provided with the tutorial: Tutorial_4full.mol2 and Tutorial_4-half.mol2.)
15.4.11 Stage 9. Setting up the Structure Solution Run
• Continue on from the Pawley fitting stage by pressing Solve >.
• Click on the
icon and select Tutorial_4-full.mol2 (the file that you created in Stage 8); a
Z-matrix file called Tutorial_4-full_1.zmatrix will be generated automatically.
• Read in the Tutorial_4-full.zmatrix file, which has three moveable torsion angles.
At this point DASH will confirm that there are 9 independent parameters. These parameters are listed
when you click Next >. There are 3 parameters describing the positional co-ordinates, 4 (3 of which
independent) describing the molecular orientation within the unit cell and 3 variable torsion angles.
All F boxes are unticked by default, indicating that all 10 parameters are allowed to vary during
structure solution. Click Next >, leave the parameters set at their default values, click Next > again,
then Solve >; the simulated annealing process begins.
15.4.12 Stage 10. Monitoring Structure Solution Progress
The progress of the structure solution can be followed by monitoring the profile χ 2 and the difference
plot.
The profile χ 2 should fall fairly quickly to below 20 and the fit to the data should look not bad, with
the residual misfits distributed throughout the pattern.
15.4.13 Stage 11. Examining the Output Structure
View the structure using the View button in the Results from Simulated Annealing window. The
molecular conformation and the packing look reasonable. However, we have still only explored Ia.
DASH User Guide
247
15.4.14 Stage 12. Exploring the Possibility of I2/a
A: Space Group Ia
There is a quick and easy way to explore whether or not the true space group is Ia or I2/a whilst
performing all SA runs in Ia In the previous run, the centre of mass of the molecule was allowed to
roam freely throughout the unit cell. If the space group truly is I2/a, then the centre should lie either
on the origin or on the 2-fold axis. Accordingly we can:
• Constrain the centre of mass to lie at 0,0,0
• Constrain the centre of mass to lie on 0.25,y,0
and repeat the structure solution runs in Ia to see the fits that are obtained.
248
DASH User Guide
How to constrain the molecule to lie on special positions
• To constrain the centre of the molecule to lie on the origin of the cell, stop the current annealing
run by pressing Stop, and return to the Parameter Bounds window.
• Enter values of 0.0 for the initial values of x(frag1), y(frag1) and z(frag1) and then click the F
check box for each of these variables in order to fix the x,y,z position of the molecule within the
unit cell at the fractional co-ordinates 0,0,0. Note that by default, DASH uses the centre-of-mass
of the molecule as the x,y,z reference point, and for the DFQP molecule, this corresponds to the
midpoint of the central bond. You can now proceed with the simulated annealing run knowing
that the centre-of-mass of the molecule will always be constrained to lie at 0,0,0.
• Similarly, for the SA in which we wish to hold the centre-of-mass on the 2-fold axis, return to
the Parameter Bounds window. Following the same procedure as just outlined, fix x(frag1) at
0.25, leave y(frag1) to vary and fix z(frag1) at 0.0.
Fixing the centre of mass at 0,0,0 causes the structure solution to stick at a very high profile χ 2,
around 130. In contrast, after constraining the centre of mass of the molecule to lie on the 2-fold axis,
the profile χ 2 falls rapidly to around 20 and local minimisation reduces this still further to around 18.
The packing motif is identical to that obtained in Ia.
Note that a 2-fold rotation of the molecule about the b-axis does not give an exact mapping from one
half of the molecule to the other, as in Ia, there is no constraint upon the torsion angles to produce
this. However, it is so close to doing so that it is safe to conclude that the molecule crystallises in
space group I2/a and that a Rietveld refinement with only half a molecule in the asymmetric unit will
be successful.
B: Space Group I2/a
You can (if you want) re-fit the diffraction data using the same unit cell and selecting space group I2/
a but there is in fact an easier way of running the SA in I2/a. As stated previously, Ia and I2/a have
the same systematic absences and so Pawley fitting in either space group will give the same result.
Accordingly, we can use the Pawley fit files already created and simply modify the Tutorial_4.sdi file
to inform the SA that we now wish to solve in I2/a. Copy Tutorial_4.sdi to Tutorial_4-half.sdi and
open the file in a text editor. Look for the following line:
SpaceGroup 52 9:b3 I 1 a 1
and change it to:
SpaceGroup 69 15:b3 I 1 2/a 1
DASH User Guide
249
and then save the file. You have now told the program that the SA must now be performed in space
group I2/a (consult the DASH User Guide, Appendix D.3 for an explanation of the format of the
Space Group line), whilst leaving the pointers to the existing Pawley fit files.
Next, as we are now in I2/a, we only require half a molecule to fill the asymmetric unit.
Construct a Tutorial_4-half.mol file based on the above diagram and read it into DASH. The resultant
Tutorial_4-half_1.zmatrix file only has a single torsion angle - the torsion angle between the two
‘halves’ of the full molecule is automatically determined by the orientation of the molecule within the
unit cell.
Using the Wizard, load the new Tutorial_4-half.sdi file and the Tutorial_4-half_1.zmatrix file. Do not
fix any of the variable parameters (i.e. allow the molecule to roam the unit cell) and start a SA run.
The profile χ 2 should fall rapidly to around 20. Viewing the molecule shows that the space group
symmetry is indeed constructing the whole molecule (though the central bond is not displayed onscreen the distance C-C can be measured to be about 1.6 Å).
250
DASH User Guide
There is therefore no doubt that this molecule crystallises in space group I2/a. Note that the molecule
is sitting on a 2-fold rotation axis and not the centre of symmetry.
15.4.15 Stage 13. Conclusion
This tutorial has shown that there are several ways to solve the crystal structure of DFQP using global
optimisation, all of them equally valid. Structure solutions of this complexity using DASH take so
little time to execute that it is worth investigating the various possibilities in order to be certain that
you have the correct answer.
The final fit to the data is not that great, but the chemical sense of the structure is such that there is no
doubt that the structure is correct. The published Rietveld refined structure (Smrcok et al.) for this
molecule confirms this. Accordingly, note that it is entirely possible to obtain a profile χ 2 that is a
factor of 10 higher than the Pawley χ 2 and still have the correct structure.
DASH User Guide
251
Some remarks on Rietveld Refinement are in order. The published structure reported the results of an
unrestrained Rietveld refinement, which shows quite severe distortion of the benzene rings. This is a
natural consequence of allowing too many variables to be optimised against the rather limited data,
especially this set of laboratory data of lower accuracy than synchrotron. A tradition has grown up of
allowing unrestrained refinement of all atomic positions in order to prove that the crystal structure is
correct. This certainly proves that the atoms all fit well with the low resolution electron density
represented here by only 174 reflections, which are extracted by Pawley fit corresponding to the
complete data set in 2θ, corresponding to 1.763Å resolution. However a more realistic model for the
real crystal structure is obtained if one uses the DASH Rigid-group Rietveld refinement.
It has be seen in the previous section (12) that the low-resolution data gives an unreasonably long
value for the central C-C bond, 1.60Å, when we refine with a half-molecule in I2/a. A better model
for the full crystal structure is to use the constrained full molecule placed with its centre of mass on
the crystallographic 2-fold axis at (0.0, y, 0.25). If the DASH Rietveld refinement is applied to the
data available to 1.763Å resolution, in space group Ia, we obtain typical solutions with Chi-sqd of
about 86 and Profile Chi-sqd of 11.3. An example refinement of the global isotropic temperature
factor scale, followed by refinement of Translations, (y only), and Rotations gave values of 0.6717,
and Chi-sqd of 85.87, 11.30. A check of the shortest inter-molecular contacts shows shortest C...H
2.60Å, F...F 2.56Å, and H41...F16 2.09Å. This latter value is rather closer than expected being 0.5Å
shorter than the van der Waals radii sum, but the other short-contact values can be seen in CSD single
crystal structures.
15.4.16 References
DICVOL Program:
D. Louer & M. Louer (1972) J. Appl. Crystallogr. 5, 271-275.
A. Boultif & D. Louer (1991) J. Appl. Crystallogr. 24, 987-993.
Model Builders:
WebLabViewerLite Version 3.20 (12/8/98) Copyright 1998 Molecular Simulations, Inc.
Crystal structure of decafluoroquaterphenyl:
L. Smrcok, B. Koppelhuber-Bitschnau, K. Shankland, W. I. F. David, D. Tunega and R. Resel (2001)
Z. Kristallogr. 216, 63-66.
15.5 Tutorial 5 - Dealing with Two Molecules in the Asymmetric Unit
15.5.1 Introduction
The object of this tutorial is to guide you through the structure solution of uridine. It assumes that you
have completed Tutorial 1. In this tutorial, you will learn:
252
DASH User Guide
• How to handle two molecules in the asymmetric unit
• To appreciate the importance of a good molecular model.
15.5.2 Data
The data set Tutorial_5..xye is a synchrotron X-ray diffraction data set collected on BM16 at the
ESRF, at 130K. The incident wavelength was 0.85075 Å.
15.5.3 Stage 1: Reading the Data
•
•
•
•
•
Open DASH and select the directory where the data resides.
Select View data / determine peak positions and click Next >.
Select the file Tutorial_5.xye using the Browse... button.
Click Next >.
Check that the wavelength and radiation source have been set correctly and click Next >.
15.5.4 Stage 2: Examining the Data
The data spans 4 to 30° 2θ. Truncate the data to 2.0 Å resolution. The background can be removed
DASH User Guide
253
at this stage so proceed to do so. The default value for the window parameter of 100 is appropriate.
When you are satisfied that the background fit (green line) is reasonable, click Apply and then Next >.
15.5.5 Stage 3. Fitting the Peaks to Determine the Exact Peak Positions
Select the first 23 peaks using the method described in Tutorial 1, Stage 3.
Here is a guide to the positions (° 2θ) of the first 23 peaks:
4.84
6.63
7.07
7.51
7.81
9.70
10.51
10.56
10.77
10.91
11.12
11.40
11.98
12.11
12.21
12.52
12.77
13.22
13.28
13.74
14.10
14.30
14.42
• Click Next >.
• Select Run> to run DICVOL or use another indexing program as described in Tutorial 1.
15.5.6 Stage 4. Indexing
If you have selected peaks which are very similar to those given in the previous stage the DICVOL
program returns a monoclinic cell with a = 13.8703 Å, b = 14.7167 Å, c = 4.9207 Å, beta = 95.70°
and cell volume = 999.47 Å3 with figures of merit M(23) = 74.8 and F(23) = 374.8. Other cells are
suggested with beta greater than 96° but it is customary to choose the cell with the smallest angle.
(This turns out to be in very good agreement with a single crystal structure reported in the Cambridge
Structural Database [CSD] reference code BEURID10.)
15.5.7 Stage 5. Stop and Think
Does the cell make sense? In this case we estimate the molecular volume to be 17 x 15 Å3 (9C, 2N
and 6O) + 12 x 5 Å3 (12 H) = 315 Å3. If there were 2 or 4 molecules in the unit cell we thus estimate
volumes of 630 or 1260 Å3 respectively. The estimate for 4 molecules per cell is more likely,
allowing for the fact that there is likely to be extensive H-bonding which will tend to make the cell
smaller in volume.
15.5.8 Stage 6. Checking the Cell and Determining the Space Group
You should check through the space groups (scrolling through the choices with the arrow keys) until
a good match between the tick marks and peak positions is obtained. A very good correspondence is
achieved with space group P 1 21 1, number 4:b. Thus we need to attempt structure solution in P21
254
DASH User Guide
with 2 independent molecules in the asymmetric unit.
15.5.9 Stage 7. Extracting Intensities
Pick 8 peaks which are isolated using the method described in Tutorial 1, Stage 7. When 8 peaks have
been chosen the Pawley Refinement Status window will pop up automatically. The initial 3 cycles of
the least squares refinement only involves the terms corresponding to the background. This should
give a Pawley χ 2 of 3 or better, accept these three cycles. The next 5 cycles of the least squares
refinement should bring the Pawley χ 2 down to about 1.5. Accept your best Pawley fit, making a note
of χ 2 and save the file as Tutorial_5.sdi.
15.5.10 Stage 8. Molecule Construction
Construct a 3D molecular description of the molecule using your favourite modelling software and
save it in pdb, mol or mol2 format. Care must be taken with the conformation of the ribose ring. The
five-membered ribose ring is not planar - four atoms of the ring define a plane and the 5th atom will
be found either above the plane (on the same side as the 6-membered heteronuclear ring) or below the
plane. If we search the CSD for molecules very similar to uridine, we find that the torsion angle
defined by O, C4’, C3’ and C2’ is either between 0 and +30° (C3’ lies below the plane) or C3’ lies
above the plane (torsion angle between 0 and -40°. In uridine, C3’ lies above the plane and to start
with, your molecular model should copy this. Later, you will run through the simulated annealing
process with a molecular model of a different ring conformation. If you do not have access to a
molecular modelling package a .mol2 file created by SPARTAN is included for the tutorial:
Tutorial_5.mol2.
15.5.11 Stage 9. Setting up the Structure Solution Run
• Continue on from the Pawley fitting stage by selecting Solve >.
• Click on the
icon and select Tutorial_5.mol2 (the file that you created in Stage 8); a Zmatrix file called Tutorial__1.zmatrix will be generated automatically.
• Read in the Tutorial_5_1.zmatrix file.
• As there are two molecules in the asymmetric unit, read in the Tutorial_5.zmatrix file again.
At this point DASH will confirm that there are 16 independent parameters. These parameters are
listed when you click on Next >. There are 3 parameters describing the positional co-ordinates, 4 (of
which 3 independent) describing the molecular orientation within the unit cell and 2 variable torsion
angles, for each molecule.
Click on Next >, leave the Simulated Annealing Protocol window with the default values, click Next >
again and then click on Solve >. The structure should solve reasonably quickly.
DASH User Guide
255
15.5.12 Stage 10. Monitoring Structure Solution Progress
The progress of the structure solution can be followed by monitoring the profile χ 2 and the difference
plot. The molecule and crystal packing can be examined using the View button.
15.5.13 Stage 11. Examining the Output Structure
View the structure using the View button in the Results from Simulated Annealing window. All should
look reasonable; there should be no abnormal close contacts between the atoms. In particular, check
the formation of H-bonds. The picture below is taken from the Mercury visualiser for a SA good
solution. In order to get a simple view of H-bonds we suggest clicking Show hydrogens off, and HBond on.
256
DASH User Guide
In the CSD it is found that in nearly every case H-bond donor atoms will be satisfied, so you should
check all the OH groups, and the NH. Most of the O acceptor atoms will also take part in H-bonds,
except for the ribose O which is often found not to accept. Note that in DASH the torsion angles
involving H atoms are fixed by default at whatever value was input from the model - this means that
the H-atoms do not necessarily point in the correct direction to form optimal H-bonds in these SA
solutions.
For comparison an H-bond picture from Rpluto is given below for the single crystal structure
BEURID10, which shows the same H-bond pattern. The directions of the axes may be inverted as
absolute configuration cannot be determined from powder data. There is an ambiguity of 0.5 in the
DASH User Guide
257
axial directions a and c, because of defined origin choice on a screw-axis, and the b-axis origin
position is indeterminate.
15.5.14 Stage 12. Experiments with the Ring Conformation
When the molecular model was built, it was stressed that the ribose ring is puckered, with the 3’
carbon out of the plane of the rest of the ribose ring and on the same side as the 6-membered ring.
Build a model where the conformation of the ribose ring is different, for example where the 3’ carbon
of the ring points away from the 6 membered ring, the other four atoms of the ring defining a plane. If
you do not have access to a model building package a file, Tutorial_5-2.mol2 is included in the data
258
DASH User Guide
files. Repeat the Simulated Annealing stage (you can use DASH Wizard) but this time import
Tutorial_5-2.mol2 and then read in the newly created Tutorial_5-2_1.zmatrix file, as before.
Proceed with the solution stage. You will find that a good solution is not found, and molecules may
appear tangled, with close contacts. An example result is shown below:
It should also be mentioned that you can experiment in DASH with flexible ring systems only by a
rather crude method, whereby one takes the molecular model in the model building program and
breaks a bond in the ribose ring - say C2’-C3’, and then export as a MOL2 file. Importing this into
DASH then causes the rings to be treated as flexible chains, adding in fact 4 torsion angles per
molecule; 8 torsion angles for the total SA search. This does not work in this case, as we have reached
the present limit of the method with this data, but it is worth trying in less complex structures.
DASH User Guide
259
15.5.15 Stage 13. Conclusion
• DASH can solve structures with two molecules per asymmetric unit.
• The CSD should be consulted with regard to conformations of flexible rings.
• Models with markedly wrong ring conformations will not give the correct solution.
15.5.16 References
DICVOL Program:
D. Louer & M. Louer (1972) J. Appl. Crystallogr. 5, 271-275.
A. Boultif & D. Louer (1991) J. Appl. Crystallogr. 24, 987-993.
Model Builder:
PC Spartan Pro Version 1.0.5 (16/8/2000) Copyright (1996-2000) Wavefunction, Inc.
Visualiser:
Mercury (provided with DASH, has good H-bonding features)
RPluto (has H-bond graph set analysis features)
CCDC (1999). RPluto is freely downloadable for non-commercial purposes from http://
www.ccdc.cam.ac.uk/prods/rpluto/index.html
Single crystal structure (CSD reference code BEURID10):
E.A. Green, R.D. Rosenstein, R. Shiono, D.J. Abraham, B.L. Trus, R.E. Marsh (1975) Acta
Crystallogr., B31, 102-107.
15.6 Tutorial 6 - Solving the Structure of an Inorganic Compound
15.6.1 Introduction
The object of this tutorial is to guide you through the process of solving an inorganic crystal structure,
using the compound ZrW2O8 as an example. This compound, zirconium bis(tungstate), contains
zirconium ions (pink) and tungstate tetrahedra (green, with oxygen atoms shown in red). For this
tutorial, it is assumed that you have already completed Tutorial 1. In the process of this tutorial you
will learn how to:
• Solve the structure of an inorganic compound.
• Handle multiple structural fragments as separate z-matrices.
• Cope with the complications of high symmetry space groups.
260
DASH User Guide
15.6.2 Data
The data set Tutorial_6.raw is a laboratory x-ray diffraction data set collected at room temperature by
John Evans. The incident wavelength was 1.54060 Å.
15.6.3 Stage 1: Reading the data
•
•
•
•
•
•
Open DASH and select the directory where the data resides.
Select View data / determine peak postions and click Next >.
Select the file Tutorial_6.raw using the Browse... button.
Click Next >.
Check that the wavelength and radiation source have been set correctly and click Next >.
The default settings shown in the Background Subtraction window are good enough for this
simple background. Click Next >.
15.6.4 Stage 2: Examining the Data
This data set is very clean, with a very low background and sharp reflections, so we do not want to
throw away any of the high resolution reflections. Change the settings to truncate the data to a
resolution of 1.0 Å. Subtract the background using the default window setting of 100. Click Next >.
15.6.5 Stage 3. Fitting the Peaks to Determine the Exact Peak Positions
Select the first 20 peaks using the method described in the first tutorial.
Here is a guide to the approximate positions (2θ) of the first 20 peaks:
16.7803
19.3916
21.6881
23.7869
27.5389
29.2538
30.8623
32.4090
35.3199
36.7033
DASH User Guide
261
39.3372
40.5986
41.8329
43.0303
44.2036
45.3575
46.4954
48.6816
49.7570
50.8086
15.6.6 Stage 4. Indexing
A typical run of DICVOL, if the selected peaks were very close to those given in the previous stage,
should return a cubic cell as the best fit, with:
a = b = c = 9.1547 Å, V = 767.23 Å3
Figures of merit: M(24) = 160.1, F(24) = 154.6
A number of other possible cells are likely to appear with lower symmetry. Select the cubic cell as
this should give the best figures of merit.
15.6.7 Stage 5. Stop and Think
Does the cell make sense? There is a very approximate method of estimating molecular volume using
15 Å3 per C, N, O atom and 25 Å3 for heavier atoms. So for this compound, ZrW2O8, we estimate the
formula unit volume to be 195 Å3, so 4 formula units per cell would need a volume of approximately
780 Å3. The DICVOL cell volume of 767 Å3 suggests that we have roughly four formula units per
cell.
15.6.8 Stage 6. Checking the Cell and Determining the Space Group
The space group that is automatically selected for the cubic crystal system is P23. A quick scan of the
diffraction pattern and tick-marks for the predicted reflections should show that the majority of tickmarks correspond to observed peaks. This suggests that the space group is either correct, or quite
close to the correct one. Try selecting some of the other space groups in the list for the cubic crystal
system and looking at the correlation between tick-marks and peaks. You will see that the majority of
space groups produce regions where there are no tick-marks, but there are observed peaks, e.g. F23,
I23, I213, Fm-3, Pa-3.
The correct space group for this crystal structure is actually P213. Have a look at the predicted peak
positions for this space group and check that these correspond to the observed peaks. To check that
this is correct, run the space group determination tool. This should confirm that the space group is
primitive and that the only systematic absences present indicate a 21 screw axis, which only leaves
two possible space groups - P213 and P4232. The structure will not solve, however, in P4232.
262
DASH User Guide
15.6.9 Stage 7. Extracting Intensities
Select a series of isolated peaks across the diffraction pattern (e.g. 16.77, 21.69, 32.41, 45.36, 51.85,
62.50) as shown in previous tutorials. The peak picking algorithm may continue to the Pawley
refinement step after you have only chosen 5 or 6 peaks if it deems the peaks chosen acceptable. The
initial 3 cycles of refinement should give a Pawley χ 2 of around 1.2; accept these three cycles. The
next five cycles of least squares refinement should bring the Pawley χ 2 value down slightly further.
Refinement of the peak shape parameters is unlikely to improve the refinement for this data set. Your
final χ 2 parameter should be in the region of 1.0 - 1.2.
Accept your best Pawley fit, making a note of the χ 2 value, and save it as Tutorial_6.sdi.
15.6.10 Stage 8. Building the Preliminary Model
In order to solve the crystal structure we need to define a starting model. The oxygen atoms have
much less electrons than the Zr and W atoms and therefore scatter x-rays more weakly. This means
that it is sensible to determine the positions of the heavy atoms first before attempting to determine
the light atom positions. A starting model for the heavy atom structure solution can therefore be
defined as simply free Zr and W atoms. These can be set up using your preferred model building
software, or using a file supplied with the tutorial, Tutorial_6-atoms.mol2.
15.6.11 Stage 9. Setting up the Structure Solution Run
• Start DASH as before and select Simulated annealing structure solution from the Wizard.
• Select the Tutorial_6.sdi file.
• Click on the
icon and select Tutorial_6-atoms.mol2 (the file that you created in Stage 8);
three Z-matrix files will be automatically generated.
• At this point DASH will identify that there are 9 independent parameters; three parameters each
for the positional coordinates of the three atoms (1 Zr atom and 2 W atoms). The parameters will
be then be listed along with their initial values and parameter bounds when you click on Next >.
Note that each atom is free to move anywhere in the unit cell and that each atom has a full
occupancy. As DASH does not have ‘anti-bumping’ constraints, multiple atoms are free to move
to the same site.
• Click Next > to access the Simulated Annealing Protocol window. Change the Profile chi-sqd
multiplier to 6.0, leave the remaining variables at their default values, click Next > and then click
Solve >. This set of SA runs will take a little while, but should converge eventually to a solution
with a profile χ 2 in the region of 5.75. Ideally each SA run should produce a solution with
approximately the same value of χ 2, suggesting that this is the correct solution and is
reproducible.
DASH User Guide
263
15.6.12 Stage 10. Analysis of Preliminary Solution
• Take a look at the solutions found by DASH individually by clicking on the View buttons for
each row in the Analyse solutions table.
• It should be obvious that the Zr atoms are aggregating on the origin, or one of the symmetry
equivalent positions to the origin in each case (e.g. 0, 0.5,0 or 0.5, 0, 0.5 etc.).
• The W atoms are also seen to aggregate, but these sit on the 3-fold axes of the unit cell. This can
be seen by turning on the symmetry elements in Mercury - click Display > Symmetry
Elements... The 3-fold axes should be shown as green vectors with no arrows on.
• In this case the fact that the atoms were each assigned full occupancy, rather than the correct
occupancy (which should be 1/3 as they each reside on the 3-fold axis) was not a problem
because the ratios of the atomic occupancies are correct. The incorrectly high occupancies used
are compensated by changes in the scale factor. Once the oxygens are included it will become
important to use the correct occupancies of 1/3 for the Zr and W atoms.
• The fit to the experimental diffraction pattern still shows a lot of differences as we have not
found the positions of the oxygen atoms.
• We can now use these positions that we have determined for the heavy atoms in the next cycle of
the structure solution in order to find the light atom positions.
• The coordinates of a general position on the 3-fold axis can be written as (x, x, x) - we have seen
that the Zr atom resides at the position (0, 0, 0). The positions of the two W atoms can be found
by clicking in Mercury on More Info > Atom List... Inspection of the W coordinates should
264
DASH User Guide
show that the average positions of the two atoms are (0.6, 0.6, 0.6) and (0.3412, 0.3421, 0.3412)
respectively.
• Click < Back to return to the DASH Wizard welcome window and select Simulated annealing
structure solution. Click Next > to continue.
15.6.13 Stage 11. Building the Full Model
• In order to fully solve the structure and determine the light atom positions we now need to set up
a more complicated structural model. We will continue to use a free Zr atom and use a
tetrahedral geometry for the tungstate moieties. As the W atoms are each on a 3-fold axis, the
rest of the tungstate tetrahedra must be represented by one partially occupied O atom on the 3fold axis and one fully occupied O atom lying off the 3-fold, with the remaining two O atoms
generated by symmetry.
• For the tungstate tetrahedra we can therefore use O-W-O fragments generated with ideal O-W
bond lengths and an ideal tetrahedral O-W-O bond angle. These fragments can be generated
using your preferred model building software, or using a file supplied with the tutorial,
Tutorial_6-atoms.mol2.
• The structure solution window will still show the same .sdi file as used previously along with
the atom z-matrices which we used in the preliminary solution.
• Click on the
icons to remove each of the atomic z-matrices. Next, click on the
icon
and select Tutorial_6-frags.mol2; three Z-matrix files will be automatically generated.
• We also need to edit the occupancies of the atoms on special positions. To do this, click Edit in
the row for the z-matrix. The atoms Zr1, W1, O1, W2 and O2 should be set as an occupancy of
0.3333 and the remaining two atoms (O3 and O4) should be left with a occupancy of 1.0 (e.g.
see below).
DASH User Guide
265
• The DASH Wizard will also confirm that you now have 15 independent degrees of freedom.
Click Next > to continue.
15.6.14 Stage 12. Setting up the Full Model Structure Solution
• In the Parameter Bounds window we now want to use the information gained during the
preliminary solution to fix the coordinates of the heavy atom positions.
• The Zr atom, as found earlier, sits on the origin. Fragment 1 corresponds to the free Zr atom, so
we can change the initial x(frag1), y(frag1) and z(frag1) values to 0.0 and click on the checkbox
in the F column for each of these rows to fix the coordinates.
• Fragments 2 and 3 correspond to the two O-W-O fragments and we can fix the coordinates of the
W atoms by simply putting in the initial values of x, y and z for fragments 2 and 3 as the W atom
corresponds to the origin coordinates for the fragment.
• Choose the coordinates of fragment 2 to be (0.6, 0.6, 0.6), fragment 3 to be (0.3412, 0.3412,
0.3412) and set these parameters to be fixed as well using the checkboxes in the F column. The
266
DASH User Guide
rows for these fixed parameters should now all be greyed out (see figure below).
• Click Next > to continue.
• In the Simulated Annealing Protocol window, choose a lower Profile chi-sqd multiplier (for
example 1.5 or 2.0) this time as we expect the fit to the experimental data to be even better now
as we are modelling the full structure. Also the O atoms have so few electrons compared to the
Zr and W atoms, which means that the O atom positions only have a small effect on the
diffraction pattern, so the correct solution is harder to find.
• Click Next > and then Solve > to start the Simulated Annealing process.
• This SA run is also likely to take a while as the differences between correct and incorrect
solutions are quite small in terms of the effect on the profile.
15.6.15 Stage 13. Examining the Final Structure
• The Analyse solutions window will now show the results of the SA runs. The runs may not all
have reached the same structural minimum and this can be seen by the range of final Profile chisqd values for the runs. Correct solutions should be identified by the lowest Profile chi-sqd and
Intensity chi-sqd values.
• Take a look at the solutions found by DASH for the full structure by clicking on the View button
for one of the top few solutions. Using the Packing feature of Mercury turned on, it should be
possible to see that the tungstate moieties have formed into nicely shaped tetrahedra, although
the O1 and O2 atoms may be slightly off the 3-fold axes. The ZrO6 moieties are also formed into
undistorted octahedra.
• The following figure shows an image of the solved structure in Mercury and the equivalent view
displayed using ZrO6 and WO4 polyhedra in the DIAMOND structural visualiser.
DASH User Guide
267
• Clicking on the Show overlay button in the Analyse Solutions window should also show that the
solutions fit with each other very well, which suggests that the solution is reproducible.
• In order to refine the structure in a meaningful manner there is a built-in rigid-body Rietveld
refinement module (see Section 11.1 of the DASH User Guide). To start a Rietveld refinement
from one of the structure solutions simply click on the Rietveld button for that row of the
Analyse Solutions table and choose the refinement package that you wish to use.
• Careful refinement of the bond angles and bond distances should cause the tungstate moieties to
assume a better shape.
15.6.16 References
DICVOL Program:
D. Louer & M. Louer (1972) J. Appl. Crystallogr. 5, 271-275.
A. Boultif & D. Louer (1991) J. Appl. Crystallogr. 24, 987-993.
Extinction Symbol Program:
Markvardsen, A.J., David, W.I.F., Johnson, J.C., Shankland, K. (2001) Acta Cryst., A57, 47-54.
Model Builder:
WebLabViewerLite Version 3.20 (12/8/98) Copyright 1998 Molecular Simulations, Inc.
Powder crystal structure ZrW2O8 (ICSD code 83267):
268
DASH User Guide
T. A. Mary, J. S. O. Evans, T. Vogt & A. W. Sleight (1996) Science 272, 90-92.
DIAMOND Program Version 3.0:
Crystal Impact, Crystal Impact GbR, Postfach 1251, 53002, Bonn, Germany (2004).
DASH User Guide
269