1
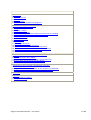
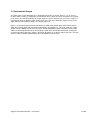
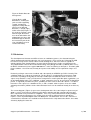
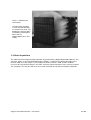
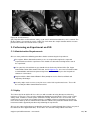
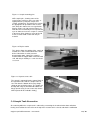
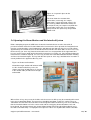
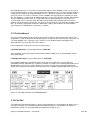
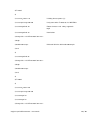
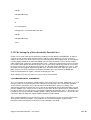
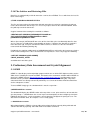
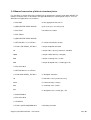
Technical Report
RAL-TR-97-038
User Guide for the Single Crystal
Diffractometer at ISIS
D A Keen and C C Wilson
September 1997
Single Crystal Diffractometer – User Guide
1 / 34
Contents
1. Introduction
1.1 Overview
1.2 Instrument design
1.3 Detectors
1.4 Data acquisition
1.5 Available sample environment equipment
2. Performing an experiment on SXD
2.1 Administration requirements
2.2 Safety
2.3 Mounting a sample
2.4 Sample tank evacuation
2.5 Installing sample environment equipment and instrument shielding
2.6 Opening the beam shutter and the interlock system
2.7 Accessing the FEM
2.8 The SXD workstation
2.9 The dashboard
2.10 The DAE
2.11 Instrument commands
2.12 The CRPT and CHANGE command
2.13 The CAMAC environment and useful commands
2.14 An example command file for control of the instrument
2.15 The Setting up of non-absolute encoding
2.16 The Archiver and restoring files
3. Preliminary data assessment and crystal alignment
3.1 GENIE
3.2 Data manipulation within GENIE
3.3 Identifying a principal reciprocal lattice row for alignment
3.4 Manual conversion of data to structure factors
3.5 Creating a 'Laue' plot from the data
4. Introduction to data collection and reduction procedures
4.1 Time-of-flight Laue diffraction
4.2 Bragg data collection and reduction in time-of-flight Laue diffraction
4.3 Diffuse scattering data collection and reduction procedures
5. Summary
6. Appendix
6.1 Useful telephone numbers
6.2 Eating and drinking
Single Crystal Diffractometer – User Guide
2 / 34
1. Introduction
This guide is intended to give a short description of the SXD single crystal diffractometer and to
provide the basic information required to perform a single crystal diffraction experiment. It will be
divided into three sections, covering an introduction to the instrument and ISIS, performing an
experiment on SXD and preliminary data assessment (including crystal alignment). Two appendices
are available separately, one concerned with Bragg intensity extraction and structural refinement and
the other with diffuse scattering data analysis, together with absolute normalisation of diffuse
scattering data.
1.1 Overview
The SXD diffractometer at ISIS operates as a general purpose single crystal diffractometer, using the
time-of-flight Laue technique. The utilisation of both the time-of-flight technique to sort the white beam
and large area position-sensitive detectors (p.s.d.'s) makes it possible to access large volumes of
reciprocal space in a single measurement. Experiments which exploit the large continuous coverage
of volumes of reciprocal space are most ideally suited to the instrument. These include diffuse
scattering studies where the features of interest are broad and often in unexpected regions of
reciprocal space. This diffuse scattering may result from thermally induced disorder (e.g. TDS), or
from local static distortions from crystalline disorder (e.g. defects in fluorites). Measurements on
magnetic materials which show satellite peaks can be readily accommodated on SXD, as can studies
of phase transitions, since prior knowledge of where to expect scattering to occur is not necessary.
Standard crystallographic refinements are of course also very successful, and use can be made of the
epithermal, short wavelength neutrons that are available on a pulsed source to allow measurements
to very high resolution (high sinθ /λ).
Figure 1. SXD layout
The general design of the
instrument is shown, with the
wavelength sorted (by the
time-of-flight technique, see
section 4.1) white neutron
beam arriving from the
moderator, incident on the
sample, which is often
contained in sample
environment kit. The
scattered neutrons are
detected in two or more two
dimensional position-sensitive
detectors (PSDs). The
combination of the PSD and
tof sorting yields data frames
containing full threedimensional reciprocal space
volumes.
Single Crystal Diffractometer – User Guide
3 / 34
1.2 Instrument Design
The SXD single crystal diffractometer is situated on beam line S3 at ISIS (Figures 1-3). It receives
neutrons from a 316K H2O moderator, poisoned with Gd at a depth of 2.0 cm, to improve the neutron
peak shape. The overall moderator to sample distance is 8.0 m and the beam size at the sample is a
maximum of 15mm in diameter, with various beam sizes able to be defined using B4C inserts in the
collimation box immmediately before the sample (Figure 4).
Figure 2. Instrument layout and view from above the SXD cabin (below right) SXD is located in the
South West corner ofthe ISIS Experimental Hall (R55), on beamline S3. The view shows the Target
Station, with the MAPS instrument in the centre and the KARMEN neutrino experiment on the right.
SXD is located roughly between the two. (below) Layout of the ISIS Experimental Hall, showing the
neutron and muon instruments. SXD is situated on beamline S3, at the top right of this plan. The ISIS
extrance Foyer and Main Control Room are at the bottom left in this plan.
Single Crystal Diffractometer – User Guide
4 / 34
Figure 3. General View of the SXD instrument, showing interlocked 'cage' (centre left), sevices panel
(centre) and racks containing detector electronics and pump control (right). This view was taken from
close to the MAPS sample position, with the target station wall on the far left.
Figure 4. Collimation Box and Collimators
The beam diameter on SXD is defined using B4C
'crispy-mix' collimators with various diameter
apertures. One of these is shown below, while
on the right are shown the vacuum box in the
beam line containing the collimation (top), and
with its shielding installed (bottom).
Single Crystal Diffractometer – User Guide
5 / 34
There is one sample tank with a 100 mm outer radius (Figure 5). This tank is normally evacuated to a
-5
nominal 10 torr using the instrument turbo pump, mounted downstream of the sample position,
although for much of the sample environment equipment these tanks must be removed (see
section 1.5).
Figure 5. Vacuum Tank
The 100 mm radius vacuum
tank, with the incoming and
outgoing beam pipes. When
installed, this tank forms an
integral part of the beamline
vacuum. In addition to
ambient experiments, the ωrotation CCR can be
installed in this apparatus.
Two of the area position-sensitive detectors (see section 1.3) are mounted on arms which allow
limited γ-rotation (varying 2θ for the centre of detector 1 between 90° and 130° which is mounted on
the high angle arm and 50° and 90° for detector 2, mounted on the low angle arm) and also manual
adjustment of L2, the sample to detector distance (Figure 6). This varies in the range 70<L2<500 mm,
dependent on sample environment equipment and detector. Detector 3 sits on the opposite side of
the neutron beam to detectors 1 and 2 and may be located at one of three fixed angles (2θ for the
detector centre at -55° , -90° or -125°).
Single Crystal Diffractometer – User Guide
6 / 34
Figure 6. Double Detector
Arrangement
View inside the SXD
blockhouse, showing the
yoke used for supporting
sample environment
equipment, along with the
typical set-up with two
detectors, 1 at high (right)
and 2 at low (left) angles. In
this view the neutrons arrive
from the right. Detector 3
was not installed when this
photograph was taken, but
would now appear behind
the instrument yoke in this
view. Shielding has been
removed for clarity.
1.3 Detectors
The development of detectors on SXD has been an evolutionary process, the detector being the
critical component determining whether such an instrument is successful or not. A detector for SXD
has to have a large active area to reduce overall counting times, but also it must be capable of
counting quickly, with short dead-times to cope with the locally intense single crystal Bragg peaks.
The polychromatic nature of the incident beam allows many Bragg reflections (>1000 in some cases)
2
to diffract simultaneously into a typical 200x200 mm active area during an ISIS pulse. Therefore good
pixel resolution, a fast count rate, linearity of response and stability are all required for a large area
PSD.
Previously an Anger camera was installed, and subsequently an ORDELA gas PSD. Currently, ZnS
scintillator PSDs are used on the instrument. The first of these, installed on the instrument in 1989,
was built as a prototype to develop the concepts of fibre-optic encoded ZnS PSDs. It consists of a
2
square array of 256 5 x 5 mm pixel elements arranged on a ceramic grid, fibre-optic encoded to a set
6
of 32 photomultiplier tubes. The scintillator, a single, continuous piece of ~0.4 mm thick Li-doped ZnS
2
plastic, is supported just above the pixels, providing an active area of some 80 x 80 mm . It is robust,
linear to 0.1 mm, quiet, has a deadtime of 2-3 µs and a smooth, stable response. It has the added
advantage that with a judicious choice of discriminator level it can be rendered virtually insensitive to γ
rays.
The current detectors (Figure 7) represent a development of the first, consisting of a square array of
2
4096 3 x 3 mm pixel elements, with only a thin Gd2O3 coated metal grid separating the four optic
fibres required for each pixel from its neighbours. It has very similar characteristics to the prototype
detector, but with the advantages of a smaller pixel size and, by utilising four-way coincidence,
2
requires a mere 32 photomultiplier tubes for 4096 pixels. The total active area is 192 x 192 mm . A
second of these detectors was installed on the instrument in the early 1995 and a third in June 1998,
effectively tripling the count rate.
Single Crystal Diffractometer – User Guide
7 / 34
Figure 7. SXD Detector
construction
The fibre-optic encoding
used in the SXD detectors
are shown in this view. The
64&nhbsp;x 64 pixel grid is
encoded by 16384 optical
fibres onto 32
photomultiplier tubes (not
shown)
1.4 Data Acquisition
The SXD instrument control and data aquisition are performed by a Digital Alphastation 500/333. This
computer, known as the Front End Minicomputer (FEM), is situated in the control cabin adjacent to
the main SXD user cabin (Figure 7). The nodename of this machine is SXD, and the standard
username for experimental control is also SXD. Your local contact will advise of the current password.
This computer is the only one which can be used for control of the experiment and data acquisition.
Single Crystal Diffractometer – User Guide
8 / 34
Figure 8. CAMAC and Data
Acquisition Electronics
Situated in the inner SXD
cabin within the main SXD
cabin, the rack containing
the the Data Acquisition
Electronics System Crate is
on the right, with the rack on
the left containing the
CAMAC controlled
electronics and beamline
shutter control.
The current instrument settings are contained in a file called the Current Run Parameter Table
(CRPT) and whilst the run is in progress the data are temporarily stored in the Data Aquisition
Electronics (DAE). At the end of the run the contents of the CRPT and DAE are automatically written
into a data file on the FEM and shortly afterwards this file is copied onto the archive system's optical
disk. The FEM has a limited amount of disk storage space, and SXD data files tend to be large
(~16000 VAX blocks even in compressed form), so data files are often deleted or moved to the SXD
storage disk (SXD$DISK1) soon after the end of each experiment. If deleted, they can easily be
restored from the optical disk to the FEM for analysis of the data at a later date (see section 2.16). All
the instrument FEMs and the central Alpha server (known as ISISA) are connected via an
ETHERNET link to form a cluster, allowing each computer direct access to the disk storage area of
any other computer on the cluster. Users logged on to ISISA can thus access data files stored on the
FEM, but the CRPT and DAE can only be accessed from the FEM.
Single Crystal Diffractometer – User Guide
9 / 34
1.5 Available Sample Environment Equipment
Although standard ISIS sample environment (SE) equipment can be accommodated on SXD, the
special requirements of the instrument means that SE equipment tends to be peculiar to the
instrument. This is because of the need to rotate single crystal samples, and to minimise background
scattering in a large area PSD which cannot easily be shielded. The following are available:
The standard sample vacuum tanks, providing ω-rotation at ambient temperatures
A liquid helium 50 mm bore 'Orange' cryostat (1.5-300 K). The tails have been adapted to
provide reliable ω-motion and minimise unwanted scattering (Figure 9). Samples up to
35 mm in diameter can be accommodated.
A standard RAL vanadium element furnace (293-1200 K), in which a sample centre-stick
provides ω-rotation. Samples up to 35mm in diameter can be accommodated.
A two circle orienter (χ−φ rotations, Figure 10) including a Displex cooler (12-300 K).
Maximum sample size of about 10 mm on a side, and only the detectors on the positive 2θ
side of the instrument can view the sample.
A standard RAL CCR with ω-rotation (10-300 K). This fits inside the SXD vacuum tank giving
very low background scattering.
A high pressure He gas cell (<6 kbar) and McWhan cell (<25 kbar),which both fit inside a
100 mm bore 'Orange' cryostat. Both cells have a 6mm internal diameter and manual ωrotation.
A dilution fridge insert for cryostat for temperatures down to ~40 mK. Manual ω-rotation only.
Figure 9. SXD Cryostat
(left) The design of the SXD cryostat tails allow for a short sample-detector distance.
(right) The cryostat installed on the beamline.
Single Crystal Diffractometer – User Guide
10 / 34
Figure 10. 2-circle orienter
(left) Top view of the 2-circle orienter, with χ set to zero, in which orientation the φ axis is vertical. The
Displex cooler is inserted in the centre. (right) This view shows the sample chamber with its vacuum
port and also shows the encoder for the φ angles.
2. Performing an Experiment on SXD
2.1 Administration Requirements
All users must perform the following procedures before commencing their experiment:
Pre-register. When allocated beamtime, users are requested to register the expected
experimental team for the experiment. This should save time when arriving for the start of
the experiment
If it is your first visit to ISIS then you should visit the University Liaison Office (R3, Upper
Ground floor, Room UG3 x5592, FAX 5103, email [email protected]). The ULO can also deal with
accommodation and local transport arrangements and should always be the first point of
contact on such matters.
Register with the Main Control Room in R55 (x6789) to receive 'Permits to Work' and
temporary film badges.
Security swipe cards are neccessary for access to the ISIS experimental areas. These will
be issued by the Main Control Room on arrival.
2.2 Safety
The University Liaison Office will issue all users with a number of safety documents when they
register as a new user. These must be read before beginning an experiment. There is also an ISIS
Safety video, available at various points around the Facility, which new users must all view, and
returning users must view at six monthly intervals. In addition, all those performing an experiment
must ensure that they discuss with their local contact in advance the particular hazards on the SXD
instrument and the approved procedure for performing the experiment.
All users are requested in advance to complete and return a ‘Sample Record Sheet’ (these are part of
the ISIS Beam Time Application form). These forms are stored in a filing cabinet in the Data
Single Crystal Diffractometer – User Guide
11 / 34
Acquisition Centre in R55 and the sample record sheet for the sample being run on the instrument
should be displayed in the pocket on the side of the instrument ‘cage’ for the duration of the
experiment. The reverse of the form will contain comments (if any) from the ISIS Safety Section
concerning possible chemical and radiological hazards associated with the sample. Any
recommendations concerning the sample handling etc. must be followed and the form should be
stored with any samples remaining at ISIS after the experiment. All samples which have become
activated by neutron irradiation must be stored in a controlled area, which for SXD is the SXD active
samples cupboard, located downstairs from the SXD cabin. Movement of samples in and out of this
cupboard should be logged in the SXD active sample log book.
When removing samples after irradiation the safety regulations concerning monitoring of induced β
and γ activity and transferral of samples from cans must be followed. It should be noted that vanadium
sample cans (and to a lesser extent aluminium) may become activated in the SXD beam (activated
vanadium is a β emitter with a half life of ~½ hour). At the end of the experiment all samples which
have been run on SXD must be monitored by the ISIS Health Physics Group (x6696) before being
removed from the Experimental Hall.
2.3 Mounting a Sample
In most cases it is extremely advisable to discuss this aspect of the experiment with your Local
Contact well in advance of the experiment, as poorly mounted or difficult to mount samples can cause
unnecessary delays to your experiment.
For the most commonly used SXD sample environment, general guidelines for sample mounting are
given below:
SE equipment
Distance to beam centre from fixed point
Adjustable
Cryostat
1271mm from underside of top brass flange
CCR orienter
276mm from recessed underside of top flange no
Type of pin
yes ~2 cm 6 mm diameter pin
6 mm diameter pin
CCR (ω-rotation) 325mm from underside of outer top flange
yes ~2 cm 6 mm diameter pin
Furnace
yes ~2 cm 4 mm male thread
386mm from underside of top flange
Aluminium sample pins of 6mm diameter are available which include a taper to 1mm diameter, such
that the minimum amount of material will be in the beam whilst still supporting the sample (Figure 11).
For room and low temperature experiments, it is often most convenient to glue the samples directly to
the pin using rapid setting Araldite. As much of the glue as possible should be masked by cadmium to
reduce hydrogen scattering. It is important to allow the glue sufficient time to set (typically one hour)
and not to jolt the sample on mounting into the apparatus. Other, quicker mounting methods which
may be used include forming a thin aluminium foil sachet to contain the sample and using aluminium
tape to fix the sachet to the mounting pin or even using very thin strips of aluminium tape to form a
cage around the sample which is stuck directly onto the mounting pin. Samples for the furnace should
be wired, or glued using high temperature cement, onto a stainless steel or similar sample pin.
Gadolinium masks must be used if shielding is required in the furnace - low-melting cadmium must
never be used. For diffuse scattering experiments it is preferable, but not essential, to have an aligned
sample, such that the reciprocal plane of interest scatters in the equatorial plane of the instrument.
This makes analysis of the data more straightforward. Detailed operation of the sample environment
equipment, e.g. use of exchange gas in the cryostat, is outside the scope of this manual and SE
Group staff or the local contact should be consulted for instruction. There are also guidelines available
in notices in the SXD instrument cabin.
Single Crystal Diffractometer – User Guide
12 / 34
Figure 11. Sample mounting pins
SXD sample pins, showing some of the
varied shapes and sizes these can take, as
appropriate for a particular sample and
sample environment. The longer pins tend to
be appropriate for operation in the vacuum
tank, while the shorter ones are required for
Displex (Figure 12) and cryostat (Figure 13).
Note that it is occasionally necessary to bend
a pin in order to ensure the sample is centred
in the beam. Also shown are some of the Cd
masks used to avoid scatter from the pin
material.
Figure 12. Displex cooler
This device allows for cooling of the sample to
around 12 K, and is mounted into the 2-circle
device. Most often used for structure
determination work. (right) The sample is
mounted into the copper block at the left hand
side, with the pin held by a 1.5 mm hex-head
set screw.
Figure 13. Cryostat centre stick
The sample is mounted into the copper block at
the right hand side, with the sample centre at
1271 mm from the bottom of the large flange
shown on the left of this picture. The height can
be adjusted using the knurled knob above this
flange (out of view). [A new centre-stick for the
SXD cryostat will be available shortly.]
2.4 Sample Tank Evacuation
Air scattering within the sample tank is reduced by evacuating the chamber before data collection.
Having ensured that the vent valve on the top of the vacuum tank is closed, and that the collimation
Single Crystal Diffractometer – User Guide
13 / 34
box lid is sealed, the pump is operated by pressing the furthest right square button on the pumping
panel in the bottom of the right-hand electronics rack (see Figure 14). To bring the vacuum up to room
pressure simply turn off the pump and open the vent valve on the top of the vacuum tank. Clearly this
section is only applicable to those experiments which use the sample tank. Attempting to operate the
vacuum system without the sample tank will cause damage to the pump.
Figure 14. The Detector Electronics
Racks.
The vacuum pump control box is
located in the bottom of the right-hand
rack.
2.5 Installing Sample Environment equipment and instrument shielding
The sample environment equipment (cryostat, 2-circle orienter, furnace or vacuum tank) should
always be located into the instrument by the instrument scientist, your Local Contact or ISIS technical
staff. Once the apparatus is in position on the instrument and the sample is mounted on the centre
stick, Displex, furnace insert or CCR, this should be carefully lowered into place (Figure 15). Only the
most experienced users should attempt this alone - in most cases your Local Contact will assist or
provide detailed instruction. Once the sample is in position and the SE equipment is set up, you muct
remember to replace the borated polythene ‘lid’ on top of the SXD shielding cage. A small cut-out to
the side of the cage, or a plug on the top is available if sample envoironment pipes or cables must
pass through the shielded cage. Only once this has been done are you in a position to make the
interlocks and prepare to open the shutter (section 2.6). Before completing the instrument shielding,
the successful operation of any sample rotation devices, temperature sensors, vacuum systems etc
should be checked and if necessary rectified at this stage. The shutter should only be opened once
the experiment is properly set up.
Single Crystal Diffractometer – User Guide
14 / 34
Figure 15. Cryostat in place on the
instrument
The view shows the w motor drive
connections (centre top), the sample
temperature sensor connector (centre), the
He recovery (hidden behind the motor), the
N2 fill (on the left), the sample evacuation line
(centre right) and, in this case, the Rootes
pump vacuum line (lower left), for operation
below 4.2 K.
2.6 Opening the Beam Shutter and the Interlock System
Before attempting to open the SXD beam shutter the interlocked area must be cleared of all
personnel and then locked. If the lower door to the instrument has been opened, the interlocked area
must be searched and the search button on the wall opposite the door must be pressed. This allows
approximately 30 seconds to leave the interlocked area and close the lower door. It is then necessary
to take the key (an 'S3-S' key) from the lock and insert it in a vacant position in the uppermost blue
key rack, on the target station wall in front of the instrument (see Figure 16). If the top hatch above the
instrument has also been opened, it is necessary to cover this hatch with borated wax block shielding
and close the interlocked gate. The key from this lock (also an 'S3-S' key) should then be inserted in a
vacant position in the uppermost blue key rack.
Figure 16. Shutter and interlocks
Situated on target station wall infront of SXD
are the shutter interlock key racks, the
shutter status box (of which there is also one
in the control cabin) and the beam on light
and monitor
When all 'S3-S' keys are present in the blue rack the master 'S3-M' key may be removed and inserted
in the green control box below. The master key should be turned 90° so that it is vertical. The user
should then check that the four red LEDs on the orange box above the blue key rack are lit, indicating
that the interlocked doors are in the correct state and the emergency 'beam-off-buttons' have not
been tripped. Any attempt to open the shutter without all four LEDs being lit will immediately cause
the ISIS accelerator to trip - an unpopular consequence! If there are any difficulties with the interlock
Single Crystal Diffractometer – User Guide
15 / 34
system, the user should immediately contact the local contact, an instrument scientist or the ISIS
Main Control Room (x6789).
It is not possible to open the shutter unless the master key is correctly positioned in the green control
box. The beam shutter is opened and closed by pressing the 'open' and 'close' buttons in one of the
beam control units, which are sited near the instrument and in the SXD cabin. The shutter takes
approximately one minute to open or close. When the shutter is open the master key cannot be
removed from the green control box, the red 'beam on' lights are lit as are the blue warning lights in
the interlocked areas to which there is no access.
If one finds oneself inside an interlocked area when the blue warning lights illuminate, the large red
'Beam Off' button should immediately be pressed and the ISIS MCR called (x6789) once the area has
been evacuated.
2.7 Accessing the FEM
The SXD Front End Minicomputer (FEM) controls the instrument and its data acquisition, and the
main terminal is situated in the instrument cabin. The colour workstation is used to control the
instrument, run the dashboard, run the GENIE data display software and perform preliminary data
analysis. These tasks are all possible simultaneously because it operates under Motif X-windows
software (see below). Its nodename within the ISIS VMS-cluster is SXD. Full instructions on the use
of the features of the SXD workstation are outside the scope of this manual, and only a brief outline is
given below.
Figure 17. Typical working view in the cabin.
Note the multiple windows on the SXD DEC
Alpha workstation, the proximity of the
carefully maintained instrument log book and
the ISIS beam status black display box.
2.8 The SXD workstation
Usually the SXD workstation is permanently logged on, with a current session in use. If for any reason
this is not the case (e.g. the computer has crashed), a welcome message appears in the middle of the
screen. To initiate a session on SXD, type SXDMGR as the username, and the appropriate, current
password (available from the instrument scientists). This will then start up a windows session, with a
'session manager' menu bar on the bottom of the screen, and possibly a clock and other windows. In
order to create more windows, press the left-hand mouse button (LHMB) on the arrow above the
terminal icon in the 'session manager' to pop up the menu. Again with the LHMB, highlight the
'DECterm' option. Releasing the LHMB on the 'DECterm' option will create a DECterm window, which
Single Crystal Diffractometer – User Guide
16 / 34
will automatically log in as a terminal session on SXD. When several window sessions are present, it
is only possible for the user to be connected to any one window at a time. To move between windows,
simply click the LHMB in the required window area. It is sometimes useful to reduce windows which
are not in current use to icons. To do this, click the LHMB in the top-right square containing a small
dot. This produces a small icon in the bottom right of the screen. To restore this window, either double
click the LHMB when on this icon, or a single click with the LHMB will pop up a menu where the
'restore' option can be selected. Other operations can be deduced by trial and error, for example
windows may be deleted, or changed in size, but it is not advisable to create too many windows (more
than ~4) and many applications or alter the workstation settings. Do not delete all of the windows,
especially the one controlling the instrument (see below).
2.9 The Dashboard
The instrument dashboard shows details of the current instrument setup and experimental run. The
dashboard is usually displayed on the window which is in control of the instrument, the 'supervisor'. To
see which window is the 'supervisor', type <CTRL-T> in the window and the timing details are
displayed which also show the name of the process.
If the dashboard is not present it can be created by typing:
$ STATUS ON<return> (can be abbreviated as STAT ON)
at the keyboard, having clicked the left-hand mouse button (LHMB) in the required window. To turn
the display off type:
$ STATUS OFF<return> (can be abbreviated as STAT OFF)
in the window showing the dashboard display. At the top of the display the current DAE state
(RUNNING, SETUP, PAUSED etc.) and the run number are shown. The remaining information on the
dashboard gives the run time, frame (proton pulse) count, present and accumulated proton beam,
details of the incident beam monitor count and status of the CAMAC controlled apparatus (Figure 18).
Figure 18. The SXD instrument control DASHBOARD
2.10 The DAE
The DAE (Data Acquisition Electronics) governs data collection for each individual run. Whilst a run is
in progress the data are temporarily stored in the DAE and when it is completed the final data are
automatically stored in a run called SXDnnnnn.RAW on the FEM (in area
Single Crystal Diffractometer – User Guide
17 / 34
SXD$DISK0:[SXDMGR.DATA], assigned the logical name D:). 'nnnnn' is a five figure run number
which is automatically incremented at the end of each run. Shortly after creation, this file is also
copied onto the archive storage system. The current DAE mode and run status is displayed on the
dashboard (see Figure 18). The possible modes of the DAE are:
SETUP
Data are not currently being collected. The instrument parameters etc
may be changed if necessary before starting a run.
RUNNING Data are currently being collected and being stored in the DAE
PAUSED
Data collection temporarily suspended by the user (usually to allow
temporary access to the interlocked areas).
Data collection temporarily suspended by the FEM. This may occur if
WAITING CAMAC has run control set for SE blocks such as temperature which
are outside their specified range.
2.11 Instrument Commands
Data collection is controlled by the Instrument Control Program (ICP). This program changes the state
of data collection, either by user intervention, or because of flags obtained from the CAMAC sample
environment control program. There are seven basic commands which change the state of the DAE.
These commands must be typed at the 'supervisor' window/terminal (see section 2.9 to determine
which window this is). They are listed below.
Command
Action
$ BEGIN <return>
Sets DAE memory to zero
Sets parameters in DAE to those specified by CRPT
Instructs the DAE to start data aquisition
Sets DAE state to RUNNING
$ PAUSE <return>
Suspends data collection by DAE
Sets DAE state to PAUSED
$ RESUME <return> Resumes data collection by DAE following a PAUSE
Sets DAE state to RUNNING
$ END <return>
Stops data collection by DAE
Copies contents of DAE memory and CRPT to file 'SXDnnnnn.RAW'
Increments the run number 'nnnnn'
Sets DAE state to SETUP
$ ABORT <return>
Stops data collection by DAE
Data are NOT stored
Sets DAE state to SETUP
Single Crystal Diffractometer – User Guide
18 / 34
$ UPDATE <return> Updates the DAE contents with most recent data
DAE remains RUNNING
$ STORE <return>
Copies contents of DAE memory and CRPT to file 'SXDnnnnn.SAV'
DAE remains RUNNING
2.12 The CRPT and CHANGE Command
The Current Run Parameter Table (CRPT) file acts as an intermediate data storage file between the
DAE and the final stored raw data file on the FEM. It also contains information on the instrument
settings and configuration (the time channel widths, monitor spectrum etc.), plus some concerning the
current experiment (sample title, users' names etc.). All this information is stored with the raw data in
the SXDnnnnn.RAW file on the FEM at the end of the run.
It will usually be necessary to change some of the contents of the CRPT at the beginning of the
experiment. This should be done in consultation with an instrument scientist or your Local Contact.
The relevant command to type is
$ CHANGE/NOT <return>
at the 'supervisor' window, when the DAE is in SETUP mode. The /NOT(ABLES) parameter
suppresses the loading of software tables which should remain unchanged and speeds up the
CHANGE command. The screen then displays the first page of the current CRPT. The values in the
various fields are altered using the DEFT screen editor, full details of which are in the PUNCH
manual. Cursor keys move between fields and the keypad '.' key toggles between options. The most
common fields to change are the time channel ranges and widths, or the title. To exit from the editor
the user should press the <PF1> key followed by 'E' to overwrite the CRPT with the new values, or
followed by 'Q' to leave the CRPT as it was prior to the editting session. Some simple alterations can
be made without entering the DEFT editor, the most useful one being changing the title, i.e.
$ CHANGE TITLE BAF2_T=100K_w=123 <return>
or (to allow spaces and lower case letters)
$ CHANGE TITLE """BaF2 T=100K w=123"""<return>
2.13 The CAMAC Environment and Useful Commands
For full details of the CAMAC system, users are directed towards the PUNCH user guide, although
commands specifically useful for SXD operation are shown here. The dashboard shows the status of
the current CAMAC controlled operations. Temperature and sample motions are controlled by the
CAMAC crate, and each operation has a block assigned to it, for example:
TEMP
Controls the temperature fed into the right hand Eurotherm:
the control temperature for the cryostat and CCRs;
the sample temperature on the furnace
Single Crystal Diffractometer – User Guide
19 / 34
TEMP1
Controls the temperature fed into the left hand Eurotherm:
the control temperature for the furnace;
the sample temperature for the cryostat and CCRs
OMEGAF
ω-rotation on the furnace [0° < ω < 350° ]
WCCR
ω-rotation on the CCR [-159° < ω < 159° ]
CHI
χ arc on the two circle orienter [0.1° < χ < 90° ]
PHI
φ arc on the two circle orienter [0.1° < φ < 179.9° ]
A block is changed by the CSET command, and information concerning the block is displayed by the
CSHOW command:
$ CSET TEMP {/RANGE=n} {/(NO)CONTROL} nn
$ CSET OMEGAF nn {/WAIT}
$ CSHOW TEMP1/FULL
$ CSHOW PHI/ENQUIRE
Where those parts bracketed are optional qualifiers - see PuNCH manual.
2.14 An Example Command File for Control of the Instrument
During the running of an experiment, there are frequent changes to sample position, temperature etc.
Therefore it is useful to be able to set up a series of commands which will be acted on in sequence by
the instrument. This is done using a command file which is activated, in the 'supervisor' window by the
command:
$ @SXD$DISK0:[SXD.SUBDIR]scan_file.COM
Care must be taken since often the 'supervisor' window is not in the same directory as the file.COM
file, hence the explicit nature of the above command. The command file may be interrupted at any
time using <Ctrl-C> or <Ctrl-Y>, but it should be remembered that if the command file is subsequently
restarted, the commands which have already been acted upon by the instrument should be deleted
from the start of the command file. The command file should not be interrupted during the operation of
either BEGIN or END - this will often cause the Instrument Control Program to hang.
The following command file was used to collect data on a defect fluorite crystal on SXD, at a range of
temperatures and orientations. It shows the basic structure of a command file.
SCAN.COM for (Ca,Y)F2+x hot experiment
$ cset temp1/control
! Run control on TEMP activated
$!
Single Crystal Diffractometer – User Guide
20 / 34
$! T=250C
$!
$ cset max_power1 10
! Limiting furnace power (%)
$ cset temp1/range=20 280
! Only count when T=280±10, else WAITING
$ cset omegaf/wait 70
! Rotate furnace w n.b. always approach
angle
$ cset omegaf/wait 78
! from below
$ change title """CaYF2.06 250C om=78"""
$ begin
$ waitfor 500 uamps
! Wait until ISIS has delivered 500uamp.hr
$ end
$!
$ cset omegaf/wait 85
$ change title """CaYF2.06 250C om=85"""
$ begin
$ waitfor 500 uamps
$ end
$!
$! T=400C
$!
$ cset max_power1 20
$ cset temp1/range=20 430
$ cset omegaf 70
$ cset omegaf 78
$ change title """CaYF2.06 430C om=78"""
Single Crystal Diffractometer – User Guide
21 / 34
$ begin
$ waitfor 500 uamps
$ end
$!
$ cset omegaf 85
$ change title """CaYF2.06 430C om=85"""
$ begin
$ waitfor 500 uamps
$ end
2.15 The Setting Up of Non-absolutely Encoded Arcs
Certain arcs used on SXD are not absolutely encoded (currently WCCR and OMEGAF). In order to
set them up (for example if the computer fails to read the resolver properly), it is necessary to reinitialise the resolver. To do this, the arc must be manually driven to its negative limit, by selecting the
relevant motor position on the drive box RMI08 in the left hand electronics crate in the inner SXD
cabin, with the box set to local, and the direction set to '-'. When the negative limit has been reached,
the red limit switch light on the box will go out. Care must be taken with this operation to ensure that
He pressure lines etc. are not twisted excessively. The direction switch should then be set to '+', and
the motor manually 'jogged' approximately 800 steps, or until the limit switch lights up again. At this
point, all the zeros on the electronics box RDC03 should be pressed, and then the RMI08 box
returned switched back to 'remote' such that the display goes out.
At the computer terminal, it is now necessary to run the command file
$ @CAMAC$DIR:SETUP_GONIOMETER
The user responds to the prompts, initially with the name of the arc in question, followed by a series of
carriage returns to select the default values until two yes/no questions are asked, which should be
answered in the affirmative. Please do not change the default values for the arc settings. This
command file reloads the parameters necessary for the computer to convert the information received
from the CAMAC crate, and resets the resolvers to zero (close to) the negative limit. It should now be
possible to move the arc and receive a meaningful reading on the computer. If this is still not the case,
it may be necessary to reload the CAMAC software, which should be carried out as a last resort, and
can only be done by computer support (mobile telephone number 3029)
After restarting CAMAC, it may also be necessary to subsequently reset the arc to the negative limit
and repeat the above proceedure. If any problems are encountered with this slightly 'fragile'
procedure, your local contact or instrument scientist should be consulted.
Single Crystal Diffractometer – User Guide
22 / 34
2.16 The Archiver and Restoring Files
Data files are automatically archived soon after a run has been ENDed. To see which was the last file
to be archived type:
$ TYPE SYS$PUBLIC:ARCHIVE.STATUS
The files are large and are therefore often deleted soon after the end of an experiment. In order to
restore them for further data analysis, it is necessary to place them on the SCRATCH$DISK, where
they will only remain for two weeks.
A typical command for restoring files would be as follows:
$ RESTOD/CAT=SXD$DISK:[SXDMGR]CATALOGUE.941 /OUT=SCRATCH$DISK:[SXDMGR]SXD05911.RAW [SXDMGR.DATA]SXD05911.RAW
Where (for example) CATALOGUE.941 refers to files from ISIS cycle 1/94. Normally data files that
are less than one year old will be restored within 10 minutes. If however the data that is required is
from some time ago, it may be stored on the offline archiver, in which case the files will not be
restored until the following working day.
Periodically, the working subdirectories of SXD$DISK0:[SXD] are archived by the instrument scientist
under a local catalogue file. If these archived files are required, it is necessary to type the following:
$ SET DEF SXD$DISK0:[SXD.SUBDIR]
$ DAVE_ARCHIVE_SETUP
and follow the instructions given.
3. Preliminary Data Assessment and Crystal Alignment
3.1 GENIE
GENIE is a data display and manipulation program which runs on all the DEC Alpha machines on the
VMS cluster, including the instrument FEMs. Full details of the commands available within GENIE are
given in the GENIE manual (Report RAL-86-102, "PuNCH Genie Manual") and Appendix 2 of the
PUNCH manual (available from the computer support office, Room 1.38 building R3). Only those
commands which are directly relevant for preliminary assessment of the data will be described here
and in subsequent sections.
To enter GENIE simply type in a window which is not the 'supervisor':
$ GENIE/SCALE=0.7 <return>
The window will display the GENIE header at the top of the screen, print some lines of text and then
give the prompt >>. GENIE allows the user to inspect and manipulate the time-of-flight spectra from
individual detector pixels, sum them together, convert from time-of-flight to d-spacing or Q etc. The
data from run number 3018, for example, is accessed by typing:
>> ASSIGN 3018 <return>
When logged onto the FEM it is also possible to investigate the data currently being collected and
stored in the DAE by replacing '3018' with 'DAE' in the above command.
Single Crystal Diffractometer – User Guide
23 / 34
3.2 Data Manipulation Within GENIE
Each individual pixel in the detector is related, in the data, to a spectrum number. The convention
used on SXD is that, when viewing the face of the detector from the sample, the pixel in the lower
right-hand corner is spectrum 1 (S1). The spectra then increase in number vertically up the right-hand
side, before moving left into the next column (Figure 18). This means that the lower numbered spectra
correspond to detector pixels at smaller 2θ.
Hence, for a square 4096 pixel detector, the spectra are numbered thus (looking from the sample
position):
4096
--
- - 128 64
--
--
--
--
4065
--
2081
2017
--
33
4064
--
2080
2016
--
32
4033
2θmax
--
--
--
--
--
- - 65
2θcen=γ
Equatorial plane of instrument
1
2θmin
Figure 19. Spectrum numbers on the detector. Note that the second SXD detector has spectrum
numbers offset by 4100 from these and the spectrum numbers of the third detector start from 8201.
Spectrum 4097 is the incident beam monitor.
If one wishes to look at the raw data from the detector, for example, to check the crystal alignment, or
if the plane to be examined is equatorial in the detector, then the simplest thing to do is to use some
local utilities within GENIE. These are basically simple summations of strips up the detector, which
are then plotted in 2θ steps using the MULTIPLOT command.
To sum from the DAE with a square detector (normal configuration) type:
>> @DP:SUMDAE lo hi ndet
where lo is the lowest row to be summed, hi is the highest and ndet is the number of the detector
required.
To sum from a previous run in the normal configuration type:
>> @DP:SUM lo hi ndet run_no uamps
Single Crystal Diffractometer – User Guide
24 / 34
where run_no is the run number and µamps is the number of µΑhours for which that run was
collected. DP:SUM divides by µamps.
These commands put the data into GENIE workspaces W1 to W64 which can be plotted in the usual
way using the MULTIPLOT command (see GENIE manual for full details). Often the choice of the
parameters of the MULTIPLOT have to be carefully chosen in order to achieve a good looking and
useful plot. Another useful command for inspecting an individual peak sums up a square surrounding
a specified spectrum (spec_no):
>> @DP:CENTRE spec_no nsurr
where nsurr is the distance (in pixels) to radiate from spec_no (maximum of 4). For example 3 would
add all spectra ±3 pixels from spec_no, ie 49 spectra. This command places the summed data in
workspace W10 (note that to use this command for detector 2, 4100 should be added to the spec_no,
etc.).
The explicit commands for printing out hard copies from GENIE are (after plotting the required picture
on the screen):
>> KEEP/HARD
>> J "PRINT/QUE=POST$LSR8 DEC_POSTSCRIPT.DAT
This prints the picture on the laser printer in the SXD cabin. Other printers can also be accessed from
SXD, for example POST$LSR0 is in the Computer Support Office in R3.
3.3 Identifying a Principal Reciprocal Lattice Row for Alignment
The first requirement for any experiment is to check the crystal quality and alignment. The former can
be quickly assessed using the above MULTIPLOT procedure (and the rapid assessment of sample
quality is a tremendous strength of SXD). The latter can be done either automatically using the
autoindexing software (see Appendix on intensity extraction and structural refinement) or manually
(especially in the case of aligned or high symmetry crystals). For the latter it is necessary to locate
Bragg peaks which are scattering into the detector and which can be identified from their d-spacing.
Clearly such reflections tend to occur at longer time-of-flight (larger d-spacing). Although peak
searching routines are available, often the most straightforward method is to make use of the routines
within GENIE described in the previous section. @DP:SUMDAE can be used to collapse the whole
detector area onto the 2θ axis, which can then be displayed using MULTIPLOT. This plot can then be
inspected to locate reflections at long times-of-flight (which are the most likely to be unambiguously
indexed), and the workspace which they occur in can be found (W'peak'). Displaying W'peak'
individually will show (in the display header block) the spectrum number corresponding to the lowest
spectrum in the vertical summation (S'min'). The MULTIPLOT command can then be used to display
the individual spectra which were summed into this workspace, and the spectrum which has the
maximum intensity in the peak can be found (S'peak'). A suitable series of commands for a 64x64
detector would be:
>> @DP:SUMDAE 10 54 64
! collapses data onto 2θ axis
>> MU W1>W64 1000 20000 4 1 10
! displays collapsed data
>> MU W20>W40 1000 20000 4 1 10
! displays collapsed data closer to W'peak'
>> D W'peak'
! identifies S'min' from header
Single Crystal Diffractometer – User Guide
25 / 34
>> MU S'min'>S'max' 1000 12000
! displays contents of W'peak'
(S'max'=S'min'+[54-10] in this case)
>> D S'peak'
! displays peak spectrum
>> D S'peak±64'
! checks those around S'peak' horizontally
>> D S'peak±1'
! checks those around S'peak' vertically
The spectrum S'peak' in which the maximum intensity is found can then be used to determine the
position of the peak on the detector face (see Figure 19).
j = remainder of [(S'peak'-('idet'-1)*4100)/64]
i = integer value of [(S'peak'-('idet'-1)*4100)/64]+1
j gives the height of the reflection in the detector and i is related to the 2θ value thus:
-1
2θ = tan {[i-ndet/2]*pix/L2}+γ
'ndet' is the horizontal number of pixels in the detector (usually 64) and 'pix' is the size of the individual
pixels (typically 3 mm). L2 and γ for each detector are known from the instrument calibration. Care
must be taken to get the correct 'sense' of 2θ, particularly for detector 3. The following set of GENIE
commands then convert the peak into d-spacing:
>> W1=S'peak'
>> SET PAR W1 'L1' 'L2' '2θ
θ' 0 0
>> U/D W1
>> D W1
Having located and identified one reflection, others may be brought into the detector by suitable
rotations of the sample, and the crystal alignment can be quickly determined. There are several
utilities available for determining the crystal rotation angle between given reflections, which can help
this process. These routines are run outside GENIE by typing:
$ RUN DP:A
(for cubic systems)
$ RUN DP:AORTH
(for orthorhombic systems)
$ RUN DP:AHEX
(for hexagonal systems)
$ RUN DP:AMONO
(for monoclinic systems)
One of the strengths of SXD may readily be seen from a spectrum containing a principal lattice row:
an individual spectrum in the SXD detector contains reflections in a Laue row, separated in time-offlight (t-o-f, or l , see section 4.1). Hence if, for example, the 113 reflection is observed at t-o-f113, then
the 226 is found at t-o-f113/2 and the 339 at t-o-f113/3 etc. all in the same pixel element.
Single Crystal Diffractometer – User Guide
26 / 34
3.4 Manual conversion of data to structure factor
It is sometimes useful to convert the raw data into an approximate structure factor within GENIE. The
rigorous treatment of this is described in the Appendix on diffuse scattering data analysis - here we
will outline an approximate set of routines.
>> ASS DAE
! or the appropriate data run no
>> @DP:CENTRE 'PEAK' NSURR
! peak is the spec. no. of the peak
>> W11=W10
! vanadium run number
>> ASS 'VRUN'
>> @DP:CENTRE 'PEAK' NSURR
>> SET PAR W11 L1 L2 2TH 0 0
! L2 and 2θ calculated as before
>> FU W11 DP:SEARS_TOF W12
! sample absoption correction
.50
! sample radius ! (these parameters should be
.0600
! sample number density ! changed)
6.00
! sample scattering cross section
5.00
! sample absorption cross-section (@λ=1Å)
>> W11=W11/W12
>> SET PAR W10 L1 L2 2TH 0 0
>> FU W10 DP:SEARS_TOF W12
! V absoption correction
.25
! V rod radius ! these parameters may
.0722
! V number density ! change
4.95
! V scattering cross section
2.83
! V absorption cross-section (@λ =1Å)
>> W10=W10/W12
>> W11=W11/W10
>> U/LAM W11
>> FU W11 [SXD.CCW]LAM4 W12
Single Crystal Diffractometer – User Guide
! reflectivity correction
27 / 34
>> D W12
! corrected data
These routines take the spectrum containing the peak(s) of interest and sum it up with neighbouring
spectra to obtain an integrated intensity. This is then done for the identical spectra for a vanadium
run. The vanadium run is then corrected for absorption, and the sample data are divided by the
4
absoption corrected vanadium data. The data are then corrected for the λ reflectivity, and the result
2
is a pattern where the intensities of the peak(s) are proportional to |F| . No account is taken of the
2
Lorentz factor (1/sin θ ), but this is a constant within a single Laue row, and no account is taken of the
extinction. It should also be noted that if the peaks are extremely sharp it is not always precise
enough to sum the data and divide by the summed vanadium, it may be neccessary to divide the data
by vanadium pixel by pixel, since the detector response is not uniformly smooth.
3.5 Producing a Laue Plot of the Data
To produce a Laue plot of the data, it is necessary to integrate the whole time-of-flight range for each
pixel, and then plot out the result. To do this, in the 'supervisor' window type:
$ UPDATE
$ SUM
which produces a file called SUMSPEC.ANS from the dae (the current run). This file can be plotted by
running the program DP:PLOT3D_SUMSPEC. If you want to inspect a previous file (in which case
this process is lengthy) the commands are:
$ EXP4
to expand the RAW data file into 3 separate files, one for each detector (please delete the expanded
files after use - they are very large).
$ SUM
the filenames (SXD’nnnnn’.EXP'm', m=1,2 or 3) must be typed in explicitly.
4. Introduction to data collection and reduction procedures
As with most modern automated diffractometers, the aim of SXD when it is used as an instrument for
standard structure determination and refinement is to produce a set of structure factors for use in
refinement, with the minimum possible manual intervention. To enable this, a semi-automatic data
reduction procedure has been written which is described in a separate document. The local contact
will assist in use of this procedure and in routine cases the user will be provided with a set of
2
2
observations in the form of [h,k,l,F , σ(F )].
The basic method of data collection using a time-of-flight Laue diffractometer is substantially different
from standard four-circle methods and is summarised below. For more detail please refer to the
separate Appendices.
Single Crystal Diffractometer – User Guide
28 / 34
4.1 Time-of-flight Laue diffraction
The time-of-flight Laue diffraction (tofLD) technique exploits the capability of a single crystal
diffractometer on a pulsed neutron source to access large volumes of reciprocal space in a single
measurement. This is due to the combination of the wavelength-sorting inherent in the time-of-flight
(tof) technique with large area position-sensitive detectors (PSDs). The tof technique exploits the fact
that the neutrons produced at an accelerator-based pulsed neutron source are created at a known
time, to, the time at which the high energy particle beam hits the neutron-producing target.
Subsequently, as a consequence of the massive nature of the neutron, the velocity of each neutron is
related to its wavelength. By recording the arrival time, t, of each neutron at the detector, a known
distance from the source, it is therefore possible to calculate its time-of-flight, t-to, its velocity and
hence its wavelength. Since typical times-of-flight are of the order of milliseconds at ISIS (pulse
frequency 50 Hz, leading to a repeat period between pulses of 20 ms), it is relatively straightforward
toproduce the required timing electronics, allowing each detected neutron to be uniquely flagged with
its wavelength.
Single crystal diffraction using a white beam with a stationary crystal and a white beam is the Laue
method. The variant described here, tofLD, provides a wavelength-sorted version of this. tofLD thus
gives a genuine sampling of three dimensions of reciprocal space in a single measurement.
4.2 Bragg data collection and reduction in time-of-flight Laue
diffraction
The large volume of reciprocal space observed in a single measurement, sorted in both time and
space, is termed a histogram or frame in tofLD. Collection of a complete structure factor set in this
diffraction geometry consists of the accumulation of a series of such frames, each collected with a
stationary crystal and detector arrangement.
The crystal is typically mounted on the two-circle orienter (χ−φ) in a Displex closed cycle refrigerator
(CCR) helium cryostat. The computer-controlled temperature in this device is measured by a Rh-Fe
thermocouple sited around 10 mm from the sample at the CCR head.
2
In a typical experiment, two PSDs, each of 192 x 192 mm active area, in 3 mm x 3 mm pixels, are
used. These are typically situated with their centres at 2θ ~55°, L2~190 mm from the sample (low
angle, detector 2), and 2θ ~125°, L2~160 mm from the sample (high angle, detector 1). There is thus
a very large angle subtended at the sample by both detectors.
Data are collected in a series of frames (normally between 15 and 42) from each detector, at a series
of (χ,φ) angles to give good coverage of reciprocal space. A typical wavelength range is 0.5-5 Å. The
nature of the data collection is such that different sinθ/λ values are reached in different parts of the
detector. Typical frame exposure times are around 1-6 hours, depending on unit cell and crystal size,
resulting in several hundred observed reflections in each detector. This data collection method, and
the large degree of overlap between frames collected at different times, leads to a large overdetermination of equivalent reflections in the data set. The normalisation and merging procedure can
then be used to check if there is any measurable change in the diffracting power of the crystal during
the data collection.
Table 1. A typical data collection strategy for the χ−φ orienter.
The first 24 frames provide good coverage and the last 18 interleave with the first 24 frames to
provide good overlap and adequate peak over-determination.
Single Crystal Diffractometer – User Guide
29 / 34
χ setting(°)
2 (start)
φ settings (°)
0
27
54
0
80
30
60
90
120
150
30
60
90
120
150
30
60
90
120
150
30
60
90
120
150
67
15
45
75
105
135
165
41
15
45
75
105
135
165
14
15
45
75
105
135
165
180
180
(finish)
With many reflections determined within each frame, this allows straightforward determination and
refinement of the UB matrix. Each three dimensional data histogram is searched for peaks and these
are indexed using the UB matrix. The cell dimensions are determined using a refinement of the UB
matrix with respect to a set of reflections taken from a wide range of data frames, thus ensuring good
averaging. For peak integration, on the other hand, the local UB refined for the particular frame under
consideration is used. After refinement of the local UB, peak integration can be undertaken in one of
two ways, using either the peak positions predicted from the UB or those found in the peak searching.
The latter approach is usually adopted at present.
The peaks are integrated using a profile fitting approach based on the known analytical shape of the
reflections in the time-of-flight direction, well understood from the characteristics of the ISIS source
and moderator. Box and ellipsoid fitting, based on σ(I)/I methods, are also available but are found to
be less reliable in the current set-up. The function used in the profile method is a Gaussian
convoluted with a decaying exponential function, which is found to reproduce the peak shape well.
The variable parameters in this fit are the Gaussian height and width and the time constant of the
exponential, all of which vary with time-of-flight. This method is found to be both sensitive and reliable
in the integration of both strong and weak peaks. It should be noted that reflections for which this
profile fitting procedure fails after four attempts on different integration windows are excluded from the
data set, thus resulting in a somewhat reduced occurrence of very weak or 'unobserved' peaks in the
final data set.
The reflection intensities extracted using these standard SXD procedures are normalised to the
incident beam profile using the incoherent scattering from a polycrystalline vanadium sample. Semiempirical absorption corrections are also applied at this stage, using the vanadium and sample
scattering. The resulting intensities are reduced to structure factors, giving data sets of reflections
from the high and low angle detectors respectively. These data are then used in the CCSL
(Brown & Matthewman, 1993) least squares refinement program SFLSQ, to apply a variable
wavelength extinction correction based on the Becker-Coppens formalism (Becker & Coppens,
1974a,b), normally using a Gaussian model with one variable parameter, the mosaic spread.
The resulting corrected structure factors are then merged and subject to initial refinements in the
GSAS program (Larson & von Dreele, 1986) before final refinement proceeds in GSAS, CCSL,
SHELX or any other structure refinement program, since by this stage the data comprise a fully
corrected structure factor set which can be used in standard refinements. It should be noted that the
very large over-determination of SXD Laue data sets, the use of PSDs to collect the data and the
complex wavelength-dependent corrections which have to be applied, tends to lead to rather higher
merging R-factors and hence higher crystallographic R-factors, than is normally found with constant
wavelength data. Nonetheless, conventional crystallographic R factors (R(F)) of around 6-8% are
normally obtained on SXD, which are perfectly acceptable.
Single Crystal Diffractometer – User Guide
30 / 34
References
Wilson, C.C. (1990) in ‘Neutron Scattering Data Analysis 1990’, ed M.W.Johnson, pp 145-163, IoP
Conference Series vol 107, Adam Hilger, Bristol.
Brown, P.J. & Matthewman, J.C. (1993). Rutherford Appleton Laboratory Report, RAL-93-009.
Becker, P. & Coppens, P. (1974). Acta Cryst A30, 129 and 148.
Larson, A.C. & von Dreele, R.B. (1986). GSAS. Los Alamos National Laboratory Report, LAUR 86748.
4.3 Introduction to diffuse scattering data collection and reduction
procedures
SXD frames are collected with a fixed sample, fixed detector geometry, with the detectors arranged to
maximise the measured volume of reciprocal space without compromising resolution or background.
The principle for diffuse scattering data collection therefore is to orient the sample and detectors to
minimise the number of sample rotations required to measure all the regions of reciprocal space of
interest. It should be emphasised that SXD is a surveying instrument and as such it is more suited to
measurements which require determination of large regions containing diffuse scattering rather than
investigations of one (smaller) diffuse feature. Typically the sample would be aligned with the principal
features of interest scattering into the equatorial plane of the instrument and the unique portion of this
reciprocal lattice plane would be mapped out completely. Very high-Q features can be measured. It
must however be remembered that SXD is a largely uncollimated instrument. This has the effect of
reducing the dynamic range and may be important when looking for inherently weak signals. This is
not to say that the instrument has a high background (it is extremely small for an instrument of its
4
5
type: 10 -10 signal to noise is easily possible), but that other scattering from the sample may obscure
the features of interest. For example the instrument resolution may broaden strong thermal diffuse
scattering thus masking other features. Perfect sample alignment is not required and the data
reduction software allows the correction of data which are not in the equatorial plane.
A typical experimental schedule would be as follows:
1. Mount the sample and check orientation and sample quality;
2. Optimise detector positions and shielding for the measurement;
3. Measure the number of frames required to map out the required portion of reciprocal space. It
is usual to use ω-rotation only for this - the χ-φ orienter has too high a background for careful
diffuse scattering measurements. Counting times are critically dependent on the strength of
the signal and may be between 2 and 12 hours per frame.
4. Repeat 3. for the required number of temperatures etc.
5. Remove sample and run a background without disturbing detectors or sample environment.
The time for this run will depend on the strength of the background - if it is a significant part of
the scattering it should be run for as long as the sample frames were run for but if it is small
then less time can be used.
6. Run a vanadium rod, either in the same sample environment (and use the background in 5.
for subtraction) or in the vacuum tank, again without moving the detectors. This should ideally
be an overnight run.
The data correction procedure is different from that used to determine Bragg intensities. This is
because the data are used to determine the differential scattering cross-section rather than the total
(elastic) scattering for each Bragg reflection. The data correction, which is described in detail in one of
the Appendices, is much more akin to that used to produce liquid or amorphous structure factors. In
outline, the data and vanadium are measured in identical conditions and, once background scattering
has been subtracted, the vanadium spectra are used to normalise the sample spectra. The vanadium
scattering takes into account the relative efficiencies of different pixels (spectra) on the detector, the
incident neutron flux profile and the detector response at different neutron energies. The software can
Single Crystal Diffractometer – User Guide
31 / 34
take in to account the effects of absorption, multiple scattering and inelasticity, although it is most
appropriate for equatorial scattering where the cylindrical geometry approximations are least severe.
The refined UB matrix is used to define which (x,z,t) points should be included in the (qh,qk,ql) points
in the reciprocal lattice plane of interest.
Further details can be found in the relevant Appendix.
5. Summary
The information given here should allow an SXD experiment to be started successfully, the diffraction
from a crystal to be checked and in favourable cases, the crystal alignment to be found. The running
experiment can generally now be left in the capable hands of the instrument computer, executing
some command proceedure that has been prepared for the changes and controls in the experiment.
The data accumulation now under control, refer to the accompanying Appendices for details of data
reduction and analysis.
6. Appendix - Useful Information
6.1 Useful Telephone Numbers
RAL
Mobile Number
Extension
email
Dave Keen
6556
DAVEKEEN
Chick Wilson
5137
CCW
Kevin Knight
5220
KSK
Steve Hull
6628
SH
Jimmy Chauhan
6182
S. E. Lab.
5721
ISIS Main Control Room (MCR)
6789
Health Physics
6696
RAL Main Gate/Security
5545
Computing Support
1782 (mobile short code:
RAL internal use only)
07944 747510 (mobile)
SUPPORT
1763 (mobile short code:
RAL internal use only)
Single Crystal Diffractometer – User Guide
32 / 34
University Liaison Office
5592
ULS
To dial an office extension from outside RAL dial (01235) 44+extn.
6.2 Eating and Drinking
6.2.1 RAL Opening Hours
R22
Restaurant
Mon-Fri
Sat-Sun
7.30-8.30
8.00-9.00
Lunch
11.45-13.45
12.00-12.30(S),12.30-13.30(W)
Dinner
17.00-17.30(S), 17.30-19.15(W)
18.00-19.00(W)
Breakfast
(S: Self-service grill bar, W: Waitress assisted buffet)
R1 coffee lounge (hot drinks and snacks)
9.30-15.45
(Mon-Fri)
R22 coffee lounge
11.30-13.45
"
8.00-9.30, 11.30-13.45
"
R22 shop
6.2.2 Pubs
Abingdon
King's Head & Bell
Historic.
Old Anchor
Good position on Thames.
Brewery Tap
Their Morland’s should be good and is!
Aldworth
The Bell
CAMRA pub of year, excellent beer and massive
crusty rolls. In Good Pub Guide.
Blewbury
The Red Lion
Compact & atmospheric. In GPG.
Single Crystal Diffractometer – User Guide
33 / 34
Chilton
Rose & Crown
Basic but close to the Lab.
East Hendred
The Plough
Good food, mediæval feel.
Wheatsheaf
A favourite, good beer & food. In GPG.
The Crown & Horns
Terrifically atmospheric, race-horse theme,
interesting food. In GPG.
The Swan
Tidy enough.
Oxford
plenty of choice....
Note especially the Turf Tavern, King’s Arms,
Eagle and Child, Lamb & Flag, Wheatsheaf,
Chequers, Bear (all in Town Centre) and Victoria
Arms (on the River Cherwell).
Steventon
The Cherry Tree
Interesting double roomed pub with good beer &
food. In GPG.
Wantage
The Lamb
Dark and low-beamed, specialises in good food.
West Hendred
The Hare
On main road, interesting building and decent
sandwiches.
West Ilsley
The Harrow
Magnificent position, opposite cricket pitch and
downs, pies a speciality. In GPG.
East Ilsley
Single Crystal Diffractometer – User Guide
34 / 34