1
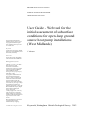
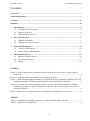
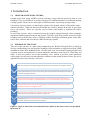
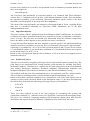
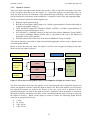
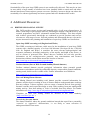
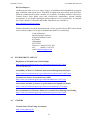
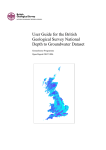
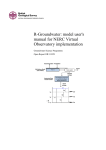
User Guide - Web tool for the initial assessment of subsurface conditions for open-loop ground source heat pump installations (West Midlands) Energy Science Programme Open Report OR/12/069 BRITISH GEOLOGICAL SURVEY ENERGY SCIENCE PROGRAMME OPEN REPORT OR/12/069 The National Grid and other Ordnance Survey data © Crown Copyright and database rights 2012. Ordnance Survey Licence No. 100021290. User Guide - Web tool for the initial assessment of subsurface conditions for open-loop ground source heat pump installations (West Midlands) Keywords ground source heat pump, GSHP, open-loop, West Midlands, initial assessment, suitability. C Abesser Front cover Screen plot of open-loop GSHP web tool for the West Midlands. Bibliographical reference ABESSER, C. 2012. User Guide Web tool for the initial assessment of subsurface conditions for open-loop ground source heat pump installations (West Midlands). British Geological Survey Open Report, OR/12/069. 20pp. Copyright in materials derived from the British Geological Survey’s work is owned by the Natural Environment Research Council (NERC) and/or the authority that commissioned the work. You may not copy or adapt this publication without first obtaining permission. Contact the BGS Intellectual Property Rights Section, British Geological Survey, Keyworth, e-mail [email protected]. You may quote extracts of a reasonable length without prior permission, provided a full acknowledgement is given of the source of the extract. Maps and diagrams in this book use topography based on Ordnance Survey mapping. © NERC 2012. All rights reserved Keyworth, Nottingham British Geological Survey 2012 BRITISH GEOLOGICAL SURVEY The full range of our publications is available from BGS shops at Nottingham, Edinburgh, London and Cardiff (Welsh publications only) see contact details below or shop online at www.geologyshop.com The London Information Office also maintains a reference collection of BGS publications, including maps, for consultation. We publish an annual catalogue of our maps and other publications; this catalogue is available online or from any of the BGS shops. The British Geological Survey carries out the geological survey of Great Britain and Northern Ireland (the latter as an agency service for the government of Northern Ireland), and of the surrounding continental shelf, as well as basic research projects. It also undertakes programmes of technical aid in geology in developing countries. The British Geological Survey is a component body of the Natural Environment Research Council. British Geological Survey offices BGS Central Enquiries Desk Tel 0115 936 3143 email [email protected] Fax 0115 936 3276 Environmental Science Centre, Keyworth, Nottingham NG12 5GG Tel 0115 936 3241 Fax 0115 936 3488 email [email protected] Murchison House, West Mains Road, Edinburgh EH9 3LA Tel 0131 667 1000 email [email protected] Fax 0131 668 2683 Natural History Museum, Cromwell Road, London SW7 5BD Tel 020 7589 4090 Fax 020 7584 8270 Tel 020 7942 5344/45 email [email protected] Columbus House, Greenmeadow Springs, Tongwynlais, Cardiff CF15 7NE Tel 029 2052 1962 Fax 029 2052 1963 Maclean Building, Crowmarsh Gifford, Wallingford OX10 8BB Tel 01491 838800 Fax 01491 692345 Geological Survey of Northern Ireland, Colby House, Stranmillis Court, Belfast BT9 5BF Tel 028 9038 8462 Fax 028 9038 8461 www.bgs.ac.uk/gsni/ Parent Body Natural Environment Research Council, Polaris House, North Star Avenue, Swindon SN2 1EU Tel 01793 411500 Fax 01793 411501 www.nerc.ac.uk Website www.bgs.ac.uk Shop online at www.geologyshop.com OR/12/069; version 1.2 Last modified: 2012/11/01 12:48 Foreword This report provides a guide for the use of the open-loop ground source heat pump web tool that was developed by the British Geological Survey (BGS) for the West Midlands. The purpose of the document is to enable the users to understand what the data set shows and how it has been created and to provide them with a better appreciation of the potential applications and limitations of this tool. Acknowledgements A number of individuals have contributed to the development of this open-loop ground source heat pump web tool. BGS specialists in energy sciences, hydrogeology and geographic information systems (GIS) have provided assistance at all stages of the study by compiling, attributing and processing data, creating new GIS layers and developing the web viewer tool. Of the many individuals who have contributed to the project, I would particularly like to thank the following (in alphabetical order): Jon Busby (BGS) Rose Hargreaves (BGS) Andrew Hulbert (BGS) Melinda Lewis (BGS) Andrew Marchant (BGS) Ann Williams (BGS). i OR/12/069; version 1.2 Last modified: 2012/11/01 12:48 Contents Foreword ......................................................................................................................................... i Acknowledgements ......................................................................................................................... i Contents.......................................................................................................................................... ii Summary ....................................................................................................................................... iii 1 Introduction ............................................................................................................................ 4 1.1 Ground source heat pumps ............................................................................................. 4 1.2 Purpose of the tool .......................................................................................................... 4 1.3 Who should use this tool ................................................................................................ 5 2 How to use the tool ................................................................................................................. 5 2.1 What the tool shows ....................................................................................................... 5 2.2 What the tool does not show........................................................................................... 9 3 Technical Information ......................................................................................................... 10 3.1 Creation of the data set ................................................................................................. 10 3.2 Dataset history and limitations ..................................................................................... 13 4 Additional Resources ........................................................................................................... 13 4.1 British Geological Survey ............................................................................................ 14 4.2 Environment Agency .................................................................................................... 15 4.3 Others............................................................................................................................ 15 FIGURES Figure 1: Steps to obtain an environmental licence (links to the above source are provided in Section 4) .................................................................................................................................. 4 Figure 2: Viability map shown without (a) and with (b) map key .................................................. 6 Figure 3: Data table and graphical summary (Chernoff face) of the subsurface attributes for areas with high potential (a) and low potential (b) for open-loop GSHP installations ...................... 6 Figure 4: Chernoff faces representing the presence of a good (concealed) aquifer of medium productivity located at a depth of 200-300 m which is not covered (a) and covered (b) by superficial deposits ................................................................................................................... 9 Figure 5: Flow chart of assignment rules for development of Depth to resource layer ................ 12 TABLES Table 1: Explanation of suitability aspects provided in the data table of the tool .......................... 7 Table 2: Legend for Chernoff faces ................................................................................................ 8 ii OR/12/069; version 1.2 Last modified: 2012/11/01 12:48 Summary This report describes the use of the open-loop ground source heat pump web tool for the West Midlands and provides some technical information on the tool development and underlying data sets. Part 1 provides the background information to this study and outlines the purpose of this tool and the anticipated user groups. Part 2 explains how to use the tool. It provides detailed explanations of the different layers and their meaning within the context of GSHPs. It also explains how to use the results table and the visual summary of the results (Chernoff faces). Furthermore, this section outlines the limitations of the tool and lists the different aspects that are not considered by the tool. Where possible, it provides references and links to additional data sources that address the particular aspects which are not included in the tool. Part 3 provides more detailed information on how the individual data layers were derived. This information is not necessary to use the tool, but is included here for the interested few and for reference. In Part 4, links to data sets and additional resources are given that can help with a more detailed assessment of suitability and the planning of open-loop GSHP schemes. Please note that this tool provides only an initial assessment about whether an area may be suitable for an open-loop GSHP. You will need to undertake a detailed hydrogeological and environmental assessment of your location if you wish to install an open-loop GSHP. iii OR/12/069; version 1.2 Last modified: 2012/11/01 12:48 1 Introduction 1.1 GROUND SOURCE HEAT PUMPS Ground source heat pump (GSHP) systems exchange energy with the ground to heat or cool buildings. They are considered an energy-efficient, low-carbon alternative to traditional heating/ cooling systems. There are two main types of GSHP systems: closed-loop and open-loop. Closed-loop systems consist of a buried pipe system in the ground, which is filled with a water – antifreeze mixture. When the fluid travels around the system, it absorbs heat from, or gives heat out to, the ground. These are typically used in houses and smaller to medium-sized office buildings. In open-loop systems, water is abstracted from the ground, pumped through a heat exchanger and then normally pumped back into the ground. Typically, open-loop systems are used in larger buildings such as multi-story offices, shopping centres and larger swimming pools, where they can be more efficient and cost effective than closed-loop systems. 1.2 PURPOSE OF THE TOOL This tool is the outcome of a pilot study conducted by the British Geological Survey (BGS) to develop a methodology for assessing the suitability of the subsurface to support open-loop GSHP installations in the West Midlands at the 1:50,000 scale. The tool considers hydrogeological and economic factors and summarises relevant subsurface attributes in the form of a final map and tables. It does not produce an overall suitability score: instead it provides actual parameter values/ranges for the most relevant subsurface attributes at the search location. Hence, the tool is applicable to open-loop schemes of all sizes. Check •Use the screening tool on the British Geological Survey website to check whether an area might be suitable. area Check •Check water availability in your local area by referring to the Catchment Abstraction Management Strategy on the Environment Agency's website. water •Read the Environment Agency's "Good Practice Guide" to make sure you manage environmental risks. Contact •Contact the Environment Agency on 03708 506 506 to discuss your intended location, design and operation. EA Get help Decide •Seek specialist help and do a site-specific hydrogeological and environmental assessment of your location. •Complete a Groundwater Investigation Consent. •EA will discuss with you whether your application is likely to be successful •Decide if an open-loop ground source heat pump is right for you. •Download forms for environmental permissions from the Environment Agency's website. Apply for •Send your completed forms to the Environment Agency. licence Figure 1: Steps to obtain an environmental licence (links to the above source are provided in Section 4) 4 OR/12/069; version 1.2 Last modified: 2012/11/01 12:48 The tool does not consider regulatory factors (e.g., the amount of water available for licensing). Hence, if the tool identifies favourable hydrogeological conditions for the installations of openloop GSHPs, this does not guarantee that the necessary environmental licences can be obtained. Figure 1 illustrates the steps that are required to obtain such a licence. 1.3 WHO SHOULD USE THIS TOOL The tool is intended for use by experts (e.g. developers and planners) as well as by non-experts (e.g. homeowners, interested individuals) for identifying locations that may be suitable for openloop GSHP installation. It can also support the assessment of existing sites with regards to their GSHP potential and hence may also be of interest to local councils, government agencies, building engineers, architects or organisations who are considering renewable potential across their estate. This tool is not for those homeowners and developers interested in installing closed-loop schemes. In general, closed-loop schemes can be installed anywhere as long as there is sufficient space, they do not damage the environment and they meet planning requirements. You can get more information on closed-loop schemes from the Energy Saving Trust (see web address in Section 4). For more information on environmental issues related to closed-loop schemes see the Environment Agency’s “Good Practice Guide” (see link in Section 0). 2 How to use the tool 2.1 WHAT THE TOOL SHOWS The web tool consists of a set of data layers with different attributes that determine the suitability of the subsurface for open-loop GSHP installations. These layers are based on existing national data sets (available at a scale of 1:50,000) managed by the British Geological Survey. The data are summarised in the form of a map which indicates the tendency of the sub-surface to be suitable for the installation of open-loop GSHP systems. 2.1.1 Map The basic requirement for open-loop GSHP installation is the availability of an aquifer* of sufficient productivity. These can be provided by consolidated rock (bedrock) or by unconsolidated (superficial) deposits. Where an aquifer is present, it is important that the aquifer is located within a suitable depth from the surface as this affects the installation and pumping costs, i.e. the economic viability, of the scheme. Another economic factor is the temperature of the underground water as this determines the efficiency of the scheme in providing heat or cold. These hydrogeological and economic attributes are summarised in the viability map (Figure 2a). Hydrogeological attributes are represented by different colours and economic attribute are shown by different shades. The presence of productive aquifers (“moderate”, “good” or “concealed”) is shown in green, less productive aquifers (“poor”) in brown and mostly un-productive aquifers (“none”) in red. Shading within each of these groups from dark to light represents diminishing economic suitability (e.g., increasing depths to resource, absence of superficial deposits, decreasing temperature). The map key for the viability map is displayed in Figure 2b. * An aquifer is an underground layer of water-bearing permeable rock from which groundwater can be usefully abstracted. 5 OR/12/069; version 1.2 Last modified: 2012/11/01 12:48 (a) (b) Figure 2: Viability map shown without (a) and with (b) map key Clicking on the map brings up a table with more detailed information on the hydrogeological and economic conditions at the selected location as well as a graphical summary (face) of these subsurface attributes. These are illustrated in Figure 3 and will be explained in the next sections. (a) (b) Figure 3: Data table and graphical summary (Chernoff face) of the subsurface attributes for areas with high potential (a) and low potential (b) for open-loop GSHP installations 2.1.2 The data table The data table summarises the most important hydrogeological and economic aspects that should be considered when identifying suitability of a location for open-loop GHSP installations. The individual aspects and their relevance for open-loop GSHP suitability are described in Table 1. 6 OR/12/069; version 1.2 Last modified: 2012/11/01 12:48 Table 1: Explanation of suitability aspects provided in the data table of the tool Data layers Bedrock aquifer What this means How it links to suitability for an open-loop scheme An open-loop scheme requires the presence In general, the greater the potential of water bearing rocks (aquifer) from which of the aquifer to provide water and it can abstract water. the easier it is to access the water, the greater the potential for an openThis data layer indicates the potential of the loop scheme. bedrock to provide water. It also describes how easily accessible the water is, whether the aquifers are present at the surface or “concealed” (i.e. covered) by less permeable bedrock. Where the aquifer is “concealed”, one has to drill through the overlying rock sequence to access the water. The water level may then rise closer to the surface. Superficial deposits Superficial deposits are sediments that are present on top of the bedrock in some areas. Depending on their composition, these can provide local aquifers and hence, have potential to provide water for GSHP systems. This layer indicates where superficial deposits of at least 10 m thickness are present. It does not show their capacity for providing water. Superficial deposits may provide an alternative source of water in areas where a bedrock aquifer is absent. The composition of these deposits is unknown and site-specific investigations are required to assess their capacity for providing water. Productivity This data layer gives the estimated (maximum) rate of water flow (i.e. yield) that a borehole (~100m† deep) can provide from the bedrock aquifer. The more productive the aquifer the larger the open-loop GSHP schemes that it can support. Flow rates of 10 m3/h and more are required for commercial schemes (e.g. office buildings, super market) while smaller flow rates may still be suitable for residential schemes. Depth to resource This shows the depths to which one has to How far down an installer has to drill to access the water. drill is a key economic consideration, as it influences the drilling costs, borehole installation costs and the pumping costs. In general, the deeper the source, the higher the installation costs. Temperature This data layer provides an estimate of the temperature of the ground at 100m beneath the surface and is included here to give an approximation of the groundwater temperatures. † The groundwater temperature determines the amount of heat/cold that can be extracted from the water, i.e. it determines the efficiency of the scheme. Note that this depth was randomly chosen as a reference depth and to standardize borehole yields. It has no further significance in the context of open-loop GSHP installations in the UK. The optimal depth of the production borehole is determined by the geology and hydrogeology at the given location as well as by the size of the proposed GSHP scheme. 7 OR/12/069; version 1.2 Last modified: 2012/11/01 12:48 2.1.3 The face (Chernoff face) Clicking on the map also provides a graphical summary (Chernoff face‡) of the subsurface attributes. It displays the hydrogeological and economic parameters (as given in the data table) as parts of the human face (e.g., eyes, nose, mouth). Different shapes and sizes of the facial features illustrate the different parameter values. A legend for the facial features is provided in Table 2 and further explanations are given in the text below. Table 2: Legend for Chernoff faces Mouth Hair Eyes = Bedrock aquifer Nose = Depth to resource None <30 m Poor 30-100 m Good (confined) >100-200 m Good >200-300 m = Superficial deposits Colour = Temperature none 11-12⁰C yes 12-13⁰C >13⁰C = Productivity 3 -1 >60 m h 3 -1 3 -1 30-60 m h 10-30 m h 3 -1 <10 m h The mouth represents the potential of the underlying rocks to provide the water that is needed to run the open-loop GSHP, i.e. to provide a suitable bedrock aquifer. A smiley mouth (upwards curvature) indicates that the rocks can provide a good aquifer, a neutral mouth (straight line) indicates presence of a poor aquifer and a frowning mouth (downwards curvature) indicates that no suitable aquifer is present at that location. ‡ Herman Chernoff (1973). "The Use of Faces to Represent Points in K-Dimensional Space Graphically". Journal of the American Statistical Association (American Statistical Association) 68 (342): 361–368. 8 OR/12/069; version 1.2 Last modified: 2012/11/01 12:48 The hair shows where superficial deposits of at least 10 m thickness are present. Some of these deposits have the potential to provide an alternative/additional source of water. However, this layer only shows the presence of such superficial deposits not their ability to provide water. The eyes represent the rate of water flow (i.e., yield) that a single borehole (100 m deep) in the bedrock aquifer can provide. The size of the eyes indicates the size of the yield, i.e. the bigger the eyes, the higher the yield (i.e., the higher the rate at which water can be abstracted). The nose represents how deep one needs to drill to reach the water. The length of the nose indicates the depth, i.e. the longer the nose the deeper the location of the water beneath the surface, i.e. the higher the drilling and installation costs. The colour of the face represents the estimated temperature of the ground, and hence the groundwater, at 100 m beneath the surface. Red indicates highest temperatures and blue lowest temperatures. (a) (b) Figure 4: Chernoff faces representing the presence of a good (concealed) aquifer of medium productivity located at a depth of 200-300 m. Image (a) shows an example where superficial deposits are absent (face without hair) while in image (b) superficial deposits are present (face with hair) at the search location. 2.2 WHAT THE TOOL DOES NOT SHOW Developed at the scale of 1:50,000, the tool does not provide definite answers at the plot/sitescale. The tool does not consider the suitability of the subsurface to accept water, i.e. the suitability for re-injecting water. Such information needs to be obtained from a site-specific BGS GeoReport or site investigations. There are also alternative methods for discharging the water that do not rely on the subsurface properties, e.g. discharge via the sewer system or to surface water courses. The tool does not consider the reduction in aquifer productivity near the outcrop boundaries due to decreasing thickness of the aquifer, i.e., aquifer thinning. As a result, there is a higher degree of uncertainty regarding the predicted aquifer potential near these boundaries which needs to be considered when using the tool. 9 OR/12/069; version 1.2 Last modified: 2012/11/01 12:48 The tool does not consider regulatory aspects. Being in a suitable area does not guarantee that the environmental permissions required for open-loop schemes can be obtained. The Environment Agency will always require developers to obtain more detailed, site-specific information (such as provided by a BGS GeoReport, see Section 0) and/or to carry out a site-specific investigation to prove the hydrogeological and economic viability of a scheme at a specific site. There are a number of risk factors that may affect the suitability of a site for GSHP installation which are also not considered in this tool. These include: - the location of mine workings and shafts - areas where geohazards may occurs (voids or collapse/stability issues) - evaporites - locations of known or suspected contamination. Most of this information is available from other sources, including the BGS. Relevant links to these sources are given in Section 0. 3 Technical Information 3.1 CREATION OF THE DATA SET The following section provides more detailed information on how the individual data layers were derived. This information is not necessary to use the tool, but is provided here for the interested few and for reference. 3.1.1 Final map This layer is a composite of the following data layers: bedrock aquifer potential productivity depth to resource superficial deposits temperature The presence of productive aquifers (“moderate”, “good” or “concealed”) is shown in green, less productive aquifers (“poor”) in brown and mostly un-productive aquifers (“none”) in red. Shading within each of these groups from dark to light represents diminishing economic suitability (e.g., increasing depths to resource, absence of superficial deposits, decreasing temperature). 3.1.2 Bedrock aquifer potential The map was derived from the 1:50,000 map of geological bedrock formations (DiGMapGB 50). Using the experience and knowledge of hydrogeologists at the BGS, each unit was attributed according to its potential of providing: - no suitable aquifer (aquifer unsuitable for open-loop GSHPs, <10 m3/h) - poor aquifer (suitable for domestic open-loop GSHPs, <30 m3/h) - intermediate aquifer (suitable for commercial open loop GSHPs, 30 – 60 m3/h) - good aquifer (suitable for commercial open-loop GSHPs, > 60 m3/h). 10 OR/12/069; version 1.2 Last modified: 2012/11/01 12:48 In some areas, aquifers are covered by less permeable rocks or sediments (concealed aquifer) and these were mapped as - concealed aquifer. The occurrence and distribution of concealed aquifers was estimated from BGS subsurface contour data (1: 1,000,000 scale) of the base of the Mercian Mudstone Group. This data defines the uppermost boundary of the underlying Sherwood Sandstone aquifer which is the most important, concealed aquifer in the study area (West Midlands). The extent of the concealed aquifer was mapped to a maximum depth of 300 m. Anything deeper than this is considered unsuitable for open-loop GSHP installations due to the high drilling/installation costs. 3.1.3 Superficial deposits This layer is based on BGS’ Advanced Superficial Thickness Model (ASTM) data. It is intended to indicate areas where superficial deposits have potential to provide an additional or alternative source of water. The layer does not include any information about the sediment composition; hence, the ability of these deposits to store and provide water is not known. To map the superficial deposits that have potential to provide aquifers, the minimum thickness needed to provide a reasonable rate of water flow was calculated using Logan’s approximation§. Assuming (1) a conductivity of k=5 m/d of the superficial deposits and (2) water levels at about 1-3 m beneath the surface, it was found that a minimum of 10 m sediment thickness was required for the abstraction of 10 m3/h (~3 L/s). Based on this, all superficial deposits with a thickness of 10 m or more were mapped and are included in this layer. 3.1.4 Productivity Layer This layer was derived by assigning yield range classes to the bedrock aquifer potential map. The yield ranges were determined from existing borehole yield data that are available from BGS’ Wellmaster database. Yield data were extracted for the main aquifer units in the West Midlands area, namely Bromsgrove Sandstone, Wildmoor Sandstone, Kidderminster Sandstone and Bridgnorth Sandstone (all of them are formations of the Sherwood Sandstone Group). All available yield data were then standardised to give the equivalent yield for a 100m borehole. This was done by dividing borehole yield by borehole depth and multiplying it by 100. Based on these data, statistical summaries were calculated for each of the main aquifer units at outcrop as well as when concealed. Based on the interquartile range (i.e. the range encompassing the central 50% of the data) the following yield range classes were established: • 10-30 m3/h • 30-60 m3/h • > 60 m3/h These were then assigned to each of the map polygons by considering the geology and confinement condition (i.e., different values were assigned to concealed and outcropping units). The layer was verified by comparing mapped yield assignments against point data from the Wellmaster and Aquifer Properties databases. Adjustments were made where necessary. § Logan’s approximation estimates the drawdown (s) in a well based on the pumping rate (Q) and the transmissivity (T) at the well : s = 1.22* Q / T 11 OR/12/069; version 1.2 3.1.5 Last modified: 2012/11/01 12:48 Depth to resource This layer shows the approximate depth to the resource. This is either the water table or the base of the overlying units that cover the aquifer, i.e., superficial deposits or concealing rocks. As such, the layer provides an indication of the minimum depth of drilling. Note that this depth is not necessarily the piezometric surface and hence, it cannot be used to infer the pumping height. The layer was derived from the following data sets: Bedrock aquifer potential map BGS River Head Space (RHS) data set (1:10,000) (approximation of water table depth in m below topographic surface)) BGS Advanced Superficial Thickness Model (ASTM) (1:10,000) (approximation of thickness of superficial deposits in m) ATLAS MAP (1:1,000,000) contours of the base of the Mercia Mudstone Group (MMG) in m above Ordinance Datum (mOD) (this is equivalent to the top of the Sherwood Sandstone Group (SSG) aquifer) Detailed contour data of the base of the Mercia Mudstone Group (in mOD). All contour data were converted to depth (m) beneath topographic surface using a digital terrain elevation model (DEM). Based on these data sets, the values for depth to resource were assigned according to the rules shown in the flow chart in Figure 5. Bedrock aquifer potential class Assignment rule Depth data layers No aquifer Good aquifer No data Superficial thickness (ASTM) < 30 m Medium aquifer Poor aquifer Depth to Resource class 30– 100 m Depth to water table (RHS) Max >100– 200 m >200 – 300 m Good aquifer (concealed) Depth to aquifer (SSG) Figure 5: Flow chart of assignment rules for development of Depth to resource layer The flow chart shows that where the aquifer is not concealed and where superficial deposits are absent, the depths to resource equals the depth to water level. Where the aquifer is not concealed but superficial deposits are present, the deeper of the two, water level or thickness of the superficial deposits, was used as the depth to resource. Similarly, where the aquifer is concealed, the depth to aquifer (estimated as the base of the concealing bedrock unit) was used to represent the depth to resource. Based on the depth to resources values, the following depth interval classes were assigned to the layer: < 30 m 30– 100 m >100– 200 m >200– 300 m. 12 OR/12/069; version 1.2 Last modified: 2012/11/01 12:48 3.1.6 Temperature This layer shows the ground temperatures at 100 m depth beneath the surface. These were estimated from measured ground temperatures as detailed in Busby et al. (2011)**. Where groundwater residence times in the subsurface are sufficiently long, the groundwater temperatures will equilibrate with those of the surrounding ground. Hence, this layer provides an approximation of the groundwater temperatures in the study area. 3.2 DATASET HISTORY AND LIMITATIONS This is the first version of the GSHP web tool for the West Midlands and is the result of a BGS pilot study. At the time of writing this guide, there are no plans to update this tool and associated databases. The tool is not updated. It is based on, and limited to, an interpretation of the records in the possession of the British Geological Survey at the time this data set was created between August 2010 and April 2011. This tool has been developed at the 1:50, 000 scale and does not provide definite answers at the site-scale. It must not be used at larger scales, and all spatial searches against the data should be done with a minimum 50 m buffer. The tool only considers the main hydrogeological unit in the West Midlands area, i.e. the Sherwood Sandstone, as providing an aquifer at depth. Other formations may provide concealed aquifers locally, but these have not been included here. The superficial deposits layer included in this tool only indicates where such deposits are present, not if they can provide productive aquifers. The tool does not consider the reduction in aquifer productivity near the outcrop boundaries due to decreasing thickness of the aquifer, i.e., aquifer thinning. As a result, there is a higher degree of uncertainty regarding the predicted aquifer potential near these boundaries which needs to be considered when using the tool. The tool does not consider the suitability of the subsurface to accept water, i.e. the suitability for re-injecting water. Such information need to be obtained from site-specific investigations or field tests. There are also alternative methods for discharging the water that do not rely on the subsurface properties, e.g. discharge via the sewer system or to surface water courses. This tool does not consider any regulatory aspects, i.e. if it is possible to obtain the required abstraction/ injection licences. This tool is intended to be viewed onscreen only. Some of the data supporting this screening tool is confidential. Information about data that is freely available can be found in Section 4. There are a number of risk factors that may affect the suitability of a site for GSHP installation which are also not considered in this tool. These include: the location of mine workings and shafts areas where geohazards may occurs (voids or collapse/stability issues) evaporates locations of known or suspected contamination ambient groundwater temperatures underground infrastructure restrictions. Most of this information is available from other sources, including the BGS as well as the EA and local authorities (pollution incidents, contaminated land register) as detailed in Section 4.1 and 4.2. ** Busby, J.; Kingdon, A.; Williams, J.. 2011 The measured shallow temperature field in Britain. Quarterly Journal of Engineering Geology and Hydrogeology, 44 (3). 373-387. 10.1144/1470-9236/10-049 13 OR/12/069; version 1.2 Last modified: 2012/11/01 12:48 Sustainability of the open loop GSHP system is not considered by this tool. This may be an issue in areas where a large number of schemes have been installed within a certain area and where thermal interference between these systems can occur. Similarly, incorrect design can reduce the sustainably of a scheme significantly and some systems had to be abandoned due to this. 4 Additional Resources 4.1 BRITISH GEOLOGICAL SURVEY The BGS provides expert services and impartial advice in all areas of geosciences. It holds a wide range of geoscientific data sets, including the outputs of the BGS survey and research programmes and BGS’ substantial national data holdings. This data coupled with in-house geoscientific knowledge are combined to provide products and services relevant to a wide range of users. Selected products and information that are relevant for anyone interested in the planning and installation of open-loop GSHPs are listed below. Open-loop GSHP screening tool (England and Wales) The GSHP screening tool indicates viable areas for the installation of open-loop GSHP systems with a thermal capacity of at least 100 kilowatts. Developed at the 1:250,000 scale for England and Wales, it considers the most relevant hydrogeological and economic parameters, including productivity of the aquifer and depth to the source, as well as extents of protected areas. Where data are available, the tool also provides information on the scaling/corrosion potential, iron concentrations and licenced abstractions within a search radius around the location of interest. http://www.bgs.ac.uk/research/energy/geothermal/ GeoSure dataset (Part of BGS Ground Stability Hazard datasets) GeoSure national datasets provide geological information about potential ground movement or subsidence caused by collapsible deposits, compressible ground, landslides, running sands, shrink swell or soluble rocks. Further information are available at: http://www.bgs.ac.uk/products/geosure/home.html Non-coal Mining Hazard dataset The Mining Hazard (not including coal) dataset provides essential information for planners and developers working in areas of former shallow underground mine workings that may collapse. It draws together a diverse range of material derived from geology, literature searches and expert knowledge to map voids resulting from past underground mining activity. Note that mining of coals is excluded from this dataset. For further information see: http://www.bgs.ac.uk/products/geohazards/miningHazard.html Enquiries on past coal mining should be directed to the Coal Authority (http://coal.decc.gov.uk/ ). Corrosivity (ferrous) dataset The dataset identifies where the ground conditions beneath the topsoil have potentially ‘corrosive’ or ‘aggressive’ characteristics, i.e. are likely to cause corrosion of underground ductile iron assets. 14 OR/12/069; version 1.2 Last modified: 2012/11/01 12:48 BGS GeoReports GeoReports provides access to unique sources of published and unpublished geological data, combined with expert advice from BGS scientists who know about your local area. Different standard and bespoke modules are available, including modules relevant for Ground Source Heat Pump (open and closed-loop) installations, ground stability assessments, or for detailed geological point prognosis or area assessments. A complete list of the available GeoReports and further information are available at: http://shop.bgs.ac.uk/georeports/ Further information on all the digital data and services provided by the BGS can be found on our website at http://www.bgs.ac.uk/data/home.html or by contacting: Central Enquiries British Geological Survey Kingsley Dunham Centre Keyworth Nottingham NG12 5GG Direct tel. +44(0)115 936 3143 Fax. +44(0)115 9363150 email [email protected] 4.2 ENVIRONMENT AGENCY Regulation of Ground Source Heat Pumps http://www.environment-agency.gov.uk/business/topics/128133.aspx Tel: 03708 506 506 Availability of Water: Catchment Abstraction Management Strategies http://www.environment-agency.gov.uk/business/topics/water/119927.aspx Groundwater Source Protection Zones (SPZ) http://www.environment-agency.gov.uk/homeandleisure/37833.aspx Abstraction and flow pressures on groundwater in England and Wales http://www.environment-agency.gov.uk/research/planning/33332.aspx Environmental Good Practice Guide for Ground Source Heating and Cooling http://www.environment-agency.gov.uk/business/topics/128133.aspx 4.3 OTHERS Ground Source Heat Pump Association http://www.gshp.org.uk/ 15 OR/12/069; version 1.2 Last modified: 2012/11/01 12:48 Energy Saving Trust (Information on closed loop systems) http://www.energysavingtrust.org.uk/Generating-energy/Choosing-a-renewabletechnology/Ground-source-heat-pumps ThermoMap Project (Mapping the potential for horizontal closed-loop systems) http://www.thermomap-project.eu/ 16