1
Product Installation an
User Guide
Ref: 11020191Version 1
Monitoring Made Easy
Product Disclaimer:
The recommendations and suggestions regarding product application and use that are offered on Data-Angel.com, in our product brochures, datasheets, or information provided by any employee or distributor, are a guide in the use
of this product and are not a guarantee to their performance. Data-Angel.com reserve the right to alter specification of their products without prior warning or notification. Always read instruction manuals fully before installing any
DataAngel component.
Table of Contents
System Overview
System Layout
Setting Up the Base Station
2
3-4
Installing the Base Station & Sesors
Using the DataAngel Day to Day
14-15
Powering-up the Base Station
Entering the System Menu
Checking the Time & Date
Adding & Pairing Sensors
Reviewing Alarm Set Points & Delays
Chaning Alarm Set Points & Delays
Setting-up Users & Alarm Acknowledge
Viewing Current Readings on Display
Identifying Pending Alarms
System Alarms
Other Display Symbols
5
6
7
8-9
10
10-11
12-13
16
16
17
17-18
Non-Networked Base Stations
19
Networked System Options
29
Naming Sensors on Channels
Installing Graphing Software
Viewing & Saving Reports
Viewing Data in Graphs
Using the Export Custom Tool
Viewing Event & Alarm Log
Viewing System Network Status
Logging into a DataAngel
DataAngel Main Screen Explained
Changing Sensor Set Points & Alarm Delays
Changing a Sensor Name
Setting Users, Password & Access Rights
Setting-up Email Alarm Alerts & Email Reports
System Alarms & On-line Acknowledgements
Historic Alarms & Events
Reviewing Historic Data in Graphs & Reports
Other System Settings Options
Monitoring Made Easy
20
21
22
23-26
27
28
30-31
32
33-34
34
35
36
37
38
39
40-41
42
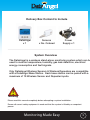
Delivery Box Content to Include
DataAngel
x1
Sensors
x No. Ordered
Power
Supply x 1
System Overview
The DataAngel is a wireless stand-alone monitoring system which can be
used to monitor temperature, humidity, gas leak detection, electrical
energy consumption and fault signals.
Only DataAngel Wireless Sensors & Wireless Repeaters are compatible
with a DataAngel Base Station. Each base station can be paired with a
maximum of 19 Wireless Sensor and Repeater inputs.
!
Warning
Please read this manual completely before attempting a system installation.
Ensure all correct safety equipment is used and that the system is fitted by a competent
person
Monitoring Made Easy
2
DataAngel System Layout
Figure 1
Front View
1
2
3
1
Main Display
2
Up Key
3
Down Key
4
Enter Key
5
Wall Bracket
6
Cable Channel
7
Ethernet Port
8
USB Memory Port
9
Power Socket
10
Volt Free Relay
11
Wall Bracket Fixing Lug
}
When pressed
together they
become the
System Menu
entry key
4
Rear View
6
Figure 2
5
9
7
10
8
11
3
Monitoring Made Easy
DataAngel System Layout - continued
Display Detail
12
13
14
15
16
17
18
20
}
Figure 3
22
23
24
21
{
19
25
12
Channel Number
19
Sensor Reading Value
13
Battery Low Symbol
20
USB Memory Indicator
14
Wireless Strength Symbol
21
Sensor Type Symbol
15
Clock Setting Symbol
22
High Set Point Indicator
16
System Menu Symbol
23
Alarm Delay Symbol
17
System Alarm Symbol
24
Date Setting Symbols
18
Memory Full/Fault Indicator
25
Low Set Point Indicator
Monitoring Made Easy
4
Setting-Up the Base Station
Powering up the Base Station.
!
Warning
Do not plug the power supply into a wall socket until instructed in the
following steps.
1.
Remove the wall plate from the rear of the unit, this can be done
by opening the unit forwards (as per figure 2 on page 3), carefully holding the base station in one hand, grip the wall plate at a lug swivel
point (Figure 2, Point 11)with a free hand and gently pull the connecting lug from it snap-in holder.
2.
Remove the wiring cover plate to expose the power & Ethernet
connection points.
3.
Insert the power connector into it’s connecting slot (Figure 2,
Point 9). This power connector has a twist clip to keep it firmly in
place. To insert the twist clip align the fitment points on the power
connector to those in the base station, push the power connector fully
into the base station and then twist 90 degrees to the left to create a
firm connection.
4.
Insert the Ethernet connector into it’s connection point (Figure 2,
Point 7). Ensure the Ethernet connector has correctly fastened and is
firmly in place. (For Networked Upgraded Base Stations ONLY)
5.
Carefully feed the power and Ethernet cables through the cable
channel on the rear of the base station so that they fit snugly in place
and refit the wiring plate cover.
6.
Plug the power supply into the mains and switch on to power up
the base station.
7.
On power-up the base station screen light up and show the current preset clock time.
5
Monitoring Made Easy
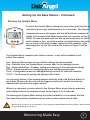
Setting-Up the Base Station - Continued
Entering the System Menu.
To enter the System Menu setting you must press and hold the up
and down arrow keys simultaneously for 2 seconds. See Figure 4
Figure 4
A password screen will appear and the Administrator password
needs to be entered (the default passcode for a system set up is
5555). To enter the passcode use the up and down keys to select
each number in turn, once the number is selected press the enter
key to move to the next number, repeat for all 4 numbers, after
pressing enter for the 4th number the screen in Figure 4 will be
seen.
The System Menu comprises the follow screens – each will be detailed in full
within this manual.
Set – Settings Menu where sensor default settings can be amended
End – Returns from the System Menu screens back to the readings screen.
Net - Networked Menu – Enables setting and viewing of the networked settings
PASS – Password menu for assigning users and changing passcodes
Conf – Configuration menu for adding/deleting sensors on selected channels
CLOC – Clock menu for setting the system time & date
As a security feature, if the system detects inactivity within the System Menu for
more than 30 seconds the user will be logged out and will need to re-enter the
Administrator password to regain access.
When in a sub menu you can return to the System Menu at any time by pressing
and holding both the up and down keys as per Figure 4 for 3 seconds.
On entering the System Menu during the initial installation it is essential that the
first item that must be checked and set is the correct system time & date.
!
Warning
Warning once system set up is complete be sure to change the default Administrator password. (See Password
for password change instructions).
Monitoring Made Easy
6
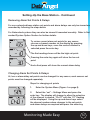
Setting-Up the Base Station - Continued
Checking & Setting the Time & Date.
Steps
Figure 5
1.
Enter the system menu (as per Figure 4 on page 6)
2.
Press the up or down keys and select CLOC ( see figure
5) from the System Menu and press the enter key.
3.
“Time” will show on the left of the display and the hour
figure will flash. Select the correct hour using the up and
down keys, press enter to confirm the hour and the minute
will then flash. Amend the minutes using the up and down
keys and once the correct minute time is selected press
enter to confirm.
TIME
4.
“Day” will show on the left of the display and the day number will flash, using
the up and down keys select the correct day date and the press enter. Set “Month”
and “Year” using the same process. The date format in the system is DD/MM/YY .
5.
Once the “Year” is set press enter and the system will then return to the
System Menu screens.
DAY
MONTH
YEAR
7
Monitoring Made Easy
Setting-Up the Base Station - Continued
Adding & Pairing DataAngel Sensor to the Base Station
Figure 6
Each sensor must be added and paired to the base station separately, each sensor is paired in the Configuration Menu.
Steps
1.
Have the Sensors to pair readily at hand
26
2.
Access the System Menu
27
3.
Select “ConF” and press enter
28
26 ID box
27 L.E.D
Transmit
Button
Figure 7
28
4.
The first free channel number will flash at
the top of the display (for a first time set up this
will be Channel 1). Once a channel number is
chosen press enter and continue to step 5.
Another channel number can be selected using
the up and down keys. If the channel already has
another sensor paired it will display “On” in the
display screen. To overwrite this already paired
sensor continue to step 5.
5.
Press and hold the enter key for 3 seconds.
The display will then show “rdy” – ready and then
a 15 second countdown will begin. During the
count down time press and hold the “Transmit
Button” (See Figure 7) on the sensor being pairing. The pairing is complete when the sensor LED
flashes green. Once the green flash is seen
release the “Transmit” button and the base station
will then confirm pairing by showing “done”. If
“fail” is shown then the pairing has not completed
correctly and Step 5 needs to repeated. The
“done” or “fail” will show on the screen for 5 seconds, after these 5 seconds the screen will return
to the “Conf” menu heading.
Monitoring Made Easy
8
Setting-Up the Base Station - Continued
Adding & Pairing DataAngel Sensor - Continued
Steps - Cont.
6.
Holding the sensor at arms-length from the base station press and
release the “Transmit Button”, the LED on the sensor should flash twice
confirming communication with the base station.
7.
Using an Indelible Marker Pen, write the channel number within the
ID Box section on the front of the paired sensor. Be sure to do with
straight away so not to be confused as to which sensor relates to which
channel (especially when more than 1 sensor is being added to the base
station).
8.
Put the marked sensor aside and repeat steps 1 to 7 for each of
the other sensors to be added.
Once all sensors have been paired correctly marked with their channel
numbers the next stage is to amend the alarm set points and delays
assigned to each sensor in turn.
Removing a Paired DataAngel Sensor from the Base Station
1.
To remove a sensor from the system follow steps 1 to 5 above. At step 5
once the “rdy” is displayed and the 15 second count down commences leave the
system to reach zero and the word “FAIL” will appear, the sensor on the channel
will then have been removed.
!
Remember to ensure that the correct sensors are used for the correct applications. Refer to the Sensor
datasheets for the correct specifications.
Warning
9
Monitoring Made Easy
Setting-Up the Base Station - Continued
Reviewing Alarm Set Points & Delays
For non-networked base station set points and alarm delays can only be viewed and
amended by following the steps below
For Networked systems they can also be viewed & amended remotely. Refer
- to Net
worked System Option Section for further details.
To review current alarm set points for any sensor,
choose a channel number on the display by pressing
the up and down keys, once the correct channel is
selected press the enter key.
°C
°C
The first reading shown will be the high set point.
Pressing the enter key again will show the low set
point
Mins
And a final press will show the current alarm delay.
Changing Alarm Set Points & Delays
Hi, low or alarm delay set points can be changed for any sensor, each sensors set
points must be changed separately.
Steps for changing set points
1.
Enter the System Menu (Figure 4 on page 6)
2.
Select the “set” – Settings Menu and press the
enter key. The display will change to allow the selection
of the channel to amend, “Ch:01” with the “01” flashing
will be displayed. Using the up and down keys select
the channel number where changes to the set points
and alarm delays are required and press the enter key.
Monitoring Made Easy
10
Setting-Up the Base Station - Continued
Changing Alarm Set Points & Delays - Continued
Steps for changing set points - Cont.
Temperature sensors come with default set points of 0 to +10 degrees and a
defrost delay of 30 minutes.
3.
Will be indicated on the lower left hand element of the display and the
current low set point will be flashing, to amend the set point use the up and
down keys, by continually pressing the up/down key the set point change rate
will increase (the longer the key is pressed the quicker the rate of change
occurs). When the desired set point is achieved release the key and the rate of
change will stop, the settings can be fine tuned by pressing the up and down
keys individually. Once the desire set point is achieved press enter.
4.
Will be indicated in the upper left hand element of the display, follow
step 3 to amend the high set point then press the enter key.
5.
Will appear in the centre of the left hand element of the display, this
denotes the alarm delay time. This is the amount of time the system will wait
once a set point is exceeded before creating an alarm message with the
system. Follow step 3 and press enter once the desired alarm delay is
achieved.
Remember when monitoring refrigerated or frozen applications defrost cycles
will occur throughout the day, therefore ensure that adequate alarm delay are
allowed to stop false alarms taking place.
6.
From “set” menu, press enter and select the next sensor where set
points need to be amended and complete steps 1-5 for each. Repeat for all
sensors paired with the base station.
11
Monitoring Made Easy
Setting-Up the Base Station - Continued
Creating Users & Setting Up Alarm Acknowledge
For Networked Upgraded Systems please see the Networked Options section
of this manual on how users are created and the password levels given.
With non-networked systems users are only created to be able to acknowledge alarms.
With networked & non-networked systems, users can be set-up too have to
enter a passcode to acknowledge system alarms. Acknowledging an alarm
creates a record within the base station memory which allows visibility of
alarm incidents and gives accountability to staff for actions taken.
When an alarm event occurs the base station will make an audible noise and
the alarm symbol
will flash continually. If no passcode acknowledge is
created on the base station then any member of staff can acknowledge the
alarm by simply pressing the enter button for 3 seconds. The audible alarm
will then mute and the alarm symbol will become fixed and stop flashing. A log
entry will be created for alarm acknowledged showing a time and date stamp.
If password acknowledge is created on the base station then any member of
staff can press a button to mute the audible alarm for 5 minutes, the flashing
alarm symbol will continue. After each 5 minute interval the audible alarm will
reactivate, this will continue until the alarm is acknowledged by a recognised
user. To acknowledge an alarm the user must hold down the enter key for 3
seconds, the passcode screen will then appear and the user enters their passcode, the system acknowledges this by showing “clr” – Clear - on the display
and the audible alarm will be permanently muted and the flashing symbol will
become fixed. The user’s password details will be entered into the base station log giving total visibility of who acknowledged the alarm and when.
A base station can have a maximum of 5 users to acknowledge alarms, this is
4 plus the Administrator. For passcode acknowledge to be activated the Administrator plus 1 other user need to be created with their own unique 4 digit
passcode.
Monitoring Made Easy
12
Setting-Up the Base Station - Continued
Creating Users & Setting Up Alarm Acknowledge - Continued
Steps for activating passcode acknowledge
1.
Enter System Menu (see Page 6 Figure 4)
2.
Select “PASS” – Password Menu Option, the word
“USEr” will appear for 3 seconds the then be replaced by
“1” to denote first user option. Select a user number and
then select enter.
3.
“1of2” will display for 2 seconds before the 4 digit
input lines appear “- - - -“, by pressing the up and down key
a number from 0 to 9 can be entered , press enter to move
to the 2nd key setting repeat for all 4 keys, “2of2” will then
appear and the passcode needs to be repeated to be
acknowledge, if the passcode used is acceptable then
“done” will display, if the password is unacceptable and
needs to be changed “fail” will display. After 3 seconds the
system will return to the “PASS” menu level.
4.
Repeat step 3 for all 1-4 users to be added to the
system.
5.
The Administrator passcode is no. 5 in the user list.
To amend the Administrator passcode select “USEr 5” and
follow step 3.
Steps for de-activating passcode acknowledge
1.
Follow steps 1 to 3 above, for each user 1-4 change the
passcode to the default “0000”. Once all 1-4 users are put back to
the default setting then password acknowledge will be removed
and simply pressing the enter key for 3 seconds will acknowledge
an alarm.
Administrator passcode cannot be deleted.
13
Monitoring Made Easy
Installing the Base Station & Sensors
Now that the basic set up is complete the Base Station and Wireless Sensors are
ready to be installed.
The base station can be unplugged from the mains and transferred to its final
installation location. Once set up and plugged back into the mains it will automatically start communication with the sensors that are paired with it. This
allows for the system to be initially set up in a convenient area which can be
away from the eventual installation point.
Installing the DataAngel Base Station
1.
Mount the wall bracket. The base station wall bracket has been designed
to be easily secured to the fixing location using 4 screw fixing points. This wall
bracket needs to be mounted within reach of a standard mains plug socket point
for power, for systems that will be networked it will also need to be within 3
meters of a network connection point.
2.
Once the wall bracket is secured the base station is clicked into place by
locating the fixing lugs on the bottom of the wall bracket into the fixing channels
on the bottom of the sides of the base station. The base station is then eased
back into the bracket and will clip into place.
3.
Once secured the base station should be firmly attached to the wall
bracket, when closed the USB memory should be total invisible form any angle.
4.
Power up the base station and install the wireless sensors into the areas to
be monitored, when locating each sensor press and release the “transmit”
button, this will force a transmission from the sensor to the base station. The
LED on the sensor should flash twice.
!
Installation should be completed by appropriately experienced personnel
Warning
Monitoring Made Easy
14
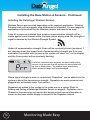
Installing the Base Station & Sensors - Continued
Installing the DataAngel Wireless Sensors
Wireless Sensor are mounted depending on the required application. Wireless
Sensors come with a magnetic strip attachment as standard. For non magnetic
applications clip brackets for the Wireless sensors and need to be used.
Once all sensors are installed there wireless communication strength will be
visible against each channel within the base station display area, the strength of
signal is denoted by the Wireless Strength Symbol
Under full communication strength 3 bars will be constantly shown (as above), 1
bar showing shows the lowest level of communication strength and if no communication is possible with the sensor the system will show “err” on the display
and the 3 bar symbol will be constantly flashing.
°C
If wireless communication between the base station and a
sensor is lost for more than 45 minutes the base station will
go into an alarm status. The audible alarm and flashing
alarm symbol will begin until acknowledged.
Where signal strength is weak or nonexistent “Repeaters” can be added into the
system to boost the transmission strength. Repeaters are mains powered and
plugged into a standard mains 3 pin socket
Repeaters are added to the system in the same was as a sensor (Refer to
Adding and Pairing a DataAngel Wireless Sensor on page 8). Repeaters use a
Channel in the same way as a sensor but during normal use no information is
shown on the base station display in respect to the Repeater channel.
15
Monitoring Made Easy
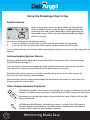
Using the DataAngel Day to Day
Now the DataAngel system is installed the monitoring and recording of data will have
commenced, below are details of how to view current readings on the display, identify
possible pending alarms, system alarms & understand other display symbols
Viewing Current Readings on the Display
°C
The base station display shows the current readings taken by each senso
Readings are taken by sensors every minute, the base station shows thes
and records every 5th reading (5 minute recording interval) to its USB
memory.
The reading for each paired sensor will be rolled by the base
station screen every 5 seconds, therefore a constant view of sensor readings can be easily seen. By
pressing the up and down keys the channels can also be scrolled through giving the ability to quickly
view a reading on any channel seen.
When viewing a channel’s the current set points and alarm delays can be seen by pressing the enter ke
The low, high and alarm delay will be shown for each enter key press.
Identify Pending Alarms
°C
Mins
When the base station detects a sensor reading outside of the set
parameters it will automatically start the count down for the alarm
delay set. On the display the alarm delay indicator will be set and
the reason for the alarm (i.e. the reading is above or below the set
point) will be flashing when displaying the relevant sensors channel.
The alarm delay outstanding can be viewed by selecting the
relevant channel and pressing the enter key, the first reading
shown will be the current outstanding delay, pressing the enter
key again will scroll through the set points and the total alarm
delay set for the sensor.
The example above shows that the sensor on Channel 1 is below it current low set point, when Channe
is selected and enter pressed the outstanding alarm delay of 28 minutes can be seen. ie, if the Channe
reading is not back within its set points within 28 minutes the system will alarm. By taking the- outstand
ing alarm delay from the total alarm delay for the Channel the total time the sensor has been outside of
its set points can be calculated. Remember if measuring refrigerated equipment you will expect alarm
delays to show for defrost periods.
Monitoring Made Easy
16
Using the DataAngel Day to Day
System Alarms
°C
When an alarm event occurs the base station will automatically
make an audible warning noise, the alarm symbol indicator will
continually flash and an email alarm alerts can be generated (on
Networked Systems ONLY refer to the Networked System Option
within the manual).
Alarm events will occur for the following factors
1.
A sensor reading is outside of its set points and the alarm delay has concluded
2.
A sensor has lost communication with the base station for more than 45 minutes
Once an alarm event occurs the base station automatically writes an entry into its Alarm Log within the
memory.
Acknowledging System Alarms
Setting up and acknowledging alarm is covered in detail in Setting-up Users and Acknowledging Alarm Delays on page 12.
Once an alarm has been acknowledged the alarm symbol will become solid and will only been
seen against the channel of the sensor where the alarm issue has occurred.
Should a further alarm event occur the alarm sounder will activate and the alarm symbol will
flash until this alarm has been acknowledged.
When the alarm event has been acknowledged the base station will update the entry within the
Alarm Log with the relevant data.
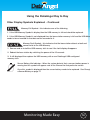
Other Display Symbols Explained
USB Memory Symbol - when shown on the display the system is indicating that the US
memory is installed, when not shown it indicates that the USB memory has been remov
Remember you can the base station will record data for up to 15 days with the USB
memory Removed.
USB Memory Write Symbol- when the base station is writing to the USB memory
the Write Symbol will be flashing. The USB memory should not be removed form
the base station when the Write Symbol is flashing.
17
Monitoring Made Easy
Using the DataAngel Day to Day
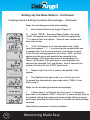
Other Display Symbols Explained - Continued
Memory Full Symbol - this indicates one of the following,
1. If the USB Memory Symbol is display then the USB memory is full and should be replaced.
2. If the USB Memory Symbol is not displayed then the base station memory is full and the USB Mem
needs to be re-inserted so that data can be recorded to it.
Memory Fault Symbol - this indicates that the base station detects a fault and
cannot write to the USB Memory.
1. Remove and re-install the USB memory stick to see if the fault display disappears
2. Reboot the base station by switching the power off for 15 seconds.
3. If still displayed then replace the USB memory with a new DataAngel USB configured
memory stick.
Sensor Battery Life Indicator - When the system detects that a sensors battery power is
running low this symbol will appear next to the Channel for that particular sensor.
Once this symbol is displayed then the sensor battery needs to be replaced. See Changi
a Sensor Battery on page ??
Monitoring Made Easy
18
For NON NETWORKED BASE STATIONS ONLY
If you system has a networked upgrade then please go to the
- Net
worked Options Section of this guide. The following USB chapters are
not relevant to you.
DataAngel has been designed to be able to operate as a completely stand alone
monitoring and recording system. All data is stored to the systems internal USB
memory, the instructions on how to access and view this data are described in
the follow pages.
For accessing data in a graphical format the DataAngels bespoke graphing software needs to be downloaded to a PC/Laptop.
Other reports area available in standard HTML and/or CSV formats. HTML will
open using the PC/Laptop's default Internet Browser software, CSV can be
viewed and used within a number of common software packages.
The base station will continue to record data for up to 15 days with the USB
memory removed. Once the USB memory is returned to the base station it will
update it with the outstanding days readings.
Data is written from the base station to the USB at midnight each day, therefore
only historical data is available (from the previous day backwards) when viewing.
Only Networked Upgraded Base Stations offer the capability of viewing data
stored and recorded within the same day.
Removing and Re-installing the USB Memory
The base station is designed to rotate forwards from the wall bracket to give access to
internal USB memory.
To open the base station forwards, gently lift the restraining clip on the top left hand
corner of the unit and lower forwards.
The USB memory will now be visible and accessible, reinstalling the memory stick is a
reverse of the above process.
19
Monitoring Made Easy
USB Section
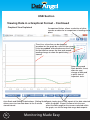
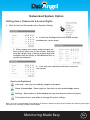
Naming Sensors on Channels For Graphs & Reports
DataAngel Graphs and Reports can have User defined names for sensors instead
of their channel number showing.
The following steps show how to add user defined names to sensors
1. Remove USB Memory Stick and insert in USB slot on PC/Laptop,
if auto run activates click open folder to view files, if auto run does
not start then open relevant USB drive via “My Computer” in Windows Start.
2. Open the “CONFIG” folder on the USB memory double click on
“StoreInfo” Application. Click allow if requested by computer.
3. In the “StoreInfo” application allows for a business name to b
added to the DataAngel reports & graphs as well as entering nam
for each sensor on all channels. Click on the load button and- a lo
tion window will open.
5. In the “StoreInfo” application will then reappear, enter the
required business name and the sensor names for each of the
channels (maximum 15 letters) and then press the save button.
Save as store.text file (overwrite current). Re-insert USB
memory into base station, reports and graph names will be
updated.
Monitoring Made Easy
20
USB Section
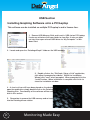
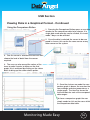
Installing Graphing Software onto a PC/Laptop
This software can be installed on multiple PC/Laptop's and is license free.
1. Remove USB Memory Stick and insert in USB slot on PC/Laptop,
if auto run activates click open folder to view files, if auto run does
not start then open relevant USB drive via “My Computer” in Windows Start.
2. Locate and open the “DataAngelGraph” folder on the USB memory.
3. Double click on the “TekGraph_Setup_v1.0.6” application,
click allow if prompted by widows. Within the Installation
Wizard click “next” when prompted. When prompted click the
“install” button. When installation is complete click finish to
close the installation window
4. A short cut Icon will have been placed on the desktop, to
open the application simply double click on the DataAngel
Graphing Icon. Functionality of the software will be covered
later in this section.
5. Remember to remove the USB memory and re-insert
into the DataAngel base station.
21
Monitoring Made Easy
USB Section
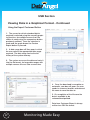
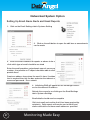
Viewing and Saving Reports
Reports are automatically created by the DataAngel at midnight each day and saved to
internal USB memory, these reports are created in HTLM and CSV formats and saved by
date.
To retrieve, review, save and print reports follow the steps below.
1. Remove USB Memory Stick and insert in USB slot
on PC/Laptop, if auto run activates click open folder to
view files, if auto run does not start then open relevant
USB drive via “My Computer” in Windows Start.
2. Locate and open the “REPORT” folder on the USB
memory. Double click to open.
3. Reports are saved in date order in a dd/mm/yy format. Double
click on any report to open, or right click and copy to copy and paste
to a new folder.
HTML reports will be opened with the computers default internet
browser. CSV files are opened by various packages, the most
common being Microsoft Excel.
Reports show the date, system name, sensors names (if updated),
the channel number, the high/low set points and then temperature
readings at 30 minute intervals for the whole of the day (see Figure 8
below).
Figure 8 Example HTML Report
Monitoring Made Easy
22
USB Section
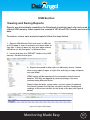
Viewing Data in a Graphical Format
The DataAngel graphing software allows you to view and compare data in an easy to us
format. The graphing software also allow for extended range CSV format data downloa
The installed graphing software will automatically search for updates when launched,
should updates be downloaded the software will notify of any action needed.
The steps below go through the process of using the graphing software.
1. Remove USB Memory Stick and insert in USB slot on
PC/Laptop. Double click on the DataAngel Graphing
software Icon on the desktop.
2. The graphing software will open, the first
actions to complete are;
A) Press the Close Button
B) Press the Change Connection Button.
When the Change Connection Button is
pressed a file path both will open.
3. Press browse and locate the path to the DataAngel USB memory stick, select the “DATA” folder
and then press OK.
Once the path file is pointed to the DATA files on
the USB click the Set button. The graphing software is not set to read the historic data stored on
the DataAngel USB memory
23
Monitoring Made Easy
USB Section
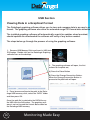
Viewing Data in a Graphical Format - Continued
4. Selected the date from which data is to be
reviewed. The whole stored memory is available
to choose from.
Single date, select one day with the cursor and
click on it to proceed to the next stage.
Week view, select any 7 day snake by ticking the
week view box and then moving the cursor over
the days then click make a selection.
5. Select the sensor for which data is to be
reviewed by clicking on it with the cursor.
Once a selection is made a
graph opens with data for the
full time period viewed.
The user has the ability to
then perform further actions
on this graphical data to
investigate and view further.
Monitoring Made Easy
24
USB Section
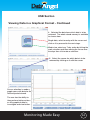
Viewing Data in a Graphical Format - Continued
Graphical View Explained
Comparison Button, allows a selection of other
sensors or dates for a comparison of readings to ta
place.
Time Line, a time line can be dropped
anywhere on the graph by a click of the cursor,
it can be grabbed and moved across the X axis.
As the time line moves the time and sample
reading change to show the point being
viewed.
Data change and
Stats buttons, these
allow for easy
change of data and
a quick view of
important stats.
Auto Scale and Sliding Scale buttons. Sliding ScaleExport simply gives a CSV export of the data selected
allows users to view data down to the 5 minute
within the graph. Export Customer lets the user
stored interval.
select the date range for the sensors selected within
the graph, use full for long date range data exports.
25
Monitoring Made Easy
USB Section
Viewing Data in a Graphical Format - Continued
Using the Comparison Button
1. Pressing the Comparison Button opens a new date
window for the comparison date to be chosen, if in
single date mode one day can be clicked, if in week
mode 7 days can be selected.
2. Once the date is selected the sensor to be
- com
pared is chosen, this can be the same sensor or any
other sensor on the system
3. One the sensor is selected the user can then
choose the level of detail from the sensor
required.
4. The user can also amend the colour of the
trace to make it easier to follow on the final
graph, this is achieved by clicking on the colour
block to bring up the colour choice patter.
5. Once the choices are made the -com
parison graph is drawn, the user has the
same change and view parameter as a
single graph. The time line shows the
time and data for each of the compared
data ranges.
To close a comparison graph the user
simply needs to click on the cross within
the comparison data table.
Monitoring Made Easy
26
USB Section
Viewing Data in a Graphical Format - Continued
Using the Export Customer Button
1. The sensor for which extended data is
required is selected using the normally graphing function, for multiple sensors then the
choice is made using the comparison button
previously outlined. Once the selection is
made and the graph drawn the Custom
Export button is pressed.
2. A date range box will then open in which
the user selects the appropriate date range
required. The date range can be the full
history of the system memory.
3. The system accesses the data and sorts it
into the file format, for large date ranges with
multiple sensors this can take a some time.
4. Once the download is complete an
automatic save box will open, the user
needs to choose a location and relevant
file name to save the data to.
5. On completion of the file save the
data is available to be
reviewed/manipulated.
Data from Customer Export is always
written to a CSV file format.
27
Monitoring Made Easy
USB Section
Viewing Event & Alarm Logs
All alarms and events are recorded by the system into its USB memory. Each alarm/eve
given its own ID and the date, time, Device and other relevant data are recorded.
The steps to access and review alarm & event data are
1. Remove USB Memory Stick and insert in
USB slot on PC/Laptop, if auto run activates
click open folder to view files, if auto run does
not start then open relevant USB drive via “My
Computer” in Windows Start. Double click the
“ALARMS” folder to enter
2. Select the relevant alarm folder from the list
and double click to open.
ALARMS is the last 100 alarms and events.
Other folders are alarms by month archived at
50 events per report. Therefore a month with
300 events would have 6 reports relating to it.
An alarm/event report showing
the data that can be viewed in
each stored report.
Monitoring Made Easy
28
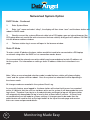
Networked System Option
This section is ONLY relevant to base station systems that have the Networked Upgrad
Option installed.
Contact the suppling retailer for details on how to upgrade a base station from
- a non
networked system to a networked system.
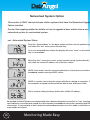
net - Networked System Status
Enter the “System Menu” on the base station and then use the up/down key
and select the “net” menu, press the enter key.
On a non-networked base station the display will show “none” as this -functi
ality is not available.
Selecting “Info” shows the current system network set up (system default), W
also show the current IP address set in the base station.
DHCP client mode, used for connecting directly to a local area connection o
broadband modem running a DHCP server.
DHCP is used for connecting the system directly to a laptop or computer. O
the computer or laptop connected will be able to view and access data.
Stat is used for setting the base station with a Static IP address.
Networked Activated Systems are despatched with a default networked connection of “Lan” meaning
can be directly connected and viewed on a local network or broadband connection operating with DH
client mode. A vast majority of local networks and broadband routers have this mode so no further ac
usual needs to be taken.
29
Monitoring Made Easy
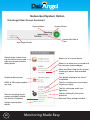
Networked System Option
Viewing Systems Networked Status “Info”
The systems networked status can be viewed in the following way.
1.
Enter System Menu
2.
Enter “net” menu and select “Info”, the network connection type will be displayed for 2 second
i.e. “Lan” then the IP address assigned will be shown in blocks, based on an ip address being assigne
blocked packages, please note that the gap between each block displayed will be represented by a fu
stop in the written IP address, e.g 192.168.0.114 would be seen as 192 then 168 then 0 then 114 on th
base station screen.
3.
Once shown the display returns to the “net” menu level.
When viewing system “Info”, Err1 indicates that no network connection ca
be detected by the base station. Check that the either net connection is
correctly made at both the base station and the ethernet connection point
(Network point or broadband modem).
Default Lan Connection
To test for connection for this mode then directly connect the base station systems Ethernet
cable into a network point or broadband modem.
From any PC or laptop logged onto that network type “myangel” into any standard internet
browser IP address window. If the connection is successful the log screen of the DataAngel
will appear. If the browser fails to find the DataAngel then follow the instructions for viewing
the systems networked status above, note the IP address assigned by the network to the
DataAngel and input this IP address directly into the internet browser address window.
DHCP Mode
In DHCP mode only a PC/laptop directly connected to the base station will have access to the on-bo
data. To access the system from other PC’s or Laptop's it will need network connected in either Lan
Static IP modes.
DHCP mode is ideal when initial completing a system set up, once set up is complete then the defaul
Lan or Static IP modes should be selected via the “net” menu.
Monitoring Made Easy
30
Networked System Option
DHCP Mode - Continued
1.
Enter System Menu
2.
Enter “net” menu and select “dhcp”, the display will then show “save” and the base station will
reboot in DHCP mode.
3.
Directly connect the systems Ethernet cable into a PC/Laptop, open an internet browser (the
PC/Laptop does not need to be online to access the base station) and type the IP address 192.168.1.1
into the browser address window.
4.
The base station log in screen will open in the browser window.
Static IP Mode
To enter a static IP address the base station would first need to be connected to a PC/Laptop
or network using either the DHCP or Lan connection modes above.
Once connected the network connection details can be amended and a static IP address set
for the system. For information on setting a static IP address follow the instructions in on
page.
Note - When a new networked selection mode is made the base station will always display
“save” and the system will then reboot. Once the system has rebooted it will be operating in
the chosen mode.
All changes made are recorded in the systems Event Log.
As a security feature, once logged in, the base station will review that the user has remained
active, if it detects that the user has not been active on the system it will downgrade the users
log in level. Therefore if you log in as the administrator and forget to log out the base station
will automatically downgrade the log in level to that of Guest after 5 minutes. At Guest level
no modifications can be made to systems settings, if changes need to be made then the
administrator will need to click on the login button at the top of the web page and re-enter
their user name and password details.
31
Monitoring Made Easy
Networked System Option
Logging into A DataAngel
Open any standard internet browser and type your DataAngels set IP address into the browser addres
window.
The DataAngels log in screen will appear, on a new unit the default Administrator login details are
User Name: admin
Password: admin1
The Current Sensor Readings screen is the default page when logged in, all current sensors
that are paired with the base station have their readings appear on this page. The set up for
nearly all screens on the DataAngel is the same, they have the System Management bar fixed
on the left hand side of the page with the details and change/amend functions then displayed
on the right-hand side.
The only variance to this are the Historical Data elements, the graphing uses the full screen
and reports are opened into new windows.
Monitoring Made Easy
32
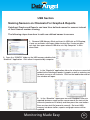
Networked System Option
DataAngel Main Screen Explained
System Name
System Status
Current Set Date &
Time
User Login Details
Default login screen show
ing all current sensor read
ings and set points/Alarm
delay details
Shows no. of current alarms
Shows if an alarm has occurred and
has not been acknowledged
Alarm and Event Log for the system,
showing all alarms and recorded
events
Graphical data viewer
The details relating to the site of
installation
HTML & CSV report produc
tion tool
Tool for creating users and assign
ing access rights
Tool for setting up email configuration
Tool for changing sensor
names and apply calibration offsets if required
Tool for setting IP connection
protocols
Date and Time settings window
System specification
details
33
Monitoring Made Easy
Networked System Option
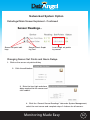
DataAngel Main Screen Explained - Continued
Sensor set point edit
keys
Sensor Direct Graph
ing Tool
Low & High set points
by sensor
Changing Sensor Set Points and Alarm Delays.
1. Click on the sensor set point edit key
2. Click the edit button
3. Enter the low, high and alarm
delay required for the sensor and
click submit.
4. Click the “Current Sensor Readings” tab under System Management,
select the next sensor and complete steps 1-4 above for all sensors.
Monitoring Made Easy
34
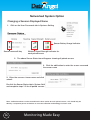
Networked System Option
Changing a Sensors Displayed Name
1. Click on the User Passwords tab in Systems Setting
Sensor Battery Usage Indicator
Sensor name edit key
Wireless Signal Strength indicator for
each paired sensor
2. The above Sensor Status bar will appear showing all paired sensors
3. Click the edit button to enter the screen so amend
the sensor name
3. Enter the sensors chosen name and click
submit.
Re-click the Sensor Status tab in System Settings
and complete steps 1-3 for all paired sensors.
Note - Calibration offsets can be entered into the base station for each paired sensors, this should only be
done by a competent person and where an accurate calibration methodology has been used.
35
Monitoring Made Easy
Networked System Option
Setting Users, Passwords & Access Rights
1. Click on the User Passwords tab in Systems Setting
2. In the User Privileges box click on edit so that
amendments can be made
3. Enter unique user names and passwords for
each of the 4 other user on the system. Password
must be 5 digits long. Creating a guest login allows
multiple users the facility to view data but may no
system amendments
4. User and now created and will have access to
the system.
User Level Explained
View only - can only see readings, graphs and reports
Alarm Acknowledge - Same rights as View but can also acknowledge alarms
Settings - Same rights as Acknowledge but can also amend system set points
Full system access and ability to change all system settings
Note - for users to acknowledge alarms directly on the base station then they will also need to be created as per Page 12
Creating Users & Setting Up Alarm Acknowledge
Monitoring Made Easy
36
Networked System Option
Setting Up Email Alarm Alerts and Email Reports
1. Click on the Email Settings tab in Systems Setting
2. Click on the edit button to open the edit box so amendments
can be made
3. Enter the emails address for reports or alarms to be sent to,
click which type of email should be received
Enter the email providers smtp domain name & server port
number - the provider or IT depart should be able to easily
provide these
Create an address from where the email is from, if authentica
tion is required then tick the box and enter the relevant user
name and password. Press submit
4. Initialising DNS will appear as the DATAangel searchers for the relevant IP address
Refresh the screen by re-clicking on the Email Settings
tab in Systems Settings
Email details should now be complete
Click test email and confirm that it has been received by
recipients. Daily reports will now be sent at 00.01 and
alarm notifications to those email addresses specified
37
Monitoring Made Easy
Networked System Option
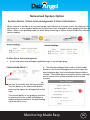
System Alarms, Online Acknowledgement & Alarm Information
When a sensor is outside of its set point range it will indicate on the login screen the stages of the
alarm process, in the captions below the System Status has changed to alarm pending and then on
Alarm. When in the pending mode the alarm delay remaining is clearly shown besides the relevant
sensor reading.
Online Alarm Acknowledgment
1. A user with alarm acknowledge capabilities logs in via the login page
2. The Unacknowledged Alarm tab is clicked under
Alarms in the System Management menu to open the
alarm dialogue box, the Acknowledge Alarm button is
clicked. The audible alarm at the base station will stop
and an alarm event will be entered into the system
memory.
These buttons on the dialogue box allow
the user to instantly view the alarm details.
The first button is the Information button,
pressing this opens the dialogue box to the
right.
The second button is the graphing function,
by pressing this the system will display a
graphical representation of the data leading
up to the alarm event.
Monitoring Made Easy
38
Networked System Option
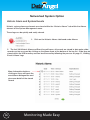
Historic Alarm and System Events
Historic system alarms and events are stored within the “Historic Alarms” tab within the Alarms
element of the System Management menu.
These logs can be quickly and easily viewed.
1. Click on the Historic Alarms tab found under Alarms
2. The last 100 Historic Alarm and Event Log will open, all records are stored in date order, older
records can be accessed by clicking on the green arrow at the bottom of the log list. Older logs are
stored within the USB memory and can be accessed by following the process on page 11, Viewing
Event & Alarm Logs
More Information buttons,
clicking on these will open the
event/alarm dialogue box and
give more detail of the stored
record
39
Monitoring Made Easy
Networked System Option
Reviewing Historical Data
Historic Data Graphing Tool
Access to the graphing tool can be reached in 2 ways on a networked DataAngel,
The first is via the “Current Sensor Readings” screen using the Sensor Direct Graphing Tool
Icon. Pressing this Icon will open the graphing tool for the sensor chosen and ask for a
date to be chosen.
The second access method is by clicking on the “View Graph” tab under the Historical
Data Tab.
The functionality of the networked graphing is broadly similar to that of the non-networked
system, to learn more on how to use the graphing tool refer to the instructions within pages
24 to 26, Viewing Data in a Graphical Format.
Exporting Custom Data
DataAngel offers the user the ability to be able to export data into CSV format for the
memories full recorded length.
This functionality is only available via the PC/Laptop graphing function. To be able to
output extended date ranges into a CSV format the instructions on pages 23 to 27 will
need to be followed.
Historic Data Reporting Tool
By clicking on the “View Reports” button under Historic Data, the daily report generating tool is
activated.
Select the required date range and output format (CSV or HTML) and the system will generate a
report for the date requested.
This daily report can be automatically generated and emailed each day automatically by the system
if this is an item that is required daily then the easiest way to receive the document is to set up rep
emails. Refer to Setting-up Email Alarm Alerts & Email Reports earlier in this section.
Monitoring Made Easy
40
Networked System Option
Historic Data Reporting Tool - Continued
Reports show the date, system name, sensors names (if updated), the channel number, the
high/low set points and then readings at 30 minute intervals for the whole of the day (see the
example HTML report above).
Reports can be printed or saved and generated again from the system memory at any time.
Note - HTML reports will be opened with the computers default internet browser. CSV files are opened by various
packages, the most common being Microsoft Excel.
41
Monitoring Made Easy
Networked System Option
Other System Settings Options
Site Settings
Within Site Settings the user has the ability to change the site name to that of the business & set the
network settings for the base station.
1. Click on the Site Settings under System Settings
2. Click on the edit button and the edit-able dialogue box will
open.
Within the edit-able dialogue box the user can amend the Site
Name and change the Network Mode of the Base Station.
If the system has been set up in DHCP mode then ether Static IP
or Lan modes can be chosen.
For a vast majority of users Lan (the default setting) will be the
network mode used.
Once the relevant changes are made press submit to save the
amendments on the base station.
3. If the network mode has been changed press the reboot
button to reboot the base station.
IP Dial Out/In Settings
This function is used mainly by business with external monitoring being carried out by a 3rd party. T
allows the 3rd party access to data from the base station and for alarm communication.
Engineering
This page contains all the system data stored in one place. It can also be used to update software
software update be purchased in the future.
Monitoring Made Easy
42
Monitoring Made Easy