1
ValveExpert
Automatic Teststand
for Checking, Maintenance, and
Adjustment of Servovalves
User Manual
DIETZ automation GmbH, March 2004
Contents
ValveExpert............................................................................................................................................................ 1
Contents.................................................................................................................................................................. 2
Introduction ............................................................................................................................................................ 4
Review of Specifications........................................................................................................................................ 5
Application ......................................................................................................................................................... 5
Control Signal for Servovalve ............................................................................................................................ 5
Spool Position Signal (Feedback) ...................................................................................................................... 5
Power Supply for Servovalve............................................................................................................................. 5
Hydraulic Fluid................................................................................................................................................... 5
External Power Supply for ValveExpert ............................................................................................................ 5
Hydraulics .............................................................................................................................................................. 6
Accessories ............................................................................................................................................................. 7
Measurement Piston ........................................................................................................................................... 7
Standard Cables .................................................................................................................................................. 7
Adapter Manifolds.............................................................................................................................................. 8
Cover Cap........................................................................................................................................................... 8
Universal Control Board......................................................................................................................................... 9
Servovalve Connector (Stand View) .................................................................................................................... 10
Software “ValveExpert”....................................................................................................................................... 11
Software Installation......................................................................................................................................... 11
Main Dialog...................................................................................................................................................... 12
Menu Description ............................................................................................................................................. 12
File................................................................................................................................................................ 12
Load.............................................................................................................................................................. 12
Save .............................................................................................................................................................. 13
Analysis ........................................................................................................................................................ 13
Exit ............................................................................................................................................................... 16
Tests.............................................................................................................................................................. 16
Automatic Test ............................................................................................................................................. 16
Manual Test .................................................................................................................................................. 18
Manual Test Sequence (Example)................................................................................................................ 21
Special futures of the Manual Test Dialog Box ........................................................................................... 22
Database ....................................................................................................................................................... 23
Settings ......................................................................................................................................................... 24
Help .............................................................................................................................................................. 25
Contents........................................................................................................................................................ 25
DIETZ automation (Web) ............................................................................................................................ 25
About ............................................................................................................................................................ 25
Menu Description Shortcuts ............................................................................................................................. 25
Definitions ............................................................................................................................................................ 26
Electrohydraulic Flow Control Servovalve ...................................................................................................... 26
Rated Control Interval ...................................................................................................................................... 26
Rated Minimum and Maximum of Control...................................................................................................... 26
Predefined Bias................................................................................................................................................. 26
Rated Signal ..................................................................................................................................................... 26
Four-Way Servovalve....................................................................................................................................... 26
Supply Pressure ................................................................................................................................................ 26
Return Pressure................................................................................................................................................. 26
Load Pressure Drop .......................................................................................................................................... 26
Valve Pressure Drop......................................................................................................................................... 27
Pressure curve................................................................................................................................................... 27
Pressure Hysteresis........................................................................................................................................... 27
Pressure Gain.................................................................................................................................................... 27
-2DIETZ automation GmbH, March 2004
Control Flow (Load Flow or Flow Output)...................................................................................................... 27
Polarity ............................................................................................................................................................. 27
Null Bias........................................................................................................................................................... 27
Null Shift .......................................................................................................................................................... 27
Rated Flow ....................................................................................................................................................... 27
Flow Curve ....................................................................................................................................................... 28
Hysteresis (Flow Hysteresis)............................................................................................................................ 28
Normal Flow Curve.......................................................................................................................................... 28
Flow Gain ......................................................................................................................................................... 28
DSS Method ..................................................................................................................................................... 28
Internal Leakage ............................................................................................................................................... 28
Null Leakage .................................................................................................................................................... 28
Leakage Curve.................................................................................................................................................. 29
Leakage Hysteresis........................................................................................................................................... 29
Total Valve Flow.............................................................................................................................................. 29
Spool Position Signal ....................................................................................................................................... 29
Spool Position Diagram.................................................................................................................................... 30
Spool Position Hysteresis ................................................................................................................................. 30
Dynamical Model of Servovalve...................................................................................................................... 30
Frequency response .......................................................................................................................................... 30
Natural Frequency ............................................................................................................................................ 30
Degaussing Control .......................................................................................................................................... 30
Address ................................................................................................................................................................. 32
-3-
DIETZ automation GmbH, March 2004
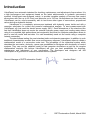
Introduction
ValveExpert is an automatic teststand for checking, maintenance, and adjustment of servovalves. It is
a high performance test equipment based on the latest achievements in hydraulic servocontrol
systems. ValveExpert was designed, mainly, to provide complete analysis of four-way flow control
servovalves with flow up to 80 L/min and pressure up to 210 bar. Nevertheless we must note that
ValveExpert can be used successfully also to test some other types of servovalves, proportional
valves and other hydraulic devices.
ValveExpert is a completely autonomous teststand with hydraulic power inside and with a
computer subsystem for control and powerful mathematical analysis. To start measurement with
ValveExpert you just need the electric power supply 380 V. Small dimensions of the stand and the
fact that ValveExpert does not require an external hydraulic power supply and cooling water allows
using it as a portable high performance test equipment. Note that the computer subsystem allows to
print or save all results and test data. You can immediately send out the results using a computer
network connection.
The stand allows testing the most standard static and dynamic parameters. In addition to such
traditional characteristics as static flow curve and frequency response, ValveExpert allows to obtain a
mathematical model of a servovalve under test. The knowledge of the dynamical system which
describes the servovalve, obviously, opens new possibilities for designers and developers of control
systems. They can use the obtained model for fast computer simulations as well as for complex
mathematical analysis. We believe ValveExpert will give you best possibilities for checking,
maintenance and adjustment of your servovalves. The developers and designers will find
ValveExpert as a good tool to construct excellent control systems.
General Manager of DIETZ automation GmbH
/Joachim Dietz/
-4-
DIETZ automation GmbH, March 2004
Review of Specifications
Application
The teststand is developed for checking, maintenance and adjustment of four way servovalves with
rated flow up to 80 L/min and supply pressure from 60 to 210 bar.
Control Signal for Servovalve
Using ValveExpert you can check servovalves controlled by current as well as voltage. There are four
ranges with 12 bit resolution for current control: ±10, ±20, ± 50 and ±100 mA. We must note that, in
reality, the electronics covers about 120% of these ranges, i.e., for instance, maximal control current
for ±100 mA range is about 120 mA. This extension is made for 20% possibility to correct the null
bias of the servovalve, i.e. teststand is able to produce tests with amplitude 100 mA and control shift
20 mA. Note also that ±20 mA range is used for the popular standard control 4 – 20 mA. There is one
range Voltage control signal ±10 V. The real output signal can be also 20% more, i.e. ±12 V. Note
that ValveExpert has build in switches to change polarity of control and coil configurations (series,
parallel or single coil).
Spool Position Signal (Feedback)
Many modern servovalves have build in electronics. These valves are usually equipped with position
transducers used for internal feedback of the spool position. ValveExpert can check a signal from the
spool position transducer. The standard signal ranges (±10 V, ±10 mA, 4 – 20 mA) are supported.
Power Supply for Servovalve
Servovalves with build in electronics require external power supplies. In most cases it is ±15 V DC or
24 V DC with current 1 – 2 A. Such power suppliers are built in the teststand.
Hydraulic Fluid
The teststand ValveExpert was developed and tested for a mineral oil with viscosity about 30. We
recommend you to use Mobil DTE24, Shell Tellus 29, MIL-H-5606 or oil with the similar parameters.
We must note that these requirements are needed basically to satisfy the requirements of a pump
and a flowmeter which are built in the teststand. So, you should ask the producers of the pump and
flowmeter before using another hydraulic fluid.
The integrated filtration system achieves a cleanliness level 5 of NAS1638 (level 14/11 of ISO4406)
or better. The filtration is controlled by an operator of the stand and depends evidently on the
contamination level of the servovalves been tested.
External Power Supply for ValveExpert
The teststand does not require an external hydraulic power supply because it is inside. ValveExpert
does not need a water connection for cooling because it does not take much energy. The only threephase ~380 Volt, 50 Hz power supply is required to start measurements with ValveExper.
-5-
DIETZ automation GmbH, March 2004
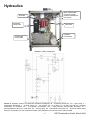
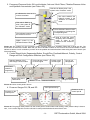
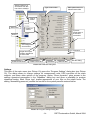
Hydraulics
Main manifold with
minimess access,
pressure transducers,
and valves
3mk filter
Brushless
servomotor
10mk filter
Hydraulic
accumulator
Oil tank with
pump inside
Picture 1. Inside ValveExpert.
Picture 2. Hydraulic schema for automatic teststand ValveExpert. M – brushless servomotor, PU – gear pump, T –
temperature transducer, L – oil level sensor, F1 – 10µ oil filter, F2 - 3µ oil filter, F3 – air filter, PA, PB, PS – pressure
transducers for 0-250bar, AC – 4L hydraulic accumulator, VS1 – high precision gear-principle flowmeter, K1 –
pressure/filtration valve, K2 – load valve, K3 – security valve, SV – manifold for servovalve, D1 – throttle to restrict return
flow from accumulator AC. All components inside of the dotted box are mounted on the main manifold.
-6-
DIETZ automation GmbH, March 2004
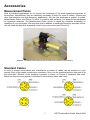
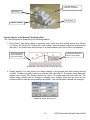
Accessories
Measurement Piston
Most of industrial applications do not require the knowledge of the exact dynamical properties of
servovalves. Nevertheless, they are absolutely necessary to know for most of military, science and
other high precision and high frequency applications. Our firm has developed a special, so called,
Measurement Piston (see Picture 3) which, in combine with teststand, is a powerful test equipment
for dynamical response. The Measurement Piston allows to obtain the complete knowledge on
dynamics of your servovalve. We must note that in addition to traditional frequency response curves,
you will obtain the best liner dynamical model of your servovalve (see Picture 41).
Picture 3. The Measurement Piston and a servovalve are installed on the teststand.
Standard Cables
In order to connect servovalves with ValveExpert a number of cables can be delivered on your
request. Each of the cables contains two connectors. One is for the teststand and the other one is for
the servovalve. Schema of the teststand connector is shown on Picture 6 (teststand side view).
Below we show the most popular connectors for servovalves (cable side view).
-7-
DIETZ automation GmbH, March 2004
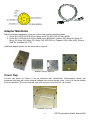
Adapter Manifolds
With the standard equipment come two of the most popular mounting plates.
1. Norm ISO 10372-06-05-0-92 (for Moog series 72, MTS 252.3x, Ultra 4550).
2. Norm ISO 10372-04-04-0-92 (for Alpha series B0020010, Atchley 209, Moog 62, Moog 73,
Moog 76, Moog 760, Moog 761, Moog 765, MTS 252.2x, Pegasus 122A, Ultra 4653, Vickers
SM4-20, Voskhod UG-176).
Additional adapter plates can be delivered on request.
Picture 4. Adapter Manifolds.
Cover Cap
A cover cap shown on Picture 5 can be delivered with ValveExpert. Unfortunately nobody can
guarantee that there will not be external leakage from a valve during a test. A lot of oil can be outside
in such a situation. The cover cap will save you and your room from the “oil shower”.
Picture 5. Cover cap.
-8-
DIETZ automation GmbH, March 2004
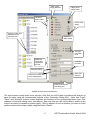
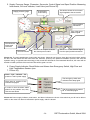
Universal Control Board
Servovalve
10. – +15 V
9. – –15 V
8. – +24 V
7. – GND
6. – Spool position –
5. – Spool position +
4. – D
3. – C
2. – B (Control -)
1. – A (Control +)
Power supply
Temperature transducer
Pressure transducer PA
Pressure transducer PB
Computer
PCI-6025E
Measurement piston
Pressure transducer PS
VSE flowmeter
Pressure indicator
Motor control
Valve K1
380 V power switch
Valve K2
Oil level
10 PN Filter
Emergency
3 PN Filter
-9-
DIETZ automation GmbH, March 2004
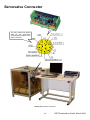
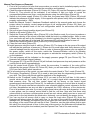
Servovalve Connector
You may construct a special
cable for your servovalve
according this schema of the
stand connector.
Picture 6. Serovalve connector
- 10 -
DIETZ automation GmbH, March 2004
Software “ValveExpert”
Software Installation
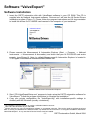
1. Insert the DIETZ automation disk with ValveExpert software in your CD ROM. This CD is
supplied also by National Instruments software. “Autorun.exe” will start the NI Device Drivers
installation program (Picture 7). Please follow the program instructions and NI documentation
to install the drivers for PCI-6025E card inserted in the computer of your teststand.1
Picture 7. NI Device Drivers installation program.
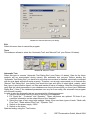
2. Please execute the Measurement & Automation Explorer (Start o Program o National
Instruments o Measurement & Automation) and check that your NI PCI-6025E card works
properly (see Picture 8). Note, by default Measurement & Automation Explorer is located in
"C:\Program Files\National Instruments\MAX\NIMax.exe"
Picture 8. Measurement & Automation Explorer
3. Start “CD:\ValveExpert\Setup.exe” program to begin setup the DIETZ automation software for
ValveExpert.2 Follow the program instructions to complete the installation.3
4. Copy your private configuration file “ValveExpert.cfg” with installation-specific settings to
directory with MS Windows (usually c:\windows\).
1
The installation program must be run under a valid administrative account.
Here CD is the drive letter of your CD ROM.
3
Please note that you can use ValveExpert software on a separate computer. This can be useful to analyze saved test
data or correct your database file “DBAccess.mdb”. By default this file is located in “C:\Program Files\DIETZ Automation
GmbH\ValveExpert\”. In any case the NI Device Drivers must be installed.
2
- 11 -
DIETZ automation GmbH, March 2004
Main Dialog
By default, the program ValveExpert is installed in:
C:\Program Files\DIETZ Automation GmbH\ValveExpert\ValveExpert.exe.
You can execute it using the following icon
from start menu:
Start Program o DIETZ automation o ValveExpert o ValveExpert
The following dialog will appear.
Menu line
Toolbar
Picture 9. Main dialog of the program “ValveExpert”
This dialog includes menu line and toolbar. Menu is used for access to all dialogs of the program.
Toolbar contains five buttons for fast call of the main functions.
Menu Description
File
This submenu (see Picture 10) allows to work with data which were obtained at the testing process. It
can be used also to close the program.
Picture 10. Submenu “File”
Load
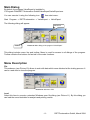
Select this item to execute a standard Windows open file dialog (see Picture 11). By this dialog you
can load the saved test data for analysis and printing results.
- 12 -
DIETZ automation GmbH, March 2004
Selected file
Filter for files
to be shown
Load the
selected file
Cancel the
loading
Picture 11. Windows open file dialog. The filter *.DSS is used by default for data files.
Save
Select this item to save data of a test in a file. A standard Windows file dialog will be open (see
Picture 12). If test data are saved, you are able to load the data and produce the analysis.
Name for
test data file
Picture 12. Windows save file dialog. Note the DSS extension is used by default to save the data.
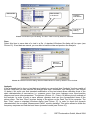
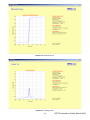
Analysis
If the automatic test is done or test data are loaded you can select item “Analysis” to show results of
the test. Note that you can execute the analysis also from “Automatic Test Dialog Box” (see Picture
19 below). We must note that standard modification of the test stand allows checking most of the
static characteristics of servovalves, i.e.: pressure curve, flow curve, leakage curve, spool position
diagram and some other parameters. The pictures (Picture 13 – Picture 16) below give an example of
the analysis. In order to print or save pictures operator shall use the corresponded items of the
picture menu. The item “Save” involves saving of the picture on the Desk Top of the computer. The
item “Print” opens a standard Windows dialog (see Picture 17). In order to check the dynamic
characteristics, the so called “Measurement Piston” must be installed. This option allows to obtain the
frequency response and find the best linear dynamical model (see Picture 41).
- 13 -
DIETZ automation GmbH, March 2004
Picture 13. Pressure curve.
Picture 14. Leakage curve.
- 14 -
DIETZ automation GmbH, March 2004
Picture 15. Flow curve.
Picture 16. Spool position diagram.
- 15 -
DIETZ automation GmbH, March 2004
Picture 17. Standard Windows print dialog.
Exit
Select this menu item to cancel the program.
Tests
This submenu allows to select the “Automatic Test” and “Manual Test” (see Picture 18 below).
Picture 18. Submenu “Tests”.
Automatic Test
Select this item to execute “Automatic Test Dialog Box” (see Picture 19 below). Data for the future
analysis will be accumulated during namely this automatic test process. Before starting the
“Automatic Test Dialog Box” you have to be sure that a servovalve is installed, electrically connected
with the test stand and which works properly. Therefore, we strongly recommend you to execute the
“Manual Test Dialog Box” (see below) and check the type and value of rated signal, polarity, rated
flow, type of spool position signal, null bias and maximum value of leakage. After the checking please
verify that the valve parameters in your database are close to these which you found (see “Database
Dialog Box”). Note: if the database parameters are very far from reality, the automatic test program
will not work correctly.
In order to start the automatic test we recommend the following sequence:
1. Select a servovalve model you plan to test from your database.
2. Fill “Serial No.”, “Customer” and “Operator”. These edit boxes are optional. Fill them if you
need this information on the output forms of the “Analysis”.
3. Select the type of test using tests settings. Notes, there are three types of tests: “Static with
Flow Test”, “Static without Flow Test”, “Dynamic Test”.
4. Switch on the power supply ~380V.
5. Switch on the motor.
Start the testing using the “Test” button.
- 16 -
DIETZ automation GmbH, March 2004
~380V power
supply indicator
~380V power
supply switch
Hardware
alarm states
Power motor
switch
Choose a valve from
database for the
automatic test
Reset the
alarm states
Test type
you prefer
to do
Additional
information
supplied for
the test
Load data
from disk
Start the testing
Save data
after test
Analyze the results after
test or loading data
Close the Automatic
Test dialog box
Picture 19. Automatic test dialog box.
The test process usually takes some minutes. After that you will be able to produce the analysis or
save the data using the corresponded buttons of the “Automatic Dialog Box”. Note that "Load",
"Save", and "Analysis" buttons exactly duplicate the functions of the corresponded items from “File”
submenu of the main dialog menu (see above). Note also that you will not be able to switch on the
motor if an alarm is indicated or power supply ~380V is absent. In such a situation you have to fix the
problem and reset the alarm states using the button “Reset”.
- 17 -
DIETZ automation GmbH, March 2004
Manual Test
The item “Manual Test” of submenu “Tests” (see Picture 18) calls “Manual Test Dialog Box” (see
Picture 20). Namely this dialog box should be the starting point of your test process. The intuitively
understandable interface of “Manual Test Dialog Box” shows a structural schema of the teststand and
gives a possibility to manually check your valve. We strongly recommend you to check type and
value of rated signal, polarity, maximal total flow, type of spool position signal, value of null bias and
maximal leakage before starting the automatic test for your valve. Notes, the “Manual Test Dialog
Box” contains also indicators of power supply ~380V and alarm states of the stand. Below we
describe the basic control elements of the dialog.
Picture 20. Manual Test Dialog Box. An example how to check null bias is shown. Supply pressure is installed 70bar,
Rated Control Interval is -20mA … 20mA, polarity is positive, coil connection is serial. Valve is controlled by feedback
signal from the valve pressure drop transducer at control ports blocked, i.e. at zero control flow. Flowmeter shows a small
leakage. Milliamperemeter shows 1.4 mA null bias.
1. Power Supply, Motor Switch, Frequency/Pressure Knob and Temperature Indicator (Picture
21).
Swith On/Off ~380V Power Supply
Knob to control the
motor frequency at the
“Filtration” mode or
value of the pressure at
the “Pressure” mode
Swith On/Off Motor
Oil Temperature in
the tank of power
hydraulic station
Digital control by the knob
Picture 21. The main hydraulic station controls. Note that you are not able to switch the motor until ~380V is not switched
on. Note also that high temperature will immediately stop the motor.
- 18 -
DIETZ automation GmbH, March 2004
2. Frequency/Pressure Knob, Oil Level Indicator, 3mk and 12mk Filters, Filtration/Pressure Valve
and Hydraulic Accumulator (see Picture 22).
This tube is filled by blue it the
system at the “Pressure” mode
It indicates the level of oil
in the accumulator
This valve switches the
hydraulic system in the
“Pressure” of “Filtration”
mode.
This tube is filled by
blue it the system at
the “Filtration” mode
These indicators become red if
it is necessary to exchange the
corresponding filter.
The indicator becomes red if
the oil level is too low.
Knob to control the motor
frequency at the “Filtration”
mode or value of the
pressure at the “Pressure”
mode
Digital control by the
Filtration/Pressure knob.
Picture 22. The system is in the “Pressure” mode. Pressure 1000 psi is installed. Filters and oil level are OK. The
accumulator is about 50% loaded. Note that you will not be able to switch on the motor if the oil level indicator or filters
indicate an alarm. In such a situation you have to fix the problem and reset the alarm states using the button “Reset” (see
Picture 26 below).
3. Control Signal Knob, Degaussing Button, Rough/Fine, Feedback/Manual, Polarity, Control
Range and Coil Configuration Switches (see Picture 23).
Switches between “Fine”
and “Rough” control modes
This knob sets a value
of control signal
Polarity of the
control signal
Type of coil
configuration
This button
starts the
Degaussing
Digital value of the
control knob
Manual Control / Hardware Feedback
Range of Control
Picture 23. Valve control panel is shown.
4. Pressure Gauges PA, PB, and DP.
Valve pressure drop
Pressure on the
control port B
Pressure on the
control port A
Picture 24. The gauges show pressure on the control ports of a servovalve under testing. Valve pressure drop is close to
zero, i.e. the control signal is near the null bias if control ports blocked and control flow is zero.
- 19 -
DIETZ automation GmbH, March 2004
5. Supply Pressure Gauge, Flowmeter, Servovale, Control Signal and Spool Position Measuring
Instruments, Oil Level Indicator, Load Valve (see Picture 25).
Supply pressure gauge
This device shows the real control
signal applied to the servovalve
A servovalve
under testing
Spool
Spool position
transducer
Port A
Port B
Type of the spool
position signal
This flowmeter
shows total
valve flow
Oil level indicator
The load valve opens or blocks
the control ports A and B.
This device shows electrical signal
from the spool position transducer
Picture 25. The main attachments of servovalve are shown. Please do not forget to close the load valve before starting
the test. This will restrict the total valve flow and, therefore, speed up the pressure installation process, and save the
hydraulic energy. In opposite case the energy of the control flow will heat oil of the teststand. Moreover, the motor will not
be able to install a pressure if the total valve flow will be grater 15 L/min
6. Power Supply Indicator, Reset Button and Alarms from Emergency Switch, High Flow and
High Temperature Sensors (see
7. Picture 26).
Green light indicates the
presence ~380 V power supply
The emergency switch was
activated if this lamp lights
There was an overflow if this
indicator lamp lights
In order to clear the alarm states
please fix the problem and, then,
click the reset button
The oil temperature increased
60 0C if this lamp lights
Picture 26. Power supply indicator, reset button, and alarm indicators are shown. Note also that you will not be able to
switch on the motor if an alarm is indicated or power supply ~380 V is absent.
- 20 -
DIETZ automation GmbH, March 2004
Manual Test Sequence (Example)
1. First of all you have to be sure that a servovalve you want to test is installed properly and the
corresponded electrical cable connects the servovalve and teststand.
2. Check the alarm indicators (Picture 26, Picture 22, Picture 25) and the Emergency switch (see
Picture 6). They should not be activated. If an indicator is light you have to correct the
corresponded problem and, then, reset the indicator using the reset button (Picture 26)
3. Switch on the power supply (Picture 21). After that, the green lamp 380V (Picture 26) should
indicate the presence of power supply. In the opposite case please verify that your teststand is
properly connected to ~380V.
4. Install the Manual Control / Hardware Feedback switch in the manual mode and choose the
proper values for polarity, control range and type of coil configuration (Picture 23). Note: you
should use the parallel mode of the coil configuration switch for servovalves with build in
electronics.
5. Set up the type of spool position signal (see Picture 25).
6. Switch on the motor (Picture 21).
7. Switch the Pressure/Filtration valve (Picture 22) in the filtration mode if you have to produce a
preliminary clearing of the oil and, after that, install the knob in a middle position. Note: to save
your servovalve as well as the teststand you should regularly filter the oil. Please do it every
time when you add new oil in the tank. We recommend 40 minutes filtration for new oil.
8. Switch the Pressure/Filtration valve (Picture 22) in the pressure mode.
9. Close the load valve (Picture 25).
10. Install pressure using the knob or edit box (Picture 22). The lamp on the top cover of the stand
will indicate the presence of pressure (). Please do it by small steps and verify absence of the
external leakage from the servovalve. Note: in order to remove the pressure you can switch off
the power supply, switch off the motor, switch the Pressure/Filtration valve in the filtration
mode, set the zero pressure, close the program or activate the emergency switch (Picture 6)
on the teststand.
11. The real pressure will be indicated on the supply pressure gauge PS (see Picture 25). The
flowmeter will indicate internal leakage.
12. The gauges DP, PA and PB (Picture 24) will indicate load pressure drop and pressures at the
control ports A and B correspondingly.
13. Use the control knob (Picture 23) to control the servovalve. A reaction of the valve will be
reflected by the gauges (Picture 24, Picture 25). Note: you will see motion of the spool (Picture
25) if your valve has a spool transducer.
14. For accurate tuning of the control you can switch the control knob in “Fine” mode (Picture 23).
15. The button “Degaussing” (Picture 23) is used to start and stop the degaussing process with
zero shift. The valve control knob sets the amplitude of the degaussing.
16. Switch on the “Feedback” mode (Picture 23) if you want to find the null bias. In this case a
special electronic will try to find the null bias, i.e. a control signal which corresponds to zero
load pressure drop. The null bias control signal will be shown on the control signal
measurement instrument (see Picture 25). An example of settings to find null bias is shown on
Picture 20. We must note that our electronic uses a special adaptive control schema to find the
null bias. Nevertheless we are not able to guarantee the 100% efficiency of the electronics.
First of all problems can arise if you test a proportional valve with extra slow dynamics. In such
a case please use the manual control knob to find the null bias. Note also that there exist
valves which do not have null bias points as well as such valves which have two or more null
bias points. In the last situation the electronics, obviously, can not identify the proper choice.
17. You can use the left mouse click to open or close the load valve (Picture 25). Note: the
flowmeter will always show the total valve flow, i.e. the sum of the control flow and the internal
leakage flow. We strongly recommend you do not open the load valve for longer time because
the energy of the control flow will heat the oil fast. Therefore, use the right mouse click to open
this valve for a short interval of time. In this case a blue arrow on the flowmeter will indicate the
maximal flow during this short subtest (see the Express Flow Test of the next section).
- 21 -
DIETZ automation GmbH, March 2004
Lamp indicates the
presence of pressure
Servovalve
Cover plate
Adapter manifold
Picture 27. Top view of ValveExpert.
Special futures of the Manual Test Dialog Box
The Test Dialog Box is powered by the following abilities.
1. Exact Value. This ability allows to read the exact value from any analog device (see Picture
21, Picture 22, Picture 24, Picture 25) of the system. Use the mouse to point out a device and
left click it. The exact value will be shown in a small window (see Picture 28 for an example).
The measurement
device shows the
real control signal
Use left mouse click to
see the exact value
Picture 28. Left mouse click shows the exact value.
2. Range settings. You can choose the range settings of the gauges and other analog devices
yourself. In order to modify it point out a device and right click it. The range setup dialog will
appear (see Picture 29). Please specify the values of ranges and ticks and click OK. The
device range settings will be changed according your request. Note that you can use the
Default button to reset the range settings by default. The Cancel button cancels the changes.
Picture 29. Range Setup Dialog.
- 22 -
DIETZ automation GmbH, March 2004
3. Accumulator Settings. This ability is used to check the load pressure of the hydraulic
accumulator and correct the corresponding software parameter. The right mouse click on the
accumulator executes the corresponding dialog (see Picture 30). The button “Auto” executes
the test program which starts the motor for a short time. This implies a small loading of the
accumulator and, in this case, the supply pressure will be very close to the initial load pressure
of the accumulator. Namely this value will appear in the edit box after the testing. Of course
this value can be corrected manually. We must note that the pressure must be installed to zero
before the test. Please regular check the load accumulator pressure. It should be about 30 –
40 bar. Too small or big load pressure may be a reason of mistakes.
Picture 30. Accumulator Settings Dialog.
4. Impuls Flow Test. This future gives a possibility to find the total valve flow for any fixed control
signal. The right mouse click on the load valve (Picture 25) opens it for a short time (about 0.2
sec). This time is enough to identify the flow. The blue arrow will point out the found value (see
Picture 31).
Picture 31. Expressed Flow Test is produced. Read arrow shows the total valve flow if the control ports are blocked. The
blue arrow fixed the maximal flow during the expressed flow test.
5. Valve Absence Checking. The teststand checks the installation pressure process every time
you install the pressure. The stand will be switched off after 0.2 sec. if you forgot to install a
valve on the test stand. Only a little amount of oil will be spread outside. Nevertheless, our
recommendation is to avoid using this feature.
Database
This item of the main menu (see Picture 10) opens the Database Dialog Box (Picture 32). This dialog
is intended for visual modification of test parameters of servovalves. Currently the database consists
of two tables: series table and valve table. The dialog shows this database structured in the tree
control on the left side. This tree is very similar to a tree of Windows Explorer. The folders are series
and the files are valves. The right side of Database Dialog Box shows parameters of a selected item
of the tree. You can modify them using the keyboard and mouse. Please do not forget to save your
parameters using the corresponding button after any changes of database records. In the opposite
case the changes will be lost. Note that most of parameters will be disabled if you select a series
(they are for valves only). Notes also, parameters from the dynamic group will be hidden if the
corresponded box for the settings dialog (see below) is unchecked. Use “New Series” and “New
Valve” buttons to create a new item of the database and “Delete” button to erase it. You can create a
new valve with the same parameters you already have. In order to do that, just point out a servovalve
with parameters you need and press “New Valve”. You can use technology “Drag & Drop” to change
series of servovalve.
- 23 -
DIETZ automation GmbH, March 2004
Select a series or a
servovalve from this
tree view to modify it
Static parameters of a
selected servovalve
Type of servovalve
Type of
control
Servovalve
Polarity of
control
Dynamic
parameters of
a selected
servovalve
Series
Coil configuration
of servovalve
Your comments
Signal from spool
position transducer
of servovalve
Create a new series
Create a new valve
Save data
Remove data
Exit the dialog
Picture 32. Database Dialog Box.
Settings
This item of the main menu (see Picture 10) opens the “Program Settings” dialog box (see Picture
33). The dialog allows to change settings for measurement units, DSS correction at the static
analysis, and some other options of the program. Option “Show dynamics” gives access to the
settings dynamical parameters in the “Database” dialog box and gives a possibility to produce
dynamical testing. Mark “Show logo” implies appearance of your logo on the output forms. The
setting “Normalizing pressure” predicts the results for the system pressure entered below.
Picture 33. Program Settings Dialog Box
- 24 -
DIETZ automation GmbH, March 2004
Help
This submenu (see Picture 34) gives you access to the help system.
Picture 34 Submenu “Help”
Contents
Select this item to show contents of the help system.
DIETZ automation (Web)
This item directs you to the main page of DIETZ automation GmbH site in the internet.4
About
This dialog contains information about authors, version of the program and so on.
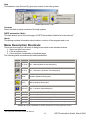
Menu Description Shortcuts
There are three ways to call most of dialog boxes which were described above.
1. Select an item from menu.
2. Click a toolbar button.
3. Use a shortcut combination of keyboard keys.
The following table summarizes all these possibilities.
Toolbar Keyboard Menu (Description)
{Alt-T+M}
Test o Manual (Manual Test Dialog Box)
{Alt-T+A}
Test o Automatic (Automatic Test Dialog Box)
{Alt-D}
Database (Database Dialog Box)
{Alt-S}
Settings (Settings Dialog Box)
{Alt-H+C}
Help o Contents (Help Dialog Box)
{Alt-F+L}
File o Load (Load a File with Test Data)
{Alt-F+S}
File o Save (Save Test Data to a File)
{Alt-F+A}
File o Analysis (Produce Analysis of a Test Data)
{Alt-H+A}
Help o About (Display About Box)
{Alt-H+D}
Help o Dietz Automation (Web) (Open the Home Page in Internet)
Picture 35. Three possibilities to call the subsystems of the program are shown.
4
The computer must have access to internet.
- 25 -
DIETZ automation GmbH, March 2004
Definitions
Electrohydraulic Flow Control Servovalve – A device designed to produce hydraulic flow output
continuously depending from electrical input signal.5 Usually the dependence is close to proportional
one but there are kinds of servovalves where the output flow is not linear function of control.
Rated Control Interval – The interval of possible input electrical signals which specified by a
producer of the valve as a nominal control.
Rated Minimum and Maximum of Control – The minimum and maximum of the rated control
interval.
Predefined Bias – The mean of the rated maximum and minimum. It is expressed as half of sum of
rated maximum and rated minimum of control signal.
Rated Signal – The amplitude of the input control signal which is expressed as half of difference
between rated maximum and minimum of control signal.
Let us consider an example. Assume that rated control interval is [4mA … 20mA], i.e. rated minimum
and maximum of control are equal to 4mA and 20mA correspondingly. In this case the predefined
bias will be (4+20)/2=12mA. Rated signal is (20-4)/2=8mA.
It is necessary to note that maximal and minimal signals, predefined bias, and rated signal depend of
mode you use to control a servovalve. For instance, for servovalves with two or more lead coils the
rated current must be associated with a specific coil connection (series, single, or parallel).
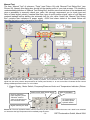
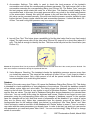
Four-Way Servovalve – A servovalve with supply port Ps, return port T and two control ports A and
B. The ports are arranged so that valve action in one direction simultaneously opens control port A to
supply port Ps and control port B to return port T. Reversed valve action opens control port A to
return port T and control port B to supply port Ps. Schematically such a valve is shown on Picture 36
below.
Picture 36. Control signal implies moving the spool from left to right and back. At the left position, the port A is connected
to Ps and B to T. If the spool is on the right side, A is connected to return T and B is connected to supply Ps.
Supply Pressure – Pressure on the port Ps.6
Return Pressure – Pressure on the port T.
Load Pressure Drop – The differential pressure between the control ports A and B.
5
6
Normally, the control is expressed in milliamperes (mA) or volts (V).
The pressure usually expressed in kg/cm2 (bar) or lb/in2 (psi).
- 26 -
DIETZ automation GmbH, March 2004
Valve Pressure Drop – The sum of the differential pressures across the control orifices of the
servovalve. Valve pressure drop will equal the supply pressure minus the return pressure and minus
the load pressure drop.
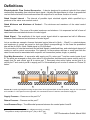
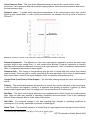
Pressure curve – A graph which represents dependence of the load pressure drop from control
signal at zero control flow, i.e. with control ports blocked. An example of such a curve is shown on
Picture 37.
Hysteresis
Picture 37. Pressure curve for a real servovalve. Red point shows the null bias of the valve.
Pressure Hysteresis – The difference in the valve input signals required to produce the same load
pressure drop at zero control flow, i.e. with control ports blocked. Pressure hysteresis is normally
specified as the maximum difference occurring in a region between r 40% of maximum load pressure
drop. It is expressed as percent of rated signal.
Pressure Gain – The change in load pressure drop per unit of control with zero control flow (control
ports blocked). Pressure gain is usually specified as the average slope of the curve of load pressure
drop versus input current in the region between ±40% of maximum load pressure drop.
Control Flow (Load Flow or Flow Output) – The fluid flow passing through the valve control ports A
and B.7
Polarity – The relationship between the direction of control flow and the direction of the input signal.
It can be positive and negative. Usually it is assumed that polarity is positive if positive (in some
sense) control signal opens port A to supply port Ps and control port B to return port T.
Null Bias – The input control signal where the valve supplies zero control flow at zero load pressure
drop. Note null bias may depend of operating conditions and environment. Due to the hysteresis
effect null bias depends also on initial state of servovalve.
Null Shift – The maximal change in null bias resulting from changes in operating conditions or
environment. It is usually expressed in percents of rated signal.
Rated Flow – The specified maximum of control flow for input signals from the rated control interval.
7
The flow usually expressed in L/min (lpm), in3/sec (cis) or gal/min (gpm).
- 27 -
DIETZ automation GmbH, March 2004
This value corresponds to specified valve and load pressure conditions. Normally it is assumed that
the load pressure drop is zero. Note, usually rated flow corresponds to rated minimum and maximum
of control.
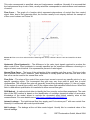
Flow Curve – The graph of a function which represents dependence of control flow from control
signal. Note, due to the hysteresis effect, the function usually is not uniquely defined. An example of
a flow curve is shown on Picture 38.
Hysteresis
Picture 38. Flow curve for a real servovalve. Rated signal is 15mA, null bias is about 1.2mA and rated flow is about
24L/min.
Hysteresis (Flow Hysteresis) – The difference in the valve input signals required to produce the
same control flow. Flow hysteresis is normally specified as the maximum difference occurring in a
region of rated control interval. It is expressed as percent of rated signal.
Normal Flow Curve – The locus of the mid-points of the complete cycle flow curve. This locus is the
zero hysteresis flow curve. However, valve hysteresis is usually quite low such that one side of the
flow curve can be used for the normal flow curve.
Flow Gain – The slope of the control flow versus input current curve at any specific point or in any
specific operating region. The incremental flow gain may vary from point to point due to valve
nonlinearities. The nominal flow gain will generally show three operating regions: (1) the null region,
(2) the region of normal flow control, and (3) the region where flow saturation effects occur. When this
term is used without qualification it is assumed to mean normal flow gain.
DSS Method – A method which allow to identify the flow curve by a short-time experiment. The main
idea of the DSS method is based on the identification of nonlinear dynamical model of servovalve.
Knowledge of the model allows to exclude the dynamical effect which certainly arise at fast
measurements. For more details see or http://arxiv.org/abs/math.DS/0202070.
Internal Leakage – The total internal flow from supply port Ps to return port T with zero control flow.
Normally it is measured with control ports blocked.
Null Leakage – The leakage at the null bias control signal. Usually this is a maximal value of the
internal leakage.
- 28 -
DIETZ automation GmbH, March 2004
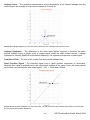
Leakage Curve – The graphical representation of the dependence of an internal leakage from the
control signal. An example of such a plot is shown on Picture 39.
Hysteresis
Picture 39. Leakage diagram for a real servovalve. Maximum of the leakage flow is about 2L/min.
Leakage Hysteresis – The difference in the valve input signals required to produce the same
internal leakage during a single cycle of control signal inside the rated control interval. Leakage
hysteresis is normally specified as maximum difference. It is expressed as percent of rated signal.
Total Valve Flow – The sum of the control flow and internal leakage flow.
Spool Position Signal – An electrical signal from a spool position transducer of servovalve.
Normally this signal is proportional to the mechanical position of the spool. Note, the most popular
servovalves use transducers with output signal r 10V, r 10mA and 4-20mA.
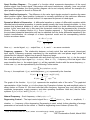
Hysteresis
Picture 40. Spool position diagram of a real servovalve. The red point shows the null bias which does not coincide with
the zero of the spool position transducer.
- 29 -
DIETZ automation GmbH, March 2004
Spool Position Diagram – The graph of a function which represents dependence of the spool
position signal from control signal. Servovalves with spool transducers, normally, have very small
hysteresis. Nevertheless, the spool position diagram can be not uniquely defined. An example of a
spool position diagram is shown on Picture 40.
Spool Position Hysteresis – The difference in the valve input signals required to produce the same
spool position signal. Spool position hysteresis is normally specified as the maximum difference
occurring in a region of rated control interval. It is expressed as percent of rated signal.
Dynamical Model of Servovalve – A differential equation or system of differential equations which
describe basic dynamical properties. In practice people usually use linear dynamical models, i.e. they
assume that dynamical behavior of valve can be well described by a linear differential equation or
system. In this case (and only in this case) the dynamical model can be represented by a transfer
function. This is a complex function K ( p ) from a complex argument p . The transfer function gives
the equivalent dynamical description and can be obtained from the linear differential equation by the
Laplace transformation. An example of a linear dynamical model and the corresponding transfer
function are shown below.
Ax Bx Cx u (t )
1
K ( p)
2
Ap Bp C
Here u (t ) – control signal, x(t ) – output flow, A, B , and C – are some constants.
Frequency response – The relationship between no-load control flow and harmonic (sinus-type)
input signal. Frequency response expressed by the amplitude ratio and phase angle which are
constructed for harmonic signals from a specific frequency range.
Below we give definition of the amplitude ratio and phase lag more precise. Let x(t ) be the control
flow corresponding to input signal u (t ) A sin(Zt ) . Here Z 2S f – frequency of the test signal. After
some transition time 't the output signal x(t ) will be a periodic function with the same frequency Z .
In this case x(t ) can be represented by the following Fourier series
f
x(t )
¦ R (Z ) sin(kZt M (Z )).
k
k
k 0
For any k , the amplitude Rk (Z ) and initial phase Mk (Z ) expressed by the formulas
Rk (Z )
K k (iZ ) , Mk (Z ) arg K k (iZ ) ,
K k (iZ )
Z
2S
't 2S / Z
³
x(t )e ikZt dt.
't
R1 (Z ) / R1 (0) represents the amplitude ratio of the valve.8 The graphical
representation of the function M1 (Z ) is the phase lag. Examples of phase lag and amplitude ration is
shown below on Picture 41. We must note that valve frequency response may vary with the input
amplitude, temperature, supply pressure, and other operating conditions. Note also, that for linear
systems K1 (iZ ) { K (iZ ) and K k (iZ ) { 0, k 2,3, , f .
The graph of the function
Natural Frequency – Such frequency Z that M1 (Z ) S / 2.
A(T t )
Degaussing Control – The input control signal like u
sin(Zt ) u0 . Here A - amplitude, T T
duration, Z - frequency of the degaussing. Degaussing is used, mainly, before checking of average
parameters of servovale for the control u0 . Below a degaussing curve is shown (Picture 42).
8
R1 (0) is a formal notation for R1 (Z0 ) where Z0 is small enough. Usually Z0 is less 5Hz.
- 30 DIETZ automation GmbH, March 2004
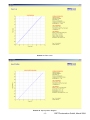
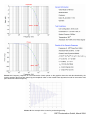
Picture 41. Frequency response of a real servovalve. Green points on the graphics show the real data obtained by the
Fourier analysis. Blue lines are phase lag and amplitude ration of the closest linear dynamical model of servovalve. Red
point shows the natural frequency.
Picture 42. An example of the control to produce degauusing.
- 31 -
DIETZ automation GmbH, March 2004