1
C ompet ence in N uclear Inst r ument s and B ioImaging
GINA Star 4 User Manual 4.08
GINA Star 4 User Manual 4.08
Page 1
C ompet ence in N uclear Inst r ument s and B ioImaging
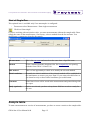
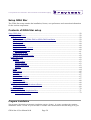
Content GINA Star User Manual
Measurement........................................................................................................................................3
Method.............................................................................................................................................3
Start of Single Run.........................................................................................................................12
Sample table...................................................................................................................................12
General hints..................................................................................................................................13
Evaluation...........................................................................................................................................16
Catalog...........................................................................................................................................17
Manual Integration.........................................................................................................................22
Report.............................................................................................................................................31
Calibration Using Internal and External Standards............................................................................37
Support and Version Management.....................................................................................................47
Security and Control...........................................................................................................................50
Setup GINA Star.................................................................................................................................58
Program Installation.......................................................................................................................58
Setup GINA Star............................................................................................................................62
Using fraction collector.................................................................................................................68
Maintenance status.........................................................................................................................70
GINA - STAR Data Acquisition Box............................................................................................71
GINA Star 4 User Manual 4.08
Page 2
C ompet ence in N uclear Inst r ument s and B ioImaging
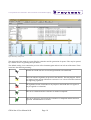
Measurement
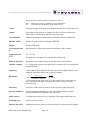
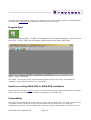
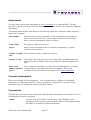
Method
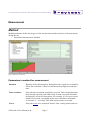
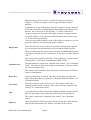
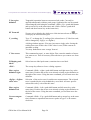
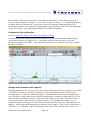
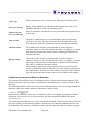
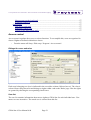
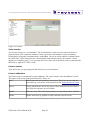
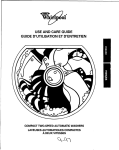
Method parameters define the progress of the measurement and the behavior of the instruments
during the run.
•
From Menu Measurement / Method
Figure 1 Method for measurement
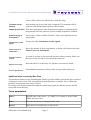
Parameters in method for measurement
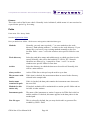
Duration
Duration of the chromatogram. During this time, signals are recorded by
GINA Star as desired. Control of instruments may happen outside this
time.
Time resolution
Select the time resolution required for your run. This is dependent upon
the generally expected peak width. Keep in mind: each peak should be
presented by at least five data points. For example, if you expect a peak
width of 20 seconds, you should set the time resolution to maximum
20 seconds / 5 = 4 seconds. This field accepts entries in seconds.
Traces
Select the traces to be measured. Names, units, scaling factors and zero
GINA Star 4 User Manual 4.08
Page 3
C ompet ence in N uclear Inst r ument s and B ioImaging
values (offset values) are reflected here from the Setup.
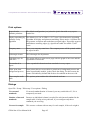
Comment on the
Method
Each method can be provided with a comment. This comment will be
copied to each measurement. Opens a editor window
Sample preparation This menu item appears only when the autosampler is controlled by the
program and offers the option to perform sample preparation / dilution.
Initial Settings of
Instruments
Calculation of radio
signals
This leads to a table to define the initial . This is also important for the
start method.
Leads to the table Calculation of radio signals
Timed control of
instruments
Shows the number of steps programmed. A double click leads to the table
Timed Control of Instruments
Fraction collector
control
A switch to activate or deactivate the fraction collector control. Please use
the menu on the left side to enter the peak parameters.
Quench correction
Various parameters
Enters the table of coefficients. See Quench Correction for details.
Some additional parameters like periodic saving of data during run
Additional hints concerning Run Time
The maximum duration of the chromatogram which is possible with the preselected time resolution
is displayed on the screen. This is dependent on the defined time resolution. Up to 32000 data
points per measurement trace may be stored.
If you stop your chromatogram runs using an external stop signal, the duration set here should
exceed the actual duration.
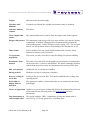
Trace parameters
Source
Physical name of the source, i.g. ADHV-3 for counter 3 on the GABI
ADHV-interface board.
Name
Free name for the trace coming from the setup.
Record
Check this to record this trace in the run file.
GINA Star 4 User Manual 4.08
Page 4
C ompet ence in N uclear Inst r ument s and B ioImaging
Display
Check this to display this trace during run.
Unit
Units are fixed in the instrument or in the setup and reflected here for
documentation only.
Offset
Factor
Reflected from the setup here, see Setup Factor.
Shift
Enter here the time needed for the eluent to get from one detector to
another. The other instrument (time base) should have an offset of 0.
Half l.
Only available, if 'profi' is selected. Enter the half life time of the isotope
measured in this trace. Correction is not done for the background (reflected
as offset above). More comfortable and more reliable
Smooth
Enter a time (or width) to define a smooth area. The smooth algorithm is
selected in the setup.
Initial settings of Instrument
Here you define the conditions or initial conditions for a run. Wavelength of the UV detectors,
gradient, oven temperature, etc. The contents of this menu are dependent of the connected
instruments and some settings.
Calculation of radio signals (optional)
This rarely used calculation allows to calculate the DPM results from some parameters. You can
define a separate set of parameters for each method. These values affect the dynamic DPM
calculation.
Please notice: as long as this feature calculates a new view of the signals even during run, but in the
computer and not in the instrument, it is regarded as not complaining with GMP and does not work
with digital signatures. The may be subject to future changes.
For DPM, DPS or Becquerel calculation the following formula is used:
DPMfactor=
Spillover
split∗eluateFlowscintillatorFlow
cellVolume∗split∗efficiency
When measuring dual labels, i.e. when using two labeled isotopes of
GINA Star 4 User Manual 4.08
Page 5
C ompet ence in N uclear Inst r ument s and B ioImaging
different energy, there is always a “spillover” between both traces.
“Spillover” is due to the nature of the energy distribution of Beta
particles.
Certain decay events of the higher energetic isotope are always detected
in the lower energetic counting channel. Depending on the setting of the
detector, the reverse case is also possible, i.e. decays of the lower
energetic isotope are detected in the higher energetic counting channel.
If only the spillover in one direction should be taken into account, enter
‘0’ for the irrelevant direction.
If you are not satisfied with the result of the spillover correction, you can
repeat the spillover correction using negative figures.
Background
Enter the count rate in cps (counts per second) as background, supplied
by your detector with measurement cell, but without sample injected.
When you determine this value, please note that the DPM/DPS/Becquerel
calculation is turned off (set “Calculations” in the last row of this menu to
“No”).
The entered value appears in the table “Trace parameters” in the column
“Background”, if necessary, transformed to DPM or DPS.
Scintillator flow
This information is required for “dynamic flow control” (see Calculation
below). The entered value is used only for calculation, it does not control
the actual scintillator flow.
The control of the scintillator flow takes place via the menus and Timed
control of instruments.
Eluate flow
Cell volume
Split
Enter the eluate flow in ml/min. The entered value does not affect the
actual eluate flow, but it is required for “Dynamic DPM calculation” (see
Calculation below).
Enter the volume of your cell in µl or ml. The volume of the cell is
generally printed on the cell body. This value is used for “dynamic flow
control” (see Calculation below).
f you split off part of the eluate before adding scintillator using a splitter,
enter the percentage of the eluate that flows into the measuring cell.
This value is required for “Dynamic flow control” (see Calculation
below).
Efficiency
Enter the statistical efficiency in percent. Please take this value from the
label on the measurement cell. If there is no label on the cell, the
GINA Star 4 User Manual 4.08
Page 6
C ompet ence in N uclear Inst r ument s and B ioImaging
statistical efficiency has to be determined through measurement.
Calculation
Here you can select in which units the results of the measurement should
be calculated.
Choose between DPM, DPS, Becquerel or raw data output.
Please note, that the instrument must not perform any correction, if you use this calculation!
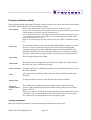
Timed Control of Instruments
In this menu you can set up a list of timed events. Connected instruments can be controlled
according to this list. For example, it is possible to change the wavelength of a connected detector
during run at a predefined time. The controls appearing here dependent on your system
configuration.
Timed control table
Time
Enter the time for the desired setting. The time is calculated from the start
of the measurement (generally identical with the time of the injection).
‘+’ or ‘-‘ time shifts actual entry and the rest of the table at once. For new
entries to the time table, enter time relative to the previous entry.
Duration
This column gives a second view to the time information. It represents the
time to the next event. You may simply enter a new duration here instead
of + absolute time in the time column.
Control
Move the cursor into this column and push the space bar or double click;
this opens a window that includes all controllable parameters. Using the
cursor keys, select one and push Enter.
Value
Enter the value for the parameter to be controlled, i.g. select 'open' or
'closed' for a 2/2 way valve.
Hint
Type a comment here. The comment will appear on the instrument control
screen during the run and should help you to keep orientation during along
a complex control
Keys available in the Timed Control of Instruments
<Ins>
Inserts a new line to the time table
<Del>
Deletes a line from the time table
<F8>
Copies the time table to the clipboard, valid for every table
GINA Star 4 User Manual 4.08
Page 7
C ompet ence in N uclear Inst r ument s and B ioImaging
<F9>
Prints the time table (not the whole method)
Items to change within the column “Control”
The column “Control” allows to change all items available in the “Initial status”, thus valves, UVwavelength etc.. There are some further entries to control the execution of this table itself:
Wait for event and
Wait for -event
During run time these entries allow to pause the execution of the time table
until the state of the selected event is true or false (wait for -event). Because
the time is unpredictable, the time column restarts with the time “tx+”
Segment
This is a headline for a chapter. You may enter free text to the column
“Control” to structure you time table and keep long tables readable.
Timed control
With the value “hold” this entry causes the execution to wait until a user
enters a “continue” command (F2 in the actual time table)
Raise error *)
This causes a run time error, the hint is used for the error message. This entry
may be used with conditional jumps to notice special situations.
Label
This entry defines a
If event go to *)
This entry jumps to a label number, if the state of the selected event is true.
If -event go to *)
This entry jumps to a label number, if the state of the selected event is false.
*)
these rarely used entries are available, if the text “profi” is entered in Setup / License / License
addendum or 'Setup / Extra / Expanded time table' is checked
While running the measurement and viewing the recorder trays, you may view this table proceeding
by typing CTRL-Y for the actual time table.
Special Functions
The special functions described below are not, or only rarely, needed during regular operation.
Ctrl-S: Manual Starts the integration area and advises the fraction collector to fill a new vial.
fraction
(This command is available from the instrument control screen as well)
Ctrl-T: Manual
fraction
Stops filling the current vial, Marks the peak end and indexes the fraction
collector to the next vial. (This command is available from the instrument
control screen as well)
GINA Star 4 User Manual 4.08
Page 8
C ompet ence in N uclear Inst r ument s and B ioImaging
Ctrl-S: Manual
fraction
Starts the integration area and advises the fraction collector to fill a new vial.
(This command is available from the instrument control screen as well)
Ctrl-Y: Actual
list of timed
control
After a measurement has been started, you may watch the progress of the
timed control of events. Here the following commands are available:
<F2> hold or continue depending on the state
<F3> execute the next step, ignore the programmed wait time
<F5> skip the next step (i.g. a wait event) and continue
(This command is available from the instrument control screen as well)
F4 Start
This commands allows to manually start a measurement. It is available in the
measurement view and only if GINA Star controls no auto sampler. (This
command is available from the instrument control screen as well)
Handling of 'Hold' during execution of timed control
The programmed hold is used to wait for some user actions to take place. After that, the user re-enables the
execution by resetting to the 'Run' state. Please use the hint to inform the user what to do, especially if more
than one 'hold' is within the list. GINA Star does the following actions (Vers. 4.04 ff):
•
•
•
Execution of time table is paused
Instrument control page is opened, if 'Timed control' is not represented on the graphic view, the text
mode is used.
The message from the hint column is displayed and the user may double click to 'Hold' to enter the
run mode again.
Gradient
The table of gradient steps opens along with a graphic representation if the gradient.
Time
%A, %B, %C
Flow
Type
Enter here the time for a change of the gradient. The value “Initial” in the
first row cannot be changed, because in this row you set the initial conditions
of the run.
Phase B and C can be freely selected in percent. Phase A is calculated by the
computer: %Phase A = 100 - %Phase B - %Phase C
Enter the total flow in milliliters per minute.
Non-linear gradient shape for the respective gradient step. Select between 1
and 11. Values between 1 and 5 create convex, values between 7 and 11
concave curves. For a linear curve enter “0” or a hyphen.
GINA Star 4 User Manual 4.08
Page 9
C ompet ence in N uclear Inst r ument s and B ioImaging
Fraction collector control
If the program includes the feature Fraction collector control, you can set the desired peak search
parameters in the dialog box Fraction collector control.
Search mode
Peak reject
Peak width
Select a peak search mode from the drop down menu. You may choose:
Shape: peak search based on a mathematical function which evaluates the curvature
and the change of curvature from the measured curve
Level: peak search based on the height of the measured signals. If the entered level
is exceeded, the substance is collected in a vial. A waste signal is available in this
mode at the terminal “Aux out”.
Manual: Cut the peaks by pressing CTRL-S (start) and CTRL-T (terminate) during
run
If search mode 'shape': peak reject indicates how high the contents of a peak
has to be at least in order not to be rejected. If the peak search program
integrates pseudo peaks in the background noise of a chromatogram, this
parameter should be increased. The permitted range for peak reject extends
from any small number (no peak found is rejected) up to any high number.
Enter an approximate peak width
Vial fill time
Necessary if no waste signal is used. In this case, GINA Star will proceed to
the next vial, if one is filled by the waste
Cell to vial delay
Generats a delay for switching the collector to represent the time used to pass
the outlet capillary
Trace
Select the trace in which the peak search is to be performed from the drop
down list
Timed events
Switch on
levelSwitch off
level
Leads to the table of timed events listed for the fraction collector
The switch on level defines the input signal for start of the fractioning
process. If the signal drops below the switch off level, the system switches
back to “Waste”.
When you enter the switch on level, the program sets the switch off level to a
value that is 10 % lower than this level.Is the switch on level is lower than
the switch off level, the program scans for negative peaks.
Various parameters
Here you find some parameters of the measurement method more rarely used.
GINA Star 4 User Manual 4.08
Page 10
C ompet ence in N uclear Inst r ument s and B ioImaging
Equilibration time
Autosave
Archive after
measurment
Dead-time of column
Common decay time
Enter the equilibration time, which should elapse before getting ready
for start prior to each measuremnt started with this method.
Apply a time here. GINA Star will save the current measurement
everytime, this times elapses to protect your data against power failure or
crash.
Copy the data to the archive at the end of a measurment
Enter the dead-time of the column. This unit does not have any influence
on the measurement. However, the dead-time of the column is required
in the integration program to calculate the capacity factor and the
selectivity. See chapters and .
Half life time for postrun correction. The correction is done for the
'Corrected region area' only.
GLP method
To help you meet the requirements of GLP (Good Laboratory Practice), we have introduced the
GLP attribute.
The meaning of this parameter has changed to GINA Star version 4.01. Methods are no
longer protected against changes. You may now process evaluations on measurements
measured with this option 'strict' (a raw data file is always protected by GINA Star). The only
effect of this option is, that the measurement is processed without any influence of the user.
GLP_normal
Runs with this method are fully controlled as configured in the access
control.
GLP_strict
In addition to normal, runs with this method must not be affected by
manual instrument control.
GLP_unregulated
If access control is established, runs with this method are not controlled, no
audit trails, security copies etc are generated and the run may later be
deleted.
Integration after each measurement
GINA Star performs a automatic integration at the end of each run according to the rules defined in the
Integration method.
To enable the integration for the end of each run, please select the item by toggling with
<Spacebar>. The <F2>-key allows to edit the corresponding Integration method.
GINA Star 4 User Manual 4.08
Page 11
C ompet ence in N uclear Inst r ument s and B ioImaging
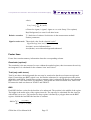
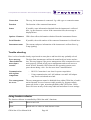
Start of Single Run
This optional item is available only if no autosampler is configured.
•
From menu select Measurement / Start single measurement
•
Click icon 'Start single'
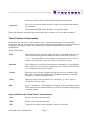
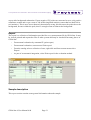
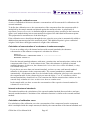
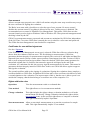
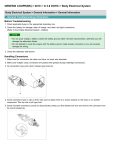
If you are working with an injection valve, you start measurements without the sample table. Enter
simply the name of the measurement, if necessary, select a method from the list and start. You
should enter a comment to describe the sample.
Figure 2: Start of single run
Measurement
This is the run name and must be at the same time a legal file name.
Method
Select a method from the drop down list. See compatibility for opening
methods from GINA 2.18 and 3.00.
Edit method
This is a last opportunity to check or to modify the selected method.
Initial conditions
Normally the initial conditions of the selected method will be established in
the instruments as soon as you press 'Start'. If you want to do this before or
you intend to only set these initial conditions, press this button.
Comment
Some lines of text will be saved in the measurement and printed along with
the report
Study (optional)
Studies are selected, you have a drop down field here to select a study for
this run.
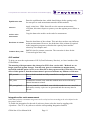
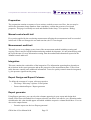
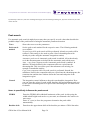
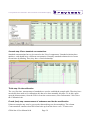
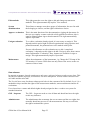
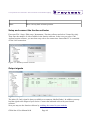
Sample table
To start a measurement or a series of measurements, you have to create a entries to the sample table.
GINA Star 4 User Manual 4.08
Page 12
C ompet ence in N uclear Inst r ument s and B ioImaging
•
From menu select Measurement / Sample table or
•
Click the icon 'Sample table'
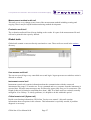
Figure 1 Sample table
Content GINA Star Sample Table
Measurement........................................................................................................................................3
Method.............................................................................................................................................3
Parameters in method for measurement......................................................................................3
Additional hints concerning Run Time..................................................................................4
Trace parameters.........................................................................................................................4
Initial settings of Instrument.......................................................................................................5
Calculation of radio signals (optional)........................................................................................5
Timed Control of Instruments.....................................................................................................7
Keys available in the Timed Control of Instruments.............................................................7
Items to change within the column “Control”........................................................................8
Special Functions........................................................................................................................8
Handling of 'Hold' during execution of timed control............................................................9
Fraction collector control..........................................................................................................10
Various parameters...............................................................................................................10
GLP method.........................................................................................................................11
Integration after each measurement.................................................................................11
Start of Single Run.........................................................................................................................12
Sample table...................................................................................................................................12
General hints..................................................................................................................................13
Entries in the sample table........................................................................................................14
Import sample table from foreign programs.............................................................................15
Continue / Pause Processing of Sample Table..........................................................................16
General hints
You may insert the measurement anywhere below the dark gray area. The dark gray area contains
the entries already measured. Using the <Ins> button you can insert a measurement between two
entries. A preselected measurement can be removed again by pushing the <Del> button.
Already measured entries can be called by double-clicking the name.
If you have quit the list again by pushing <Esc>, and you have confirmed the question concerning
start of processing the sample table, you may push <F4> to start the first measurement.
Measured runs and runs that are currently active appear in the sample table only if you have not
selected automatic deletion in . If they appear, you can call the measured data set with a doubleGINA Star 4 User Manual 4.08
Page 13
C ompet ence in N uclear Inst r ument s and B ioImaging
click.
You may export sample tables to the clipboard by help of the copy icon.
Entries in the sample table
Study
(optional)
Enter to which study the respective measurement is to be assigned. This
information helps to organize and track measured data and does not have
any effect on the measurement process. The second section of the search
path contains the name of the instrument and is defined in the settings.
Enable this optional field in Setup / Path.
Method
Select the method for your run either from drop down list or by entring a
name. You may edit the selected method by typing <F2> or pressing the
'Edit' button
Measurement name Select a name for your run. The name may comprise up to 29 characters.
You may use an extension. This name is an unique identifier for the run
and will always be printed in the report independently of the filename.
To enter a series of runs just add the index range i.g. m.3-10 for m.03,
m.04 ....
Position
This column is important only when your autosampler is controlled by
the PC and has free access to the samples. In this case, enter the position
of the respective sample in your autosampler.
Injection volume
The entered value is stored for documentation and calculation in the data
set. If your autosampler is connected to a PC, the injection volume is
transferred to the autosampler.
Weight
Enter the actual weight for sample weight correction. Weight correction makes
it easier to weigh your samples. The target value need not be reached exactly.
In the respective column of the sample table, enter the actually weighed sample
volume. The program automatically corrects for the difference. This column
appears only when weight correction has been enabled in Setup |
Dilution
The entered value is stored in the data set for documentation and
calculation. If your autosampler is connected to a PC, the dilution is
transferred to the autosampler.
Sample type
Enter the sample type. It can either be an external standard (Std1 to
Std16) or an unknown sample. For the standards, enter “1” to “16” and
for a sample to be measured “0” (zero). Each standard number belongs
to a column in the list “Components of standards”.
GINA Star 4 User Manual 4.08
Page 14
C ompet ence in N uclear Inst r ument s and B ioImaging
Number of internal
standards
Enter the concentration of the internal standard in the unit you have
preselected in the menu .
Speed
This menu item appears only for certain types of autosamplers. Sample
draw and injection speed.
Status
In this column you can view the progress of processing the sample table.
Already measured samples are marked with time and data of begin of run.
Samples that have yet to be measured are labeled “wait”. Push “+” on the
numerical keypad to move the marker down, indicating which sample is the be
measured next; push “-“ on the numerical keypad to move the marker up. If
you enter a period (“.”), the bar will jump to the row containing the cursor
Comment
For each individual run you may enter a comment here. Move the cursor to the
Comment column. Push the <spacebar>. A window below the table opens. In
this windows you can edit the comment. All functions of a standard editor are
available, including copy and paste.
Import sample table from foreign programs
GINA - STAR is able to accept sample tables made by foreign software. The format is TAB separated text.
The columns have meanings defined by keywords in the headline.
STUDY
Study name, used only of 'Setup / user options / support studies' is selected
METHOD
method name
SAMPLE
measurement name
POS
sample position number in autosampler
VOL
sample volume in µl
WEIGHT
sample weight before injection
DILUT
dilution of sample
ISTD
amount of internal standard 1
DRAWSPEED sample draw and push speed in µl/min
NEEDLE
needle hub for HP autosamplers
DOCVOL
defines output path for documentation files *)
INSTRUMEN
if present, the value is checked to be equal to 'Setup / user options /
GINA Star 4 User Manual 4.08
Page 15
C ompet ence in N uclear Inst r ument s and B ioImaging
STUDY
Study name, used only of 'Setup / user options / support studies' is selected
T
instrument's directory'
COMMENT1
comment line 1
COMMENT2
comment line 2
......
.......
COMMENT9
comment line 9
*) DOCVOL is treated as a complete file name, if it contains a '.' in the last name segment. I.g.
'\\labserver1\fstudyx\nSampleABC.TXT' will be used as file name for the report. If there is no dot
in the last file segment (after the last '\'), GINA - STAR will interpret the name as a directory name
and will add the name of the measurement plus '.TXT'. If the name ends with '\' , the normal path
segement for study, instrument and method is added (or only method, if 'use studies' is not used).
If you want to have TABs within a comment, you enclose the comment in double hyphens
"comment TAB comment"
The columns may be in any order. The column headers are key words and are read case insensitive.
Not all columns need to be present. Of course the column 'Sample' must be present. Other missing
columns have the same default as if they were typed to the list.
This list has to have the file suffix '.LST' and may be opened by help of GINA - STAR's browser or
the file may be dragged and dropped over GINA - STAR's icon or GINA - STAR's program
window.
Continue / Pause Processing of Sample Table
•
From menu select Measurement / Pause execution of sample table
•
From menu select Measurement / Sample table continue
This does not affect the current run. Only the start of a next sample is delayed, if the execution of
the sample table is paused.
With the sample table the recorder buttons like play show the status. From the menu Measurement,
the selection symbols show the status of the sample table.
Please note: after starting GINA Star, the sample table is always paused.
Evaluation
Evaluation and data handling
Evaluation...........................................................................................................................................16
Catalog...........................................................................................................................................17
GINA Star 4 User Manual 4.08
Page 16
C ompet ence in N uclear Inst r ument s and B ioImaging
Catalog Items............................................................................................................................19
Buttons..................................................................................................................................21
Context menus...........................................................................................................................22
Drag and Drop within the catalog.............................................................................................22
Manual Integration.........................................................................................................................22
Define Integration Regions for Radioactivity Channels......................................................23
Define Integration Regions for Analog Channels................................................................23
Groups of regions and baseline............................................................................................24
Commands for Manual Integration ..........................................................................................24
Special Functions......................................................................................................................27
Information...........................................................................................................................27
Evaluation of radioactivity........................................................................................................28
Count rates and statistics......................................................................................................28
Units and integration............................................................................................................29
Signals and background........................................................................................................29
Samples and Total activity...................................................................................................29
Estimate the limit of detection..............................................................................................30
Background subtraction and 'negative' ................................................................................30
Report.............................................................................................................................................31
Sample description....................................................................................................................31
Preparation................................................................................................................................32
Manual control audit trail..........................................................................................................32
Measurement audit trail............................................................................................................32
Integration.................................................................................................................................32
Report Design and Report Columns.........................................................................................32
Report generator........................................................................................................................32
Footer lines................................................................................................................................35
Remainder (optional)............................................................................................................35
Total (only radio traces).......................................................................................................35
BKG......................................................................................................................................35
Peak search................................................................................................................................36
Items to specifically influence the peak search....................................................................36
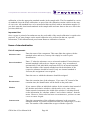
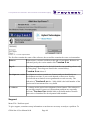
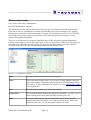
Catalog
The file handling functions deal with files containing measurement runs. In addition to open these
files for evaluation, this dialog allows to execute more function i.g. from various context menus for
single files or any selected collection.
•
From menu ' File / Open' or 'File / Archive' to view and open from archive
•
Icon from icon bar
GINA Star 4 User Manual 4.08
Page 17
C ompet ence in N uclear Inst r ument s and B ioImaging
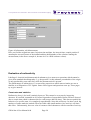
Figure 2 Directory with preview
The main task of this menu is to open files for evaluation and for generation of reports. Files may be opened
by a double click or by pushing the open button.
The default catalog view contains the preview of the chromatrogram and an icon in front of the name. These
icons have the following meaning:
Normal run. RAW data are secured and guaranteed to be unaffected.
This icon indicates signature not present in the data file. This may happen, if data
are imported from ancient GINA Star versions 2.18 or 3.00 or from other software
not supporting signatures.
The signature became invalid due to any impact to the RAW data. No approval
may be applied to evaluations.
This run is evaluated and the evaluation is marked 'completed'.
This run is approved, what means the evaluation is completed and this has been
approved. All information is secured.
GINA Star 4 User Manual 4.08
Page 18
C ompet ence in N uclear Inst r ument s and B ioImaging
This icon is used temporarily to indicate catalog entries with signature not yet
checked. Wait some seconds and this icon will be replaced.
Catalog Items
The catalog may be invoked for the work path (also by help of the icon) or for the archive. The catalog offers
a lot of functions via the context menus in addition to the buttons.
Preview
Uses one part of the window to show the content the selected file
Details
Click this button to view the name of the data set, the injection time and the
first comment row. At the same time, all information, except the comment, can
be used as sort criterion. To sort, simply click on the respective column header.
Since the information cannot be stored in the catalog entry of the file system,
the respective data set has to be opened for each entry, so that the screen builds
up a little bit slower. On network drives, this may slow down catalog
operations dramatically.
Study
If you have enabled Support studies in the setup / Print Options the Study
column a filter edit appears in the ‘Open’ dialog.
Instrument
If you have enabled Support studies in Print Options, the Instrument column
appears in the ‘Open’ dialog. The presetting is ‘*’, i.e. the data sets of all
instruments are listed.
Method
The default setting is ‘*’, so that all methods are listed for which a data set has
been created. You may enter any restriction Windows permits, e.g. ‘FDG*’
lists all methods starting with FDG. Simply click on the method within which
you are searching for the data sets.
Selecting data
Every list has an edit field at the top to filter the data in the corresponding list.
The default value is '*.*' to list all data. You may enter any Windows-conform
restriction, e.g. ‘x*.*’ for all data sets starting with the character ‘x’.
Select one or several data sets. Hold down the Shift button to select
entire ranges of data sets, hold down the Ctrl button to select individual
data sets or unselect them again.
GINA Star 4 User Manual 4.08
Page 19
C ompet ence in N uclear Inst r ument s and B ioImaging
Deleting data sets
First, select all data sets you want to delete and push <DEL> or select ‘Delete’
from the context menu.
Editing names
and comment
Not yet implemented. Instead, load the data set, rename it, possibly edit the
comment, and save it.
Archiving data
sets
Select the desired data sets and select ‘Archive’ in the context menu or push
<CTRL-A>. If you are in the archive dialog, this command is not available.
However, you can open the data sets directly from the archive.
Removing a
method
You can delete methods from the ‘Open’ menu. Push <Del> or select ‘Delete’
in the context menu. If the subdirectory of this method still includes data sets,
the message ‘Method directory not empty’ appears and the method cannot be
deleted.
Removing a
study
Select a study and push <Del> or select 'delete' from the context menu.
Copying to
another method
To copy data sets to another method, drag the selection in the method window
to the desired method. The method to which you want to copy is identified by a
dotted line.
GINA Star 4 User Manual 4.08
Page 20
C ompet ence in N uclear Inst r ument s and B ioImaging
Buttons
The catalog shows the measurements and allows you to select any number of files. The selection is done by
the standard windows procedure. Thus you select the first file, hold the shift key and select the last file. Or
you select the first file, press the CTRL – key and select successive files.
As shown in Figure 2 Directory with preview , some buttons are available in the catalog:
Copy the catalog to the clipboard. Creates a tab separated text representing the
selected part of the catalog. If no files are explicitly selected, the whole catalog
is transferred
Open
Open the measurement for evaluation. This may alternatively be done by a
double click to the file.
Preview
The preview allows to view the selected chromatogram prior to loading it. At
the same time the number of files in the catalog is reduced to make space for
the preview.
Details
Selecting details shows some extra columns in the catalog containing
information from the file: injection date and time, first comment line and
sample type. The makes it necessary to open the file and slows down catalog
speed dramatically in network directories.
<< | >>
Two navigation buttons
Escape
Escapes the catalog without further action
The catalog allows you to drag files from one method or study and drop it to one another. Furthermore each
list of the catalog (measurement files, methods or studies) have a context menu to be called by clicking with
the right mouse button
GINA Star 4 User Manual 4.08
Page 21
C ompet ence in N uclear Inst r ument s and B ioImaging
Context menus
Each list maintains a context menu to offer more functions. The file list has the following functions
Rename
Rename the file
Delete
Delete the selected files
Archive
Copy the selected files to the archive. The archive is defined in the Setup /
Path
Print report
Print the report of all selected files according to the documentation parameters
in the integration method.
Execute
evaluation
Execute the evaluation of all selected files according to the integration
parameters in the integration method.
Select evaluation
method
GINA Star selects a evaluation method with the name of the measurement's
method by default. Here you may select a different one.
Sign evaluations
(optional with user
management)
This applies the approval to the selected measurements.
Drag and Drop within the catalog
Drag and drop is provided to move measurements from one method to another or from one study to another.
This move does not affect the information about the method or study in the report nor does this affect the
used method for evaluation. Use the context menu to change the evaluation method for a group of
measurements. The information about the used measurement method cannot be changed.
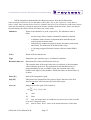
Manual Integration
The program part Manual Integration allows you to view and (re-)integrate chromatograms, and
also, if needed, to perform a fine tuning after automatic evaluation. Here you find:
GINA Star 4 User Manual 4.08
Page 22
C ompet ence in N uclear Inst r ument s and B ioImaging
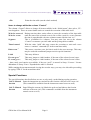
Define Integration Regions for Radioactivity Channels
Background regions
Individual regions
Select the button for background regions
. Push this button and drag
the mouse across a certain chromatogram area to create a background
region. You can then grab and drag the margin delimiter. You can delete
background regions by moving the right delimiter to the left delimiter.
When all regions have been set, unselect the button for the background
regions again by clicking another button, preferable the zoom button
Select the button ‘Drop-Regions’
. If this button is pushed, you can
create ‘Drop’ regions and separate existing ones. Simply drag the mouse
across the region you want to integrate. When all regions have been set,
unselect the button for the background regions again by clicking another
button, preferable the zoom button
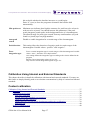
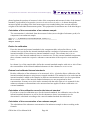
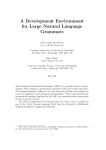
Region groups
Groups of peaks
Select the button ‘Drop-Regions’
. Push this button and you can
drag the mouse across an entire group of adjacent regions. Then you
separate them by clicking in the valleys one by one. Without making a
new selection, you can then start the next group. When all regions have
been set, unselect the button for the background regions again by
clicking another button, preferable the zoom button
Define Integration Regions for Analog Channels
Figure 3: Region group
GINA Star 4 User Manual 4.08
Page 23
C ompet ence in N uclear Inst r ument s and B ioImaging
Individual
regions
Select the button for baseline separated regions
. Push this button to
create regions. Simply drag the mouse across the region you want to
integrate. When all regions have been set, unselect the button for the
background regions again by clicking another button, preferable the zoom
button
Groups of
regions
Select the button for baseline separated regions
. Now drag the mouse
across the entire range of a group of peaks. Select ‘Drop’
and click in
the valleys inside of the selected region. When all regions have been set,
unselect the button for the background regions again by clicking another
button, preferable the zoom button
Correction of
region
delimiters
.
You can edit all features of a region subsequently. Select a picture detail,
then click on a region. Now the region delimiters appear as black dotted lines
around the region. If you move the mouse left or right over a line, the cursor
appears allowing you to shift the delimiters
. At the end you drag and
drop the delimiter at the new position.
Groups of regions and baseline
In the manual integration you have a big influence on the behavior of the baseline to calculate for
different effects on you own responsibility. Normally the baseline goes straight from one B to
another 'B'. Some special functions are not available with the mouse but from the keyboard.
H Horizontal
Horizontal means, that the baseline goes from one 'B' parallel to the x-axis.
In the case, you only have one single 'B' in the group. The 'H' separator
allow to influence this behavior. The baseline will be parallel to the x-axis
between the 'B' and the 'H'
T Tangential
The tangential peak separator does not affect the baseline, but 'skims' some
portion of a peak to the unseparated neighbor
Commands for Manual Integration
This chapter describes the key commands available for manual integration and baseline definition.
Except for the 'T' and 'H' region delimiter, these functions are as well available in the 'Edit' or
context menu.
+ Invoke
integration
Executes the automatic integration and identification routine according
the the integration parameters.
GINA Star 4 User Manual 4.08
Page 24
C ompet ence in N uclear Inst r ument s and B ioImaging
A Smoothing
Enter a smothing grade for the selected trace in the units of the x-axis.
C Clear region
Delete a single region, if selected
B Set region
delimiter
Sets a region delimiter of type B. Fixes the baseline at this point of the
chromatogram. Meaningful for single peaks or as outside delimiter of a
peak group
D Set region
delimiter
Sets a region delimiter of type D. Perpendicular separation of two
unresolved peaks. From the measurement curve, there is a perpendicular
drop to the baseline. Only meaningful inside a peak group
H Set region
delimiter
Rarely used horizontal forward or backward to generate horizontal
baseline from this point
I Peak
characteristics
Display of chromatographic characteristics in the table peak
characteristics
J Jump cursor
Jump to a given x-position
K Edit comment
The comment lines, which are printed out in each report, can already be
entered when entering the measurement in the sample table as well as in
the methods parameters.
Moreover, comments can be invoked and, if necessary, edited during
manual integration. After input of the command ‘K’, the comment is
displayed on the screen and can now be edited as needed.
M Control
measurement
During measurement, this command
O Load original
The button ‘O’ allows you to reload the file from disk to recover from
erroneous operations in the evaluation.
P Plot / report
Open the the report and allow to print the documents according to the
setup.
Q Quench
Invokes the Fehler: Referenz nicht gefunden page in conjunction with the
method.
R Rename region
To edit the name of an integration region, set the cursor in this region and
type “R”
GINA Star 4 User Manual 4.08
Page 25
C ompet ence in N uclear Inst r ument s and B ioImaging
T Set region
delimiter
XT Zoom all
Tangential separation between two unresolved peaks. Can only be
applied subsequently within a peak group. Separation line can be rotated
around tangent point using the command <Shift><Up> (push shift button
and up arrow key at the same time) and <Shift><Down> (push shift
button and down arrow key at the same time)
Zoom x-axis to display the whole area. With the button Zoom all
you
can display the entire chromatogram.
Y y-scaling
Type ‘Y’ to change the Y-scaling of the selected trace. (Y-label inverted,
can be changed by <PgUp> or <PgDn>).
A dialog window appears. You may just enter a single value forcing the
scaling from zero to this value. If the value is zero, GINA retrurns to
automatic scaling.
You may furthermore enter a range 'from-to'.
V View traces
This command accepts 1 or more digits. First, enter the number of traces
you want to see. Then if necessary select the traces you want to see from
the list.
W Display peak
labels
Select between label peak name, retention time or no label.
<ESC>
The escape key allows to leave a dialog sequence
Move region
delimiter right
Command <Shift> <right> (push shift button and right arrow key at the
same time): Position the cursor on an already existing region delimiter to
the right of the cursor. Using the same command, you can now move the
delimiter
<PgUp>, <PgDn>
select trace
Selection of the active trace for multi-trace measurements. The selected
trace is marked by the color behind the y-axes label. All trace specific
actions like scale y-axis affect this trace.
Move region
delimiter left
Command <Shift> <left> (push shift button and left arrow key at the
same time): Position the cursor on an already existing region delimiter to
the left of the cursor. Using the same command, you can now move the
delimiter
Correct tangent
slope
Command <Shift> <Up> (push shift button and up arrow key at the same
time): Rotates a separation between two peaks of type T or D counterclockwise
GINA Star 4 User Manual 4.08
Page 26
C ompet ence in N uclear Inst r ument s and B ioImaging
Change tangent
slope
Command <Shift> <Down> (push shift button and down arrow key at the
same time): Rotates a separation between two peaks of type T or D
clockwise
Export to Word
The export function copies the graphic and all report tables to a word
document. The tables are formatted as default tables. The Word editor
remains open and the user is responsible to save the file.
Special Functions
The special functions described below are not, or only rarely, needed during regular operation.
Ctrl-V: Raw
Presents the raw data of the chromatogram in a table. Data cannot be
data
changed manually. Push <F9> to print the table of raw data. Push F8 to
export the data in text format.
Ctrl-Z: Display
integration
regions
Displays all integration regions defined. Option to edit their name or other
attributes (Name position, etc.)
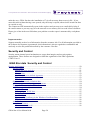
Information
•
From the context menu call 'Information'
•
From the menu call Edit / Information
The information menu consists of a tabbed screen to display additional information. The tabs group
this information into:
GINA Star 4 User Manual 4.08
Page 27
C ompet ence in N uclear Inst r ument s and B ioImaging
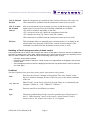
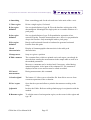
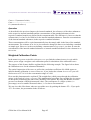
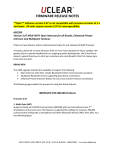
Figure 4: Information, tab Measurement
Here you find the original run name, Injection time and date, the interval time, sample position if
autosampler was used, name of the method and then build number of the software running the
measurement (in the above example 0, because 4.65 is a DOS software release).
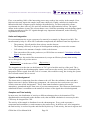
Evaluation of radioactivity
Labeling of chemical and pharmaceutical substances gives answers to questions which cannot be
given from standard chromatography. I. g. the question “is this substance a metabolite of the origin
or only produced by some other way while the pharmaceutical is present”.
The disadvantage of radioactivity is, it owns some properties to which most scientists are not as
familiar as to integration of UV-signals. Some effects appear and questions come up. These pages
try to give answers.
Count rates and statistics
Radioactive decay is for itself a statistical process. This cannot be overcome by improving
detectors. If a nuclide is unstable at all, from a big number of atoms half of them will have decayed
after a certain time which is characteristic for each isotope (half life time). This does not predict the
behavior of a specific atom, it is completely unpredictable, when this will decay. In other words, big
numbers of atoms make the statical effects invisible while small numbers (low activity) will show
this effect. Unfortunately, there are a lot of reasons to label substances with low amount of activity.
GINA Star 4 User Manual 4.08
Page 28
C ompet ence in N uclear Inst r ument s and B ioImaging
First, even marking 100% of the interesting source may result to low activity in the sample. Next,
high activities may impact the sample itself (auto-radiolysis). Finally, radioactivity impacts the
human health, thus it impacts people dealing with radioactivity. For these and other reasons,
experiments are done with very low activities and therefore high statistical effects. The signal
shown in the software is more like a forest than a curve. Software smoothing and calculating signals
to show smooth curves like UV-signals through away important information, as the following
explanations will show.
Units and integration
Every measurement tries to get a property of a material or a sample (i.g Bequerel per ML). The
measurement by help of a flow cell is somewhat complicated, the obtained count rate depends on:
•
The geometry. Not all particles from a decay reach a detector.
•
The counting efficiency or the part of desintegrations making an event to the counter
•
Cell volume or the amount of sample visible to the detector
•
Flow rate makes effect to the peak area (see GINA Star user manual / Calculation of Radio
Signals for more details)
The last point says: the result of the measurement is (except an efficiency factor) what activity
moves through the cell per time unit or
Bq activity
or in the case of TLC
s
Bq activity
mm
The integration over the time (or the distance in TLC) gives back the activity of the peak. The yscale of the graph in the chromatography is not a count rate nor the activity, this is obtained by the
integration. Please regard: from the view of a counter, this would be wrong, but viewing the system
flow cell and counter, this is correct!
Signals and background
The eluent moves components from the column to the cell. Here the radiation is detected and a
higher count rate is shown. Without any component, the count rate does not become zero, but a
certain count rate called “background”. This is from natural radiation coming from walls,
atmosphere, ground and maybe from rests of previous measurements. This count rate should not be
subtracted because it contributes to the statistical variance of the signal above this background.
Samples and Total activity
In most cases, the distribution of activity to different substances has to be determined. This
distribution does not depend on the absolute scale, thus no DPM calculation is necessary for this.
CPS/s may be integrated to CPS.
The activity of the sample is distributed over the chromatogram. Every peak represents a
component and contributes a certain amount to the total activity. In the best case, after integration,
the total activity is resolved in peaks and clarified by this way. Total activity, the sum in regions and
GINA Star 4 User Manual 4.08
Page 29
C ompet ence in N uclear Inst r ument s and B ioImaging
the remainder (difference of these two) is calculated by GINA Star. A raw rule is: the activity is
resolved, if the remainder is within +/- 5% or some of regions is 100% +/- 5%. The Integration may
be higher than 100% because the Total activity does not contain the background but type 'B'
regions may integrate areas regarded as background by the calculation of total. Please avoid regions
of type 'B' in radio – traces and regard the hints in the GINA Star manual.
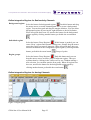
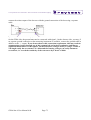
Estimate the limit of detection
See also: Open File / Setup / Edit setup / User options / Dialog
If you did setup 'Peak width to display limit of detection' to the estimated width at half height of
your peaks and 'Factor for sigma' to i.g. 3, the display will show two help lines, one for the
background defined by the BKG – region and one which has to be touched by the region to fulfill
the sigma condition.
Figure 56: Estimate limit of detection
Background subtraction and 'negative'
If background subtraction is even done (as like in some instruments of various supplies), a so called
CPS value (net counts per second) is calculated. Some people think, that this value must not
become negative (“count rates cannot be negative!”) and instruments are built truncating these to
zero. This gives wrong results as the following example shows: imagine a background of one CPS
measured in one second time intervals. Some intervals will give zero, some 1 and some 2 rarely 3
will occur, the mean count rate over 10 minutes will be 1. To calculate this example, I use a
simplified statistic resulting in 2 for half of all time intervals and 0 for the rest, 600 counts after 10
minutes. After background subtraction, the intervals with 2 result to a CPS value of 1 and from 0 a
CPS rate of -1 is calculated. After 10 minutes, the sum of all “CPS” interval rates is zero as we
GINA Star 4 User Manual 4.08
Page 30
C ompet ence in N uclear Inst r ument s and B ioImaging
expect after background subtraction. If now negative CPS values are truncated to zero, only positive
contributes remain and we get a sum of 300 in this simplified statistics (somewhat less than 300 in
real statistics). This is more worse than only theoretically wrong, this decreases the peaks above the
background, because within the peak, there is enough counts to subtract the background.
Report
The report is a collection of information provided for every measurement file by GINA Star. It may
be viewed, printed and exported to files or other systems and may be invoked from many places in
GINA Star:
•
From manual evaluation by command 'P' (print report)
•
From manual evaluation, context menu 'Print report'
•
From the catalog select a collection of runs, right click and from context menu select
'Report'
•
As part of an automatic integration, select 'Print report' in the evaluation method
Figure 7 Report view
Sample description
This report section contains some general information about the sample.
GINA Star 4 User Manual 4.08
Page 31
C ompet ence in N uclear Inst r ument s and B ioImaging
Preparation
The preparation contains a sequence of user actions, needed to start a run. Here, the user may be
enforced to document charge numbers from contributes, confirm the presence of tools and
properties. This page is normally not used and disabled in the Setup / User options / Dialog.
Manual control audit trail
Every action applied by the user during measurement affecting the measurement itself are recorded
in this trail. If the user changes the run total run time, the UV-wavelength
Measurement audit trail
This trail covers every change on any item of the measurement method including creating and
copying. Thus it may be helpful instrument during method development. It is not printed along with
the report because it covers information coming from the method and information reported in the
'Manual control audit trail'.
Integration
This area contains the result tables of the integration. The information appearing here depends on
the selections in the report generator and on the properties of the measurement trace. Traces from
radio detectors contain some additional information. Traces for quality control cannot be integrated,
i.g. the pressure signal from the pump.
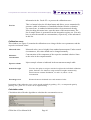
Report Design and Report Columns
To define the contents of a report, edit two properties:
•
File Setup / Edit setup / Options / Print options
•
From evaluation Report / Report generator
Report generator
Using Report generator, you can select the columns appearing in your report and design their
format. Select from a defaulted list of output values the one that is relevant for you, determine under
which header this value should appear and which width the respective column should have. You can
also set the output format.
•
From the report use the icon 'Report generator'.
GINA Star 4 User Manual 4.08
Page 32
C ompet ence in N uclear Inst r ument s and B ioImaging
•
Call the integration method and select Report generator from the left hand menu.
Select an output value from a list. To add further values, push <Ins> or the <space bar>. Push <Del> to
remove values. Enter a header for the respective column in the report. You can make the width of the column
wider than the header by inserting the appropriate number of blanks behind the header. Please note that the
format defined by the column Format also affects the column width.
Substance
Name of the substance or peak, respectively. The substance name is
either
•
the user entry after a rename command in manual evaluation
•
a substance name from the component table identified by the
peak position (retention time)
•
consecutively numbered regions from the automatic peak search
like R-002, the name may be defined in the setup.
•
a vial range assigned from the fraction collector control 'M001001'
Trace
Name of the measured trace
Type
Integration type (baseline type), see Manual evaluation.
Retention time (tr)
Retention time of the peak.Retention time (tr)
The retention time of the peak is the time (or position) of the maximum
value within the peak area. The maximum is calculated based on a 5
point smoothing. In case of a BKG region, the retention time is the
middle of the region. If the middle is a half time interval, the left interval
is taken.
Start (IS)
Start of the integration region
Stop (IT)
End point of the integration of the region. Stop is the time of the first
interval not taken into account at the end of the region
Area (A)
Integral area of the peak. The formula is:
IT −1
A= ∑ I n−B n∗Dt
n= IS
A:
Area
IS:
Start
IT:
Stop, the integral does not include the last interval, this will be included
to the next, contiguous region.
I(n):
Interval values. These values can be obtained from the 'Values table'
GINA Star 4 User Manual 4.08
Page 33
C ompet ence in N uclear Inst r ument s and B ioImaging
during manual evaluation with the command 'CTRL-V'
B(n):
Dt:
Background values, see BKG for more information
Time interval, the duration of one time interval
%area
is the percentage of the peak area compared to the sum of all peak areas.
%total
Percentage of the peak area compared to the area above the baseline.
This value is calculated for radioactivity traces only.
Concentration
Calibrated substance concentration. Available only after calibration.
Half-life width
Width of a peak at half of its height (FWHM).
Height
Height of the peak.
Net retention time
(t’)
Retention time of the peak minus the dead-time of the column.
Capacity factor
(CF)
Cf = Tr / Dt
Limit of detection
Quotient of net retention time (tr) and dead-time of the column.
Number of plates
is 5.54 times the square of the quotient of retention time (tr) and half-life
width (FWHM).
Symmetry
is the width of the left half of the peak on its 10% height divided by the
width the right half of the peak on its 10% height.
Resolution
Dt Dead time of column, Tr retention time of the peak
RS =
tr1−tr
∗ 5.54/4
FWHM1FWHM
tr is the retention time of the peak, tr1 is the retention time of the following
peak. FWHM and FWHM1 are the half-life widths of the peak and the
following peak.
Selectivity
is the ratio of the capacity factors of the reference peak to the peak.
Internal standard
if several internal standards are used, this column indicates which
internal standard was assigned to the substance.
Mean activity
Calculates the mean activity or intensity of the signal within the area
Counting error
Sqrt from brutto counts
Limit of detection
Minimum peak area which is secure detected at a given statistic (Sigma
GINA Star 4 User Manual 4.08
Page 34
C ompet ence in N uclear Inst r ument s and B ioImaging
value).
IT −1
Li= f ∗n∗ ∑ B i∗Dt
i= IS
n Factor for sigma (1 sigma,3 sigma etc. to set in Setup / User options)
B(n) Background, see area for all other items
Relative retention
T' / dead time of column. Set this time in the measurement method /
Further parameters
Signal to noise ratio Theoretical value for the classical “noise”
Sig=20∗log Area net/ area brutto
Area(net): area as indicated above
Area(brutto): area without background subtracted
Footer lines
Footer lines contain summery information about the corresponding column.
Remainder (optional)
The remainder is the net content of a trace without the marked regions, thus it measures the activity
not integrated. It is calculated for the columns 'Area' and '%Area'.
Total (only radio traces)
Total is area above the background (the area may be restricted to the the area between origin and
front). If more than one BKG region is set, the baseline subtracted is a polygon between the points
defined by each BKGn. Outside these points a constant value is subtracted defined by the outermost
BKG. For TLC, two total values are calculated. Total means the whole measured area, while Total
RF means the total area between 'START' and 'FRONT'.
BKG
Each BKG defines a point for the baseline to be subtracted. The position is the middle of the region.
The height is the mean value of the regions intervals. The sum may be calculated like the Area but
with all B(n) set to zero. The baseline for drop regions is defined by a polygon between the BKG
regions. Outside the last BKG the baseline is constant.
IT −1
BKG= ∑
i =IS
I i∗dT
T bT −T bS
GINA Star 4 User Manual 4.08
Page 35
C ompet ence in N uclear Inst r ument s and B ioImaging
I(i):Intensity at interval i, bS: start of background region, bT end of background region, T(i) time of interval i, dt: time
of one interval
Peak search
For automatic peak search it might be necessary that you specify several values that describe the
probable shape of the peak instead of using the automatic parameter detection
Trace
Shows the trace to set the parameters
Peak search
method
Set the peak search method for the respective trace. The following methods
are available:
No peak search No peak search will be performed. Already set peaks will be
retained. (This setting is also used to print a list of chromatograms with
already set peaks using the automatic integration routine)
Automatic peak search Automatic peak search is enabled. All peaks already
set in the chromatogram are deleted before automatic peak search starts.
Auto + copy from component table Automatic peak search is enabled. In
addition, all peaks defined in the component table are copied into the
chromatogram. This is useful to prove that substances are missing, for
example in metabolite studies.
Copy from component table No peak search is performed. Instead, the
substances listed in the component table are copied into the chromatogram; the
retention time and the time window define the start and end point of the
integration region.
Control
The integration control influences the peak search and the integration. Here
you can enter the values for peak width, baseline drift and minimum peak area
for the entire chromatogram or for part of this chromatogram. See table below
for details
Items to specifically influence the peak search
FWHM
Enter the FWHM (full width half maximum) of the peak. At this point, the
width at half height need not be very accurate; an estimated value suffices in
most cases.
Enter “0” (zero) to force the program to determine the peak width
automatically
Baseline drift
Enter here the approximate drift of the baseline per minute. GINA Star takes
GINA Star 4 User Manual 4.08
Page 36
C ompet ence in N uclear Inst r ument s and B ioImaging
this to decide whether the baseline increases or a peak begins.
Enter “0” (zero) to force the program to determine the baseline drift
automatically.
Min. peak area
Minimum area indicates how high the contents of a peak has to be at least in
order not to be rejected. You should increase this parameters if the peak
search integrates pseudo peaks in the background noise of a chromatogram.
The allowed range for peak reject extends from any small numbers (no peak
found is rejected) up to any high numbers.
Auto-peak
search
Disable or enable integration for a certain range of the chromatogram.
Peak direction
This setting allows the detection of negative peaks in certain ranges of the
chromatogram. Possible values: “positive” and “negative”.
Force
integration type
Force a certain integration type in certain ranges of the chromatogram. Possible
values: “auto”, “baseline” and “drop baseline”.
Auto setting defines the integration type according to the criteria defined in the
program.
Baseline forces integration regions of type “B”
Drop baseline forces integration regions of type “D”.
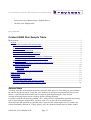
Calibration Using Internal and External Standards
This chapter describes in detail the calibration with internal and external standards. You may use
this feature to simply identify peaks or to calculate concentrations by help of external and internal
standards.
Content calibration
Calibration Using Internal and External Standards............................................................................37
Overview...................................................................................................................................38
Calibration step by step.............................................................................................................38
First step: separation.............................................................................................................38
Second step: Enter standard concentrations.........................................................................39
Third step: Do the calibration...............................................................................................39
Fourth (last) step: measurement of unknowns and do the recalibration...............................39
Important hint.......................................................................................................................40
Items of standardization............................................................................................................40
GINA Star 4 User Manual 4.08
Page 37
C ompet ence in N uclear Inst r ument s and B ioImaging
List of components...............................................................................................................40
Calibration curve .................................................................................................................41
Calculation rules...................................................................................................................41
Calibration via Internal and External Standards...................................................................42
Determining the calibration curve........................................................................................43
Calculation of concentration of a substance in unknown samples.......................................43
Internal and external standards.............................................................................................43
Calculation of calibration curve...........................................................................................43
Calculation of the concentration of an unknown sample.....................................................44
Entries for calibration...........................................................................................................44
External and calibrated internal standards............................................................................44
Calculation of the calibration curve for the internal standard .............................................44
Calculation of the concentration of an unknown sample.....................................................44
Operation..............................................................................................................................45
Weighted Calibration Points.....................................................................................................45
Trouble shooting for standardization...............................................................................46
Overview
External standardization employes the result of a measurement with known concentrations to
determine the sensitivity of the instrument against a substance to calculate concentrations from
unknown samples in subsequent measurements. After establishing the method, the only task of the
user is to tell GINA Star whether the next sample in the sample table is a known concentration
(Standard) or an unknown concentration.
Calibration step by step
As a part of GINA Star's installation the method 'sugar' appears with some standard measurements
and one unknown. This allows to follow the steps without doing real measurements.
First step: separation
The first step of a calibration is a chromatographic separation of some components in a normal
chromatogram. Let peak search find the peaks and rename them to reflect the name of the
corresponding component. After this from the chromatogram view you open the integration
method, select 'List of components' and push the button 'New list' on the left hand part of the screen.
By this, GINA Star copies information from the chromatogram to the components table. These are
the positions and names of all peaks:
GINA Star 4 User Manual 4.08
Page 38
C ompet ence in N uclear Inst r ument s and B ioImaging
Figure 8: List of components
Second step: Enter standard concentrations
Standard concentrations have to be entered to the 'List of components'. Standard solutions have
numbers, each should have a different concentration. Normally standard solutions derive from a
first mixture by diluting. Thus, they have a fixed relationship.
Figure 9: External standard component with curve
Third step: Do the calibration
The very first time, measurement of standards are used to establish the sample table. Thus they have
not already been used to for calibration, this has to be done manually this time. To do this, again
open the measurements, from the 'Edit' or from the context menu, select 'Information'. Now select
the 'Calibration' tab.
Fourth (last) step: measurement of unknowns and do the recalibration
Unknown samples may now be processed without taking care about anything. The column
'Conecentration' contains what GINA Star looks up from the above curve. To start a new
GINA Star 4 User Manual 4.08
Page 39
C ompet ence in N uclear Inst r ument s and B ioImaging
calibration, select the appropriate standard number in the sample table. The first standard in a series
of standards clears the whole calibration, no part of the old calibration remains valid over the start
of a new one. All standards have to be measured within one block with no intermittent samples. If
you don't want this, don't mark standards in the sample table and enter them to the curve like in the
previous, third step.
Important hint
Once a report is printed of an unknown run, the result table of the actual calibration is copied to the
run itself. If you want changes on the actual calibration to be reflected in that run, open the
Information, TAB calibration and press button Return to calibration of station.
Items of standardization
List of components
Substance name
Internal standard
Trace
Retention time
Window
Concentration
Enter the name of the component. This name links the regions with the
standard values and curve, but may also simply be used for peak
identification.
Enter “I” when the substance serves as internal standard. If more than one
internal standard is allowed (see chapter on page ), they are numbered
automatically. Each individual component refers to an internal standard.
Enter the number of the internal standard on which calculation of the
respective substance should be based. If only one internal standard is
foreseen, this assignment is not required.
Enter the trace to which the substance should be assigned.
Enter the retention time of the substance. If you enter “N” instead of the
retention time, the identification will be based on the peak name.
If you want to define an individual window for the retention time instead of
the absolute and relative windows, which can be set in , enter it here.
Under normal circumstances the width of the window is calculated based
on the information for “absolute window” and “relative window” from the
menu . However, if this value has been overwritten once, you have to enter
a zero to restore it again.
Enter the concentration of the calibration substance in the respective
standard solution. In you have defined one unit (for example ug/l). Use this
unit. The number of the standard has to agree with the respective
GINA Star 4 User Manual 4.08
Page 40
C ompet ence in N uclear Inst r ument s and B ioImaging
information in the . Push <F2> to process the calibration curve.
New list
This is a button below the left hand menu and allows you to automatically
generate a table of substances of standard solutions from the evaluation
you came from. A standard solution must have been measured already.
After invoking this menu item, enter the name of this measurement. The
list of sample shares is generated from the integration regions set. You only
have to enter the amounts or concentrations, respectively, of the substances
in this list.
Calibration curve
This window (see Figure 2) contains the calibration curve along with the curve parameters and the
respective measured values.
Measured value
Substance
concentration
Injection volume
Measured value (area or height) from standard measurement. Under normal
circumstances, this value should not be changed manually.
Concentration of the component of the respective standard solution. Same
as the value in the component table.
Injects sample volume as indicated in the measurement sample table.
Statistical weight
You have the option to assign a statistical weight to the individual calibration
points. Push the <F2> button to assign statistical weights automatically.
Select between constant distribution, 1/x and 1/x2, where x is the
concentration.
Percentage error
Distance between calculated curve and measrured value
Presentation of the calibration curve can be spread gradually by pushing <F5>, or compressed again by
pushing <F6>; push <F3> to reset it to its original scaling.
Calculation rules
Calculation rules affect the algorithm to calculate the concentration curves.
Figure 10: Calibration rules
GINA Star 4 User Manual 4.08
Page 41
C ompet ence in N uclear Inst r ument s and B ioImaging
Curve type
Force zero crossing
Calibrate by peak
area or peak height
Unit of results
Absolute window
Relative window
Defines whether the curve is linear or not. Normally it should be linear.
Specify if the standard curve should pass through the zero point or if it
should be allowed to cut the axes at another point.
Select if calibration calculations are to be performed based on peak area or
peak height.
The unit for calibration serves for documentation and as an ensurence
while input of values. The unit is irrelevant for calculation, the results
have always the same unit, just like the entered standard concentrations.
The retention time from the component table is used to identify a
substance. However, since the retention time may vary slightly, a retention
time range or retention time window has to be defined for identification.
Enter here the permitted deviation in positive and negative direction in
absolute time units
The retention time from the component table is used to identify a
substance. However, since the retention time may vary slightly, a retention
time range or retention time window has to be defined for identification.
This value is added to the absolute window.
ith increasing retention time, this variation increases as well. Therefore,
we have provided the option to make the size of the window dependent on
the retention time. Enter the size of the window in percent of the retention
time. Please note that the absolute window will be added to this window
Calibration via Internal and External Standards
The program offers different ways of calibrating results via internal and external standards. This
chapter will describe these procedures, explains their use and shows how results are derived from
raw data.
The following definition will be referred to in the following chapters. For each sample (standard or
unknown sample) the sample amount is calculated in arbitrary units:
Measurement result refers to the area of a substance peak or to its height, depending on whether
calibration via Peak areas or Peak heights has been set in the integration method in the menu
Calculations rules.
The GINA program allows the use of up to four internal standards. This fact will not be pointed out
any more explicitly in the following chapters. Which of the four internal standards has been used
for calibration of the respective substance is defined in the component table. See chapter on page .
GINA Star 4 User Manual 4.08
Page 42
C ompet ence in N uclear Inst r ument s and B ioImaging
Determining the calibration curve
A series of standards with known substance concentrations will be measured for calibration with
external standards.
To define the calibration curve, the concentration of the component from the component table is
multiplied by the sample amount and plotted against the measured value. A polynomial of
regression f (measurement value) is drawn through the measured points according to the least mean
square error method taking into account statistical weights of the individual measurement points.
This polynomial is maximum one of the third degree.
If the calibration curve should pass through the zero point, the zero point is automatically added as
additional measurement point to the measured points. This additional point is given a statistical
weight of 1000 above the highest statistical weight of the calibration.
Calculation of concentration of a substance in unknown samples
If you are working only with internal and not with external standards, the substance
concentration of the unknown component is calculated as follows:
ConcIntStd
Concentration = measured value * ------------------measured valueIntStd
Enter the internal standard substance with name, retention time and retention time window in the
component table. Enter “I” in the column IntStd. Thus, this substance is defined as internal
standard substance. In this row, the columns Std1 Conc to Std16 Conc will be left blank, i.e. they
will contain only zeros.
If you plan to use more than one internal standard, you have to enter each internal standard
substance in this manner in the component table. The external standards are numbered
automatically. All substances that are to be included in the calibration, also have to be entered in
the component table. In the column IntStd you enter the digits “1” to “4” to define to which
internal standard they should refer to. The retention time and the retention time window are also
entered. Only columns Std1 Conc to Std16 Conc have to contain zeros!
In the sample table you have to enter the concentration of the respective internal standard in
columns Int or Int1 to Int4.
Internal and external standards
This method combines the calculations of the external standard method discussed above and pure
internal standard method. Calculation of the calibration function is similar to the external standard
method:
Calculation of calibration curve
For calculation of the calibration curve the concentration of the component from the component
table is multiplied with the sample amount, divided by the concentration of the internal standard and
GINA Star 4 User Manual 4.08
Page 43
C ompet ence in N uclear Inst r ument s and B ioImaging
plotted against the quotient of measured value of the component and measured value of the internal
standard. A polynomial of regression f (measured value/measured valueIntStd) is drawn through the
measured points according to the least mean square error method taking into account statistical
weights of the individual measurement points. This polynomial is maximum one of the third degree.
Calculation of the concentration of an unknown sample
The concentration is calculated from the measured value (area or height of substance peak) of a
component in an unknown sample:
ConcIntStd * f(measured value/measured valueIntStd)
Conc = ---------------------------------------------sample amount
Entries for calibration
Enter the internal and external standards in the component table as described above: in the
column IntStd you define the internal standards and the correlation of substances and various
internal standards (if more than one internal standard is used). The columns Std1 Conc to
Std16 Conc of the internal standards have to contain zeros. For the external standard components,
these columns contain the respective substance concentration of the respective concentration
level.
In column Type of the sample table, define the external standard samples with Std1 to Std16. Enter
the concentration of the internal standard substances in the columns Int or Int1 to Int4.
External and calibrated internal standards
Besides calibration of the substances to be measured, GINA - STAR also allows calibration of the
internal standard substances using known external standards. This method is to be used when the
internal standard is added to the samples in different concentrations and it is to be expected that
the measured values of the internal standard substances are not proportional to their
concentrations. In many cases, this can be assumed with the same right as it is assumed for the
unknown substance concentrations to be measured and one applies to them a calibration via
external standards.
Calculation of the calibration curve for the internal standard
If you have created a calibration curve for the internal standards, the calibration curves for the
internal standard substances as well as for the substances whose concentration it to be
determined is calculated according to the external standard method described above.
Calculation of the concentration of an unknown sample
The calculation of the substance concentration of an unknown sample is done according to the
formula:
GINA Star 4 User Manual 4.08
Page 44
C ompet ence in N uclear Inst r ument s and B ioImaging
ConcIntStd * f(measured value)
Conc = ----------------------------------fIntStd(measured valueIntStd)
Operation
As described in the previous chapters, the internal standards, the references of the other substances
to the respective internal standards and the concentrations of the standard substances in the
respective standard samples are defined in the component table. The difference is, however, that the
columns Stdn Conc have to be filled in for the internal standard substances. Enter the concentrations
of the internal standard substances in the respective standard solutions.
These concentrations will be copied automatically into the sample table in the lines of the standard
measurements. The columns Int or Int1 to Int4 cannot be changed in those rows including a standard
as sample type. However, in the rows defining a measurement of type sample, you have to enter the
concentration of the internal standard substance or internal standard substances in the columns Int or
Int1 to Int4.
Weighted Calibration Points
In the menu Integration method/Edit calibration curve you find the column Statistical weight which
allows you to assign a weight to each calibration point for calculation of the calibration curve.
The purpose of this feature shall be explained by the following example. The figure below shows
the calibration curve for the substance Rhamnose:
The optical impression of the curve as well as the correlation coefficient of 0.99888 appear to
indicate that the calibration is correct. However, if you look at the column Percent error you will
find an error of 271.6 % for the concentration range of 1.000.
How can this phenomenon be explained? The straight line, which passes through the calibration
points, is the result of a linear regression. This mathematical procedure fits a straight line in a group
of data points, minimizing the sum of the (absolute) error squares. By using the absolute error we
get an overvaluation of the high measured values. The consequence is a larger (relative, i.e.
percentage) error for smaller measured values, i.e. for lower concentrations.
We can view this effect better when we spread the curve by pushing the button <F5>. If you push
<F5> five times, the presentation looks as follows:
GINA Star 4 User Manual 4.08
Page 45
C ompet ence in N uclear Inst r ument s and B ioImaging
Now only the first two calibration points are displayed. One can see how far they lie next to the
calibration curve.
Move the cursor to the column Statistical weight, push <F2> and enter statistical weights for each
calibration point. However, you can also perform automatic weighing. In the column Statistical
weight, push the <F2> button and select one of the offered weighting functions. In our example, we
select 1/x2. This means that the weight is calculated by the reciprocal of the square of the substance
concentration.
The result is displayed immediately:
Now the curve passes correctly through the calibration points, the calculated percentage error for
standard 1 (concentration 1.000) has dropped from 271.6 % to 1.1 %! For compensation, the error
of the third standard has increased from 0.2 % to 3.5 %.
Conclusion: Due to the commonly used mathematical method of linear regression for calculation of
a calibration curve based on calibration points (external standards), there is an unequal distribution
of relative errors in the low concentration range and thus a high relative error.
A more even distribution of relative errors over the whole concentration range can be obtained by
applying statistical weights to the calibration points.
<F5> spreads the curve; pushing <F5> repeatedly increases the spreading. <F6> gradually undoes
the spreading, whereas <F3> cancels the spreading
Trouble shooting for standardization
If you do not get the desired results, please check the following items prior. to calling the raytest
service.
Are the needed items displayed in the dialog? If not, please check Setup /
Options enabled /
menu items don't User options / Dialogs whether external standard is enabled and the needed
number of internal standards.
appear
No entry in result
Be sure to have the correct standard number in the sample table. After
measurement you may check and correct by the command Edit/Information/
Calibration.
GINA Star 4 User Manual 4.08
Page 46
C ompet ence in N uclear Inst r ument s and B ioImaging
table
No result for
'unknown' or
normal samples
- Did you add the 'Concentration' column in the report generator?
- Do you have peaks with the name of defined components?
- Did you calibrate before obtaining results? Otherwise enter Information /
Calibration and 'Return to calibration of the station'
Units don’t
appear
Units should be entered to the page ‘calculation rules’ within the evaluation
method. They are for documentation only because GINA Star calculates the
results in the same unit as the standard concentrations are given.
Support and Version Management
Examine the program version
Information about the software version is provided on the version information dialog. You gain this
by the menu
Help / Info
GINA Star 4 User Manual 4.08
Page 47
C ompet ence in N uclear Inst r ument s and B ioImaging
GINA Star 4 User Manual 4.08
Page 48
C ompet ence in N uclear Inst r ument s and B ioImaging
Picture 11: Version information
The first line contains the name of the software, the second line contains the exact version number:
Releases
Releases have a release certificate at the end of a test phase. Releases are
indicated just by the version number like Version 4.xx
Bug fix
Bug fixes are guaranteed to be derived from the corresponding release only
by fixing bugs. These bugs are listed in the version history.
Version 4.xx release 2
Development version Development versions contain new features and you should only use
development versions, if your work depends on these new features.
Version with new features are not guaranteed to work correctly. The
indication is Version 4.xx dev. bbbb. bbbb is the build number of the
version and is incremented for every build.
ß - releases
ß - releases are the end of a development of new features. The software is
not yet fully tested. If you use a ß, hints about problems are especially
welcome. Version 4.xx ß bbbb. bbbb is the build number from the
same series of numbers like development build numbers.
Support
Menu 'File / Problem report'
To give support, sometimes setup information or run data are necessary to analyze a problem. To
GINA Star 4 User Manual 4.08
Page 49
C ompet ence in N uclear Inst r ument s and B ioImaging
make the easy, GINA Star does the installation of 7-zip all necessary data to one zip file. If you
enter this menu without having a run opened, only the setup is copied, otherwise the actual run data
are copied as well.
The compressed ZIP automatically opens in the explorer and you may now e-mail this by help of
the context menu or you may copy it to the network or to a memory stick to send it from elsewhere.
Please give a hint in the text field about your problem even the report is announced by a telephone
call.
Important notice:
Support normally needs a lot of information from the customer side. For all information provided to
the software development is guaranteed: this information is always regarded as confidential and
used only to solve the problem described by the customer. Because
Security and Control
Security means internal proof mechanisms to ensure data integrity and security against
manipulation. These features are designed to fulfill the regulations of the FDA regulations
CFR 21 Part 11.
GINA Star data Security and Control
Security and Control...........................................................................................................................50
Access control...........................................................................................................................51
Dialogs for users and rules...................................................................................................51
User list.................................................................................................................................51
User account.........................................................................................................................52
Certificates for user defined signatures................................................................................52
Rights within the rules..........................................................................................................52
User classes..........................................................................................................................53
Signatures for run and evaluation data......................................................................................54
How to approve and unsign measurements..........................................................................54
Theory of data security for GINA Star 4..................................................................................54
Measurement data.................................................................................................................54
Imported Data.......................................................................................................................55
User signing of RAW data..................................................................................................55
Evaluation data.....................................................................................................................55
Certified data........................................................................................................................55
Signatures by Certificates in the Windows Certificate Store...............................................56
Hint for the software validation:..........................................................................................56
Audit Trails...............................................................................................................................56
Audit trail viewer..................................................................................................................56
Measurement audit trail........................................................................................................56
GINA Star 4 User Manual 4.08
Page 50
C ompet ence in N uclear Inst r ument s and B ioImaging
Measurement method audit trail...........................................................................................57
Evaluation audit trail............................................................................................................57
Global trails...............................................................................................................................57
User access audit trail...........................................................................................................57
Instrument control trail.........................................................................................................57
Critical events trail (Sytem trail)..........................................................................................57
Access control
Access control regulates the access to various functions. To accomplish this, users are organized in
classes. Rights are defined within these classes.
•
From the menu call Setup / Edit setup / Program / Access control
Dialogs for users and rules
Figure 12: Access control
Each users belonging to a class is indicated in the user tables column 'Allowed access'. The class is
selected from a drop down list and belongs to rights within a tab on the 'Rules' page. Here the rights
are granted by checking the corresponding check boxes.
User list
The user list contains information about access rights to GINA Star for each individual user. User
names are case insensitive. The actual user is selected from this list
GINA Star 4 User Manual 4.08
Page 51
C ompet ence in N uclear Inst r ument s and B ioImaging
User account
All user account setup properties are valid for all stations using the same setup root directory except
the user certificate for signing the evaluation.
The 'Rules' area starts with a check box to select the type of user account. No access control
disables the account control. Everything is allowed to any user. Trailing access is disabled. The
recommended access control is 'Windows User Management'. This means, GINA Star uses the
account formerly used to login to Windows 2000 or Windows XP. Thus password management and
checking is done by the OS.
GINA User management means, passwords and account are maintained by GINA Star independent
of the OS. Thus, every time GINA Star is started, the user is asked for a user name and password.
The GINA Star user management is not checked for compliance.
Certificates for user defined signatures
See also: Signatures
If the 'Windows User Management' access type is selected, GINA Star offers two selection drop
downs from the windows certificate store. The first belongs to measurements. GINA Star
guarantees the data integrity for measurements acquired with version 4.01 and higher and data files
imported from actual versions of other raytest products. Data import from older versions of GINA
Star as well as imports from foreign software cannot be checked, GINA Star cannot guarantee for
untouched original data. So far these data cannot be approved and signed at the end of the
evaluation. As a substitute for this, the user may sign the measurement by his name. This means he
guarantees the data integrity instead of GINA Star. In this case GINA Star allows again to approve
and sign the evaluation.
The second certificate adds up the signing of evaluations. Signing the evaluation always employs a
certificate build in to GINA Star. In addition GINA Star takes a user certificate selected here to add
a second signature to the evaluation. The improvement of this is, that the user is able to proof even
outside the company, that the data belong to a certificate tree of the companies CA.
Rights within the rules
Open data
View the measurement results or evaluated data
View method
This right allows to view measurement methods.
Change evaluation
This right includes the right to change evaluation methods as well as the
measurement file directly. Change evaluation includes the right to delete
non-controlled runs. At the end, this right allows to 'complete evaluation'.
This right automatically implies 'Open data'.
Start measurements Allow to start single measurements or to start the execution of a sample
table. This right automatically implies 'View method'.
GINA Star 4 User Manual 4.08
Page 52
C ompet ence in N uclear Inst r ument s and B ioImaging
Edit methods
This right grants the users the right to edit and change measurement
methods. This right automatically implies 'View method'.
System
administration
This allows to manage exact these pages of information, the user list with
the belonging to classes, and the rights within these classes.
Approve evaluation
This is the main function of the documentation, signing the document. In
the case you employ a smart card with a fully qualified certificate, this is
equal to a hand written sign to that document. This right automatically
implies 'Open data'.
Unsign evaluation
To re-edit a evaluation already signed, it is necessary to unsign it. This
depends on this special right. In mixed organizations using paperless and
printed documents, the printouts have to be marked at this point.
If users with allowance to edit evaluation try to edit a 'completed
evaluation', it depends on this right to do that. Unsign is done from context
menu 'Information / Evaluation'. Here, buttons are available for sign or
unsign. This right automatically implies 'Open data'.
Maintenance
Allow the maintenance of the instruments, i.g. Change the UV-lamp of the
UV-monitor. Of course GINA Star can only observe the access to the use
counters of these items.
User classes
In opposite to groups, classed contain users only once, each user belongs exactly to one class. This
may be less flexible as groups, nevertheless it is more transparent. Access control consists of the
user table and the rules tabs.
The 'Levels' have some freedom to adapt special rules in the customers lab. By default, Level 1 is a
method developer and has the right to edit measurement methods, start measurements and do all
evaluations.
User classes have a name and default rights already assigned to have a read to use system for
standard situations
GLP - Inspector
The GLP – Inspector needs to view all data and should not have the right
to take any influence.
Administrator
The administrator has to manage the user accounts and the user rights, but
normally should not process or edit measurements. He may as well have
the right to maintain the system.
GINA Star 4 User Manual 4.08
Page 53
C ompet ence in N uclear Inst r ument s and B ioImaging
Level 1
The 'Levels' have some freedom to adapt special rules in the customers
lab. By default, Level 1 contains users, which are allowed to do
evaluations. This includes edit of evaluation methods.
Level 2
Allow to start single measurements or to start the execution of a sample
table.
Manager
The manager is by default the only one to unsign measurements. He is also
allowed to influence evaluations.
Guest
The guest may only view measurements.
Signatures for run and evaluation data
How to approve and unsign measurements
At the end of the evaluation, data may be signed (approval). Signing data works in two steps. Users
having the right to do the evaluation apply a “Mark evaluation completed” to indicate, evaluation is
ready. Users having the right to apply the signature (approval) by the same buttons. A user may
have both rights, in this case both steps are done at once.
•
The rightmost icon in the icon bar offers the approval.
•
From evaluation call context menu 'Information' view on the tab 'Evaluation', an approval
button is offered
•
From the catalog select all desired runs and from the context menu select 'Approve
evaluations'.
•
To unsign a measurement, call Edit / Information, select tab 'Evaluation' and press the
'Unsign' button. This is available to revoke a normal approval as well as to revoke the status
'Evaluation completed'.
As the result of the approval, the icon of the MDI title bar gets the green “ok” symbol (this is
thin, if the evaluation is marked completed). This symbol will indicate the state of approval in
the catalog as well.
Theory of data security for GINA Star 4
Measurement data
Instead of a checksum, a signature from a certified 1024 bit RSA key pair is used to maintain data
security. Raytest guarantees, that RAW data are not influenced as long as the corresponding
GINA Star 4 User Manual 4.08
Page 54
C ompet ence in N uclear Inst r ument s and B ioImaging
signature is verified by GINA Star.
Contributing to the hash and therefore protected are: Run name, Method name, Start time, Raw data
including trace names, unit names, Instrument name and information about the connected
instruments, their status, serial number and the build number of the GINA Star release..
Imported Data.
Data imported from other instruments (i.g. MiniGITA) need to have a signature and GINA Star
should be enabled to verify this signature. In this case GINA Star will sign the imported data after
conversion. Imported data not containing a signature may be signed after import by help of a user
certificate within the Windows certificate store.
User signing of RAW data
GINA 4 Star will allow to approve data only, if the integrity of the RAW data is proofed. This is
guaranteed for all runs driven by GINA Star 4. Imported data even from 2.18 and 3.00 or earlier do
not have this guarantee. Thy are indicated by the yellow '-' in the symbol (catalog and title bar)
Runs with affected RAW data have a red symbol .
To allow approval of these data, the user may sign RAW data of runs by help of a user certificate in
the windows certificate store. This certificate has to be supplied from the customers side (test
certificates are available from raytest).
Evaluation data
A signature can only be applied, if the measurement data have a signature.
For the evaluation data the signature is not generated automatically but by an indication of the user
that the evaluation process is finished. Due to an option this happens while printing the 'Final report'
or explicitly by the 'Sign' button on the Signatures tab. If a smart card CSP is selected, the smart
card must be present during signing data.
Any operation changing evaluation data and thus destroying the signature need a confirmation. The
signatures becomes invalid, but will not be changed. Thus revoking the changes by any way will re
enable the signature.
Please note this warning: It is possible to use certificates, which private key usage requires
confirmation (PIN, ok- button). Some security environments block the thread system for this wait
time. This situation cannot be predicted by GINA Star and will damage a run underway.
Certified data
A data along with signature will be displayed at their normal places in the report and the
'Information' register. A data and time will only be displayed here, if a time stamp server was
employed to verify the time.
If future releases of GINA Star will take more or other information to calculate the MD5 digest,
GINA Star will calculate digests from old versions version dependent to keep the signatures valid.
GINA Star 4 User Manual 4.08
Page 55
C ompet ence in N uclear Inst r ument s and B ioImaging
For the measurement following data contribute to the digest:
Injection time, run name, instrument name, study name, build number of GINA Star running the
measurement,
For the evaluation following data contribute to the digest:
Injection time, run name, instrument name, study name, build number of GINA Star running the
evaluation,
Signatures by Certificates in the Windows Certificate Store
In addition to the key pair hidden in GINA Star, GINA will employ a user's certificate of the
Windows certificate store to sign data. Every time GINA Star signs evaluation data, it will look for
a certificate selected in GINA Star's setup. If such a certificate containing a private and a public key
pair will exist, GINA Star will use it to generate a second signature by help of the ESP (encryption
service provider). This functionality is available only within Windows 2000 professional or
Windows XP professional.
Hint for the software validation:
Signing must not work without private key. To test this, it is not sufficient to delete the certificate
from the store and import the variant without private key. This is a known property, bug or feature
of the windows cert store, the private key is retained while deleting the certificate. The only way to
delete the key is to export with the option 'Delete private key from store'.
Audit Trails
Audit trails log actions to create documents containing information like 'who did what at which
time'. Some log files belong to a measurement or a measurement method. All others are system
level, they may be opened and viewed from the main menu.
Audit trail viewer
The audit trail viewer grants a view to the system log files. The viewer allows for file update during
view. To use other viewers, please export the data by the copy button and paste it to that editor.
Measurement audit trail
The measurement audit trail contains information about controlling chromatographic parameters.
The content is defined by the method and by possible manual changes during the run. Thus the
information is redundant and not printed in the report by default.
GINA Star 4 User Manual 4.08
Page 56
C ompet ence in N uclear Inst r ument s and B ioImaging
Measurement method audit trail
This trail covers every change on any item of the measurement method including creating and
copying. Thus it may be helpful instrument during method development.
Evaluation audit trail
The evaluation audit trail lists all steps leading to the results. It is part of the measurement file and
will not be printed in the report by default.
Global trails
Global trails contain events not directly associated to a run. These trails are stored in the stations
directory.
Figure 13: Audit trail viewer
User access audit trail
The user access trail logs every controlled access and login / logout processes nevertheless action is
allowed or refused.
Instrument control trail
Instrument control trail contains information about the communication with the connected
instruments like pump, UV-monitor etc. Every command and every response from the instrument is
reported here. Periodic status messages may be filtered to appear only once per 10 occurrences. The
length of this trail is limited to somewhat more than 1 MB, 20 of these trails are retained, normally
enough for 10 to 20 days. To clarify problems, it is helpful to do this within this period.
Critical events trail (Sytem trail)
Beside some framing information ('GINA Star Version xxxx started..') this trail contains
information about exceptions in the software. This information is especially needed, if problem
diagnosis is necessary.
GINA Star 4 User Manual 4.08
Page 57
C ompet ence in N uclear Inst r ument s and B ioImaging
Setup GINA Star
The GINA Star setup contains the installation, license, user preferences and connection information
for the various components.
Contents of GINA Star setup
Setup GINA Star.................................................................................................................................58
Program Installation.......................................................................................................................58
Program Start............................................................................................................................59
Update an existing GINA-DOS or NINA-DOS installation ....................................................59
Compatibility............................................................................................................................59
Warranty notice.........................................................................................................................60
Forms of delivery......................................................................................................................60
Requirements to the system......................................................................................................60
Windows user accounts.............................................................................................................60
Start parameters....................................................................................................................61
Organization of Data.................................................................................................................61
Station (or instrument) name.....................................................................................................62
Setup GINA Star............................................................................................................................62
License......................................................................................................................................62
Serial number.......................................................................................................................63
License number....................................................................................................................63
License addendum................................................................................................................63
License..................................................................................................................................64
Paths..........................................................................................................................................64
Print options..............................................................................................................................65
Dialogs......................................................................................................................................65
Autosampler..............................................................................................................................67
Connect autosamplers...............................................................................................................67
Connections...............................................................................................................................67
Trouble shooting.......................................................................................................................68
Using fraction collector.................................................................................................................68
Setup and connect the fraction collector...................................................................................69
Output signals...........................................................................................................................69
Maintenance status.........................................................................................................................70
GINA - STAR Data Acquisition Box............................................................................................71
Connecting Detectors...........................................................................................................72
Program Installation
The program CD includes an automatic installation routine (’Setup’). It creates or updates the complete
installation “GINA - STAR” on your hard disk. It includes some demonstration files that help you to get a
GINA Star 4 User Manual 4.08
Page 58
C ompet ence in N uclear Inst r ument s and B ioImaging
first impression of the program. Program versions prior to 4.00 are not updated. Instead a second installation
is created. See Compatibility for compatibility with Versions 2.xx and 3.00.
Program Start
After installation, the GINA - STAR icon is displayed on your computers desktop. Click this icon to
start GINA - STAR. GINA Star will appear with the menu and an empty MDI frame.
Figure 1 GINA main menu
Now GINA – Star may be used by either the menu functions by help of the mouse, the standard key
commands or by accelerator keys for a lot of commands.
Update an existing GINA-DOS or NINA-DOS installation
Copy the dos file structure ('c:\gina') to c:\gina_nt. GINA Star will use the setup and all other files except the
license. Ask for a new license and provide the serial number of your GINA Box.
Compatibility
GINA Star 4.0 reads data files from all previous versions of GINA, Ramona. For TLC data, a special version
is available. Because GINA Star 4.0 uses new data formats for most items, there is no backward
compatibility to previous versions of GINA Star. This means, data created or edited by GINA Star 4.0 will
GINA Star 4 User Manual 4.08
Page 59
C ompet ence in N uclear Inst r ument s and B ioImaging
not be readable by GINA 2.18 and GINA 3.00.
The converter for GINA 2.18 methods or 3.00 methods to GINA 4.0 methods is complex. For this reason,
GINA Star 4.0 does not offer these methods directly to start a measurement (single measurement or sample
table). Instead you have to open the method and check whether it is correct after conversion. After saving,
this method is available for new runs.
Warranty notice
The installation of GINA - STAR can be carried out by the supplier or by the customer. Installation
by the customer does not limit the warranty for the complete system and its performance.
Nevertheless, assistance during the installation phase may be charged by raytest, if installation is
not purchased.
Forms of delivery
Installation of the GINA – Star Chromato-Graphic systems is carried out via the setup program 'Setup'. This
is available on a CD as well as from the Internet under www.raytest.de under download / GINA Star. In
some cases this will come along with a configuration for your system. GINA Star will automatically use this,
if the CD remains in the drive until the first start of GINA Star. You may later use the menu 'File / Setup /
Load setup' to read the setup configuration from the CD ‘\station.customer’.
Requirements to the system
•
The program is running under Windows XP professional and Windows 2000 professional. (home
versions as well as Windows 95/98 and Windows NT do not support all features of GINA Star nor
does raytest test on these OSs).
•
The available memory should be the amount advised for the operating system
•
We recommend a monitor resolution of at least 1024 x 678 pixels.
•
The OS must not have support multiple processors enabled. GINA Star recognizes this situation and
will not run. See hyperthreading memorandum for more information.
Windows user accounts
Some setup entities of GINA - STAR depend on the user account to Windows. These are i.g. the selected
printer, saved window properties (size and position) and the location GINA - STAR stores all other setup
properties including your license. If you start windows with a new user account, GINA - STAR while
starting the first time will ask you for the directory for saving the setup. This is 'C:\GINA_NT' by default. If
you select the same directory for every account, GINA - STAR uses the same setup for every user account.
Please ensure, that user accounts do not have different drive mappings.
GINA Star 4 User Manual 4.08
Page 60
C ompet ence in N uclear Inst r ument s and B ioImaging
Start parameters
GINA - STAR accepts one or more data set names as start parameter. This makes it possible to
paste a data set via drag and drop onto the GINA - STAR icon on the desktop. If a GINA Star is
already running, this file is passed to the running GINA Star.
/c
Invokes the configuration only mode of GINA Star. In this mode
GINA Star does not try to connect to any instrument
/ee
With the following files execute an evaluation.
/pr
Print the following files
/on
Open the following files
#n
Station number identifies a setup for one station.
Operation of Several Systems on one PC or one Network drive
You can operate several systems on one computer or one network drive at the same time. To do this
on one computer, copy the start icon on your desktop. Rename the second icon, e.g. ‘GINA_NT
System 2’ using the context menu ‘properties’.
Add the station number i.g. #10 to the destination
”C:\Program Files\Raytest\GINA_NT\GINA_NT.exe” #10
GINA Star started with this icon now has it’s own setup. Please use Setup / Extra / instrument name, to enter
a specific name. This will appear in the title bar, the task bar and in a future list of stations.
Organization of Data
A large number of data sets has to be organized such that data can be easily located, opened and
archived easily. GINA - STAR offers two organization methods which are selected in Setup / Paths.
Setup
c:\gina_nt\station.loc\setup.gina, c:\gina_nt\station.loc\instrument.nam,
c:\gina_nt\station.glb\lRules.rDat
Methods
i.g. c:\gina_nt\method\sample
The method describes the conditions under which the measurement is be
performed. At the same time, the method name is used to create a directory
in which the associated measurement data are stored.
If selected in the paths menu, there is again a subfolder with name of the
station, here are the methods.
Study
i.g. c:\gina_nt\study\method\ sample
GINA Star 4 User Manual 4.08
Page 61
C ompet ence in N uclear Inst r ument s and B ioImaging
If you select this option, you enter a study name for each sample in the
sample table.
Instrument
i.g. c:\gina_nt\study\instrument\method\ sample
The instrument name is a fixed name for each station. From version 4, this is
identical to the station name.
Station (or instrument) name
GINA Star uses one name for the station. This name is reflected in GINA Star's title bar, the task
bar, the title of the instrument's control screen and some other places to identify, which system is
controlled (at least this is useful if you drive more than one station on one computer). If selected,
this name becomes part of the method path and run data path
Setup GINA Star
GINA Star uses an registry entry HEKY_CURRENT_USER/software/raytest/gina_nt/GINALOC to
address the GINA Star setup directory <GINASetup>. This is c:\GINA_NT by default. Within this
directory, a file setup.glb\lRules.rDat contains common setup data for all stations. These are
security rules, user trusties, access rights and certificates. The file
<GINASetup>\station.loc\setup.gina contains all information about one station, connected
instruments, user options etc.
License
Licensing allows to control the use of the software and software options. Licenses are granted by
raytest GmbH, Germany.
GINA Star 4 User Manual 4.08
Page 62
C ompet ence in N uclear Inst r ument s and B ioImaging
Figure 14: License
Serial number
Any license belongs to a serial number. The serial number is read out of the raytest detector or
generated from your computers hardware. Don't expect the serial number of your instrument
reflected here unless the communication is established. In case no serial number is obtained from
the GINA Box, GINA Star generates a fixed number and indicates this by the sentence “Serial
number for evaluation only”, even you may have have other data acquisition sources connected like
MUCHA or Agilent GC 6850 / 6890.
License number
Type the license you got along with the software or your instrument.
License addendum
The license may be customized by some additions. The only customer relevant addition is 'profi'.
This opens some rarely used special functions. These are:
Profi
This includes the run time decay correction (This is less precise than the
post run decay correction), some functions in the Timed control of events
Service
Service functions are for use by raytest. These functions are described in
the GINA Star software service manual.
SynthC
This converts a GINA Star demo software to a SynChrom demo software
Further
Further items may by applied to adopt customer specific needs.
GINA Star 4 User Manual 4.08
Page 63
C ompet ence in N uclear Inst r ument s and B ioImaging
License
This is the result of the license check. Normally it sais 'unlimited', which means it is not restricted to
a special time period i.g. for testing.
Paths
From menu: File / Setup / Paths
See also Organization of data
Here you define how GINA - STAR stores and organizes individual data types.
Methods
Normally, you only enter a period (“.”) to save methods to the work
directory. Paths starting without ‘\’ a relative to the work directory. If you
change this, you have to copy existing methods manually to the new
location. Enter “<user>” to use the windows user specific folder for own
data.
Work directory
Select the path (drive name and subdirectory) to which your data is to be
stored. Normally, this will be the hard disk 'C:\GINA_NT'. Network
identifiers are allowed, i.g. \\comp\drive. Enter “<user>” to use the
windows user specific folder for own data.
Archive
Select the directory in which the data are to be archived. Normally, this
will be a network drive.
Always archive
Advise GINA Star to always keep the archive up to date
File structure with
studies
If this item is checked, the measurement data are stored in the directory
selected in the sample table
Station name
contained in path
If this is checked, the data path contains the instrument name choosen in
the next field
Methods for this
station only
If checked, methods will be maintained in a station specific folder and are
invisible to other stations.
Instruments path
The name of the instrument or station. It appears in GINA Star's title bar
and the task bar. If checked, this name appears in the data path or in the
method path
New file types
This is selected by default, but you may deselect this to generate files
readable by GINA - DOS
GINA Star 4 User Manual 4.08
Page 64
C ompet ence in N uclear Inst r ument s and B ioImaging
Print options
Report header
contains print date
The default configuration 'yes' prints the 'print' data with every report
header line
Display smoothing by The default 'yes' ('no' in GINA <=2.17) uses a less destructive smoothing
Savitzky Golay
algorithm for display and printout smoothing. Please notice: All filters like
algorithm
this generate overshoot and undershoot at signal edges. Especially negative
undershoots at trailing edges (ig. signal from stable 0 to stable 5) will
occur.
Company name
Enter your company name here. The company name will be printed within
the report header.
Left margin in mm
The left margin for all printout
Individual page for
each trace
This option allows to print a new page with the graph of one trace and the
region table of this trace.
List standards in
report
Prints expanded information about standards in every report.
Allow print from
background process
Some printer drivers are not able to print from a background process and
make unpredictable trouble, ig they block the dialog. For this reason, the
feature is disabled by default and needs to be enabled on the users risk.
Print complete audit
trails
This options prints audit trails with methods and runs.
Dialogs
Open File / Setup / Edit setup / User options / Dialog
Use external
standards
If external standardization is licensed, you may switch this off , if it is
temporarily not used.
Number of internal
standards
Because an individual column is needed for each internal standard in the
sample table, it helps to keep this tall, if you configure only those
standards you are using.
Correct for sample
This creates a column with an entry for each sample, if the real weight is
GINA Star 4 User Manual 4.08
Page 65
C ompet ence in N uclear Inst r ument s and B ioImaging
weights
different to the nominal weight.
Calculate with
dilutions
If samples are diluted, the original concentration may be obtained.
Calculate with inj.
volumes
Like above
Clear sample table
entries
This automatically moves entries from the sample table to the logbook.
Design with pictures The instrument control page will use a more realistic view the the Agilent
components, if enabled. Changing this will automatically position the
corresponding items. Call the 'designer' just by typing <F2>. The designer
always sets and positions items corresponding to the instruments in use.
Time format
Select variable to use the format 00'00 (minutes and seconds). Select
minutes for minutes with 2 decimals.
Use spectrum
acquisition
If licensed, you may select this to open the dialogs for spectra handling.
Instrument / Start
method
The name selects the table for the graphical representation of instruments.
At the same time, it selects a start method. The initial conditions from this
start method are used to setup the instruments after starting GINA Star
Edit start method
Additional way to edit the start method.
Emerg method
Method to invoke for emergency situations
Preserve scaling in
saved files
Scaling is always saved in files. This option establishes this scaling after
opening the file.
Peak width to
display limit of
detection
This parameter enables a feature that helps you to estimate the necessary
peak height.
Factor of sigma limit Applies to a special report column and defines the statistical limit between
secure and insecure detected peaks. See Estimate limit for more
information.
Stop instruments at
end of sample table
This option switches HPLC components off after the sample table is
resolved. I.g. UV-lamp, pump flow, scintillator flow.
GINA Star 4 User Manual 4.08
Page 66
C ompet ence in N uclear Inst r ument s and B ioImaging
Autosampler
You may either control your autosampler by two via contacts or by a data interface. The data
interface is specific to the type of the autosampler and allows to control a lot of functions within the
autosampler.
Via contacts means that the start output or the start/stop outputs are connected with the respective
inputs of the computer.
Autosampler
Select the type of your autosampler. If your autosampler is not in the list,
please look at the menu 'extra / control subset' and select all. For details
how to connect autosamplers, please see below.
Loop volume
The capacity of the injection loop
Service
Some service instructions to direct control the autosampler, i.g. 'Move
needle to service position'
Volume of sample The maximum volume to obtain by one draw.
vials
Number of vials
GINA Star will check your entry in the sample table. In addition this entry
helps GINA Star to find the correct representation of the autosamplers vial
plate
Fixed serial
If more than one autosampler is connected to the data interface, you select
number (optional an autosampler by entering the desired serial number. This is only
'profi')
available, if you select the profi user option in the license addendum.
Connect autosamplers
Help is not available for all autosamplers. To see whether help is available for a dedicated
autosampler, in GINA Star open File / Setup / Instruments / Autosampler, select the desired
autosampler, do not confirm with Ok but push 'Help' instead.
Connections
The table shows the status of the connection to the individual instruments to be controlled. You see
all information about the connection:
Output
The port. You select either a com port here or the IP address of the
instrument. Please regard if you enter the IP address of an Agilent module,
the address is copied to all connected modules.
GINA Star 4 User Manual 4.08
Page 67
C ompet ence in N uclear Inst r ument s and B ioImaging
Connection
The way, the instrument is connected. I.g. cable type or connection name
Function
The function of the connected instrument.
Status
If possible, some information obtained from the instrument is reflected
here, i.g. the firmware version. If the connection fails, the message is
displayed here.
Options / firmware
GINA Star reflects information obtained from the instruments firmare.
Serial Number
If possible, the serial number of the connected instrument is reflected here.
Instrument status
The current readyness information of the instrument is reflected here i.g.
'Lamp igniting'
Trouble shooting
Here is a list of trouble already experienced at some places and how this may probably solved.
Error message
“Data behind for
more than n
seconds”
Communication
with Agilent
components
User management:
no access
The data from instruments could not be transferred just in time and are
lost. This may happen if the power management of the computer does not
work properly. Switch off all power management and screen savers to
check for this. Normally GINA Star tells the operating system not to
power down during a run. See also next item 'Communication'.
•
RS-232 Connection is too slow for spectra acquisition
•
Using communication via LAN without a second LAN adapter
may need a switch and not a hub.
The user management cannot be disabled from within GINA Star, a hash is
tracked instead. In case of unrecoverable trouble (I.g forgotten admin
password) delete c:\gina_nt\station.glb\lRules.rDat. GINA Star. GINA
Star will create an entry to the setup audit trail and allow for new settings.
Using fraction collector
The fraction collector is controlled by GINA Star with 3 functions.
Index
Move to next vial
Waste
Switch valve to collect or lead eluent to waste
GINA Star 4 User Manual 4.08
Page 68
C ompet ence in N uclear Inst r ument s and B ioImaging
Home
Move vial tray back to home position
Setup and connect the fraction collector
First open File / Setup / Edit setup / Instruments / Fraction collector and select 'Control by relay'.
Then enter the number of vials available in the fraction collector. In the case you select 1100
Agilent fraction collector, you need not setup valves for connections. Instead the FC is controlled
via the LAN connection.
Figure 15: Enable fraction collector
Output signals
Figure 16: Output connections
The index (Fr. Ind.) signal is always available at a connector labelled 'Index'. In addition you may
lead the signal to the output of your choice. Connect the indicated relais with your fraction
collector.
Now you may use the fraction collector by enabling the control in your methods.
GINA Star 4 User Manual 4.08
Page 69
C ompet ence in N uclear Inst r ument s and B ioImaging
Maintenance status
File / Setup / Edit setup / Maintenance
Icon 'M' (Maintenance, optional)
The maintenance status reflects information about the age of components, which need attention
from time to time or consumables to inform and remember the user about things to do. Agilent
modules have especially a lot of maintenance counters. Not all of them are active. Nor will GINA
Star display all activated counters. Nevertheless will GINA Star generate a message, if such
counters run against the bounds.
This icon is present only if at least one instrument used in the setup does support maintenance.
Unless counter values received, this icon is gray. After receiving values, this icon is either green if
all counters are within the bounds, yellow, if values are near the bound or red, if the bound is
exceeded. In the last case, the corresponding component will not get ready.
Picture 17: Maintenance Status
Name
The name of the counter represents the function
Value
This is the actual counter value. I.g. For the UV-lamp ignition count, the
value is the number of ignitions of the lamp since last replacement. Reset
this value to '0' after replacement of a lamp. You need 'maintenance' rights
to accomplish this.
Unit
The unit of the counter, i.g. L for bottle contents
D (direction)
The direction informs whether the counter grows down (_) or up (^). I.g. A
bottle content grows down while the lamp on time grows up.
Limit
For counters growing up, this is just the limit. Above this limit, this
instrument becomes not ready. For counters growing down, limit is the
maximum start value, i.g. the maximum content of a bottle.
GINA Star 4 User Manual 4.08
Page 70
C ompet ence in N uclear Inst r ument s and B ioImaging
GINA - STAR Data Acquisition Box
The data acquisition box has high resolution and highly stable integration inputs for UV-detectors,
conductibility meters etc, counting inputs for radioactivity measuring systems, a control interface
for analog and frequency controlled pumps and control lines with defined (start, stop, measurement
active, wait for start) and free (relays, aux) specifications. At the start of the GINA - STAR
program, the firmware is loaded into the BOX. This data acquisition box is available as a stand
alone module as well as a part of the RAMONA Star and GABI Star.
Each box or module comes with a serial number written . This serial number is shown in GINA Star
only, if a connection is established. This box has no direct setup.
ANALOG
INPUTS Ch1 to
Ch6
Six precision inputs with automatic null adjustment
Input voltage range: -0.5 V to +4.5 V
Over-voltage protection: 70 Vp-p;
Resolution depending on input voltage:
4 mV to 40 mV: 10 µV
40 mV to 400 mV: 50 µV
-0.5 V to 4.5 V: 150 µV
Dynamic better than 1 : 500 000. The precision of the inputs requires correct
connection of the measurement instruments: Please do not connect “-” signal
and mass at the box side, instead have independent lines for signal “+” and
“-” and one extra line for mass.
Counter inputs
c1..c4
0 – 6 MHz TTL, optional 50 Ohm.
Four relay
contacts
RELAY R1 to R4
STATUS
SIGNALS
Meas strt and stp (Start Stop), TTL inputs (active low). Using a button, these
inputs can be switched to mass to trigger the start or stop function.
STATUS
Input internally set to TTL level with a resistor. It can be used to limit delays
SIGNAL Aux in during measurement.
STATUS
TTL (active low) status outputs indicating that GINA - STAR is waiting for
SIGNALS Meas the start of the measurement or is currently performing a measurement,
wt and act
respectively.
(measurement
GINA Star 4 User Manual 4.08
Page 71
C ompet ence in N uclear Inst r ument s and B ioImaging
wait and active)
STATUS
SIGNAL Aux
out
TTL output; this signal is used for control of waste in a sample collector.
High (2.5-5V) corresponds to ‘Waste’. At ‘Collect’ the signal goes to 0V. To
use a relays contact, use GINA Star Setup / Instruments / Names and
positions / Special outputs do define a relais for the waste output.
STATUS
SIGNAL Frac
Coll
Relay contact for control of a sample collector. This contact is closed for a
period of 1 second when the sample collector should switch to the next vial.
PUMP
CONTROL A,
B, C (optional)
Only available when your system includes a pump control and is not
provided with an interface for your pump.
Frequency control: 50 Ohm outputs, range 0 Hz to 2 MHz, duty cycle 1:1
Voltages: three analog outputs 20 mV to +10 V, accuracy 0.05 % full scale, 20 mV to 1 V, 0.5 % at voltages > 1V
A labeled jumper on the board is used to switch between frequency and
voltage.
PUMP
CONTROL Stp
flw (Stop Flow)
TTL input which turns of all pumps connected to the GINA - STAR BOX
between 3-15 Volt.
Serial
connection
Connects the BOX via a modem cable to the computer.
GINA - STAR supports an adjustment utility. In the Setup switch pump type to 'no pump', In the
menu 'radio detector' in the line 'norm count rate for analog output' type '0', <Enter> which will
work immediate resulting in a should be value of –20mV at A, B and C. Adjust to –20mV by help
of the corresponding 'offset' regulator. Then type ' 10020' and adjust to 10 V by help of the
corresponding 'gain' regulator. The pump boards of the Ramona* have to be adjusted to –6.6 mV
(instead of –20 mV) and to 3.333V (instead of 10V).
Connecting Detectors
Important notice: not regarding this important hint may result in bad and imprecise signals.
Most detectors have internal converters and provide their signals via the control interface. GINA
Star uses these interfaces. To update older installations, you only have to select the appropriate
signals.
Connect the integrator output of the detector with the analog input of the GINA data acquisition
box. Connect the minus output of the detector with the minus input of the box and the plus output of
the detector with the plus input of the box. Important: Connect the ground connection of the
detector with the ground connection of the box. If the detector does not have a ground connection,
GINA Star 4 User Manual 4.08
Page 72
C ompet ence in N uclear Inst r ument s and B ioImaging
connect the minus output of the detector with the ground connection of the box using a separate
cable.
Figure 18 Connection of detector with analog output
On the GINA side, the ground must not be connected with signal-. On the detector side, you may, if
no separate ground connection at the measuring instrument is available, connect the ground cable in
addition to the “-“ output. If you do not observe this connection requirement, this may result in
compensation circuits through one of the symmetrical and twisted conductors and thus to
significant disturbances of the signals! The box measures voltages in the µV range, a cable of
2 m length easily has a resistance of 1 Ohm and the housing voltages can easily amount to
several mA, i.e. exceed the sensitivity of the converters by a factor of 1000.
GINA Star 4 User Manual 4.08
Page 73