1
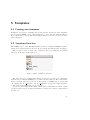
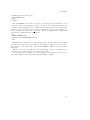
User manual for the program package
WLAN Visual Assistant
FHG 1
08.07.2003
Contents
1 Introduction
1.1 General Notes and Requirements . . . . . . . . . . . . . . . . . . . . . .
1.2 Installation on PC and PDA . . . . . . . . . . . . . . . . . . . . . . . .
2 WLAN-Visualizer
2.1 Creating A New Building . . . . . . . .
2.2 Adding A Floor . . . . . . . . . . . . . .
2.3 Opening And Saving Buildings . . . . .
2.4 Adding Measuring Points and Stations .
2.5 Transferring the Data to the PDA . . .
2.6 Measuring with the PDA . . . . . . . .
2.7 Transferring The Data Back To The PC
2.8 Interpolating . . . . . . . . . . . . . . .
2.9 Export . . . . . . . . . . . . . . . . . . .
2.10 The Property Grid . . . . . . . . . . . .
5
5
6
.
.
.
.
.
.
.
.
.
.
.
.
.
.
.
.
.
.
.
.
.
.
.
.
.
.
.
.
.
.
.
.
.
.
.
.
.
.
.
.
.
.
.
.
.
.
.
.
.
.
.
.
.
.
.
.
.
.
.
.
.
.
.
.
.
.
.
.
.
.
.
.
.
.
.
.
.
.
.
.
.
.
.
.
.
.
.
.
.
.
.
.
.
.
.
.
.
.
.
.
.
.
.
.
.
.
.
.
.
.
.
.
.
.
.
.
.
.
.
.
.
.
.
.
.
.
.
.
.
.
.
.
.
.
.
.
.
.
.
.
7
7
7
8
9
9
10
10
10
10
12
3 MobileWLANAssistant - Measuring with the PDA
3.1 Opening A Building . . . . . . . . . . . . . . . .
3.2 Configure The Look . . . . . . . . . . . . . . . .
3.3 Measuring Quality . . . . . . . . . . . . . . . . .
3.4 Adding, Moving, Removing the Measuring Points
.
.
.
.
.
.
.
.
.
.
.
.
.
.
.
.
.
.
.
.
.
.
.
.
.
.
.
.
.
.
.
.
.
.
.
.
.
.
.
.
.
.
.
.
.
.
.
.
.
.
.
.
15
15
15
15
19
4 Introduction to the Interpolator
4.1 Quality Prediction . . . . .
4.2 Distance averaging . . . . .
4.3 Relevance . . . . . . . . . .
4.4 Image Production . . . . . .
.
.
.
.
.
.
.
.
.
.
.
.
.
.
.
.
.
.
.
.
.
.
.
.
.
.
.
.
.
.
.
.
.
.
.
.
.
.
.
.
.
.
.
.
.
.
.
.
.
.
.
.
21
21
22
22
22
5 Templates
5.1 Creating own templates . . . . . . . . . . . . . . . . . . . . . . . . . . .
5.2 Templates Structure . . . . . . . . . . . . . . . . . . . . . . . . . . . . .
5.3 Example . . . . . . . . . . . . . . . . . . . . . . . . . . . . . . . . . . . .
25
25
25
26
.
.
.
.
.
.
.
.
.
.
.
.
.
.
.
.
.
.
.
.
.
.
.
.
.
.
.
.
.
.
.
.
.
.
.
.
.
.
.
.
.
.
.
.
.
.
.
.
.
.
.
.
.
.
.
.
.
.
.
.
.
.
.
.
.
.
.
.
.
.
.
.
.
.
.
.
.
.
.
.
.
.
.
.
.
.
.
.
3
Contents
4
1 Introduction
1.1 General Notes and Requirements
The WLAN Visual Assistant is a tool for analyzing WLAN-networks, especially designed for buildings. It consists of two programs, the WLAN-Visualizer for a WindowsPC, the second one, the MobileWLANAssistant, for a PDA. The program’s basic idea
is the following: in a building with a number of floors a WLAN-network is to be build
or is already installed. An administrator can now load existing maps of the floors
into the main program and mark different points where he intends to measure the
quality of the network. After the transfer of this data onto the PDA the administrator
will now go to those measuring points and will actually measure the quality of the
WLAN-network. after the measuring, the data is transferred back to the PC. Here an
interpolation can now visualize the measured data. Based upon this visualization, the
administrator can now make decisions about application and the position of WLANaccess-points. The up to now only briefly described procedures will be explained quite
in detail in this handbook.
We start with the requirements in hardware and software which are needed for the
program:
• PC:
– Windows with .NET-framework, at least version 1.1
– Bluetooth-connection and correctly installed drivers
• PDA:
– PocketPC 2002 operating system
– Bluetooth
• Misc:
– Maps of the different floors of the building, needed in JPEG or BMP format.
The best resolution during test was 700 x 560. If you have very big images,
you should first test the functionality of the program with them before you
create larger measuring projects.
– Information about the position of WLAN access points
The logical structure of the program data is quite easy: The almighty basic module
is the whole building, consisting of some floors, one upon the other. The WLANVisualizer expects all the maps of the floors to be in the same scale, and if two points
5
1 Introduction
in different maps have the same coordinates, they should lay in top of each other in
the real world, too. The floor plan should be black on white background. Each floor
itself contains some measuring points, who contain the measured quality values and
other properties.
1.2 Installation on PC and PDA
The installation of both programs is quite easy. For the WLAN-Visualizer, a setup
wizard is delivered with the program. Just start the setup.exe and the wizard will guide
you through the installation process. If you want to uninstall the WLAN-Visualizer,
you can do that in the Windows System Settings simply by clicking on the Remove
Button in the ”Software” part.
For the MobileWLANAssistant it is necessary to transfer the .cab-file to the PDA.
If you don’t know how to do that, see section 2.5. Once you have copied the .cab file
to the PDA, just tip on it in the File Explorer. The installation process will start
immediately. To uninstall the MobileWLANAssistant go to the ”Settings” and then
to ”Remove Programs”, there you can uninstall it.
On the PDA it is also necessary to have the ipaQWLANUtil.dll in the Windows
directory. This dll file is also distributed with the WLAN Visual Assistant. To be sure
it is in the Windows directory, copy it there ( see section 2.5).
6
2 WLAN-Visualizer
After the program is launched, a blank field and an empty property-grid on the right
are on the screen. To do anything useful, it is best to start with
2.1 Creating A New Building
In the ”File”-menu, there is an entry ”New Building”. Go there, or click on the button
in the toolbar with the blank white paper on it. Now the ”New Building”-dialog is
opened.
Figure 2.1: The ”New Building” Dialog
In the first step of this dialog you can specify a suitable name for the building you
want to create. Click ”Next” to specify a filename to store the building into. Be aware
that a subdirectory will be created for the images of the floors. You can set the name
of this subdirectory in the ”Edit” → ”Preferences” dialog. Click ”Finish” to actually
create the building.
2.2 Adding A Floor
If you have created or opened a building, you now are able to add floors to the building.
You now need the images of the floor maps in an appropriate format, i.e. BMP or
JPEG.
7
2 WLAN-Visualizer
Go to the menu entry ”Building” → ”Add Floor” and the ”Add Floor” dialog will
open (2.2). In the upper field you can indicate a unique name for the floor and give the
floor an altitude in meters. This altitude should conform to the relations in the real
building. In the lower field of the dialog you may select a graphics file, that means a
map, that represents the floor. Select the right one and close the dialog with ”Finish”.
Figure 2.2: The ”Add Floor” Dialog
If all went right you should now see the floor map in the main screen and some
additional information in the property grid at the right. The menu ”View” → ”Change
Groundplan ...” allows you to change the image of the floor plan later.
Feel free to add additional floors to your building. With ”View” → ”Floors” you
can select the floor to be shown in the main screen. With the magnifying glasses in
the tool bar you can zoom in and out of the map. Predefined values of the scale can
be reached in the ”View” → ”Scale” menu.
2.3 Opening And Saving Buildings
You can save your newly created building by clicking ”Save” in the ”File” menu or by
clicking the disk-button in the tool bar. Later on you can load it again by clicking on
the folder symbol in the tool bar or by ”Load” in the ”File” menu.
8
2.4 Adding Measuring Points and Stations
2.4 Adding Measuring Points and Stations
For an analysis of the WLAN-network measurements need to be done. It is easy to
mark the points where you want to measure. One way is to choose ”Edit” → ”Add
Point” an then click on the floor surface to place the point. This is quite difficult if
you want to place many measuring points. For this purpose the pen button in the
tool bar is used. Click it to get into draw mode, you can now place a measuring point
with every click on the surface of the floor. For most interpolation algorithms there
are also stations (WLAN access points) needed. You should place them in the main
screen according to their placement in reality. Use the menu point ”Building” → ”Add
Station” or the blue point in the tool bar for this purpose.
Figure 2.3: A sample floor plan with measuring points
2.5 Transferring the Data to the PDA
If you have created a building with all the measuring points you need, you should save it
under an appropriate name. The floor map images are stored seperately in a subfolder
9
2 WLAN-Visualizer
of the directory where the building file is located. In the ”Edit” → ”Preferences”
menu you can change the name for this subfolder, the default is ”groundplan”. Now,
for transferring the data to the PDA, you have to copy the ”.wlan” building file and the
folder with the images. For copying, an established blue tooth connection is required.
Now go to the File Explorer of your Windows operating system, you should be able
to explore part of the file system on the PDA. Just put the needed files (see above)
from the location on your PC to a suitable location on the PDA.
2.6 Measuring with the PDA
See the part of the handbook dealing with the PDA.
2.7 Transferring The Data Back To The PC
It is the same as in point 5 ”Transferring The Data To the PDA”, but the other way
around. Only here it is enough to copy the ”.wlan” file back.
2.8 Interpolating
Before you interpolate, you should set a sensible value for the ”Scale” entry in the
building property grid. See section ”The Property Grid” and the extra documentation
about the interpolator settings. If you have measured all you wanted and transferred
the data back to the PC, open the building file with the measuring data. Then go to
”Interpolation” → ”Start Interpolation”. The interpolation process will take a while,
you may follow the process while it steps through the floors of the building. After the
interpolation has finished, you will see the interpolated map of each floor. The colors
may differ, but the default setting is: green - good quality, red - bad quality. The
darker the color of one point is, the more reliable its interpolation is. If you want to
know the interpolated quality of a special point on the floor plan, just put the mouse
arrow over it. You will see a tool tip that shows the quality of this point. You can
disable this behaviour by deselecting ”View” → ”Interpolated Quality”.
You may now save the building for later use or changes. Note: You may choose
between 4 interpolation methods in the ”Interpolation” → ”Method” menu, which
are: constant, exponentiell, linear and square interpolation. Constant is the only
method which does not need any stations set on the map.
2.9 Export
With the WLAN-Visualizer you are able to export your interpolation results into
HTML code to present it in the internet or intranet. This can be done by simply
clicking ”File” → ”Export. . . ”. A dialog opens, where you can set a destination folder
10
2.9 Export
Figure 2.4: A sample interpolation
11
2 WLAN-Visualizer
for the HTML and image files. After the export has finished, your standard browser
ist automatically opened with the result of the export.
The output of this export can be dramatically changed by the templates. See section
??
2.10 The Property Grid
One central tool to change the behavior of the program is the property grid on the
right side of the screen. It not only shows information about the building, the floor
and the measuring points, you may also change important values here.
Figure 2.5: The property grid
First of all, go to ”View” → ”Building info” in the menu. Now some information
about the building is shown in the property grid, you may change the name of the
building or the scale as well. The scale is the pixel-to-meter factor, you may enter
a value by hand here or do the following: Go to ”Building” → ”Calibrate Scale”,
a dialog box is opened. Now zoom into your map to find an imaginary line in the
building you know the length of. Click on one point of this line, drag the created line
to the endpoint of your imaginary line and click there again. Now enter the length
in meters into the input field in the dialog box and press ”OK”. The program now
calculates an appropriate scale. Quite interesting might be the ”Interpolator” subbox.
Here you can change the interpolation color, method and parameters. See the extra
documentation about the interpolator parameters for details.
12
2.10 The Property Grid
If you have changed the color of the interpolation, you might be unsure which color
stands for what. To help you, a legend is integrated in the program, just choose ”View”
→ ”Show Legend” in the menu.
If you click on the floor map, you will see the floor properties on the right side.
Change what you want. You are also able to hide the interpolation to view only the
map of the floor. If you click a measuring point on the map, the property grid will
show you the measured quality (yes, you can change it) with the measuring date and
an additional note.
13
2 WLAN-Visualizer
14
3 MobileWLANAssistant - Measuring
with the PDA
In this section you will learn how to collect the data the WLAN-Visualizer needs to
do an Interpolation, that means, how to measure the WLAN quality at special points
in your building with the PDA.
3.1 Opening A Building
First of all you need your created building file and the images folder in an appropriate
directory on your PDA (see section ”Transferring the data to the PDA” in the WLANVisualizer chapter). Now start the MobileWLANAssistant. With ”File” → ”Open”
you get into a dialog where you can choose your building file. If all went right, you
now see the floor plan of your first floor, including the measuring points.
3.2 Configure The Look
The ”View” menu has some interesting functions. First you can hide the measuring
points, depending on if they are already measured or not, that can be useful to orientate in the floor plan. Do this by unselecting ”View” → ”Measured Points” or ”View”
→ ”Unmeasured Points”. Select those menu entries again to make the corresponding
points visible. The same applies to the menu entry ”Stations”. By the ”Floor” submenu you can choose the floor that shall be shown in the main screen. If the floor
plan seems to be too big or too small, you can change that with ”View” → ”Zoom”.
If you click there, a dialog opens, where you may choose (in the upper field) or enter
(into the input box below) a zoom factor. Just pick a good one.
3.3 Measuring Quality
This is what the MobileWLANAssistant is all about. Before we actually measure, one
setting is quite useful. Go to ”Options” → ”Number of Single Quality Measurements”.
You now may choose or enter (similar to the ”View” → ”Zoom” dialog) the number
of measurements the WLANAssistant should do to evaluate the quality of one single
point. A higher number means more accuracy but also more time you have to wait for
the result. A good value to enter in this dialog is 15, which is also the default setting.
That means the WLANAssistant will wait for 15 measuring results to evaluate the
WLAN quality of your position, and that will take about 5 to 10 seconds.
15
3 MobileWLANAssistant - Measuring with the PDA
Figure 3.1: The MobileWLANAssistant with the ”View” menu opened
16
3.3 Measuring Quality
Figure 3.2: the measurements dialog
17
3 MobileWLANAssistant - Measuring with the PDA
Now choose one unmeasured point (that are the red ones) on the screen and go to the
position in the real building. You should now stand at the exact position of the red
point in the floor plan with the PDA in your hand. For opening the context menu
of a point, you may tip on it and release the pen on the same position.In the context
menu, choose ”Measure Quality”. Now, if all requirements for a WLAN-measurement
are met (i.e. the WLAN on your PDA is activated), the MobileWLANAssistant will
measure the quality at your position. This will take some seconds, depending on your
settings (see above). When the program has completed the measurement, it will show
the result. Click ”OK”.
Figure 3.3: the context menu of a point
If you don’t trust the result, you may repeat the measurement with the same steps.
If you want to mark the point unmeasured again, you can choose ”Reject Quality” in
the context menu.
If you are content with the measurement, you may continue with the next unmeasured point. Just choose one. If there are only few of them left on the map and you
have difficulties finding them, the function ”Edit” → ”Find An Unmeasured Point”
can help you. It just centers the view onto an unmeasured point.
18
3.4 Adding, Moving, Removing the Measuring Points
3.4 Adding, Moving, Removing the Measuring Points
Sometimes it may happen that you have misplaced some points in the WLAN-Visualizer
or you have placed too many or too less points. For those cases the ”Edit” menu was
designed. If you click on the first entry ”Add Measuring Point” the program will
switch in ”draw mode”, that means clicking on the floor plan will place a point.You
can leave this mode by disabling this menu entry. The same is true for ”Measuring
Points Movable”, select this entry to be able to drag the points over the floor and
disable it to go on with measuring. By clicking ”Remove All Measuring Points” you
may delete all points in this floor. Be careful with this option.
You probably already noticed that you can give each point a note. The last entry
in the ”View” menu helps you to find Points by their note.
19
3 MobileWLANAssistant - Measuring with the PDA
20
4 Introduction to the Interpolator
In this chapter the interpolator and its possible settings will be described. First of
all, you should notice, that the interpolation is a four-step-process. Each step has its
unique settings, all of which together produce a valuable interpolated image.
4.1 Quality Prediction
The first step deals with the prediction of quality from one station and measurement to
every other position. This is done by a prediction function that describes the quality to
be expected depending on the distance from a given station. The application provides
you with four choices of prediction: constant, linear, square and exponential. The
function are shown in the graph below, each adjusted to fit a measuring point with a
Quality of 60% in a distance of 2 meters.
Figure 4.1: The prediction functions
The prediction function can be set both in the properties window and the menu.
The recommended setting is exponential.
21
4 Introduction to the Interpolator
4.2 Distance averaging
As you can easily imagine, different station-measurement-pairs will produce different
predictions for a questioned point. Therefore, the final quality at this point is determined by averaging over these different predictions, depending on the distance of
the measuring point who made them. In this process, a function is needed that will
return the weight of a measurement in this average, depending on its distance. For
this purpose, an exponential function was chosen.
This leaves you with another parameter to set, which is called ”DistanceCoefficient”.
The higher this value, the softer the exponential function will fall, thus causing measurements that are farther away to have an effect on the averaging. The lower the
value, the steeper the function falls, thus only very close measurements have an effect on the questioned point (in extreme, only the closest measurement has an effect,
producing rather funny-looking splits in the image).
A recommended setting in a well-calibrated map is 2.5 (±0.5).
4.3 Relevance
The algorithm so far will generate an interpolated quality for each point. It is easy to
see, that there will be points for which no statement can be made. Therefore, the third
step introduces relevance, calculated for each point, to make this difference visible. In
the properties window, you can set a ”RelevanceDistance”, which states the range,
in meters, around a measurement where relevance will be one. For mere elegancy,
relevance will not fall to zero immediately, but descend slowly, causing a fade-out in
color.
A recommended setting in a well-calibrated map is 4 (±0.5).
4.4 Image Production
After each quality and relevance has been computed, the actual color for the pixel to
be set will be calculated. In this process, a number of settings is used, all of them
rather important for the result.
The first three setting you will notice are Color0, Color050 and Color100. Those
settings specify the colors used for 0%, 50% and 100%. All colors in between emerge
from a linear mixing of the two colors on either side of the value (i.e. 25% will be in
the middle between Color0 and Color050). A recommended setting is the predefined
red-yellow-green color scheme.
A very important value is the ”RelativeResolution”. It defines how fine you want
the interpolation to be. A value of 1 means, that the interpolated image will have
as many pixels as the ground plan. Accordingly, 0.5 means only half the width and
height (thus, only a quarter the pixel count) of the ground plan. With this setting
the performance of interpolation can be heavily improved. A recommendation for this
value is hard to make, since it depends on the size of the ground plan. However, setting
22
4.4 Image Production
the value to 0.5 rather than 1 will speed up interpolation by a factor 4, producing an
image with a negligible loss of information.
The next, rather useful setting is the ”StepWidth”, user in rasterizing the output.
For instance, if you only wish to have 10 different output levels (0%, 10%, 20%,
etc.), chose a value of 0.1 (1/10), thus setting the width of one output level to 10%.
Accordingly, a value of 0.05 will produce 20 levels, each with a width of 5%. A value
of 0 will show the interpolated quality without leveling and is the predefined setting.
A less important setting is the ”InvalidateRange”. It defines how often during
interpolation the image-in-progress will be shown. A value to small will cause a loss
of efficiency, since every drawing takes a little time. A value to high will cause more
efficiency but less fluent images. The recommended setting is 4 (±2).
23
4 Introduction to the Interpolator
24
5 Templates
5.1 Creating own templates
Templates are great for designing user specific layouts. In this case these templates
are used for the HTML export . The users is able to create his own design and layout.
To do this he has to keep in mind some things. Therefore we take a closer look at the
given templates.
5.2 Templates Structure
The HTML export of the WLAN-Visualizer is based on different HTML templates,
which can be defined freely by the user. To success the user has attend some things.
First we take a closer look into the ”templates” directory within the programms
directory. It should look like figure 5.1
Figure 5.1: The ”templates” directory
The ”img” directory contains all the images needed, the ”css” directory contains the
style sheets to format the HTML page. So there are three files left. The ”index.html”
later becomes the start page of the export. For each floor a HTML page is created with
”floor.html” and ”floor menu.txt”. In ”floor menu.txt” you specify a menu structure,
to link between the different floors on each page.
So how the whole thing works? Each of these files contains different tokens , which
are later replaced by the dedicated information. A whole list of these tokens is listed
in table 5.1.
25
5 Templates
Table 5.1: Token Overview
Token name
$HEADTITLE
$CONTENT
$BUILDINGNAME
$FLOORMENU
$COUNT
$AHREF
$FLOORNAME
$YEAR
$FLOORIMAGE
$TITLE
description
the title of the document, appears in the window title
bar of the browser
here all information about the interpolation is placed
the name of the building
here the contents of ”floor menu.txt” are placed
use this token to enable for example rollover images
where to link to, i.e. another floor
use this to place the floor name, use only in
”floor menu.txt”
there the date and time of the export is printed
there the image of the floor is printed
the floor name is printed at this location, it’s nearly
the same like $FLOORNAME, but use this token as
a title, use only in ”floor menu.txt”
5.3 Example
Have look at the following HTML source code:
<html>
<head>
</head>
<body>
Hello World
</body>
</html>
All it does is to print out the text ”Hello World”. Now we want to modifiy this source
code to create a very basic template.
First save this file to a location you wish and call it ”index.html”. Next we want to
insert a clear page title, so insert the following line between <head> and </html>
<title>$HEADTITLE</title>
The export module will replace the $HEADTITLE token with the building name.
Next we insert a two column table, where we want the information and the images to
be placed. Insert between <body> and </body> the following (first you can remove the
”Hello World” text):
<table border="1">
<tr>
26
5.3 Example
<td>Interpolation info</td>
<td>$CONTENT</td>
</tr>
</table>
The $CONTENT token will be replaced by the interpolation information. Now
comes the tricky part. Because the export module does not know how many floors
you have in your building, we need to define the following table rows in a separate file,
which the export module takes for each floor and insert the desired information. So
create a plain text file called ”floor menu.txt” and save it right with the ”index.html”
file. Put the follwing lines into this new file:
<tr>
<td>$FLOORNAME</td>
<td><img src="$FLOORIMAGE"></td>
</tr>
This line means, that the floor name is printed into the left column and the image
into the right. Now we need to modify the ”index.html”, telling the export module to
place the above line in the table. Insert $FLOORMENU right before the </table>
statement.
That’s it. Your export should now look something like 5.2. If not look whether you
have choosen the right templates in the preferences dialog.
To learn more about creating your own templates you can take a closer look into
the given templates, which are installed along with the program.
27
5 Templates
Figure 5.2: Export with example template
28
Index
Symbols
$AHREF . . . . . . . . . . . . . . . . . . . . . .
$BUILDINGNAME . . . . . . . . . . . . .
$CONTENT . . . . . . . . . . . . . . . . . . .
$COUNT . . . . . . . . . . . . . . . . . . . . . .
$FLOORIMAGE . . . . . . . . . . . . . . .
$FLOORMENU . . . . . . . . . . . . . . . .
$FOORNAME . . . . . . . . . . . . . . . . .
$HEADTITLE . . . . . . . . . . . . . . . . .
$TITLE . . . . . . . . . . . . . . . . . . . . . . .
$YEAR . . . . . . . . . . . . . . . . . . . . . . . .
26
26
26
26
26
26
26
26
26
26
B
Building . . . . . . . . . . . . . . . . . . . . . . . . 5
Create . . . . . . . . . . . . . . . . . . . . . . 7
Load
PC . . . . . . . . . . . . . . . . . . . . . . . 8
PDA . . . . . . . . . . . . . . . . . . . . 15
Save
PC . . . . . . . . . . . . . . . . . . . . . . . 8
PDA . . . . . . . . . . . . . . . . . . . . 15
E
Export . . . . . . . . . . . . . . . . . . . . . . . . 10
F
Floor . . . . . . . . . . . . . . . . . . . . . . . . . . . 5
Add . . . . . . . . . . . . . . . . . . . . . . . . 7
Altitude . . . . . . . . . . . . . . . . . . . . 8
Plan . . . . . . . . . . . . . . . . . 5, 10, 15
H
HTML . . . . . . . . . . . . . . . . . . . . . . . . 25
Export . . . . . . . . . . . . . . . . . . . . 25
I
Interpolation . . . . . . . . . . . . . . 9, 10,
Color . . . . . . . . . . . . . . . . . . . 10,
InvalidateRange . . . . . . . . . . . .
Legend . . . . . . . . . . . . . . . . . . . .
Method . . . . . . . . . . . . . . . . . . . .
Prediction . . . . . . . . . . . . . . . . .
Quality . . . . . . . . . . . . . . . . . . . .
RelativeResolution . . . . . . . . . .
StepWidth . . . . . . . . . . . . . . . . .
interpolation
Relevance . . . . . . . . . . . . . . . . . .
21
22
23
12
10
21
10
22
23
22
M
Measuring . . . . . . . . . . . . . . . . . . . . . 15
next unmeasured point . . . . . . 18
Point . . . . . . . . . . . . . . . . . . . . . 6, 9
Add . . . . . . . . . . . . . . . . . . . . . 19
Move . . . . . . . . . . . . . . . . . . . . 19
Remove . . . . . . . . . . . . . . . . . . 19
MobileWLANAssistant . . . . . . . . . . 15
Installation . . . . . . . . . . . . . . . . . . 6
P
Property grid . . . . . . . . . . . . . . . . . 8, 12
Scale . . . . . . . . . . . . . . . . . . . 10, 12
R
Requirements . . . . . . . . . . . . . . . . . . . . 5
S
Scale . . . . . . . . . . . . . . . . . . . . . . . . . . 10
Station . . . . . . . . . . . . . . . . . . . . . . . . . 9
T
Templates . . . . . . . . . . . . . . . . . . . 12, 25
29
Index
Create . . . . . . . . . . . . . . . . . . . . .
Example . . . . . . . . . . . . . . . . . . .
Structure . . . . . . . . . . . . . . . . . .
Token . . . . . . . . . . . . . . . . . . . . . . . . .
Transfer . . . . . . . . . . . . . . . . . . . . . 9,
25
26
25
25
10
W
WLAN-Visualizer . . . . . . . . . . . . . . . . 7
Installation . . . . . . . . . . . . . . . . . . 6
30