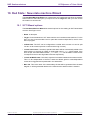
1
LPCXpresso v7 User Guide
Rev. 7.4 — 16 September, 2014
User guide
NXP Semiconductors
LPCXpresso v7 User Guide
16 September, 2014
Copyright © 2013-2014 NXP Semiconductors
All rights reserved.
LPCXpresso v7 User Guide -
User Guide
All information provided in this document is subject to legal disclaimers
Rev. 7.4 — 16 September, 2014
© 2013-2014 NXP Semiconductors. All rights reserved.
1
NXP Semiconductors
LPCXpresso v7 User Guide
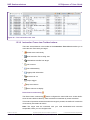
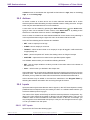
1. Introduction to LPCXpresso .................................................................................. 1
1.1. LPCXpresso IDE Overview of Features ...................................................... 1
1.1.1. Summary of Features ..................................................................... 1
1.1.2. New functionality ............................................................................ 2
1.1.3. Supported debug probes ................................................................ 3
1.2. LPCXpresso Development Boards (original version) .................................... 3
1.3. LPC-Link 2 Debug Probe .......................................................................... 4
1.4. LPCXpresso V2 Boards ............................................................................ 5
1.5. LPC800-MAX Board .................................................................................. 5
2. Installation and Licensing ..................................................................................... 7
2.1. Host Computer Hardware Requirements .................................................... 7
2.2. Installation ................................................................................................ 7
2.2.1. Windows ........................................................................................ 7
2.2.2. Linux ............................................................................................. 8
2.2.3. Mac OS X ................................................................................... 10
2.2.4. Running under virtual machines .................................................... 10
2.3. Licensing Overview ................................................................................. 10
2.3.1. Users of earlier versions of LPCXpresso IDE ................................. 11
2.3.2. Users of Code Red Technologies Red Suite products ..................... 11
2.4. Unregistered (UNREGISTERED) license .................................................. 11
2.5. Activating your product (LPCXpresso Free Edition) ................................... 11
2.6. Activating your product (LPCXpresso Pro Edition) ..................................... 12
2.6.1. Multi-Seat Activations ................................................................... 12
2.7. Further information on installation and licensing ........................................ 12
3. LPCXpresso IDE Overview ................................................................................ 13
3.1. Documentation and Help ......................................................................... 13
3.2. Workspaces ............................................................................................ 13
3.3. Perspectives and Views .......................................................................... 13
3.4. Major components of the Develop Perspective .......................................... 15
4. Importing and Debugging example projects ......................................................... 17
4.1. Software drivers and examples ................................................................ 17
4.2. Importing an Example project .................................................................. 17
4.2.1. Importing Examples for the LPCXpresso812 Development Board..... 19
4.3. Building projects ..................................................................................... 20
4.3.1. Build configurations ...................................................................... 20
4.4. Debugging a project ................................................................................ 21
4.4.1. Debug Emulator Selection Dialog .................................................. 22
4.4.2. Controlling execution .................................................................... 25
5. Creating Projects using the Wizards ................................................................... 27
5.1. Creating a project using the wizard .......................................................... 27
5.1.1. LPCOpen Library Project Selection ................................................ 28
5.1.2. CMSIS-CORE selection ................................................................ 29
5.1.3. CMSIS DSP library selection ......................................................... 30
5.1.4. Peripheral Driver selection ............................................................ 30
5.1.5. Code Read Protect ....................................................................... 30
5.1.6. Enable use of floating point hardware ............................................ 30
5.1.7. Enable use of Romdivide library ..................................................... 31
5.1.8. Disable Watchdog ........................................................................ 31
5.1.9. LPC1102 ISP Pin ......................................................................... 31
5.1.10. Redlib Printf options ................................................................... 31
5.1.11. Project created ........................................................................... 31
6. Memory Editor and User Loadable Flash Driver mechanism ................................. 33
6.1. Introduction ............................................................................................. 33
6.2. Memory Editor ........................................................................................ 33
6.2.1. Editing a memory configuration ..................................................... 34
6.2.2. Restoring a memory configuration ................................................. 37
6.2.3. Copying memory configurations .................................................... 37
LPCXpresso v7 User Guide -
User Guide
All information provided in this document is subject to legal disclaimers
Rev. 7.4 — 16 September, 2014
© 2013-2014 NXP Semiconductors. All rights reserved.
ii
NXP Semiconductors
LPCXpresso v7 User Guide
6.3. User loadable flash drivers ......................................................................
6.4. Importing memory configurations via New Project Wizards .........................
7. Multicore projects ..............................................................................................
8. Red Trace Overview ..........................................................................................
8.1. Serial Wire Viewer ..................................................................................
8.2. Instruction Trace .....................................................................................
9. Red Trace : SWV Views ....................................................................................
10. Red Trace : SWV Configuration ........................................................................
10.1. Starting Red Trace ................................................................................
10.1.1. Target Clock Speed ....................................................................
10.1.2. Sample rate ...............................................................................
10.2. Start Trace ...........................................................................................
38
38
40
41
41
41
42
44
44
44
45
45
10.3. Refresh
........................................................................................... 45
10.4. Settings
........................................................................................... 45
10.5. Reset Trace
..................................................................................... 45
10.6. Save Trace
...................................................................................... 45
11. Red Trace : Profiling ........................................................................................ 46
11.1. Overview .............................................................................................. 46
11.2. Profile view
...................................................................................... 46
12. Red Trace : Interrupt tracing ............................................................................. 48
12.1. Overview .............................................................................................. 48
12.2. Interrupt Statistics view
..................................................................... 48
12.3. Interrupt Trace view
......................................................................... 48
13. Red Trace : Data Watch Trace ......................................................................... 51
13.1. Overview .............................................................................................. 51
LPCXpresso v7 User Guide -
User Guide
13.2. Data Watch view
..............................................................................
13.2.1. Item Display ...............................................................................
13.2.2. Trace Display .............................................................................
14. Red Trace : Host Strings (ITM) .........................................................................
14.1. Overview ..............................................................................................
14.2. Defining Host Strings .............................................................................
14.3. Building the Host Strings macros ...........................................................
14.4. Instrumenting your code ........................................................................
51
53
54
55
55
55
57
57
14.5. Host Strings view
.............................................................................
15. Red Trace : Instruction Trace ...........................................................................
15.1. Getting Started ......................................................................................
15.1.1. Configuring the Cortex-M0+ for Instruction Trace ..........................
15.1.2. Trace the most recently executed instructions ...............................
15.1.3. Stop trace when a variable is set .................................................
15.2. Concepts ..............................................................................................
15.2.1. Instruction Trace Overview ..........................................................
15.2.2. MTB Concepts ...........................................................................
15.2.3. Embedded Trace Macrocell .........................................................
15.2.4. Embedded Trace Buffer ..............................................................
15.2.5. Data Watchpoint and Trace .........................................................
15.3. Reference .............................................................................................
15.3.1. Instruction trace view ..................................................................
15.3.2. Instruction Trace view Toolbar buttons .........................................
15.3.3. Instruction Trace Config view for the MTB ....................................
15.3.4. Instruction Trace Config view for the ETB ....................................
15.3.5. Supported targets .......................................................................
15.4. Troubleshooting ....................................................................................
15.4.1. General ......................................................................................
58
59
59
59
60
61
63
63
63
65
67
69
71
71
72
75
76
78
78
78
All information provided in this document is subject to legal disclaimers
Rev. 7.4 — 16 September, 2014
© 2013-2014 NXP Semiconductors. All rights reserved.
iii
NXP Semiconductors
16.
17.
18.
19.
20.
LPCXpresso v7 User Guide -
User Guide
LPCXpresso v7 User Guide
15.4.2. MTB .......................................................................................... 79
15.4.3. ETB ........................................................................................... 79
Red State Overview ......................................................................................... 80
16.1. The NXP State Configurable Timer ........................................................ 80
16.2. Software State Machine ......................................................................... 80
16.3. Integrating a state machine with your project ........................................... 80
Red State : SCT state machine tutorial ............................................................. 81
17.1. Prerequisites ......................................................................................... 81
17.2. Creating a new project for the SCT ........................................................ 81
17.3. Adding a new SCT state machine to the project ...................................... 81
17.4. The blinky state machine overview ......................................................... 83
17.5. Naming outputs and inputs .................................................................... 83
17.6. Matching the timer ................................................................................ 84
17.7. The states ............................................................................................ 84
17.7.1. Special states ............................................................................. 84
17.7.2. Deleting a state .......................................................................... 84
17.7.3. Adding states ............................................................................. 84
17.8. Adding transitions .................................................................................. 86
17.8.1. Creating a new transition ............................................................ 86
17.8.2. Adding a signal to a transition ..................................................... 87
17.8.3. Adding action elements to transitions ........................................... 88
17.8.4. Turning on LED1 .......................................................................... 89
17.8.5. Turning off LED1 .......................................................................... 90
17.8.6. Remaining transitions ................................................................. 90
17.9. Generating the configuration code .......................................................... 91
17.9.1. Files generated .......................................................................... 91
17.9.2. Issues and warnings ................................................................... 92
17.10. Incorporating with your code ................................................................ 92
Red State : Software state machine tutorial ....................................................... 93
18.1. Software state machine tutorial overview ................................................ 93
18.1.1. Building a traffic light example ..................................................... 93
18.2. Creating a new project .......................................................................... 93
18.2.1. Importing the base project ........................................................... 93
18.3. Extending the LED Traffic base project ................................................... 94
18.3.1. Add the state machine to the project ............................................ 94
18.3.2. Adding states to the State Machine ............................................. 96
18.3.3. Adding inputs ............................................................................. 98
18.3.4. Adding outputs ........................................................................... 99
18.3.5. The Initial State and the Reset signal ........................................... 99
18.3.6. Adding a transition .................................................................... 100
18.3.7. Creating a signal ...................................................................... 101
18.3.8. Adding a signal to a transition ................................................... 102
18.3.9. Adding actions to a transition .................................................... 102
18.3.10. Transition on button press ....................................................... 102
18.4. Integrating a state machine with existing code ....................................... 104
18.4.1. Editing main .............................................................................. 105
18.4.2. Generating the state machine code ............................................ 105
18.4.3. Editing the actions C file ........................................................... 106
18.4.4. Accessing the outputs ............................................................... 107
18.4.5. Setting inputs in interrupt handlers ............................................. 107
18.4.6. Running on the target ............................................................... 108
18.4.7. Other examples ........................................................................ 108
Red State : New state machine Wizard ........................................................... 109
19.1. SCT Wizard options ............................................................................ 109
19.2. Software State Machine Wizard options ................................................ 110
Red State : The state machine editor .............................................................. 112
20.1. Overview ............................................................................................. 112
All information provided in this document is subject to legal disclaimers
Rev. 7.4 — 16 September, 2014
© 2013-2014 NXP Semiconductors. All rights reserved.
iv
NXP Semiconductors
21.
22.
23.
24.
LPCXpresso v7 User Guide -
User Guide
LPCXpresso v7 User Guide
20.2. States .................................................................................................
20.2.1. Creating ...................................................................................
20.2.2. Naming ....................................................................................
20.2.3. Resizing ...................................................................................
20.2.4. Deleting ...................................................................................
20.2.5. Setting initial state ....................................................................
20.3. Transitions ..........................................................................................
20.3.1. Adding transitions .....................................................................
20.3.2. Deleting transitions ...................................................................
20.3.3. Adding signals to a transition .....................................................
20.3.4. Adding actions to a transition ....................................................
20.3.5. Appearance of transitions ..........................................................
20.4. Signals ...............................................................................................
20.5. Actions ...............................................................................................
20.6. Inputs .................................................................................................
20.6.1. SCT inputs ...............................................................................
20.6.2. Software state machine inputs ...................................................
20.7. Outputs ...............................................................................................
20.7.1. SCT outputs .............................................................................
20.7.2. Software state machine outputs .................................................
20.7.3. Preset values ...........................................................................
Red State : Limitations ...................................................................................
Red State : Frequently Asked Questions .........................................................
22.1. How do I migrate from a Red State project created in Red Suite /
LPCXpresso v4 to one created in this version ................................................
Appendix A – File Icons .................................................................................
Appendix B – Glossary of Terms ....................................................................
All information provided in this document is subject to legal disclaimers
Rev. 7.4 — 16 September, 2014
113
113
113
114
114
114
114
114
115
115
115
115
116
117
117
117
118
118
118
119
119
120
121
121
124
125
© 2013-2014 NXP Semiconductors. All rights reserved.
v
NXP Semiconductors
LPCXpresso v7 User Guide
1. Introduction to LPCXpresso
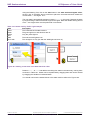
LPCXpresso is a low-cost microcontroller (MCU) development platform ecosystem from
NXP, which provides an end-to-end solution enabling embedded engineers to develop their
applications from initial evaluation to final production.
The LPCXpresso platform ecosystem includes:
• The LPCXpresso IDE, a software development environment for creating applications for
NXP’s ARM based ‘LPC’ range of MCUs.
• The range of LPCXpresso development boards, which each include a built-in ‘LPCLink’ or ‘LPC-Link2’ debug probe. These boards are developed in collaboration with
Embedded Artists.
• The standalone ‘LPC-Link 2’ debug probe.
This guide is intended as an introduction to using LPCXpresso, with particular emphasis
on the LPCXpresso IDE. It assumes that you have some knowledge of MCUs and software
development for embedded systems.
1.1 LPCXpresso IDE Overview of Features
The LPCXpresso IDE is a fully featured software development environment for NXP’s
ARM-based MCUs, and includes all the tools necessary to develop high quality embedded
software applications in a timely and cost effective fashion.
The LPCXpresso IDE is based on the Eclipse IDE and features many ease-of-use and
MCU specific enhancements. The LPCXpresso IDE also includes the industry standard
ARM GNU tools enabling professional quality tools at low cost. The fully featured debugger
supports both SWD and JTAG debugging, and features direct download to on-chip flash.
1.1.1 Summary of Features
• Complete C/C++ integrated development environment
• Latest Eclipse-based IDE with many ease-of-use enhancements
• IDE can be further enhanced with Eclipse plugins
• CVS source control built in; Subversion, TFS, Git, and others available for download
• Command-line tools included for integration into build, test, and manufacturing
systems
• Industry standard GNU toolchain, including
• C and C++ compilers, assembler, and linker
• Converters for SREC, HEX, and binary
• Fully featured debugger supporting JTAG and SWD
• Built-in flash programming
• High-level and instruction-level debug
• Views of CPU registers and on-chip peripherals
LPCXpresso v7 User Guide -
User Guide
All information provided in this document is subject to legal disclaimers
Rev. 7.4 — 16 September, 2014
© 2013-2014 NXP Semiconductors. All rights reserved.
1
NXP Semiconductors
LPCXpresso v7 User Guide
• Support for multiple devices on JTAG scan-chain
• Library support
• Redlib: a small-footprint embedded C library
• Newlib: a complete C and C++ library
• NewlibNano: a new small-footprint C and C++ library, based on Newlib
• LPCOpen MCU software libraries
• Cortex Microcontroller Software Interface Standard (CMSIS) libraries and source code
• Device-specific support for NXP’s ARM-based MCUs (including Cortex-M, ARM7 and
ARM9 based parts)
• Automatic generation of linker scripts for correct placement of code and data into flash
and RAM
• Startup code and device initialization
• No assembler required with Cortex-M based MCUs
• Red Trace [41]
• Instruction trace via Embedded Trace Buffer (ETB) on certain Cortex-M3/M4 based
MCUs or Micro Trace Buffer (MTB) on Cortex-M0+ based MCUs
• Plus when debugging via Red Probe+ on Cortex-M3/M4 based MCUs, Serial Wire
Viewer support providing:
• Profile tracing
• Interrupt trace and display
• Datawatch trace
• Red State [80] state machine designer and code generator
• Graphically design your state machines
• Generates standard C code
• Configures NXP State Configurable Timer (SCT) as well as supporting software state
machines
1.1.2 New functionality
The following changes in functionality have been made in LPCXpresso IDE v7 compared
to the previous release (v6).
• New release of the GNU compilers – v4.8.3.
• Includes new ‘general’ optimization level, -Og. This new optimization level, aims at
providing fast compilation, a superior debugging experience and reasonable runtime
performance.
• Adds Link Time Optimization (LTO), which is sometimes known as Whole Program
Optimization. This allows all the different compilation units that make up a single
executable to be optimized as a single module.
LPCXpresso v7 User Guide -
User Guide
All information provided in this document is subject to legal disclaimers
Rev. 7.4 — 16 September, 2014
© 2013-2014 NXP Semiconductors. All rights reserved.
2
NXP Semiconductors
LPCXpresso v7 User Guide
• Inclusion of a new small-footprint variant of the Newlib C and C++ library, known as
NewlibNano. Use of this library can result in significantly smaller code size, especially
of C++ applications.
• [Note that further details on the use of these new options can be found in the compiler
documentation that is provided in the IDE help system.]
• Note that LPCXpresso IDE v7.3.0 upgrades the GNU Compilers to v4.8.4
• New release of the base Eclipse IDE – Luna (v4.4) and CDT (8.4)
• The Managed Linker script mechanism has been extended to support the features of
new GNU compiler.
For the latest details on new features and functionality, visit http://www.lpcware.com/
content/forum/lpcxpresso-latest-release
1.1.3 Supported debug probes
The following debug probes are supported by LPCXpresso IDE for general debug
connections:
• LPC-Link (LPCXpresso board)
• LPC-Link 2 (with “Redlink” firmware) - either the standalone debug probe or the version
built into LPCXpresso V2 boards
• CMSIS-DAP enabled debug probes, such as LPC800-MAX, Keil ULINK-ME etc.
• Red Probe / Red Probe+
• RDB1768 development board built-in debug connector (RDB-Link)
• RDB4078 development board built-in debug connector
Note that not all Red Trace functionality is supported by all debug probes. For more details
on Red Trace, please see Chapter 8.
Support for GDB server based debug connections is provided. This feature enables support
for 3rd party debug probes, such as Segger J-Link. When debugging with GDB server
connections, some functionality may be disabled.
• For more information on using Segger J-Link with LPCXpresso, visit http://
www.segger.com/nxp-lpcxpresso.html
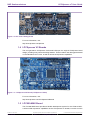
1.2 LPCXpresso Development Boards (original version)
Since first introduced in 2009, the original LPCXpresso family of boards, along with the
associated LPCXpresso IDE, has re-energised the whole MCU evaluation board market.
Developed in collaboration with Embedded Artists, each LPCXpresso board contains a
JTAG/SWD debug probe called “LPC-Link” and a target MCU. LPC-Link is equipped with
a 10-pin JTAG/SWD header and it seamlessly connects the LPCXpresso IDE to the target
MCU via USB (the USB interface and other debug features are provided by NXP?s ARM9
based LPC3154 MCU). The target includes a small prototyping area and easily accessible
connections for expansion. An LED is also fitted as standard, with some board variants
having additional fittings such as an RGB LED, potentiometer or USB device connector.
LPCXpresso v7 User Guide -
User Guide
All information provided in this document is subject to legal disclaimers
Rev. 7.4 — 16 September, 2014
© 2013-2014 NXP Semiconductors. All rights reserved.
3
NXP Semiconductors
LPCXpresso v7 User Guide
An LPCXpresso board with its on-board target MCU can be used either on its own for
software development and benchmarking or connected to an off-the-shelf baseboard, such
as those available from Embedded Artists, for rapid proof-of-concepts.
Figure 1.1. LPCXpresso development board
Cutting the tracks between the LPC-Link and the target will change the LPC-Link into
a standalone JTAG/SWD debug probe. This enables the LPCXpresso platform to be
connected to an external target, which may be an off-the-shelf commercial development
board or a target board of your own design.
For more information, visit:
http://www.lpcware.com/LPCXpressoBoards
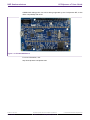
1.3 LPC-Link 2 Debug Probe
The LPC-Link 2 is a new generation of debug probe. It is powered by an NXP LPC4300
series MCU, and includes a standard 10-pin JTAG/SWD connector; a 20-pin JTAG/SWD/
ETM connector; and analog, digital and serial expansion headers, making it a highly
extensible platform. Unlike the original “LPC-Link” it does not contain a target MCU, but is
rather designed to be used with a target mounted on an external board.
The LPCXpresso IDE works out of the box with LPC-Link 2 using “Redlink” firmware. In
addition, several firmware images are available for LPC-Link 2 that make it compatible with
other toolchains, including the popular SEGGER J-Link and the CMSIS-DAP debugger
designed by ARM.
LPCXpresso v7 User Guide -
User Guide
All information provided in this document is subject to legal disclaimers
Rev. 7.4 — 16 September, 2014
© 2013-2014 NXP Semiconductors. All rights reserved.
4
NXP Semiconductors
LPCXpresso v7 User Guide
Figure 1.2. LPC-Link 2 Debug Probe
For more information, visit:
http://www.lpcware.com/lpclink2
1.4 LPCXpresso V2 Boards
The next generation LPCXpresso V2 boards build upon the original LPCXpresso board
design, providing many new and exciting features. These include a new debug probe based
on the standalone LPC-Link2, as well as enhanced expansion capabilities.
Figure 1.3. LPCXpresso V2 Board (LPCXpresso11U68)
For more information, visit:
http://www.lpcware.com/LPCXpressoV2Boards
1.5 LPC800-MAX Board
The LPC800-MAX board provides a flexible development system for the LPC812 MCU.
It offers similar expansion capabilities as the LPCXpresso V2 boards, but with a built-in
LPCXpresso v7 User Guide -
User Guide
All information provided in this document is subject to legal disclaimers
Rev. 7.4 — 16 September, 2014
© 2013-2014 NXP Semiconductors. All rights reserved.
5
NXP Semiconductors
LPCXpresso v7 User Guide
CMSIS-DAP debug probe. As well as being supported by the LPCXpresso IDE, it also
offers compatibility with mbed.
Figure 1.4. LPC800-MAX Board
For more information, visit:
http://www.lpcware.com/lpc800-max
LPCXpresso v7 User Guide -
User Guide
All information provided in this document is subject to legal disclaimers
Rev. 7.4 — 16 September, 2014
© 2013-2014 NXP Semiconductors. All rights reserved.
6
NXP Semiconductors
LPCXpresso v7 User Guide
2. Installation and Licensing
2.1 Host Computer Hardware Requirements
Before installation of the LPCXpresso IDE, you should make sure your development host
computer meets the following requirements:
• A standard x86 PC with 2GB RAM minimum (4GB+ recommended) and 600MB+ of
available disk space, running one of the following operating systems:
• Microsoft® Windows Vista
• Microsoft® Windows 7
• Microsoft® Windows 8 and Windows 8.1
• Linux – Ubuntu 12 and later
• Linux – Fedora 18 and later
• An x86 Apple Macintosh with 2GB RAM minimum (4GB+ recommended) and 600MB+
of available disk space, running one of the following Mac OS X versions:
• 10.8.5 (or later) / 10.9.4 (or later)
Additional host platform notes:
• Starting with LPCXpresso v7.1, and following the discontinuation of support by Microsoft,
Windows XP is no longer an officially supported platform. LPCXpresso may continue to
work on Windows XP but this can no longer be guaranteed. LPCXpresso is no longer
tested on Windows XP.
• Starting with LPCXpresso v7.4, Mac OS X 10.7 (Lion) is no longer an officially supported
platform. LPCXpresso may continue to work on Mac OS X 10.7 but this can no longer
be guaranteed. LPCXpresso is no longer tested on Mac OS X 10.7.
• Both 32-bit and 64-bit Windows / Linux systems are supported.
• The LPCXpresso IDE may install and run on other Linux distributions. However, only the
distributions listed above have been tested. We have no plans to officially support other
distributions at this time.
• A screen resolution of 1024x768 minimum is recommended.
• An internet connection is required to request, install, and activate license keys. When
using the product, an internet connection is required to update the product and to
download new examples.
2.2 Installation
When installing, all components of the LPCXpresso IDE are installed, but some functionality
may be restricted by the currently installed license activation.
2.2.1 Windows
The LPCXpresso IDE is installed into a single directory, of your choice. Unlike many
software packages, the LPCXpresso IDE does not install or use any keys in the Windows
Registry, or use or modify any environment variables (including PATH), resulting in a very
clean installation that does not interfere with anything else on your PC. Should you wish
LPCXpresso v7 User Guide -
User Guide
All information provided in this document is subject to legal disclaimers
Rev. 7.4 — 16 September, 2014
© 2013-2014 NXP Semiconductors. All rights reserved.
7
NXP Semiconductors
LPCXpresso v7 User Guide
to use the command-line tools, a command file is provided to set up the path for the local
command window.
2.2.2 Linux
Due to the huge variation in capabilities of different Linux distributions, LPCXpresso is only
tested and supported on recent distributions of Ubuntu and Fedora. The LPCXpresso IDE
may work on other distributions but we cannot provide support if it does not work.
The installer is supplied as an executable that installs the LPCXpresso IDE components.
The installer requires root privileges, although, once it is installed, no special privileges are
required to run the LPCXpresso IDE. The installer will request a super-user password when
it is started. Once installation has completed, we strongly recommend that your system is
restarted — if you do not do this then some areas of the tools may not function correctly.
The installer should be started from the command line, but will switch to GUI mode once
the super-user password has been entered.
Installation on 32-bit distributions
The LPCXpresso IDE is a 32-bit product that should run on most 32-bit Linux distributions.
On some distributions some additional packages may be required for USB compatibility
(see below for the latest information). Note that GLIBC v2.15 or greater is required.
Enabling the LPCXpresso IDE internal Web Browser
On most recent Linux distributions, an additional package must be installed to enable the
IDE’s internal Web Browser. If this is not installed, any web pages displayed by the IDE will
be displayed in the system default Web Browser.
Ubuntu
Run the following command to install the webkit package that enables the internal Web
Browser:
sudo apt-get install libwebkitgtk-1.0-0
Fedora
Run the following command to install the webkit package that enables the internal Web
Browser:
sudo yum install webkitgtk.i686
Installation on 64-bit distributions
The LPCXpresso IDE is a 32-bit product. For 64-bit versions of Linux, the 32-bit
compatibility components must be installed. Note that all of these components must be
installed, otherwise the installation program will not run and the LPCXpresso IDE will
not function correctly. To install these components from the command line, follow the
instructions below for your distribution.
Ubuntu 13.10 or later:
Ubuntu 13.10 no longer provides a convenient method to install all 32-bit compatible
libraries, so they must all be installed individually. Those that are required for LPCXpresso
7 are as follows:
sudo apt-get install libgtk2.0-0:i386 libxtst6:i386 libpangox-1.0-0:i386 \
libpangoxft-1.0-0:i386 libidn11:i386 libglu1-mesa:i386 \
LPCXpresso v7 User Guide -
User Guide
All information provided in this document is subject to legal disclaimers
Rev. 7.4 — 16 September, 2014
© 2013-2014 NXP Semiconductors. All rights reserved.
8
NXP Semiconductors
LPCXpresso v7 User Guide
libncurses5:i386 libudev1:i386 libusb-1.0:i386 libusb-0.1:i386 \
gtk2-engines-murrine:i386 libnss3-1d:i386 libwebkitgtk-1.0-0
Ubuntu 13.04 or earlier:
Ubuntu 13.04 and earlier provides a convenient method to install 32-bit compatible libraries.
These can be installed using the follow command:
sudo apt-get install linux32 ia32-libs
Fedora
Install the following 32-bit libraries:
sudo yum install gtk2.i686 glibc.i686 glibc-devel.i686 libstdc++.i686 \
zlib-devel.i686 ncurses-devel.i686 libX11-devel.i686 libXrender.i686 \
libXrandr.i686 libusb.i686 libXtst.i686 nss.i686 libcanberra-gtk2.i686 \
PackageKit-gtk3-module.i686 webkitgtk.i686
Other Linux Distros
While not officially supported, the LPCXpresso IDE has been reported to work on many
other Linux Distros, including Linux Mint, openSUSE and Debian. When attempting to run
on these Distros, remember that LPCXpresso is a 32-bit application and so various 32-bit
compatible libraries must be installed. These include:
libgtk2.0-0:i386 libxtst6:i386 libpangox-1.0-0:i386 libpangoxft-1.0-0:i386 \
libidn11:i386 libglu1-mesa:i386 libncurses5:i386 libudev1:i386 \
libusb-1.0:i386 libusb-0.1:i386 gtk2-engines-murrine:i386 \
libnss3:i386
Also note that that the glibc 2.15 shared library is required.
We are unable to provide assistance when installing on other Distros, but the LPCXpresso
forum on http://www.lpcware.com is a good place to search for information or post
questions.
Post-installation issues
dfu-util fails to run
On some Linux systems, when booting LPC-Link or LPC-Link2, the supplied version of dfuutil may fail to execute. To resolve this you may need to install an additional component:
sudo apt-get install libusb-0.1-4:i386 # Ubuntu
This should only be installed on systems where dfu-util fails to run.
Connection Refused error
When starting a debug session, on some Linux systems, a "Connection refused" error
may be displayed. This happens because a critical system library is not installed where
we expect to find it.
To resolve this issue, open a Terminal Window and execute the following commands (if
running a 64-bit version of Linux, you must first install the 32-bit compatibility libraries as
described above):
LPCXpresso v7 User Guide -
User Guide
All information provided in this document is subject to legal disclaimers
Rev. 7.4 — 16 September, 2014
© 2013-2014 NXP Semiconductors. All rights reserved.
9
NXP Semiconductors
LPCXpresso v7 User Guide
Note: The actual location of this library may depend on the distribution and version of Linux
you are running.
Ubuntu
cd /lib/i386-linux-gnu
sudo ln -sf libudev.so.1 libudev.so.0
Fedora
cd /usr/lib/
sudo ln -sf libudev.so.1 libudev.so.0
Ubuntu-specific issues
When using the Unity interface, there may be an issue preventing some menu items
from displaying in the LPCXpresso IDE (this does not affect the ‘Classic’ interface). To
workaround this problem, create a shell script with the following content, and start the
LPCXpresso IDE by running this script:
#!/bin/bash
export UBUNTU_MENUPROXY=0
/usr/local/<lpcxpresso_install_dir>/lpcxpresso/lpcxpresso
Fedora-specific issues
If SELINUX is used, it must be set to “permissive” mode to allow the LPCXpresso IDE to run.
2.2.3 Mac OS X
The LPCXpresso IDE installer is supplied as a Mac OS X .pkg installer file. Double click on
the installer to install the LPCXpresso IDE into a subfolder of your Applications folder.
To start the LPCXpresso IDE, use the Mac OS X Launchpad. Alternatively click the Open
lpcxpresso icon in the /Applications/lpcxpresso_version folder or run lpcxpresso.app,
which can be found in the lpcxpresso subfolder of the main LPCXpresso IDE installation
directory within /Applications.
2.2.4 Running under virtual machines
It is possible to install the LPCXpresso IDE within a virtual machine (VM) environment.
Generally such installations cause few issues. However due to the nature of VMs the most
likely problems relate to sharing of resources (USB, memory), and possible timeouts during
debug operations.
In the unlikely event that you experience issues, we welcome reports but due to the nature
of VM operation can offer no guarantee of resolution.
2.3 Licensing Overview
An LPCXpresso IDE installation will take one of the following three forms:
• Unregistered : the initial product state following a new customer installation, features
are restricted, and code size is restricted to 8KB
• Free Edition : following installation of a Free Edition Activation code, maximum debug
download size is limited to 256KB
LPCXpresso v7 User Guide -
User Guide
All information provided in this document is subject to legal disclaimers
Rev. 7.4 — 16 September, 2014
© 2013-2014 NXP Semiconductors. All rights reserved.
10
NXP Semiconductors
LPCXpresso v7 User Guide
• Pro Edition : following installation of Purchased Pro Edition Activation code, no
restrictions
Note the current installation type can be identified by Help -> Display License Type
2.3.1 Users of earlier versions of LPCXpresso IDE
If you have previously been using LPCXpresso IDE v5.x or earlier, then note that your
previous activation code is not compatible with this version. You will need to go through
the activation process again in order to use this version.
If you have previously been using LPCXpresso IDE v6.x, then your existing activation code
is compatible with LPCXpresso IDE v7.x. There is no need to reactivate.
2.3.2 Users of Code Red Technologies Red Suite products
Red Suite activation codes are not compatible with LPCXpresso IDE. You will need to
obtain an LPCXpresso Free or Pro Edition activation code in order to use LPCXpresso IDE.
2.4 Unregistered (UNREGISTERED) license
Initially after installation LPCXpresso IDE will run with a default Unregistered
(UNREGISTERED) license. Most features of the product may be used, although some
functionality is restricted, including the size of applications that you can build and debug
(limited to 8Kbytes), and Red Trace functionality is disabled. Activate your product with a
Free Edition or Pro Edition license to remove these restrictions.
2.5 Activating your product (LPCXpresso Free Edition)
A Free Edition activation code may be obtained, free of charge, by registering the
LPCXpresso IDE. This provides a license to use the complete development environment
with a 256KB debug download size limit.
Note: You will need to have created an account and logged on to the LPCWare website
to be able to obtain a Free Edition activation code.
To activate your installation with a Free Edition license, from within LPCXpresso IDE:
1. Go to the menu entry Help->Activate->Create Serial number and register (Free
Edition)...
• Your product’s serial number will be displayed
• Write down the serial number, or copy it into the clipboard.
2. Press OK and a web browser will be opened on the Activations page
• If you are already logged in to the website, the serial number will be completed for you.
• If you are not logged in, you will need to login, navigate to http://www.lpcware.com/
lpcxpresso/activate, and enter the product’s serial number.
3. Press the button to Register LPCXpresso
• Your LPCXpresso Activation code will be generated and displayed.
4. Go to the menu entry Help->Activate->Activate (Free Edition)...
5. Enter your activation code and Press OK.
LPCXpresso v7 User Guide -
User Guide
All information provided in this document is subject to legal disclaimers
Rev. 7.4 — 16 September, 2014
© 2013-2014 NXP Semiconductors. All rights reserved.
11
NXP Semiconductors
LPCXpresso v7 User Guide
• This activates your product. The license type will be displayed and you will be able to
use all the features of LPCXpresso, with a debug download limit of 256KB.
2.6 Activating your product (LPCXpresso Pro Edition)
A full, unrestricted activation code for the LPCXpresso IDE can be purchased via the menu
entry Help->Activate->Purchase from LPCXpresso webstore. Once purchased, your
activation code will be emailed to you.
When the activation code is received, follow the instructions below to activate your product.
From within the LPCXpresso IDE:
1. Go to the menu entry Help->Activate->Activate (Pro Edition)...
2. Enter the Pro Edition activation code provided, and press OK
3. Enter your email address and provide a password of your choosing, and press OK.
Your product will now be activated. The license type will be displayed and you will be able
to use all the features of LPCXpresso with no code size limits.
NOTES
1. The password should be kept safe, as it will be required should you wish reactivate your
license (for example to move your license for LPCXpresso Pro Edition from one PC to
another). Your email address will be used to send a reminder should you forget your
password. We may also send occasional emails from which you may unsubscribe.
2. The first use of an activation code will also trigger an email from Softworkz (our licensing
system partners) to the supplied email address. This email is important because it offers
the option to create an account to centrally manage multiple seats of LPCXpresso. See
http://www.lpcware.com/content/faq/lpcxpresso/license-control-panel-email
2.6.1 Multi-Seat Activations
When you purchase LPCXpresso Pro Edition, you can choose to purchase a single or multi
seat license. If you purchase a multi seat license, then you will be provided with a single
activation code that can be used to activate LPCXpresso Pro Edition on multiple machines.
The major benefit of a multi seat activation code over multiple single seat codes is that this
enables a single activation code to be made available to users whilst offering the ability to
monitor and administer usage centrally. This functionality is provided by a feature called the
License Control Panel (LCP). Single seat licenses can be upgraded to multi-seat licenses
by purchasing additional seats.
For additional information please visit:
http://www.lpcware.com/content/faq/lpcxpresso/central-administration-activation-codes
2.7 Further information on installation and licensing
Further information on LPCXpresso IDE installation, licensing and activation codes can be
found in our FAQs at:
http://www.lpcware.com/faq/activation-licensing
LPCXpresso v7 User Guide -
User Guide
All information provided in this document is subject to legal disclaimers
Rev. 7.4 — 16 September, 2014
© 2013-2014 NXP Semiconductors. All rights reserved.
12
NXP Semiconductors
LPCXpresso v7 User Guide
3. LPCXpresso IDE Overview
3.1 Documentation and Help
The LPCXpresso IDE is based on the Eclipse IDE framework, and many of the core features
are described well in generic Eclipse documentation and in the help files to be found on
the LPCXpresso IDE’s Help -> Help Contents menu. This also provides access to the
LPCXpresso User Guide (this document), as well as the documentation for the compiler,
linker, and other underlying tools.
To obtain assistance on using LPCXpresso visit
http://lpcware.com/lpcxpresso/support
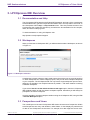
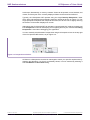
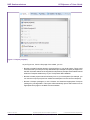
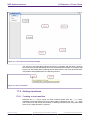
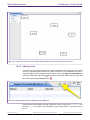
3.2 Workspaces
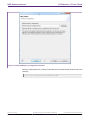
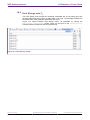
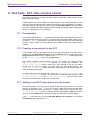
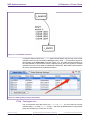
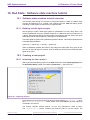
When you first launch LPCXpresso IDE, you will be asked to select a Workspace, as shown
in Figure 3.1.
Figure 3.1. Workspace selection.
A workspace is simply a directory that is used to store the projects you are currently working
on. Each workspace can contain multiple projects, and you can have multiple workspaces
on your computer. The LPCXpresso IDE can only have a single workspace open at a time,
although it is possible to run multiple instances in parallel — with each instance accessing
a different workspace.
If you tick the Use this as the default and do not ask again option, then the LPCXpresso
IDE will always start up with the chosen workspace opened. Otherwise you will always be
prompted to choose a workspace.
It is also possible to change workspace whilst running the LPCXpresso IDE, using the File
-> Switch Workspace option.
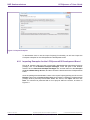
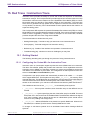
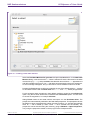
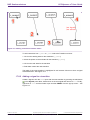
3.3 Perspectives and Views
The overall layout of the main LPCXpresso IDE window is known as a Perspective. Within
each Perspective are many sub-windows, called Views. A View displays a particular set
of data in the LPCXpresso environment. For example, this data might be source code,
LPCXpresso v7 User Guide -
User Guide
All information provided in this document is subject to legal disclaimers
Rev. 7.4 — 16 September, 2014
© 2013-2014 NXP Semiconductors. All rights reserved.
13
NXP Semiconductors
LPCXpresso v7 User Guide
hex dumps, disassembly, or memory contents. Views can be opened, moved, docked, and
closed, and the layout of the currently displayed Views can be saved and restored.
Typically, the LPCXpresso IDE operates using the single Develop Perspective, under
which both code development and debug sessions operate as shown in Figure 3.3. This
single perspective simplifies the Eclipse environment, but at the cost of slightly reducing
the amount of information displayed on screen.
Alternatively the LPCXpresso IDE can operate in a ‘dual perspective’ mode such that the C/
C++ Perspective is used for developing and navigating around your code and the Debug
Perspective is used when debugging your application.
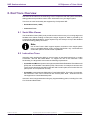
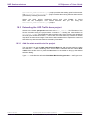
You can manually switch between Perspectives using the Perspective icons in the top right
of the LPCXpresso IDE window, as per Figure 3.2.
Figure 3.2. Perspective selection.
All Views in a Perspective can also be rearranged to match your specific requirements by
dragging and dropping. If a View is accidentally closed, it can be restored by selecting it
from the Window -> Show View dialog.
LPCXpresso v7 User Guide -
User Guide
All information provided in this document is subject to legal disclaimers
Rev. 7.4 — 16 September, 2014
© 2013-2014 NXP Semiconductors. All rights reserved.
14
NXP Semiconductors
LPCXpresso v7 User Guide
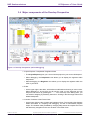
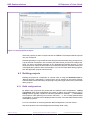
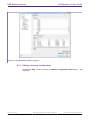
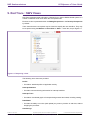
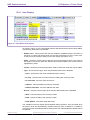
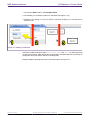
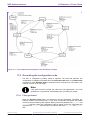
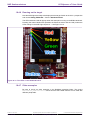
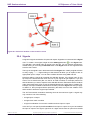
3.4 Major components of the Develop Perspective
Figure 3.3. Develop Perspective (whilst debugging)
1. Project Explorer / Peripherals / Registers Views
• The Project Explorer gives you a view of all the projects in your current ‘Workspace’.
• When debugging, the Peripherals view allows you to display the registers within
Peripherals.
• When debugging, the Registers view allows you to display the registers within the
CPU of your MCU.
2. Editor
• On the upper right is the editor, which allows modification and saving of source code.
When debugging, it is here that you will see the code you are executing and can
step from line to line. By pressing the 'i->' icon at the top of the Debug view, you
can switch to stepping by assembly instruction. Clicking in the left margin will set and
delete breakpoints.
3. Console / Problems / Red Trace Views
• On the lower right are the Console and Problems Views. The Console View displays
status information on compiling and debugging, as well as semihosted program
output. The Problem View (available by changing tabs) shows all compiler errors and
will allow easy navigation to the error location in the Editor View.
LPCXpresso v7 User Guide -
User Guide
All information provided in this document is subject to legal disclaimers
Rev. 7.4 — 16 September, 2014
© 2013-2014 NXP Semiconductors. All rights reserved.
15
NXP Semiconductors
LPCXpresso v7 User Guide
• Located in parallel with the Console View are the various views that make up the
Red Trace functionality of LPCXpresso IDE. The Red Trace views allow you to gather
and display runtime information using the SWV technology that is part of CortexM3/M4 based parts. In addition, for some MCUs, you can also view instruction trace
data downloaded from the MCU’s Embedded Trace Buffer (ETB) or Micro Trace
Buffer (MTB). The example here shows instruction trace information downloaded
from an LPC812’s MTB. For more information on Red Trace functionality, please see
Chapter 8.
4. Quick Start / Variables / Breakpoints / Expressions Views
• On the lower left of the window, the Quickstart Panel has fast links to commonly used
features. This is the best place to go to find options such as Build, Debug, and Import.
• Sitting in parallel to the ‘Quickstart’ view, the Variable view allows you to see the
values of local variables.
• Sitting in parallel to the ‘Quickstart’ view, the Breakpoint view allows you to see and
modify currently set breakpoints.
• Sitting in parallel to the ‘Quickstart’ view, the Expressions view allows you to add
global variables and other expressions so that you can see and modify their values.
5. Debug View
• The Debug view appears when you are debugging your application. This shows
you the stack trace. In the ‘stopped’ state, you can click on any particular function
and inspect its local variables in the Variables tab (which is located parallel to the
Quickstart Panel).
LPCXpresso v7 User Guide -
User Guide
All information provided in this document is subject to legal disclaimers
Rev. 7.4 — 16 September, 2014
© 2013-2014 NXP Semiconductors. All rights reserved.
16
NXP Semiconductors
LPCXpresso v7 User Guide
4. Importing and Debugging example projects
4.1 Software drivers and examples
LPCOpen is now the preferred software platform for most NXP Cortex-M based MCUs,
replacing the various CMSIS / Peripheral Driver Library / code bundle software packages
made available in the past. LPCOpen has been designed to allow you to quickly and easily
utilize an extensive array of software drivers and libraries in order to create and develop
multifunctional products. Amongst the features of LPCOpen are:
• MCU peripheral device drivers with meaningful examples
• Common APIs across device families
• Thoroughly tested and maintained
• Commonly needed third party and open source software ports
• Support for Keil, IAR and LPCXpresso toolchains
The latest LPCOpen v2 now available provides:
• MCU family specific download package
• Support for USB ROM drivers
• Improved code organization and drivers (efficiency, features)
• Improved support for LPCXpresso IDE
CMSIS / Peripheral Driver Library / code bundle software packages are still available,
both within your LPCXpresso IDE install directory \lpcxpresso\Examples\NXP and also
downloadable from NXP LPCware website. But generally these should only be used for
existing development work. When starting a new evaluation or product development, we
would recommend the use of LPCOpen.
More information on LPCOpen together with package downloads can be found at:
http://www.lpcware.com/lpcopen
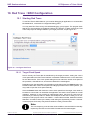
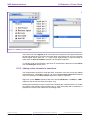
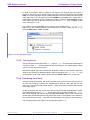
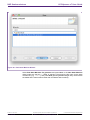
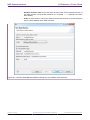
4.2 Importing an Example project
The Quickstart Panel provides rapid access to the most commonly used features of the
LPCXpresso IDE. Using the Quickstart Panel, you can quickly import example projects,
create new projects, build projects and debug projects.
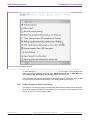
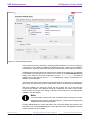
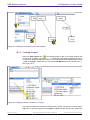
On the Quickstart Panel, click on the ‘Start Here’ sub-panel, and click on Import project(s).
LPCXpresso v7 User Guide -
User Guide
All information provided in this document is subject to legal disclaimers
Rev. 7.4 — 16 September, 2014
© 2013-2014 NXP Semiconductors. All rights reserved.
17
NXP Semiconductors
LPCXpresso v7 User Guide
Figure 4.1. Import project(s)
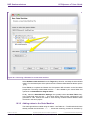
As per Figure 4.2, from the first page of the wizard, you can
• Browse to locate Examples stored in zip archive files on your local system. These could
be archives that you have previously downloaded (for example LPCOpen packages from
the NXP LPCware website or the supplied, but deprecated, sample code bundles located
within the Examples subdirectory of your LPCXpresso IDE installation.
• Browse to locate projects stored in directory form on your local system (for example, you
can use this to import projects from a different workspace into the current workspace).
• Browse LPCOpen packages to visit LPCware and download appropriate LPCOpen
package for your target MCU. This option will automatically open a web browser onto an
appropriate links page on the NXP LPCware website.
LPCXpresso v7 User Guide -
User Guide
All information provided in this document is subject to legal disclaimers
Rev. 7.4 — 16 September, 2014
© 2013-2014 NXP Semiconductors. All rights reserved.
18
NXP Semiconductors
LPCXpresso v7 User Guide
Figure 4.2. Import Examples
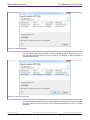
To demonstrate how to use the Import Project(s) functionality, we will now import the
LPCOpen examples for the LPCXpresso812 development board.
4.2.1 Importing Examples for the LPCXpresso812 Development Board
First of all, assuming that you have not previously downloaded the appropriate LPCOpen
package, click on the Browse LPCOpen Packages, which will open a web browser
window. Click on Download LPCOpen Packages link, and then the link to the LPCOpen
v2.xx for LPC8xx family devices, and then choose the download for the LPCXpresso812
board.
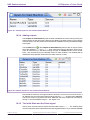
Once the package has downloaded, return to the Import Project(s) dialog and click on the
Browse button next to Project archive (zip) and locate the LPCOpen LPCXpresso812
package archive previously downloaded. Select the archive, click Open and then click
Next. You will then be presented with a list of projects within the archive, as shown in
Figure 4.3.
LPCXpresso v7 User Guide -
User Guide
All information provided in this document is subject to legal disclaimers
Rev. 7.4 — 16 September, 2014
© 2013-2014 NXP Semiconductors. All rights reserved.
19
NXP Semiconductors
LPCXpresso v7 User Guide
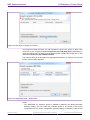
Figure 4.3. Select projects to import
Select the projects you want to import and then click Finish. The examples will be imported
into your workspace.
Note that generally it is a good idea to leave all projects selected when doing an import from
a zip archive file of examples. This is certainly true the first time you import an example set,
when you will not necessarily be aware of any dependencies between projects. In most
cases, an archive of projects will contain one or more library projects, which are used by the
actual application projects within the examples. If you do not import these library projects,
then the application projects will fail to build.
4.3 Building projects
Building the projects in a workspace is a simple case of using the Quickstart Panel to
‘Build all projects’. Alternatively a single project can be selected in the Project Explorer
View and built. Note that building a single project may also trigger a build of any associated
library projects.
4.3.1 Build configurations
By default, each project will be created with two different ‘build configurations’ - Debug
and Release. Each build configuration will contain a distinct set of build options. Thus a
Debug build will typically compile its code with optimizations disabled ( -O0) and Release
will compile its code optimizing for minimum code size ( -Os). The currently selected build
configuration for a project will be displayed after its name in the Quickstart Panel’s Build/
Clean/Debug options.
For more information on switching between Build Configurations, see the FAQ at
http://www.lpcware.com/content/faq/lpcxpresso/change-build-config
LPCXpresso v7 User Guide -
User Guide
All information provided in this document is subject to legal disclaimers
Rev. 7.4 — 16 September, 2014
© 2013-2014 NXP Semiconductors. All rights reserved.
20
NXP Semiconductors
LPCXpresso v7 User Guide
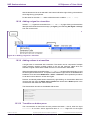
4.4 Debugging a project
This description shows how to run the LPCOpen nxp_lpcxpresso_812_periph_acmp example
application for the LPCXpresso812 development board. The same basic principles will
apply for other examples and boards.
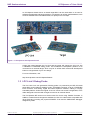
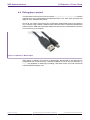
First of all you need to ensure that your LPCXpresso development board is connected to
your computer using a USB 2.0 A/Mini-B cable. Note that some LPCXpresso development
boards have two USB connectors fitted. Make sure that you have connected the one at the
LPC-Link end to your computer.
Figure 4.4. USB 2.0 A / Mini-B cable
When debug is started, the program is automatically downloaded to the target and is
programmed into FLASH memory, a default breakpoint is set on the first instruction in
main(), the application is started (by simulating a processor reset), and code is executed
until the default breakpoint is hit.
LPCXpresso v7 User Guide -
User Guide
All information provided in this document is subject to legal disclaimers
Rev. 7.4 — 16 September, 2014
© 2013-2014 NXP Semiconductors. All rights reserved.
21
NXP Semiconductors
LPCXpresso v7 User Guide
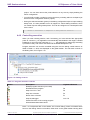
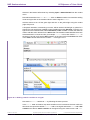
Figure 4.5. Launch debug session
To start debugging nxp_lpcxpresso_812_periph_acmp on your target, simply highlight the
project in the Project Explorer and then in the Quickstart Panel click on Start Here and
select Debug 'nxp_lpcxpresso_812_periph_acmp', as in Figure 4.5.
The LPCxpresso IDE will first build and then start debugging the application. Click on OK
to continue with the download and debug of the ‘Debug’ build of your project.
4.4.1 Debug Emulator Selection Dialog
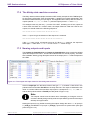
The first time you debug a project, the Debug Emulator Selection Dialog will be displayed,
showing all supported probes that are attached to your computer. In this example, a Red
Probe+ and an LPC-Link have been found:
LPCXpresso v7 User Guide -
User Guide
All information provided in this document is subject to legal disclaimers
Rev. 7.4 — 16 September, 2014
© 2013-2014 NXP Semiconductors. All rights reserved.
22
NXP Semiconductors
LPCXpresso v7 User Guide
Figure 4.6. Attached probes
You now need to select the probe that you wish to debug through. In Figure 4.7 the LPCLink has been selected, which is what we would do, for example, in order to debug an
LPCXpresso812 board.
Figure 4.7. LPC-Link selected
For any future debug sessions, the stored probe selection will be automatically used, unless
the probe cannot be found. In Figure 4.8 the previously selected LPC-Link is no longer
connected.
LPCXpresso v7 User Guide -
User Guide
All information provided in this document is subject to legal disclaimers
Rev. 7.4 — 16 September, 2014
© 2013-2014 NXP Semiconductors. All rights reserved.
23
NXP Semiconductors
LPCXpresso v7 User Guide
Figure 4.8. LPC-Link no longer connected
This might have been because you had forgotten to connect the probe, in which case
connect it to your computer and select Search for LPC-Link (HID) again. Alternatively, it
might be because you now wish to use a different probe to debug this project with. In this
case select Search for any enabled emulator.
The tools will then go off and search for appropriate emulators. In Figure 4.9 only a Red
Probe+ has now been detected.
Figure 4.9. Attached probes – Red Probe+
Notes:
• The “Remember my selection” option is enabled by default in the Debug Emulator
Selection Dialog, and will cause the selected probe to be stored in the launch
configuration for the current configuration (typically Debug or Release) of the current
LPCXpresso v7 User Guide -
User Guide
All information provided in this document is subject to legal disclaimers
Rev. 7.4 — 16 September, 2014
© 2013-2014 NXP Semiconductors. All rights reserved.
24
NXP Semiconductors
LPCXpresso v7 User Guide
project. You can thus remove the probe selection at any time by simply deleting the
launch configuration.
• You will need to select a probe for each project that you debug within a workspace (as
well as for each configuration within a project).
• Storing the selected emulator (probe) in the debug configuration helps to improve debug
startup time, It is also possible to turn off support for various debug emulators, which
can further improve debug startup times. This can be configured on a workspace basis
via the menu
Window -> Preferences -> LPCXpresso -> Debug Emulator Selection
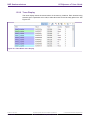
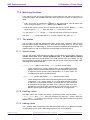
4.4.2 Controlling execution
When you start a debug session, and if necessary you have selected the appropriate
probe to connect to, your application is automatically downloaded to the target, a default
breakpoint is set on the first instruction in main(), the application is started (by simulating
a processor reset), and code is executed until the default breakpoint is hit.
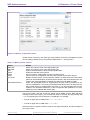
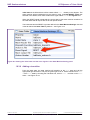
Program execution can now be controlled using the common debug control buttons, as
listed in Table 4.1, which are displayed on the global toolbar. The call stack is shown in
the Debug View, as in Figure 4.10.
Figure 4.10. Debug Controls
Table 4.1. Program execution controls
Button
Description
Restart program execution (from reset)
Keyboard Shortcut
Run/Resume the program.
F8
Step Over C/C++ line.
F6
Step into a function.
F5
Return from a function
F7
Stop the debugger.
Ctrl + F2
Pause Execution of the running program.
Show disassembled instructions.
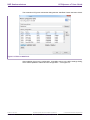
Note – In LPCXpresso IDE v4 and earlier, the common debug control commands were
found on the Debug View’s local toolbar, rather than on the global toolbar. Moving them
LPCXpresso v7 User Guide -
User Guide
All information provided in this document is subject to legal disclaimers
Rev. 7.4 — 16 September, 2014
© 2013-2014 NXP Semiconductors. All rights reserved.
25
NXP Semiconductors
LPCXpresso v7 User Guide
to the global toolbar allows the Debug View to be minimized when not needed – allowing
more space on screen for other views to be displayed. You can choose to display the debug
controls in the Debug View by selecting the “Show Debug Toolbar” option in the Debug
View’s “View Menu” (the downward-facing triangle on the top right of the view).
Setting a breakpoint
To set a breakpoint, simply double-click on the margin area of the line you wish to set a
breakpoint on (before the line number).
Restart application
If you hit a breakpoint or pause execution and want to restart execution of the application
from the beginning again, you can do this using the Restart button.
Stopping debugging
To stop debugging just press the Stop button.
If you are debugging using the Debug Perspective, then to switch back to C/C++
Perspective when you stop your debug session, just click on the C/C++ tab in the upper
right area of the LPCXpresso IDE (as shown in Figure 3.2).
LPCXpresso v7 User Guide -
User Guide
All information provided in this document is subject to legal disclaimers
Rev. 7.4 — 16 September, 2014
© 2013-2014 NXP Semiconductors. All rights reserved.
26
NXP Semiconductors
LPCXpresso v7 User Guide
5. Creating Projects using the Wizards
The LPCXpresso IDE includes many project templates to allow the rapid creation of
correctly configured projects for specific MCUs.
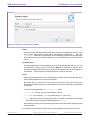
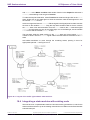
5.1 Creating a project using the wizard
Click on the New project... option in the Start here tab of the Quickstart Panel to open
up the Project Creation Wizard. Now select the MCU family for which you wish to create a
new project. Note that in some cases a number of families of MCUs are grouped together
at a top level – just open up the appropriate “expander” to get to the specific part family
that you require. For example, in Figure 5.1 the top level group " LPC11 / LPC12" is used
to hold all LPC11 and LPC12 part families.
Figure 5.1. New Project: wizard selection
You can now select the type of project that you wish to create.
Most MCU families provide wizards for two forms of projects – LPCOpen and nonLPCOpen. For more details on LPCOpen, see Software drivers and examples [17] . For
both forms of projects, the main wizards available are:
C Project
• Creates a simple C project, with the main() routine consisting of an infinite while(1) loop
that increments a counter.
LPCXpresso v7 User Guide -
User Guide
All information provided in this document is subject to legal disclaimers
Rev. 7.4 — 16 September, 2014
© 2013-2014 NXP Semiconductors. All rights reserved.
27
NXP Semiconductors
LPCXpresso v7 User Guide
• For LPCOpen projects, code will also be included to initialize the board and enable an
LED.
C++ Project
• Creates a simple C++ project, with the
loop that increments a counter.
main()
routine consisting of an infinite
while(1)
• For LPCOpen projects, code will also be included to initialize the board and enable an
LED.
C Static Library Project
• Creates a simple static library project, containing a source directory, and optionally a
directory to contain include files. The project will also contain a “liblinks.xml” file, which
can be used by the smart update wizard on the context sensitive menu to create links
from application projects to this library project. For more details, please see the FAQ at
http://www.lpcware.com/content/faq/lpcxpresso/creating-linking-library-projects
C++ Static Library Project
• Creates a simple (C++) static library project, like that produced by the C Static Library
Project wizard, but with the tools set up to build C++ rather than C code.
The non-LPCOpen wizards also include a further wizard:
Semihosting C Project
• Creates a simple “Hello World” project, with the main() routine containing a printf() call,
which will cause the text to be displayed within the Console View of the LPCXpresso
IDE. This is implemented using “semihosting” functionality. For more details, please see
the FAQ at
http://www.lpcware.com/content/faq/lpcxpresso/using-printf
Once you have selected the appropriate project wizard, you will be able to enter the name
of your new project.
Then you will need to select the actual MCU that you will be targeting for this project. It
is important to ensure that the MCU you select matches the MCU that you will be running
your application on. This makes sure that appropriate compiler and linker options are used
for the build, as well as correctly setting up the debug connection.
Finally you will be presented with one or more “Options” pages that provide the ability to set
a number of project-specific options. The options presented will depend upon which MCU
you are targeting and the specific wizard that you selected, and may also change between
versions of the LPCXpresso IDE. Note that if you have any doubts over any of the options,
then we would normally recommend leaving them set to their default values.
The following sections detail some of the options that you may see when running through
a wizard.
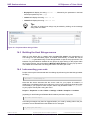
5.1.1 LPCOpen Library Project Selection
When creating an LPCOpen based project, the first option page that you will see is the
LPCOpen library selection page.
LPCXpresso v7 User Guide -
User Guide
All information provided in this document is subject to legal disclaimers
Rev. 7.4 — 16 September, 2014
© 2013-2014 NXP Semiconductors. All rights reserved.
28
NXP Semiconductors
LPCXpresso v7 User Guide
Figure 5.2. LPCOpen library selection
This page allows you to run the ‘Import wizard’ to download the LPCOpen bundle for your
target MCU/board from the NXP LPCware website and import it into your workspace, if you
have not already done so.
You will then need to select the LPCOpen Chip library for your MCU using the workspace
browser (and for some MCU’s an appropriate value will also be available from the drop
down next to the Browse button). Note that the wizard will not allow you to continue until
you have selected a library project that exists within the workspace.
Finally, you can optionally select the LPCOpen Board library for the board that your MCU
is fitted to using the workspace browser (and again in some cases, an appropriate value
may also be available from the drop down next to the Browse button). Although selection
of a board library is optional, it is recommended that you do this in most cases.
5.1.2 CMSIS-CORE selection
For backwards compatibility reasons, the non-LPCOpen wizards for many parts provide the
ability to link a new project with a CMSIS-CORE library project. The CMSIS-CORE portion
of ARM’s Cortex Microcontroller Software Interface Standard (or CMSIS) provides a
defined way of accessing MCU peripheral registers, as well as code for initializing an MCU
and accessing various aspects of functionality of the Cortex CPU itself. The LPCXpresso
IDE typically provides support for CMSIS through the provision of CMSIS library projects.
CMSIS-CORE library projects can be found in the Examples directory of your LPCXpresso
IDE installation.
LPCXpresso v7 User Guide -
User Guide
All information provided in this document is subject to legal disclaimers
Rev. 7.4 — 16 September, 2014
© 2013-2014 NXP Semiconductors. All rights reserved.
29
NXP Semiconductors
LPCXpresso v7 User Guide
Generally, if you wish to use CMSIS-CORE library projects, you should use
CMSIS_CORE_<partfamily> (which use components from ARM’s CMSIS v3.20 specification).
LPCXpresso IDE does in some cases provide libraries based on early versions of the
CMSIS specification with names such as CMSISv1p30_<partfamily>, but these are not
recommended for use in new projects.
The CMSIS library option within the LPCXpresso IDE allows you to select which (if any)
CMSIS-CORE library you want to link to from the project that you are creating. Note that
you will need to import the appropriate CMSIS-CORE library project into the workspace
before the wizard will allow you to continue.
For more information on CMSIS and its support in the LPCXpresso IDE, please see the
FAQ at
http://www.lpcware.com/content/faq/lpcxpresso/cmsis-support .
Note - the use of LPCOpen instead of CMSIS-CORE library projects is recommended in
most cases for new projects. (In fact LPCOpen actually builds on top of many aspects of
CMSIS-CORE.) For more details see Software drivers and examples [17]
5.1.3 CMSIS DSP library selection
ARM’s Cortex Microcontroller Software Interface Standard (or CMSIS) specification
also provides a definition and implementation of a DSP library. The LPCXpresso IDE
provides prebuilt library projects for the CMSIS DSP library for Cortex-M0/M0+, Cortex-M3
and Cortex-M4 parts, though a source version of it is also provided within the LPCXpresso
IDE Examples.
Note - The CMSIS DSP library can be used with both LPCOpen and non-LPCOpen
projects.
5.1.4 Peripheral Driver selection
For some parts, one or more peripheral driver library projects may be available for the
target MCU from within the Examples area of your LPCXpresso IDE installation. The
non-LPCOpen wizards allow you to create appropriate links to such library projects when
creating a new project. You will need to ensure that you have imported such libraries from
the Examples before selecting them in the wizard.
Note - the use of LPCOpen rather than these peripheral driver projects is recommended
in most cases for new projects.
5.1.5 Code Read Protect
NXP’s Cortex and ARM7 based MCUs provide a “Code Read Protect” (CRP) mechanism
to prevent certain types of access to internal flash memory by external tools when a
specific memory location in the internal flash contains a specific value. The LPCXpresso
IDE provides support for setting this memory location. For more details see the FAQ at
http://www.lpcware.com/content/faq/lpcxpresso/code-read-protect-crp .
5.1.6 Enable use of floating point hardware
Certain MCUs may include a hardware floating point unit (for example NXP LPC32xx,
LPC407x_8x and LPC43xx parts). This option will set appropriate build options so that code
is built to use the hardware floating point unit and will also cause startup code to enable
the unit to be included.
LPCXpresso v7 User Guide -
User Guide
All information provided in this document is subject to legal disclaimers
Rev. 7.4 — 16 September, 2014
© 2013-2014 NXP Semiconductors. All rights reserved.
30
NXP Semiconductors
LPCXpresso v7 User Guide
5.1.7 Enable use of Romdivide library
Certain NXP Cortex-M0 based MCUs, such as LPC11Axx, LPC11Exx, LPC11Uxx and
LPC12xx, include optimized code in ROM to carry out divide operations. This option
enables the use of these Romdivide library functions. For more details see the FAQ at
http://www.lpcware.com/content/faq/lpcxpresso/rom-divide .
5.1.8 Disable Watchdog
Unlike most MCUs, NXP’s LPC12xx MCUs enable the watchdog timer by default at reset.
This option disables this default behavior. For more details, please see the FAQ at
http://www.lpcware.com/content/faq/lpcxpresso/lpc12-watchdog .
5.1.9 LPC1102 ISP Pin
The provision of a pin to trigger entry to NXP’s ISP bootloader at reset is not hardwired on
the LPC1102, unlike other NXP MCUs. This option allows the generation of default code for
providing an ISP pin. For more information, please see NXP’s application note, AN11015,
“Adding ISP to LPC1102 systems”.
5.1.10 Redlib Printf options
The “Semihosting C Project” wizard for some parts provides two options for configuring the
implementation of printf family functions that will get pulled in from the Redlib C library:
• Use non-floating-point version of printf
• If your application does not pass floating point numbers to printf() family functions,
you can select a non-floating-point variant of printf. This will help to reduce the code
size of your application.
• For MCUs where the wizard does not provide this option, you can cause the same
effect by adding the symbol CR_INTEGER_PRINTF to the project properties.
• Use character- rather than string-based printf
• By default printf() and puts() make use of malloc() to provide a temporary buffer on
the heap in order to generate the string to be displayed. Enable this option to switch
to using “character-by-character” versions of these functions (which do not require
additional heap space). This can be useful, for example, if you are retargeting printf()
to write out over a UART – since in this case it is pointless creating a temporary buffer
to store the whole string, only to then print it out over the UART one character at a time.
• For MCUs where the wizard does not provide this option, you can cause the same
effect by adding the symbol CR_PRINTF_CHAR to the project properties.
Note that if you only require the display of fixed strings, then using
printf() will noticeably reduce the code size of your application.
puts()
rather than
5.1.11 Project created
Having selected the appropriate options, you can then click on the Finish button, and the
wizard will create your project for you, together with appropriate startup code and a simple
main.c file. Build options for the project will be configured appropriately for the MCU that
you selected in the project wizard.
LPCXpresso v7 User Guide -
User Guide
All information provided in this document is subject to legal disclaimers
Rev. 7.4 — 16 September, 2014
© 2013-2014 NXP Semiconductors. All rights reserved.
31
NXP Semiconductors
LPCXpresso v7 User Guide
You should then be able to build and debug your project, as described in Section 4.3 and
Section 4.4.
LPCXpresso v7 User Guide -
User Guide
All information provided in this document is subject to legal disclaimers
Rev. 7.4 — 16 September, 2014
© 2013-2014 NXP Semiconductors. All rights reserved.
32
NXP Semiconductors
LPCXpresso v7 User Guide
6. Memory Editor and User Loadable Flash Driver
mechanism
6.1 Introduction
By default, the LPCXpresso IDE provides a standard memory layout for known MCUs.
This works well for parts with internal flash and no external memory capability, as it allows
linker scripts to be automatically generated for use when building projects, and gives builtin support for programming flash as well as other debug capabilities.
In addition, the LPCXpresso IDE supports the editing of the target memory layout used
for a project. This allows for the details of external flash to be defined or for the layout of
internal RAM to be reconfigured. In addition, it allows a flash driver to be allocated for use
with parts with no internal flash, but where an external flash part is connected.
6.2 Memory Editor
The Memory Editor is accessed via the MCU settings dialog, which can be found at:
Project Properties -> C/C++ Build -> MCU settings
This lists the memory details for the selected MCU, and will, by default, display the memory
regions that have been defined by the LPCXpresso IDE itself.
LPCXpresso v7 User Guide -
User Guide
All information provided in this document is subject to legal disclaimers
Rev. 7.4 — 16 September, 2014
© 2013-2014 NXP Semiconductors. All rights reserved.
33
NXP Semiconductors
LPCXpresso v7 User Guide
Figure 6.1. LPC1850 default memory regions
6.2.1 Editing a memory configuration
Selecting the Edit... button will launch the Memory configuration editor dialog — see
Figure 6.2.
LPCXpresso v7 User Guide -
User Guide
All information provided in this document is subject to legal disclaimers
Rev. 7.4 — 16 September, 2014
© 2013-2014 NXP Semiconductors. All rights reserved.
34
NXP Semiconductors
LPCXpresso v7 User Guide
Figure 6.2. Memory configuration editor
Known blocks of memory, with their type, base location, and size are displayed. Entries
can be created, deleted, etc by using the provided buttons — see Figure 6.2
Table 6.1. Memory editor controls
Button
Add Flash
Add RAM
Split
Delete
Export
Import
Up / Down
Browse(Flash driver)
Details
Add a new memory block of the appropriate type.
Add a new memory block of the appropriate type.
Split the selected memory block into two equal halves.
Delete the selected memory block.
Export a memory configuration for use in another project.
Import a memory configuration that has been exported from another project.
Reorder memory blocks. This is important: if there is no flash block, then code will be
placed in the first RAM block, and data will be placed in the block following the one
used for the code (regardless of whether the code block was RAM or Flash).
Select the appropriate driver for programming the flash memory specified in the
memory configuration. This is only required when the flash memory is external to the
MCU. Flash drivers for external flash must have a “.cfx” file extension and must be
located in the \bin\flash subdirectory of the LPCXpresso IDE installation. For more
details see User loadable flash drivers [38] .
The name, location, and size of this new region can be edited in place. Note that when
entering the size of the region, you can enter full values in decimal, hex (by prefixing with
0x), or by specifying the size in kilobytes or megabytes. For example:
• To enter a region size of 32KB, enter 32768, 0x8000 or 32k.
• To enter a region size of 1MB, enter 0x100000 or 1m.
Note that memory regions must be located on four-byte boundaries, and be a multiple of
four bytes in size.
LPCXpresso v7 User Guide -
User Guide
All information provided in this document is subject to legal disclaimers
Rev. 7.4 — 16 September, 2014
© 2013-2014 NXP Semiconductors. All rights reserved.
35
NXP Semiconductors
LPCXpresso v7 User Guide
The screenshot in Figure 6.3 shows the dialog after the “Add Flash” button has been clicked.
Figure 6.3. Effect of Add Flash
After updating the memory configuration, click OK to return to the MCU settings dialog,
which will be updated to reflect the new configuration — see Figure 6.4.
LPCXpresso v7 User Guide -
User Guide
All information provided in this document is subject to legal disclaimers
Rev. 7.4 — 16 September, 2014
© 2013-2014 NXP Semiconductors. All rights reserved.
36
NXP Semiconductors
LPCXpresso v7 User Guide
Figure 6.4. Updated MCU Settings
Note that once the memory details have been modified, the selected MCU as displayed on
the LPCXpressoIDE “Status Bar” (at the bottom of the IDE window) will be displayed with
an asterisk (*) next to it. This provides an indication that the MCU memory configuration
settings for the selected project have been modified, without needing to open the MCU
settings dialog.
6.2.2 Restoring a memory configuration
To restore the memory configuration of a project back to the default settings, simply reselect
the MCU type, or use the “Restore Defaults” button, on the MCU Settings properties page.
6.2.3 Copying memory configurations
Memory configurations can be exported for import into another project. Use the Export and
Import buttons for this purpose.
LPCXpresso v7 User Guide -
User Guide
All information provided in this document is subject to legal disclaimers
Rev. 7.4 — 16 September, 2014
© 2013-2014 NXP Semiconductors. All rights reserved.
37
NXP Semiconductors
LPCXpresso v7 User Guide
6.3 User loadable flash drivers
Flash drivers for external flash must have a .cfx file extension and must be located in the
/bin/Flash subdirectory of the LPCXpresso IDE installation.
For example:
• The SST39VF3201x_Hitex_LPC1850A_4350A.cfx driver is for use in programming the
external 4MB parallel flash fitted to the Hitex LP1850A/LPC4350A evaluation board
(either a SST39VF3201 or SST39VF3201B device). This memory has a base address
of 0x1c000000.
• The LPC18_43_SPIFI_8MB_64KB.cfx driver is for use in programming external serial flash
fitted to the Hitex LP1850A/LPC4350A evaluation board. This memory is located at a
base address of 0x14000000, is 8MB in size, and has 64KB sectors.
• The LPC18_43_Diolan_S29AL016J70T.cfx driver is for use in programming the external
2MB parallel flash fitted to the Diolan LP1850-DB1 and LPC4350-DB1 boards. This
memory has a base address of 0x1c000000.
For a more complete list of supplied external flash drivers for the NXP LPC18 and LPC43
families, please see the FAQ at
http://www.lpcware.com/content/faq/lpcxpresso/lpc18-lpc43-external-flash-drivers
Source code for external flash drivers is also provided in the
subdirectory of the LPCXpresso IDE installation.
/Examples/FlashDrivers
Note that the /bin/Flash subdirectory may also contain some drivers for the built-in flash
on some MCUs. It should be clear from the filenames which these are. Do not try to use
these drivers for external flash on other MCUs!
For more details of the user loadable flash driver mechanism, please see the FAQ at
http://lpcware.com/content/faq/lpcxpresso/user-loadable-flash-drivers
6.4 Importing memory configurations via New Project Wizards
The New Project Wizards for LPC18xx and LPC43xx parts allow a memory configuration
file (as exported from the Memory Configuration Editor, as detailed in Editing a memory
configuration [34] ) to be imported at the time of creating a project.
LPCXpresso v7 User Guide -
User Guide
All information provided in this document is subject to legal disclaimers
Rev. 7.4 — 16 September, 2014
© 2013-2014 NXP Semiconductors. All rights reserved.
38
NXP Semiconductors
LPCXpresso v7 User Guide
Figure 6.5. External Memory configuration selection
Memory configurations for a variety of LPC18x0 and LPC43x0 boards can be found in the
directory:
<install_dir>\lpcxpresso\Wizards\MemConfigs\NXP
LPCXpresso v7 User Guide -
User Guide
All information provided in this document is subject to legal disclaimers
Rev. 7.4 — 16 September, 2014
© 2013-2014 NXP Semiconductors. All rights reserved.
39
NXP Semiconductors
LPCXpresso v7 User Guide
7. Multicore projects
The LPC43xx family of MCUs contain a Cortex-M4 ‘Master’ core and one (or more) CortexM0 ‘Slave’ cores. After a power-on or Reset, the Master core boots and is then responsible
for booting the Slave core(s); hence the names Master and Slave. In reality Master and
Slave only apply to the booting process; after boot, your application may treat any of the
cores as the Master or Slave.
The LPCXpresso IDE now allows for the easy creation of “linked” projects that support the
targeting of Multicore MCUs. For more information on creating and using multicore projects,
please see the FAQ at
http://www.lpcware.com/content/faq/lpcxpresso/lpc43xx-multicore-apps
LPCXpresso v7 User Guide -
User Guide
All information provided in this document is subject to legal disclaimers
Rev. 7.4 — 16 September, 2014
© 2013-2014 NXP Semiconductors. All rights reserved.
40
NXP Semiconductors
LPCXpresso v7 User Guide
8. Red Trace Overview
Red Trace is the name for the technology in the LPCXpresso IDE and specific associated
debug probes that provides access to trace information from your target system.
Two forms of trace functionality are supported by LPCXpresso IDE:
• Serial Wire Viewer ( SWV)
• Instruction Trace
8.1 Serial Wire Viewer
The Serial Wire Viewer (SWV) tools provide access to the memory of a running target and
facilitate trace without needing to interrupt the target. Support for SWV is provided by all
Cortex-M3 and M4 based MCUs. It also requires only one extra pin on top of the standard
Serial Wire Debug (SWD) connection.
Note
Use of Red Trace’s SWV support requires connection to the target system
using a compatible debug probe, currently Red Probe+ only. Cortex-M0 and
Cortex-M0+ parts do not have SWV capabilities.
8.2 Instruction Trace
Instruction trace provides the ability to record a trace of executed instructions on certain
Cortex-M0+, M3 and M4 based MCUs. To support the use of the Instruction Trace
functionality, the target MCU must meet the following requirements:
• Cortex-M3 and M4 based parts must implement both ARM’s Embedded Trace Macrocell
(ETM) and an Embedded Trace Buffer (ETB). This means, for example, that Instruction
Trace can be carried out with NXP’s LPC18xx and LPC43xx parts, but not with LPC17xx
parts (which do not implement an ETB).
• Cortex-M0+ must implement ARM’s Micro Trace Buffer (MTB). This means, for example,
that Instruction Trace can be carried out with LPC8xx parts. Note – instruction trace is
not supported on Cortex-M0 based parts.
Instruction trace is supported when using any supported debug probe, including LPC-Link,
LPC-Link2 and Red Probe+.
LPCXpresso v7 User Guide -
User Guide
All information provided in this document is subject to legal disclaimers
Rev. 7.4 — 16 September, 2014
© 2013-2014 NXP Semiconductors. All rights reserved.
41
NXP Semiconductors
LPCXpresso v7 User Guide
9. Red Trace : SWV Views
Red Trace presents target information collected from a Cortex-M3/M4 based system in a
number of different trace views within the LPCXpresso IDE
Each trace view is presented within the Debug Perspective or the Develop Perspective
by default.
Trace views that are not required may be closed to simplify the user interface. They may
be re-opened using the Window -> Show View -> Other... menu item, as per Figure 9.1.
Figure 9.1. Reopening a view
The following trace views are provided:
Profile
• Provides a statistical profile of application activity.
Interrupt Statistics
• Provides counts and timing information for interrupt handlers.
Interrupt Trace
• Provides a time-based graph of interrupts being entered and exited, including nesting.
Data Watch
• Provides the ability to monitor (and update) any memory location in real-time, without
stopping the processor
Host Strings
LPCXpresso v7 User Guide -
User Guide
All information provided in this document is subject to legal disclaimers
Rev. 7.4 — 16 September, 2014
© 2013-2014 NXP Semiconductors. All rights reserved.
42
NXP Semiconductors
LPCXpresso v7 User Guide
• Provide a very low overhead means of displaying diagnostic messages as your code is
running
All views, except for Host Strings, are completely non-intrusive. They do not require any
changes to the application, nor any special build options; they function on completely
standard applications.
Each trace view provides a set of toolbar buttons that are used to control the collection and
presentation of trace information. Starting data collection within one trace view will result in
data collection for other views being suspended. The data presentation area of each trace
view is enabled only when data collection for the view is active.
LPCXpresso v7 User Guide -
User Guide
All information provided in this document is subject to legal disclaimers
Rev. 7.4 — 16 September, 2014
© 2013-2014 NXP Semiconductors. All rights reserved.
43
NXP Semiconductors
LPCXpresso v7 User Guide
10. Red Trace : SWV Configuration
10.1 Starting Red Trace
To use Red Trace’s SWV features, you must be debugging an application on a Cortex-M3/
M4 based MCU, connected via a supported debug probe
You may start Red Trace at any time whilst debugging your program. The program does
not have to be stopped at a breakpoint. Before the collection of data commences, Red
Trace will prompt for settings related to your target processor, as per Figure 10.1.
Figure 10.1. Configure Red Trace
10.1.1 Target Clock Speed
Due to the way the Trace data is transferred by the target processor, setting the correct
clock speed within the Red Trace interface is essential to determine the correct baud rate
for the data transfer. If the clock speed setting does not match the actual clock speed of
the processor, data will be lost, and the trace data will be meaningless.
Depending upon the target MCU and the debug probe being used, the Detect button may
be able to detect the current clock speed of the target processor. But in other systems, you
may need to input the clock speed manually.
Since the Detect button will obtain the current clock speed from the target, care needs to
be taken to ensure that it is used after the application has set the clock speed for normal
operation, otherwise it may provide an inappropriate value. Clock set up code may be
executed by the startup code run before the breakpoint at the start of main() is hit. For
example in NXP projects which use CMSIS – Cortex Microcontroller Software Interface
Standard – this will be done by the startup code calling the SystemInit() function. However
in some projects clock setup may be done within the main() function itself.
Note:
The core frequency must be lower than 80 MHz to use the SWD functionality
required by Red Trace on the NXP LPC1850 and LPC4300 targets.
LPCXpresso v7 User Guide -
User Guide
All information provided in this document is subject to legal disclaimers
Rev. 7.4 — 16 September, 2014
© 2013-2014 NXP Semiconductors. All rights reserved.
44
NXP Semiconductors
LPCXpresso v7 User Guide
10.1.2 Sample rate
This is the frequency of data collection (sampling) from the target. You can normally leave
this set to the default Auto-detect, which will provide a sample rate of approximately 50kHz,
depending on the target clock speed. Available sample rates are calculated from the clock
speed and can be seen in the dropdown.
10.2 Start Trace
Once you are debugging your application, press the Start Trace button to begin the
collection of trace data and enable the updating (refresh) of the view at regular intervals.
Once trace has been started, updates of the view may be paused by pressing the button
again (now reading Stop Trace). Collection of data will continue while refreshing of the
view is paused.
10.3 Refresh
Press the Refresh button
to start the collection of trace data (if trace had not already
been started) and to perform a single update (refresh) of the view. The collection of data
will continue. You may switch between continuous refresh (using the Start Trace button)
and individual refreshes of the view in order to inspect the collected data in more detail.
10.4 Settings
If it becomes necessary to change the system clock speed or the data sampling rate during
a debugging session, use the Settings button
stop data collection.
to notify Red Trace. Any changes will
10.5 Reset Trace
Press the Reset Trace button
collection of data will continue.
to reset any cumulative data presented in the view. The
10.6 Save Trace
Press the Save Trace button
to save the contents of the trace view to a file in CSV
format. This can be useful for offline analysis of the data in a spreadsheet, for example.
LPCXpresso v7 User Guide -
User Guide
All information provided in this document is subject to legal disclaimers
Rev. 7.4 — 16 September, 2014
© 2013-2014 NXP Semiconductors. All rights reserved.
45
NXP Semiconductors
LPCXpresso v7 User Guide
11. Red Trace : Profiling
11.1 Overview
Profile tracing provides a statistical profile of application activity. This works by sampling
the program counter (PC) at the configured sample rate (typically around 50 kHz). It is
completely non-intrusive to the application – it does not affect the performance in any way.
As profile tracing provides a statistical profile of the application, more accurate results can
be achieved by profiling for as long as possible. Profile tracing can be useful for identifying
application behavior such as code hotspots.
11.2 Profile view
The Profile view gives a profile of the code as it is running, providing a breakdown of time
spent in different functions. An example screenshot is shown in Figure 11.1.
Figure 11.1. Profile View
• Cumulative samples: This is the total number of PC samples that have occurred while
executing the particular function.
• Cumulative samples (%): This is the same as above, but displayed as a percentage
of total PC samples collected.
• Current samples (%): Number of samples in this function in the last data collection
(refresh period)
• Coverage (%): Number of instructions in the function that have been seen to have been
executed.
• Coverage Bitmap: the coverage bitmap has 1 bit for each half-word in the function. The
bit corresponding to the address of each sampled PC is set. Most Cortex-M instructions
are 16-bits (one half-word) in length. However, there are some instructions that are 32bits (two half-words). The bit corresponding to the second halfword of a 32-bit instruction
will never be set.
• First: This is the first time (relative to the start time of tracing) that the function was
sampled.
• Last: This is the last time (relative to the start time of tracing) that the function was
sampled.
• Since: It is this long since you last saw this function. (current – last)
LPCXpresso v7 User Guide -
User Guide
All information provided in this document is subject to legal disclaimers
Rev. 7.4 — 16 September, 2014
© 2013-2014 NXP Semiconductors. All rights reserved.
46
NXP Semiconductors
LPCXpresso v7 User Guide
• Avg Between: This is the average time between executions of this function.
Note:
Coverage is calculated statistically – sampling the PC at the specified rate (e.g.
50Khz). It is possible for instructions to be executed but not observed. The
longer trace runs for, the more likely a repeatedly executed instruction is to be
observed. As the length of the trace increases, the observed coverage will tend
towards the true coverage of your code. However, this should not be confused
with full code coverage.
LPCXpresso v7 User Guide -
User Guide
All information provided in this document is subject to legal disclaimers
Rev. 7.4 — 16 September, 2014
© 2013-2014 NXP Semiconductors. All rights reserved.
47
NXP Semiconductors
LPCXpresso v7 User Guide
12. Red Trace : Interrupt tracing
12.1 Overview
Interrupt tracing provides information on the interrupt performance of your application.
This can be used to determine time spent in interrupt handlers and to help optimize their
performance.
12.2 Interrupt Statistics view
The Interrupt Statistics view displays counts and timing information for interrupt service
handlers. An example screenshot is shown in Figure 12.1.
Figure 12.1. Interrupt Statistics View
Information displayed includes:
• Count: The number of times the interrupt routine has been entered so far.
• Time In: The total time spent in the interrupt routine so far.
• Min (time in): Minimum time spent in the interrupt routine for a single invocation.
• Max (time in): The Maximum time spent in a single invocation of the routine.
• Min (time between): The minimum time between invocations of the interrupt.
• Max (time between): The maximum time between invocations of the interrupt.
• Total time between: The total time spent outside of this interrupt routine.
• Time since last: The time elapsed since the last time in this interrupt routine.
• First time run: The time (relative to the start of trace) that this interrupt routine was first
run.
• Current time: The elapsed time since trace start.
• Overhead: The cumulative overhead time elapsed entering and exiting all handlers
• Sleep: Time the processor spent sleeping.
12.3 Interrupt Trace view
The Interrupt Trace view provides a time-based graph of interrupts and exceptions and
shows their nesting and when the exception is dismissed. This gives a visual representation
of time in interrupt service routines and the transitions between them. An example
screenshot is shown in Figure 12.2.
LPCXpresso v7 User Guide -
User Guide
All information provided in this document is subject to legal disclaimers
Rev. 7.4 — 16 September, 2014
© 2013-2014 NXP Semiconductors. All rights reserved.
48
NXP Semiconductors
LPCXpresso v7 User Guide
Figure 12.2. Interrupt Trace View
Each interrupt handler (interrupt service routine) is listed in the left hand panel, and
horizontally is the time axis. In the waveform, entry into an interrupt routine is indicated with
a red vertical line and exit from an interrupt routine is indicated by a green vertical line.
The buttons in the top right corner deserve further explanation and are enlarged in
Figure 12.3.
Figure 12.3. Interrupt trace display controls
• Clicking on the clock icon puts the display into a linear time mode.
• The next button puts the display into an event view. In this view time is no longer linear
on the x-axis but this can be very useful for showing sparse events that are spread out
in time at seemingly unrelated intervals.
• The ‘LOG’ button puts the display into a log-time view which has the effect of compressing
time to show more information with less loss of detail.
• ‘+’ and ‘-’ are used to ‘zoom’ the display in the time-axis.
• The left and right buttons are used to scroll the time display.
• The refresh button literally shows a capture of another set of samples in the view.
The panel on the left of the Interrupt Trace view lists the interrupt service routines in the
application being debugged, as per Figure 12.4.
LPCXpresso v7 User Guide -
User Guide
All information provided in this document is subject to legal disclaimers
Rev. 7.4 — 16 September, 2014
© 2013-2014 NXP Semiconductors. All rights reserved.
49
NXP Semiconductors
LPCXpresso v7 User Guide
Figure 12.4. Interrupt handlers
The arrows to the left of the names of the service routines allow you to move the centre
of the waveform display to the next transition on that event. This is particularly useful with
sparse events.
LPCXpresso v7 User Guide -
User Guide
All information provided in this document is subject to legal disclaimers
Rev. 7.4 — 16 September, 2014
© 2013-2014 NXP Semiconductors. All rights reserved.
50
NXP Semiconductors
LPCXpresso v7 User Guide
13. Red Trace : Data Watch Trace
13.1 Overview
This view provides the ability to monitor (and update) any memory location in real-time,
without stopping the processor. In addition up to 4 memory locations can also be traced,
allowing all access to be captured. Information that can be collected includes whether data
is read or written, the value that is accessed and the PC of the instruction causing the
access.
This information can be used to help identify ‘rogue’ memory accesses, monitor and
analyze memory accesses, or to profile data accesses.
Real-time memory access is also available, allowing any memory location to be read
or written without stopping the processor. This can be useful in real-time applications
where stopping the processor is not possible, but you wish to view or modify in-memory
parameters. Any number of memory locations may be accessed in this way and modified
by simply typing a new value into a cell in the Data Watch Trace view.
Warning:
Data Watch Trace and Instruction Trace [41] cannot be used simultaneously
as they both require use of the DWT unit.
13.2 Data Watch view
The view is split into 2 sections – with the item display on the left and the trace display
on the right, as per Figure 13.1.
Figure 13.1. Data Watch View
Use the Add Data Watch Items button
to display a dialog to allow the memory locations
that will be presented to be chosen, as per Figure 13.2.
LPCXpresso v7 User Guide -
User Guide
All information provided in this document is subject to legal disclaimers
Rev. 7.4 — 16 September, 2014
© 2013-2014 NXP Semiconductors. All rights reserved.
51
NXP Semiconductors
LPCXpresso v7 User Guide
Figure 13.2. Add Data Watch Items
These locations may be specified by selecting global variables from a list; by entering a
C expression; or by entering an address and data size directly. Trace may be enabled for
each new item. If trace is not enabled, the value of the data item will be read from memory.
Data watch trace works by setting an address into a register on the target chip. This address
is calculated at the time that you choose an item to watch in the Add Data Watch Items
dialog. Thus, while you can use an expression, such as buffer[bufIndex+4], the watched
address will not be changed should bufIndex subsequently change. This behavior is a
limitation of the hardware.
The format drop down box provides several format strings to choose from for displaying an
items value. The format string can be customized in this box, as well as in the item display.
With trace enabled, the options for tracing the item’s value, the PC of the instruction
accessing the variable, or its address can be set. Additionally, the option to trace reads,
writes or both can be set when adding a variable. These settings can be subsequently
updated in the item display.
Note:
It is not possible to add some kinds of variables when the target is running.
Suspending the execution of the target with the
variables will overcome this limitation.
button before adding these
Pressing Finish adds the current data watch item to the item display and returns to the
data watch view. Pressing Next adds the current data watch item, and displays the dialog
to allow another item to be added.
LPCXpresso v7 User Guide -
User Guide
All information provided in this document is subject to legal disclaimers
Rev. 7.4 — 16 September, 2014
© 2013-2014 NXP Semiconductors. All rights reserved.
52
NXP Semiconductors
LPCXpresso v7 User Guide
13.2.1 Item Display
Figure 13.3. Data Watch Item Display
As shown in Figure 13.3, the item display lists the data watch items that have been added.
The following information is presented:
• Enable Trace - tracing of this item may be enabled or disabled using the checkbox. A
maximum of 4 items may be traced at one time. Each traced item is given a color code,
so that it may be picked out easily on the trace display (see Figure 13.4).
• Value - shows the current value of the item and may be edited to write a new value to
the target. If the current value has changed since the last update, then it will be shown
highlighted in yellow.
• Format - shows the printf-style expression used to format the value and may be edited
• Type - shows the trace type, which may be edited while trace is disabled:
• Value - just the trace the value transferred to/from memory
• PC only - just trace the PC of the instruction making the memory access
• PC and value - trace the value and the PC
• Address - trace the address of memory accessed
• Address and value - trace the address and value
• Access - shows the access type, which may be edited while trace is disabled:
• Write - just trace writes to the memory location
• Read - just trace reads to the memory location
• Read & Write - trace both reads and writes
The variables in the item display persist between debug sessions. They are saved when
the session ends and automatically re-added when the trace is started. If a variable is
removed from the code between debug sessions the user is alerted that the variable cannot
be restored.
LPCXpresso v7 User Guide -
User Guide
All information provided in this document is subject to legal disclaimers
Rev. 7.4 — 16 September, 2014
© 2013-2014 NXP Semiconductors. All rights reserved.
53
NXP Semiconductors
LPCXpresso v7 User Guide
13.2.2 Trace Display
The trace display shows the traced values of the memory locations. Each location being
traced is given a particular color code, to allow all access to it to be easily picked out. See
Figure 13.4.
Figure 13.4. Data Watch trace display
LPCXpresso v7 User Guide -
User Guide
All information provided in this document is subject to legal disclaimers
Rev. 7.4 — 16 September, 2014
© 2013-2014 NXP Semiconductors. All rights reserved.
54
NXP Semiconductors
LPCXpresso v7 User Guide
14. Red Trace : Host Strings (ITM)
14.1 Overview
Host Strings use the Instrumentation Trace Macrocell (ITM) within the Serial Wire Viewer
(SWV) functionality provided by Cortex-M3/M4 based systems to display diagnostic
messages as your code is running.
The overhead of using Host Strings is much lower than the traditional method of generating
diagnostic messages using printf (either through semihosting or retargeted to use a serial
port), as the “intelligence” for Host Strings is contained within Red Trace rather than in
application code running on the target. The overhead is so low that the instrumentation
can remain in your target application code and the generation of the debug messages
can simply be globally turned off by default in the ITM trace enable register and then
turned on again when the debugger is attached – giving very elegant in-system diagnostic
capabilities.
The Host Strings mechanism uses a very low overhead store instruction added to your
code or your OS kernel to cause an appropriate diagnostic string to be displayed within the
LPCXpresso IDE. Time stamps are captured along with the instrumentation events.
14.2 Defining Host Strings
Host Strings are defined within a Host Strings file. To create a Host Strings file for a project
use the New File wizard by right-clicking on the project within the Project Explorer view
and selecting New -> Host Strings File from the pop-up menu. The Host Strings file must
be located immediately under the project folder and must be named hoststrings.xml.
Host Strings files are associated with the Host Strings Editor and the new file is opened
within this editor automatically when the New File wizard finishes, as per Figure 14.1.
Figure 14.1. Blank Host Strings Editor
Each host string describes a message to be presented within the Host Strings view within
the LPCXpresso IDE, plus the formatting information for a single parameter that is sent
from the target for presentation within the message. Click on the Add... button within the
editor to add a new host string, as per Figure 14.2.
LPCXpresso v7 User Guide -
User Guide
All information provided in this document is subject to legal disclaimers
Rev. 7.4 — 16 September, 2014
© 2013-2014 NXP Semiconductors. All rights reserved.
55
NXP Semiconductors
LPCXpresso v7 User Guide
Figure 14.2. Adding a new Host String Name
Name
• The name of the Host Strings Macro that will be invoked by the application code running
on the target. Note that this name will be automatically prefixed with HS_ when the
hoststrings.h header file is generated by the Host Strings process during project build.
Note that the host string name is subject to the naming restrictions for C pre-processor
macros.
Parameter Size
• An optional parameter can be passed as part of a call to a Host Strings Macro. This can
be of size 8-bit, 16-bit or 24-bit or specified as None if no parameter is required. Note
that the Host Strings mechanism does not support the passing of full 32-bit quantities as
a parameter – such parameters will be truncated to 24 bits by the macro.
Value
• String that will be displayed in the Host Strings view within the LPCXpresso IDE when
the Host Strings Macro is executed on the target.
• By default, when you add a new Host String, the value will be set to the name of the
Host String, plus the parameter in hexadecimal format. However this value can be edited
as required.
• The format of the parameter is %[inf][width]ctrl, where
•
inf
= b, h or w for byte, half, word (truncated to 24-bits).
•
ctrl
•
width
= u or d (for decimal), x or X (for hexadecimal), or b (for binary).
(optional) a number to specify the minimum number of characters to be printed
and whether this should be zero-padded (similar to printf).
• Host strings providing incorrect formatting information are marked with a warning triangle
within the editor.
An example set of Host Strings within the Host Strings Editor are shown in Figure 14.3.
LPCXpresso v7 User Guide -
User Guide
All information provided in this document is subject to legal disclaimers
Rev. 7.4 — 16 September, 2014
© 2013-2014 NXP Semiconductors. All rights reserved.
56
NXP Semiconductors
LPCXpresso v7 User Guide
• DisplayVal will display the string "msticks
format (as specified by the %[w]d).
= ",
• LedsOn will display the string "LEDs
now on".
• LedsOff will display the string "LEDs
now off".
followed by the parameter in decimal
Tip:
The value of existing host strings may be edited by clicking on the message
string within the editor.
Figure 14.3. Populated Host Strings Editor
14.3 Building the Host Strings macros
When a Host Strings file is created using the New File wizard, the management of
host strings for the associated project is enabled automatically. A header file named
hoststrings.h is generated using a Host Strings Builder as part of the project build. This
behavior may be enabled or disabled for any project by right-clicking on the project within
the Project Explorer view and selecting Managed Host Strings from the pop-up menu.
The header file contains the host string macros for use within your code
14.4 Instrumenting your code
Project code may be instrumented with Host Strings by referencing the Host Strings header
file using :
#include "../hoststrings.h"
Note that the above assumes that the source code for your project is located in a
subdirectory immediately below the root directory of your project (where the Host String files
are located). If your project is more complex, then it may be better to add ${ProjDirPath}
to your project include paths using the menu:
Project -> Properties -> C/C++ Build -> Settings -> MCU C Compiler -> Includes
(repeating for both Debug and Release Build variants) and then simply use:
#include "hoststrings.h"
Host string messages may then be triggered within your code by adding calls to the preprocessor macros defined within this header file. For example:
HS_DisplayVal(msticks);
LPCXpresso v7 User Guide -
User Guide
All information provided in this document is subject to legal disclaimers
Rev. 7.4 — 16 September, 2014
© 2013-2014 NXP Semiconductors. All rights reserved.
57
NXP Semiconductors
LPCXpresso v7 User Guide
14.5 Host Strings view
The Host Strings view presents the message associated with a host string each time
the associated host string macro is called within your code. The message includes the
formatted value of the parameter passed into the macro.
Figure 14.4 shows example Host Strings output, as generated by running the
RDB1768cmsis2_HostStringsDemo project, which can be found in the RDB1768cmsis2.zip
example bundle provided with the LPCXpresso IDE.
Figure 14.4. Host Strings output
LPCXpresso v7 User Guide -
User Guide
All information provided in this document is subject to legal disclaimers
Rev. 7.4 — 16 September, 2014
© 2013-2014 NXP Semiconductors. All rights reserved.
58
NXP Semiconductors
LPCXpresso v7 User Guide
15. Red Trace : Instruction Trace
Instruction trace provides the ability to record and review the sequence of instructions
executed on a target. The LPCXpresso IDE provides support for instruction trace via on chip
trace buffers. Instruction trace makes use of the Embedded Trace Buffer (ETB) on Cortex
M3 and M4 parts and the Micro Trace Buffer (MTB) on the Cortex-M0+. The instruction
trace which is generated at high speed can be captured in real time and stored in these
on-chip buffers, so that they can be downloaded at lower speeds without the need for an
expensive debug probe.
The LPCXpresso IDE exposes the powerful Embedded Trace Macrocell (ETM) on Cortex
M3 and M4 to focus the generated trace stored in the ETB. Trace can be focused on specific
areas of code or triggered by complex events for example. On the Cortex M0+, the MTB
provides simple instruction trace using shared SRAM.
This documentation is divided into four parts.
• Getting Started [59] - Tutorials to help you learn how to use instruction trace
• Concepts [63] - Technical background of instruction tracing
• Reference [71] - Details of the interface and operation of instruction trace
• Troubleshooting [78] - solutions to common challenges you may face
15.1 Getting Started
The following tutorials guide you through the process of using instruction trace.
15.1.1 Configuring the Cortex-M0+ for Instruction Trace
Instruction trace on Cortex-M0+ targets requires that some SRAM need to be reserved.
The Micro Trace Buffer (MTB) that provides the Instruction Trace capabilities stores the
execution trace to SRAM. It is therefore necessary to reserve some SRAM to ensure that
user data is not overwritten by trace data. This configuration is not required for instruction
trace on Cortex-M3 and Cortex-M4 MCU parts.
LPCXpresso’s new project wizard will automatically includes a file called mtb.c for parts
which support MTB trace. This file places an array called __mtb_buffer__ into memory at the
required alignment. The MTB will then be configured to use this space as its buffer allowing
it to record execution trace without overwriting user code or data. The array __mtb_buffer__
should not be used within your code since the MTB will overwrite any data entered into it.
The enablement and size of the __mtb_buffer__ is controlled by three symbols:
•
__MTB_DISABLE
- If this symbol is defined, then the buffer array for the MTB will not be
created.
•
__MTB_BUFFER_SIZE - Symbol specifying the size of the buffer array for the MTB. This must
be a power of 2 in size, and fit into the available RAM. The MTB buffer will also be aligned
to its ‘size’ boundary and be placed at the start of a RAM bank (which should ensure
minimal or zero padding due to alignment).
•
- Allows MTB Buffer to be placed into specific RAM bank. When this is
not defined, the “default” (first if there are several) RAM bank is used.
__MTB_RAM_BANK
To change or add these symbols click on Quickstart Panel->Quick Settings->Defined
Symbols.
LPCXpresso v7 User Guide -
User Guide
All information provided in this document is subject to legal disclaimers
Rev. 7.4 — 16 September, 2014
© 2013-2014 NXP Semiconductors. All rights reserved.
59
NXP Semiconductors
LPCXpresso v7 User Guide
If you have a project for an MTB supported part which does not have the mtb.c file in it
already you simply need to copy the mtb.c file from existing project or create a new project
and copy the file from there.
Warning
Enabling the MTB manually without properly configuring the target’s memory
usage will result in unpredictable behavior. The MTB can overwrite user code
or data which is likely to result in a hard fault.
15.1.2 Trace the most recently executed instructions
This tutorial will get you started using the Instruction Trace capabilities of Red Trace. You
will configure the target’s trace buffer as a circular buffer, let your program run on your
target, suspend it and download the list of executed instructions.
Note:
Instruction Trace depends on optional components in the target. These
components may or may not be available on the LPC device you are working
with. See the Instruction Trace Overview [63] for more information.
First, you will debug code on your target. You can import an example project or use one
of your own.
Step 0: Configure memory if using a Cortex-M0+ parts If you are using a Cortex-M0+
part with an MTB you must first configure the memory usage of your code to avoid conflicts.
See the Configuring the Cortex-M0+ for instruction trace[59] for instructions on how
to do this.
Step 1: Start the target and show the Instruction Trace view
1. Build and execute your code on the target.
2. Suspend the execution of your target by selecting Run -> Suspend
3. Display the Instruction Trace view by clicking
Trace
Window -> Show View -> Instruction
Step 2: Configure the trace buffer
1. Press the Record Trace Continuously button
in Instruction Trace
2. Resume execution of your target by selecting Run -> Resume
The trace buffer should now be configured as a circular buffer and your target should be
running your code. Once the trace buffer is filled up, older trace data is overwritten by the
newer trace data. Configuring the trace buffer as a circular buffer ensures that the most
recently executed code is always stored in the buffer.
If the Record Trace Continuously button
was grayed out, or you encountered error
when trying to set check out the troubleshooting guide [78] .
Step 3: Download the content of the buffer
1. Suspend the execution of your target by selecting Run -> Suspend
2. Press Download trace
LPCXpresso v7 User Guide -
User Guide
in the Instruction Trace view.
All information provided in this document is subject to legal disclaimers
Rev. 7.4 — 16 September, 2014
© 2013-2014 NXP Semiconductors. All rights reserved.
60
NXP Semiconductors
LPCXpresso v7 User Guide
There may be a short delay as the trace is downloaded from target and decompressed.
Once the trace has been decompressed, it is displayed as a list of executed instructions
in the Instruction Trace view.
Step 4: Review the captured trace
In this step we will explore the captured trace by stepping through it in the instruction view
and linking the currently selected instruction to the source code which generated it as well
as seeing it in context in the disassembly view.
1. Toggle the Link to source button
2. Toggle the link to disassembly
so that it is selected
so that it is selected too
3. Select a row in the Instruction Trace view
4. Use the up and down cursor keys to scroll through the rows in the Instruction Trace
view.
As a row becomes selected the source code corresponding to the instruction in that row
should be highlighted in the source code editor. The disassembly view should also update
with the current instruction selected. There can be a slight lag in the disassembly view as
the instructions are downloaded from the target and disassembled.
Step 5: Highlight the captured instructions
In this step we will turn on the profile view. In the source code editor the instruction which
were traced will be highlighted. This highlighting can be useful for seeing code coverage.
In the disassembly view each instruction is labeled with the number of times each it was
executed.
• Toggle the Profile information button
See Toggle profile information [74] for more information.
15.1.3 Stop trace when a variable is set
In this tutorial you will configure instruction trace to stop when the value of a variable is
set to a specific value.
This tracing could be useful for figuring out why a variable is being set to a garbage value.
Suppose we have a variable that is mysteriously being set to 0xff when we expect it to
always be between 0x0 and 0xA for example.
The set up depends on which trace buffer your target implements. See the following section
for the detailed instructions for your target.
• Cortex M3 or M4 using ETB [61]
Note – For Cortex-M0+ based systems, this functionality requires additional hardware to
be implemented alongside the MTB. LPC8xx does not provide this.
Cortex M3 or M4 using ETB
To trace the instructions that resulted in the write of the unexpected value we are going to
have trace continuously enabled with the ETB acting as a circular buffer. Next we will set up
a trigger [68] to stop trace being written to the ETB after the value 0xff gets written to the
LPCXpresso v7 User Guide -
User Guide
All information provided in this document is subject to legal disclaimers
Rev. 7.4 — 16 September, 2014
© 2013-2014 NXP Semiconductors. All rights reserved.
61
NXP Semiconductors
LPCXpresso v7 User Guide
variable we are interested in. The trigger event requires two DWT comparators. One of the
comparators watches for any write to the address of the variable and the other watches for
the value 0xff being written to any address. The position of the trigger in the trace is set to
capture a small amount of data after the trigger and then to stop putting data into the ETB.
Step 1: Start the target and show the Instruction Trace config view
1. Build and execute your code on the target.
2. Suspend the execution of your target by selecting Run -> Suspend
3. Display the Instruction Trace Config view by clicking
Instruction Trace Config
4. Press the refresh button
Window -> Show View ->
in the Instruction Trace config view
Step 2: Find the address of the variable
1. Display the Disassembly view by clicking
Window -> Show View -> Disassembly
2. Enter the variable name into the location search box and hit enter.
3. Copy the address of the variable to clipboard.
Note:
We are assuming that the variable is a global variable.
Step 3: Enable trace
In this step we configure trace to be generated unconditionally in the Instruction Trace
config view.
1. In the Trace enable section:
a. Select the Simple tab
b. Select enable
Step 4: Enable stalling
To make sure that no packets get lost if the ETM becomes overwhelmed we enable stalling.
Setting the stall level to 14 bytes mean that the processor will stall when there are only
14 bytes left in the formatting buffer. This setting ensures that we do not miss any data,
however, it comes at the cost of pausing the CPU when the ETM cannot keep up with it.
See stalling [65] in the Concepts section for more information.
1. Check the Stall processor check box
2. Drag the slider to set the Stall level to 14 bytes
Step 5: Configure watchpoint comparator
In the first watchpoint comparator choose data write in the comparator drop-down box and
then enter the address of the variable that you obtained earlier. This event resource will be
true whenever there is a write to that address, regardless of the value written.
Step 6: Configure the value written
LPCXpresso v7 User Guide -
User Guide
All information provided in this document is subject to legal disclaimers
Rev. 7.4 — 16 September, 2014
© 2013-2014 NXP Semiconductors. All rights reserved.
62
NXP Semiconductors
LPCXpresso v7 User Guide
Select Data Value Write from the drop-down, note that data comparators are not
implemented in all watch point comparators. Enter the value we want to match, 0xff, in the
text box. Next we link the data comparator to the comparator we configured in step 5 by
selecting 1 in both the link 0 and link 1 fields. Select the Data size to word.
The event resource Comparator 2 will now be true when Comparator 1 is true and the
word 0x000000ff is written.
Step 7: Configure the trigger condition
In the trigger condition section select the One Input tab. Set the resource to be
Watchpoint Comparator 2 and ensure that the Invert resource option is not checked.
These setting ensure that a trigger is asserted when the Watchpoint Comparator 2 is true
— i.e. when 0xff is written to our focal variable.
Step 8: Prevent trace from being recorded after the trigger
Slide the Trigger position slider over to the right, so that only 56 words are written to the
buffer after the trigger fires. This setting will provide some context for the trigger and allows
up to 4040 words of trace to be stored from before the trigger, which will help us see how
the target ended up writing 0xff to our variable.
The configured view should look like Figure 15.3.
Step 9: Configure and resume the target
Now press the green check button
to apply the configuration to the ETM and ETB.
Resume the target after the configuration has been applied. Once the target resumes,
the buffer will start filling with instructions. Once the buffer is filled the newest instructions
will overwrite the oldest. When the value 0xff is written to the focal variable, the trigger
counter will start to count down on every word written to the buffer. Once the trigger
counter reaches zero, no further trace will be recorded, preserving earlier trace.
Step 10: Pause target and download the buffer
After some time view the captured trace by pausing the target and downloading the content
of the buffer:
1. Suspend the execution of your target by selecting Run -> Suspend
2. Display the Instruction Trace view by clicking
Trace
3. Download the content of the ETB by pressing
Window -> Show View -> Instruction
in the Instruction Trace view.
4. Check that the trigger event occurred and was captured by the trace by clicking on
15.2 Concepts
15.2.1 Instruction Trace Overview
15.2.2 MTB Concepts
The CoreSight Micro Trace Buffer for the M0+ (MTB) provides simple execution trace
capabilities to the Cortex-M0+ processor. It is an optional component which may or may
not be provided in a particular MCU. See Supported Targets [78]
LPCXpresso v7 User Guide -
User Guide
All information provided in this document is subject to legal disclaimers
Rev. 7.4 — 16 September, 2014
© 2013-2014 NXP Semiconductors. All rights reserved.
63
NXP Semiconductors
LPCXpresso v7 User Guide
The MTB captures instruction trace by detecting non-sequentially executed instructions
and recording where the program counter (PC) originated and where it branched to. Given
the code image and a this information about non-sequential instructions, the instruction
trace component of Red Trace is able to reconstruct the executed code.
The huge number of instructions executed per second on a target generate large volumes
of trace data. Since the MTB only has access to a relatively small amount of memory, it
gets filled very quickly. To obtain useful trace a developer can configure the MTB to only
focus on a small area of code, to act as a circular buffer or download the content of the
buffer when it fills up. Additionally, all three of these techniques may be combined.
The following sections contain detailed information about the MTB’s operation and use.
• Enabling the MTB [64] - options for controlling the MTB
• MTB memory configuration [64] - how the MTB uses memory
• MTB Watermarking [65] - reacting to the buffer filling up
• MTB Auto-resume [65] - combining multiple trace buffer captures
Warning
The MTB does not have its own dedicated memory. The memory map used
by the target must be configured so that some RAM is reserved for the MTB.
The MTB must then be configured to use that reserved space as described
in the Configuring the Cortex-M0+ for instruction trace[59] in the Getting
Started section.
Enabling the MTB
The Micro Trace Buffer (MTB) can be enabled by pressing the Continuous Recording
button
or checking enable MTB in the Instruction Trace Config view. Trace will only
be recorded by the MTB when it is enabled.
The MTB can also be enabled and disabled by two external signals TSTART and TSTOP. On
the LPC8xx parts, these are driven by the “External trace buffer command” register:
// Disable trace in "External trace buffer command" register
LPC_SYSCON->EXTTRACECMD = 2;
:
:
// Renable trace in "External trace buffer command" register
LPC_SYSCON->EXTTRACECMD = 1;
Note that if TSTART and TSTOP are asserted at the same time TSTART takes priority.
MTB memory configuration
Both the size and the position in memory of the MTB’s buffer are user configurable. This
flexibility allows the developer to balance the trade off between the amount of memory
required by their code and the length of instruction trace that the MTB is able to capture
before getting overwritten or needing to be drained.
Since the MTB uses the same SRAM used by global variables, the heap and stack, care
must be taken to ensure that the target is configured so that the MTB’s memory and the
memory used by your code do not overlap. For more information see Configuring the
Cortex-M0+ for instruction trace [59] in the Getting Started Guide.
LPCXpresso v7 User Guide -
User Guide
All information provided in this document is subject to legal disclaimers
Rev. 7.4 — 16 September, 2014
© 2013-2014 NXP Semiconductors. All rights reserved.
64
NXP Semiconductors
LPCXpresso v7 User Guide
MTB Watermarking
The MTB watermarking functionality allows the MTB to respond to the buffer filling to a
given level by stopping further trace generation or halting the execution of the target. The
watermark level and the actions to perform can be set in the Instruction Trace Config view
[75]. The defined action is performed when the Watermark level matches the MTB’s
write pointer value. The halt action can be augmented with the auto-resume behavior.
MTB Auto-resume
Red Trace provides the option to automatically download the content of the buffer and
resume execution when the target is paused by the watermarking mechanism. This autoresume functionality allows extended trace runs to be performed without being constrained
by the size of the on chip buffer.
There is a significant performance cost associated with using auto-resume since the time
taken to pause the target, download the buffer content and resume it again is much greater
than the time the MTB takes to fill the buffer.
The data is not decompressed during the auto-resume cycles and so it is still necessary
to press Download trace buffer
trace.
in the instruction trace toolbar to view the captured
Tip:
To suspend the target once auto-resume is set press the Cancel button in the
downloading trace progress dialog box. If the downloading trace progress
dialog box is not displayed long enough to click Cancel use the Stop autoresume button
in the instruction trace view toolbar. This disables autoresume so that the target will remain halted the next time the MTB suspends it.
MTB Downloading Trace
To obtain the instruction trace from the MTB once it has captured trace into it buffer, the
content of the buffer needs to be downloaded by Red Trace and decompressed. There
must be an active debug session for the trace to be downloaded. It can be downloaded
using the Download trace buffer button
in the Instruction Trace view.
The trace recorded by the MTB is compressed. The code image is required to decompress
the trace. This image must be identical to the image running on the target when the trace
was captured. It is possible to download and decompress a trace from a previous session
if the same code image is running on the target. However, if the trace buffer contains old
trace data, and a different code image is downloaded to the target, downloading the buffer
may result in invalid trace being displayed.
15.2.3 Embedded Trace Macrocell
The Embedded Trace Macrocell (ETM) provides real-time tracing of instructions and data.
By combining the ETM with an ETB, some features of this powerful debugging tool are
accessible using a low cost debug probe.
This section describes some of the key components and features of the ETM.
Stalling
The Embedded Trace Macrocell [65] (ETM) uses as relatively small FIFO buffer to store
formatted packets. These packets are then copied to the embedded trace buffer [67]
LPCXpresso v7 User Guide -
User Guide
All information provided in this document is subject to legal disclaimers
Rev. 7.4 — 16 September, 2014
© 2013-2014 NXP Semiconductors. All rights reserved.
65
NXP Semiconductors
LPCXpresso v7 User Guide
(ETB). This FIFO buffer can overflow when the rate of packets being written into it exceed
the rate at which they can be copied out to the ETB.
If stalling is supported on the target the ETM can be set to stall the processor when an
FIFO overflow is imminent. The stall level sets the threshold number of free bytes in the
FIFO at which the processor should be stalled. The stall does not take effect instantly and
so the level should be set such that there is space for further packets to be added to the
buffer after the stall level is reached. Overflows can still occur even with stalling enabled.
The maximum value is the total number of bytes in the FIFO buffer. Setting the stall level
to this will stall the processor whenever anything is entered into the FIFO. For example if a
stall level of 14 bytes was chosen, the processor would be instructed to stall any time there
were fewer than 14 bytes left in the in the buffer. If the target had a 24 byte FIFO buffer,
this level would allow a 10 byte safety buffer for packets generated between the stall level
being detected and the processor actually stalling.
Stalling is enabled from the Instruction Trace Config view [76]. Check the Stall
processor box and select a stall level with the slider.
ETM events
Events are boolean combinations of two event resources [66]. These events can be
used to control when tracing is enabled or to decide when the trigger will occur for example.
The available event resources are dependent on the chip vendor’s implementation.
Events can be specified in the Instruction Trace Config view [76]. For details on how
to build these events see ETM event configuration [77] .
Event Resources
Event resources are used by the ETM [65] to control the ETM’s operation. They can be
combined to form ETM events [66].
Different sets of event resources are implemented by different silicon vendors. The
following event resources are supported by Red Trace:
• Watchpoint comparators [66] — match on addresses and data values
• Counters [66] — match when they reach zero
• Trace start/stop unit [67] — combine multiple input
• External [67] — match on external signals
• Hard wired [67] — always match
Watchpoint comparator event resource
Watchpoint comparators are event resources that facilitate the matching of addresses for
the PC and the data access as well as matching data values. They are implemented by the
Data Watchpoint and Trace [69] (DWT) component.
Counter event resource
A target may support a single reduced counter on counter 1. The reduced counter
decrements on every cycle. This event resource is true when the counter equals zero, it then
reloads and continues counting down. The reload value can be set in the ETM Instruction
Trace config view.
LPCXpresso v7 User Guide -
User Guide
All information provided in this document is subject to legal disclaimers
Rev. 7.4 — 16 September, 2014
© 2013-2014 NXP Semiconductors. All rights reserved.
66
NXP Semiconductors
LPCXpresso v7 User Guide
Trace start/stop unit event resource
The trace start / stop block is an event resource that can combine all of the Watchpoint
comparators. For example you could have trace start when the target enters a function call
and stop when it exits that function, or use it to generate complex trigger events.
When a start comparator becomes true, the start / stop block asserts its output to high and
stays high until a stop comparator becomes true. The start / stop block logic is reset to low
when the ETM is reset.
Note that checking both start and stop for the same comparator will be treated as just
checking start.
To use this method
• Set the trace enable to use the start stop block
• Find the entry and exit addresses for the focal function (in the disassembly view)
• Create instruction match conditions in the DWT comparators for those address
• Check the start box for the entry address and stop boxes for the exit address.
External event resource
External input may be connected to the ETM by the silicon vendor. Please see their
documentation for more information about these vendor configurable elements.
Hard wired event resource
This resource will always be observed to be true. It can be useful for enabling something
constantly when used with an A function, or to disable something when used with a NOT
A function.
15.2.4 Embedded Trace Buffer
The Embedded Trace Buffer (ETB) makes it possible to capture the data that is being
generated at high speed in real-time and to download that data at lower speeds without
the need for an expensive debug probe. Red Trace Instruction trace on Cortex-M3 and
Cortex-M4 targets is facilitated by the ETB in conjunction with the Embedded Trace
Macrocell [65] (ETM).
The ETB and ETM are optional components in the Cortex-M3 and Cortex-M4 targets. Their
implementation is vendor specific. When they are implemented the vendors may implement
different subsets of the ETM’s and ETB’s features. Instruction trace will automatically detect
which features are implemented for your target; however, note that not all of the features
listed in this guide may be available on your target.
The ETM compresses the sequence of executed instruction into packets. The ETB is an
on chip buffer that stores these packets. This tool downloads the stored packets from the
ETB and decompresses them back into a stream of instructions.
This feature is useful for finding out how your target reached a specific state. It allows you
to visualize the flow of instructions stored in the buffer for example.
There are multiple ways to use the ETB. The simplest is continuous recording, where the
ETB is treated as a circular buffer, overwriting the oldest information when it is full. There
LPCXpresso v7 User Guide -
User Guide
All information provided in this document is subject to legal disclaimers
Rev. 7.4 — 16 September, 2014
© 2013-2014 NXP Semiconductors. All rights reserved.
67
NXP Semiconductors
LPCXpresso v7 User Guide
are also more advanced options that allow the trace to be focused on code that is of interest
to make the most of the ETB’s memory. This focusing is achieved by stopping tracing after
some trigger or by excluding regions of code. These modes of operation are described in
this document.
Triggers
The trigger mechanism of using instruction trace works by constantly recording trace to the
ETB until some fixed period after a specified event. This method allows the program flow
up to, around or after some event to be investigated.
There are two components that need to be configured to use triggers. These are the trigger
condition and the trigger counter. The trigger condition is an event (a Boolean combination
of event resources). When the trigger condition event becomes true, the trigger counter
counts down every time a word is written to the ETB. When the trigger counter reaches
zero no further packets are written to the ETB.
To use the ETB in this way the Trace Enable event is set to be always on (hard wired).
The ETB is constantly being filled, overflowing and looping round, overwriting old data.
The trigger counter is set using the trigger position slider. The counter’s value is set to the
words after trigger value. You can think of the position of the slider as being the position
of the trigger in the resulting trace that will be captured by the ETB.
There are three main ways of using the trigger: trace after – when that the data from the
trigger onwards is the interesting information; trace about — the data either side of the
trigger is of interest; and trace before — data before the trigger is the key information.
Trace after
When the slider is at the far left, the words before trigger will be zero and the words
after trigger will be equal to the number of words which can be stored in the ETB. This
corresponds to the situation where the region of interest occurs after the trigger condition.
Once the ETB receives the trigger packet the trigger counter, which was equal to words
after trigger will count down with every subsequent word written to the ETB, until it reaches
zero. The trigger packet will be early in the trace and the instruction trace will include all
instructions from when the trigger event occurred, until the ETB buffer filled up.
Note that in order to facilitate decoding of the trace the ETM periodically emits
synchronization information. On some systems the frequency that these are generated
can be set. Otherwise, by default, they are generated every 0x400 cycles. It is therefore
necessary to make sure that you allow some trace data to be collected before your specific
area of interest when using the trigger mechanism so that this synchronization information
is included.
Trace around
As the trigger position slider is moved to the right, the words after trigger value decreases.
This means that the data will stop getting written to the ETB sooner. Since the Trace Enable
event was set to true, there will be older packets, from before the trigger event, still stored in
the ETB. The resulting instruction trace will include some instruction from before the trigger
and some from after the trigger. Use the slider to balance the amount of trace before and
after the trigger.
Trace before
With the trigger position slider towards the far right, the instruction trace will focus on the
trace before the trigger event. Note that only trace captured after the instruction trace has
been configured will be captured. For example pausing the target and setting a trigger
LPCXpresso v7 User Guide -
User Guide
All information provided in this document is subject to legal disclaimers
Rev. 7.4 — 16 September, 2014
© 2013-2014 NXP Semiconductors. All rights reserved.
68
NXP Semiconductors
LPCXpresso v7 User Guide
condition for the next instruction, with the trace position set to the far right would not be
able to include instruction trace from before the trace was configured, but rather it would
stop after words after trigger number of words was written to the ETB, leaving most of
the ETB unused.
Note that setting the trigger position all the way to the right, such that words after trigger
is zero will disable the trigger mechanism.
Timestamps
When the timestamps check-box is selected and implemented, a time stamp packet will
be put into the packet stream. The interval between packets may be configurable if the
target allows it, or may be generated at a fixed rate.
If supported, there is a Timestamp event. Timestamps are generated when the event fires.
A counter resource could be used to periodically enter timestamps into the trace stream
for example.
Note:
ARM recommends against using the always true condition as it is likely to
insert a large number of packets into the trace stream and make the FIFO
buffer overflow.
Note that a time of zero in the time stamp indicates that time stamping is not fully supported
Debug Request
The ETB can initiate a debug request when a trigger condition is met. This setting causes
the target to be suspended when a trigger packet is created.
Note
There may be a lag of several instructions between the trigger condition being
met and the target being suspended
Output all branches
One of the techniques used by the ETM to compress the trace is to output information only
about indirect branches. Indirect branches occur when the PC (program counter) jumps to
an address that cannot be inferred directly from the source code.
The ETM provides the option to output packets for all branch instructions — both indirect
and direct. Checking this option will output a branch packet for every branch encountered.
These branch packets enable the reconstruction of the program flow without requiring
access to the memory image of the code being executed.
This option is not usually required as the Instruction trace tool is able to reconstruct the
program flow using just the indirect branches and the memory image of the executed code.
This option dramatically increases the number of packets that are output and can result in
FIFO overflows, resulting in data loss or reduced performance if stalling [65] is enabled.
It can also make synchronization harder (e.g. in triggered traces) as you can end up with
fewer I-Sync packets in the ETB.
15.2.5 Data Watchpoint and Trace
The data watchpoint and trace (DWT) unit is an optional debug component. Instruction
trace uses its watchpoint to control trace generation. The Red Trace Data Watch view uses
it to monitor memory locations in real-time, without stopping the processor.
LPCXpresso v7 User Guide -
User Guide
All information provided in this document is subject to legal disclaimers
Rev. 7.4 — 16 September, 2014
© 2013-2014 NXP Semiconductors. All rights reserved.
69
NXP Semiconductors
LPCXpresso v7 User Guide
Warning:
Instruction Trace and Data Watch Trace [51] cannot be used simultaneously
as they both require use of the DWT unit.
Instruction address Comparator
Use the program counter (PC) value to set a watchpoint comparator resource true when
the PC matches a certain instruction. Choose Instruction from the comparator drop-down
and enter the PC to match in the match value field. Use the Disassembly view to find the
address of the instruction that you are interested in. When the PC is equal to the entered
match value, the watchpoint comparator will be true; otherwise it is false.
Setting a mask enables a range of addresses to be matched by a single comparator. Set
the Mask size to be the number of low order bytes to be masked. The range generated by
the mask is displayed next to the Mask size box. The comparator event resource will be
true whenever the PC is within the range defined by the mask.
Note:
Instruction addresses must be half-word aligned
Warning
Instruction address comparators should not be applied to match a NOP or an IT
instruction, as the result is unpredictable.
Data access address Comparators
Data access address Comparators are event resources that watch for reads or writes to
specific addresses in memory. As with the instruction comparator, the address is entered
as the match value. There are three different data access comparators:
• Data R/W — true when a value is read from or written to the matched address
• Data Read — only true if a value is read from the matched address.
• Data Write — only true if a value is written to the matched address.
Like instruction address comparators, data access address comparators can operate on
a range of addresses.
Note:
These comparators do not consider the value being written or read — they
only consider the address that is being read from or written to.
Data Value comparator
Data value comparators are triggered when a specified value is written or read, regardless
of the address of the access. This comparator is typically implemented on one of the
Watchpoint comparators on Cortex chips. There are three types of this comparator:
• Data Value R/W — true when a value is read or written that is equal to the Match Value
• Data Value Read — only true if a value is read that is equal to the Match Value
• Data Value Write — only true if a value is written that is equal to the Match Value
The size of the value to be match must be configured as either a word, half word or byte in
the Data size drop-down. Only the lowest order bits up to the request size will be matched.
LPCXpresso v7 User Guide -
User Guide
All information provided in this document is subject to legal disclaimers
Rev. 7.4 — 16 September, 2014
© 2013-2014 NXP Semiconductors. All rights reserved.
70
NXP Semiconductors
LPCXpresso v7 User Guide
For example, if the Data size is set to byte, only the lowest order byte of the match value
will be used in the comparisons.
Typically, you might want to match only a specific value written to a specific variable.
Data value comparators provide this facility by linking to up to two data access address
comparators:
• Access to any address
• set link 0 and link 1 to the data value comparator number
• Access to one address specified in another DWT comparator
• Set both link 0 and link 1 to the address match comparator number
• Access to either of two addresses specified in two separate DWT comparators
• Set link0 to the first address comparator id
• Set link1 to the second address comparator id
Tip:
When there are only two DWT comparators the option to link the two
comparators is given as a check-box.
Cycle Count
If supported by the chip vendor, the first comparator can implement comparison to the
Cycle Counter. The Cycle Counter is a 32-bit counter which increments on every cycle
and overflows silently. This event resource is true when the cycle counter is equal to the
match value.
To use this feature, choose Cycle Counter from the comparator drop-down and enter the
match value into the Match Value field.
15.3 Reference
15.3.1 Instruction trace view
From the Instruction Trace view you can configure trace for your target, and download
and view the captured trace. Open the Instruction Trace view by clicking
Window ->
Show View -> Instruction Trace.
It should look like Figure 15.1.
For trace generated by the ETM, the color of the text in the instruction list provides
information about the traced instruction. Grayed-out text indicates that the instruction did
not pass it condition. A red background indicates a break in the trace due an ETM FIFO
buffer overflow. Instructions may be missing between red highlighted instruction and the
proceeding entry in the trace view. If the Stall option is available it can be used to help
ensure this does not occur in subsequent traces.
A break in the trace may occur due to trace becoming disabled and then renabled (for
example to exclude the tracing of a delay function). Breaks in the trace are indicated by
a line drawn across the row.
A green background highlights the trigger packet that is generated after the trigger condition
is met. Press the trigger button to jump to this instruction in the instruction list.
LPCXpresso v7 User Guide -
User Guide
All information provided in this document is subject to legal disclaimers
Rev. 7.4 — 16 September, 2014
© 2013-2014 NXP Semiconductors. All rights reserved.
71
NXP Semiconductors
LPCXpresso v7 User Guide
Figure 15.1. The instruction trace view
15.3.2 Instruction Trace view Toolbar buttons
There are several buttons in the toolbar of the Instruction Trace View that allow you to
use Instruction Trace with your target.
•
Record trace continuously
•
Show Instruction Trace config view
•
Download trace buffer from target
•
Link to source
•
Link to disassembly
•
Toggle profile information
•
Save trace to csv
•
Jump to trigger
•
Stop auto resume
•
Select columns to display
Record trace continuously
The Record trace continuously
button configures the trace buffer as a circular buffer.
Once the trace buffer is filled up, older trace data is overwritten by newer trace data.
This mode of operation ensures that when the target is paused, the buffer will contain the
most recently executed instructions.
Note: The target must be connected, with your code downloaded and execution
suspended, before you can configure trace.
LPCXpresso v7 User Guide -
User Guide
All information provided in this document is subject to legal disclaimers
Rev. 7.4 — 16 September, 2014
© 2013-2014 NXP Semiconductors. All rights reserved.
72
NXP Semiconductors
LPCXpresso v7 User Guide
Show Instruction Trace config view
Press the Show Instruction Trace config view button
to display the Instruction Trace
config view. This view will provide you with access to all of the trace buffer’s configuration
settings.
The Instruction Trace config view’s contents depend on the features supported by your
target. See the following sections for more information on your target.
• Cortex M0+ MTB [75]
• Cortex M3 ETB [76]
• Cortex M4 ETB [76]
Note: The target must be connected, with your code downloaded and execution
suspended, before you can configure trace.
Download trace buffer
Press the Download trace buffer
button to download the content of the trace buffer
from the target. The data will be downloaded and decompressed. The list of executed
instructions will be entered into the Instruction View table.
Notes
• The target must be suspended in order to perform this action
• The content of the trace buffer can persist across resets on some targets. The buffer is
decompressed using the current code image. If the code has changed since the data
was entered in the buffer, the decompresser’s output will be garbage.
• If no instructions are listed after downloading, check your configuration to make sure that
instruction trace started.
Link to source
The Link to source
toggle button enables the linking of the currently-selected instruction
in the Instruction Trace View to the corresponding line of source code in the source code
viewer. The line of source code that generated the selected instruction will be highlighted
in the source code viewer.
Tip:
You can use the the cursor keys within the Instruction Trace View to scroll
through the executed instructions.
Link to disassembly
The Link to disassembly
toggle button enables the linking of the currently selected
instruction in the Instruction Trace View to the corresponding instruction in the disassembly
viewer. The selected instruction will be highlighted in the disassembly viewer.
Note: The target must be suspended to allow the disassembly view to display the code
on the target.
Tip:
You can use the the cursor keys within the Instruction Trace View to scroll
through the executed instructions.
LPCXpresso v7 User Guide -
User Guide
All information provided in this document is subject to legal disclaimers
Rev. 7.4 — 16 September, 2014
© 2013-2014 NXP Semiconductors. All rights reserved.
73
NXP Semiconductors
LPCXpresso v7 User Guide
Toggle profile information
The Toggle profile
button enables and disables the display of profile information
corresponding to the currently downloaded instruction trace.
When the display of profile information is enabled, a column appears in the disassembly
view that shows the count of each executed instruction that was captured in the trace buffer.
Lines of source code whose instructions were recorded in the trace buffer are highlighted
in the source view.
Tip:
You can customize the display of the highlighting by editing the Profile info
in source view item in the preferences panel under
General -> Editors ->
Text Editors -> Annotations
Save trace
The Save trace
button saves the content of the Instruction Trace View to a csv file.
These files can be large and may take a few seconds to save.
Jump to trigger
Trace downloaded from an ETB (the embedded trace buffer on the Cortex M3 and M4)
may contain a trigger packet. If the trace stream contain such a packet, the jump to trigger
button will show it in the instruction trace view.
Stop auto-resume
When using the MTB auto-resume feature [65], the user may not have time to press
the suspend button or the Cancel button in the download trace progress dialog box as the
target is being rapidly suspended and restarted. Pressing the Stop auto-resume button
will turn off the auto-resume feature, so that the target will suspend the next time the
MTB reaches its watermark level without resuming.
Select columns
You can choose the columns shown in the instruction list using the select columns action
. The available columns are listed below.
Rearrange the column ordering in the table by dragging the header of the columns.
Table 15.1. Instruction view column descriptions
Column
Inst No
Time
PC
Disassembly
C
opCode
Arguments
Offset
Function
Filename
Line no
LPCXpresso v7 User Guide -
User Guide
Description
The index of the instruction in the trace
The timestamp associated with an instruction
The address of the instruction
The disassembled instruction
The condition code for the instruction. E for instructions that passed their condition and
were executed, N for instructions which were not executed.
The op code for the instruction.
The arguments for the op code
Offset of the instruction within the function
The C function name which the instruction belongs to
The C source file that the instruction is associated with
The line number in the C source file that the instruction is associated with
All information provided in this document is subject to legal disclaimers
Rev. 7.4 — 16 September, 2014
© 2013-2014 NXP Semiconductors. All rights reserved.
74
NXP Semiconductors
LPCXpresso v7 User Guide
15.3.3 Instruction Trace Config view for the MTB
Instruction trace with the MTB can be fully configured using the Instruction Trace Config
view. Open the Instruction Trace view by clicking
Window -> Show View -> Instruction
Trace or by clicking on the Instruction Trace Config button
in the Instruction Trace
view. Once the target is connected, refreshing the view with the refresh button
display the options for the target.
Changes made to the MTB configuration are only applied when the Apply button
pressed.
will
is
Figure 15.2. Instruction Trace config view for MTB instruction trace
Configuring the buffer
If the target does not have a buffer allocated for the MTB the view will display instruction
on how to create the buffer when it is refreshed.
Enabling
The three check-boxes in the top section of the view control whether the MTB is enabled
or not. The first check-box Enable MTB can be used to directly enable or disable the MTB.
The second two check-boxes control whether or not the MTB is affected by start and stop
signals TSTART and TSTOP which can be triggered by software using the target’s external
trace buffer command register EXTTRACECMD.
Buffer
The buffer section of the MTB configuration view displays information about where in
memory the MTB data is stored. It displays the size of the buffer and provides instructions
on how to change or remove the buffer.
LPCXpresso v7 User Guide -
User Guide
All information provided in this document is subject to legal disclaimers
Rev. 7.4 — 16 September, 2014
© 2013-2014 NXP Semiconductors. All rights reserved.
75
NXP Semiconductors
LPCXpresso v7 User Guide
See MTB memory configuration [64] for more information and Configuring the CortexM0+ for instruction trace [59] for an example.
Watermark
The watermark section of the MTB advanced configuration view allows you to configure
an action to be performed when the buffer fills to a certain level. The slider configures the
watermark level at which the action is triggered. The address next to the slider indicates
the absolute address of the watermark.
Selecting Halt target on match suspends the target when the buffer fills to the specified
watermark level. When the target is halted the content of the buffer is automatically drained
and stored. The buffer is reset so that it can be refilled once the target is resumed. The
trace is not decompressed or displayed in the Instruction Trace view until the Download
buffer button is pressed. This behavior allows multiple trace runs to be concatenated.
Selecting Auto resume allows the target to be automatically restarted once the buffer has
been downloaded. It only has an effect if Halt target on match is also selected. This autoresume feature allow the trace capture not to be limited to the size of the MTB’s buffer
allowing code coverage to measured. The frequent interruptions have a large impact on
target performance.
Note
You can suspend an auto-resuming target by pressing the cancel button in
the buffer download progress dialog box. If the MTB buffer is sufficiently small,
then the progress dialog box may not be displayed long enough for the user
to select cancel. In that case you should press the Stop auto-resume button
. Both of these methods will turn off the auto-resume feature and the target
will suspend without restarting the next time the watermark matches.
Selecting stop trace collection on match allows the MTB to stop recording trace once
it has been filled once, without interrupting the execution of the target. This feature could
be useful when used in conjunction with a DWT comparator that starts trace on a certain
condition.
Viewing the state of the MTB
The state of the target is read each time the refresh button
in the Instruction Trace
Config view. For example the, the Enable MTB box will show whether or not the MTB
is currently enabled. This information can be useful for confirming that TSTART and TSTOP
signals are affecting the MTB as expected when using the target’s external trace buffer
command register EXTTRACECMD.
Pressing the Apply button
will update the MTB’s configuration — even if no settings are
changed by the user. This action will have the effect of clearing the content of the MTB’s
buffer. That is, if the MTB contains trace that has not been downloaded and then the user
applies the configuration, the content of the buffer will be lost.
15.3.4 Instruction Trace Config view for the ETB
Instruction trace with the ETB and ETM can be fully configured using the Instruction
Trace Config view. Open the Instruction Trace view by clicking
Window -> Show
View -> Instruction Trace or by clicking on the Instruction Trace Config button
in the
Instruction Trace view. Once the target is connected, refreshing the view with the refresh
button
LPCXpresso v7 User Guide -
User Guide
will display the options for the target.
All information provided in this document is subject to legal disclaimers
Rev. 7.4 — 16 September, 2014
© 2013-2014 NXP Semiconductors. All rights reserved.
76
NXP Semiconductors
LPCXpresso v7 User Guide
Changes made to the MTB configuration are only applied when the Apply button
is
pressed. A star appended to a section title indicates that it contains unapplied changes.
Figure 15.3. The advanced configuration dialog for the ETB
ETM Event configuration
An ETM event [66] is a boolean combination of up to two event resource inputs [66].
The Instruction Trace Config view provides an easy way to build these events by allowing
the user to choose the complexity of the event. These are used for trace enablement and
the trigger condition for example.
• The simplest option is a binary enabled/disabled choice. This is accessed by selecting
the Simple tab. Select enable for the Event to always be true or disable for the event
to always be false. See Figure 15.4.
• To use a single event resource select the One Input tab. An event resource can be
chosen from the drop-down and the event will be true when the event resource is true.
Checking the Invert resouce box will cause the Event to be true when the event resource
is false, and visa-versa. See Figure 15.5.
• To combine two event resources select the Two Inputs tab. The events can be chosen
from the drop-downs and the logical combination operation selected. As with the One
Input tab the resources can be inverted. See Figure 15.6.
The configuration on the visible tab is used when the Apply button is clicked.
LPCXpresso v7 User Guide -
User Guide
All information provided in this document is subject to legal disclaimers
Rev. 7.4 — 16 September, 2014
© 2013-2014 NXP Semiconductors. All rights reserved.
77
NXP Semiconductors
LPCXpresso v7 User Guide
Figure 15.4. Simple ETM event configuration
Figure 15.5. One Input ETM event configuration
Figure 15.6. Two Inputs ETM event configuration
15.3.5 Supported targets
Instruction Trace is not supported on all targets. It only works on targets which have the
necessary hardware. Instruction trace is currently supported on the following targets from
NXP:
• LPC8xx (MTB)
• LPC11U6x (MTB)
• LPC18xx (ETM / ETB)
• LPC43xx (ETM / ETB)
15.4 Troubleshooting
This section of the help provides solutions to common problems that you may encounter
while using Instruction Trace.
15.4.1 General
Instruction Trace claims target not supported when it should be
Instruction Trace caches some information about the target in the Launch configuration to
reduce setup time. In some cases this information may become corrupted. Deleting the
Launch configuration will force Instruction Trace to refresh this information.
LPCXpresso v7 User Guide -
User Guide
All information provided in this document is subject to legal disclaimers
Rev. 7.4 — 16 September, 2014
© 2013-2014 NXP Semiconductors. All rights reserved.
78
NXP Semiconductors
LPCXpresso v7 User Guide
You can also double check that your target is in Supported Targets [78]
15.4.2 MTB
Target crashes when MTB is enabled
The MTB may be overwriting code or data on the target. Check that the MTB’s memory
configuration is compatible with the target’s memory configuration.
Target keeps resuming itself and I cannot stop it
Try to press the Stop auto-resume button
in the instruction trace view toolbar. This
button disables auto-resume so that the target will remain halted the next time the MTB
suspends it.
See Auto-resume [65] in the Concepts section for more information.
15.4.3 ETB
Trigger Packet missing from trace even though trigger occurred
It may be that the trigger packet was lost due to FIFO overflow and was not written to the
ETB. To make sure that it actually was triggered, look at the trigger counter (the number
of words to write after the trigger condition). The trigger counter only decrements after the
trigger has been activated. If it has not decremented, check your trigger condition.
If the trigger counter has decremented and you see no packet, try enabling stalling if it is
implemented.
LPCXpresso v7 User Guide -
User Guide
All information provided in this document is subject to legal disclaimers
Rev. 7.4 — 16 September, 2014
© 2013-2014 NXP Semiconductors. All rights reserved.
79
NXP Semiconductors
LPCXpresso v7 User Guide
16. Red State Overview
Red State is a graphical tool incorporated into the LPCXpresso IDE for designing state
machines and automatically generating the code required to implement the state machine.
The state diagram is built in the Red State editor by drawing states and the transitions
between them. You can easily set conditions under which the transitions will occur and
associate events with the transitions, such as setting of outputs.
Red State can be used to create and generate code for state machines for NXP’s State
Configurable Timer ( SCT) peripheral (which is available on certain MCUs) as well as for
software-only state machines (which can be run on any MCU).
The Red State related material in this User Guide has three main parts: two tutorials
and a reference section. SCT state machine tutorial [81] provides a walk-through for
using Red State to implement a state machine on NXP’s SCT. Software state machine
tutorial [93] provides a walk-through for creating a software state machine. Subsequent
sections provide a reference for Red State.
16.1 The NXP State Configurable Timer
Red State supports NXP’s State Configurable Timer Peripheral (SCT) that combines a
32-bit Timer/Counter with a configurable state-machine. The SCT integrates its internal
state with timer values, inputs and outputs to trigger events. These events can change the
internal state of the SCT or the state of output pins. They can affect the timer — starting or
stopping it and capturing its value. It can also generate interrupt requests to the processor
or perform a DMA request.
Red State provides an intuitive interface for building SCT state machines entirely within the
LPCXpresso IDE. It provides easy access to the powerful features of the SCT through a
simple graphical interface. All the code that is necessary to configure your design on the
SCT can be generated with a single click.
16.2 Software State Machine
Red State can generate a software state machine in C from your state machine diagram.
You can define input and output variables and functions to call. Making changes to the
state machine is simple and you can regenerate all the required code with a single click,
avoiding the risk of introducing errors into your business logic.
16.3 Integrating a state machine with your project
Once the state machine design is completed, code can be generated from it to be included
in the build. Code is only generated when the process is initiated using the Generate Code
command. For example, if code had been generated for a state machine and the state
machine was subsequently altered, the user would need to click on Generate Code again.
This document includes step-by-step instructions for creating and using state machines
with the SCT and for running in software.
LPCXpresso v7 User Guide -
User Guide
All information provided in this document is subject to legal disclaimers
Rev. 7.4 — 16 September, 2014
© 2013-2014 NXP Semiconductors. All rights reserved.
80
NXP Semiconductors
LPCXpresso v7 User Guide
17. Red State : SCT state machine tutorial
This section will take you through the steps required to generate a state machine in Red
State for the SCT target.
A state machine can only be added to an existing project in the LPCXpresso IDE. The first
step is to import the base project to extend in this tutorial. The second step is to create a
new state machine and add it to the project using the Red State Wizard. The final step is
to use the integrated Red State graphical editor to design the state machine and generate
the SCT configuration to run on the target.
17.1 Prerequisites
This tutorial is based on the blinky example provided by NXP. It is intended to be run on the
Hitex 1850 board using Rev A silicon. This project will sequentially toggle outputs, which
we name LED1 to LED4. Note that the outputs on the Hitex board do not come connected
to LEDs. Connect LEDs or a logic analyzer to the outputs to observe the state machine
in action.
17.2 Creating a new project for the SCT
To get started, import the SCT base project from the example projects. First, select Import
projects from the Quickstart Panel and press the Browse button corresponding to the
Project Archive edit box. Next, navigate to the /NXP/LPC1000/LPC18xx folder and choose
the file LPC1850A_Hitex.zip. Now press the Next button.
The archive contains several projects, but we only require the following three.
The CMSISv2pxx_LPC18xx_DriverLib is required to access the LPC1850. The
LPC1850A_HitexA4_SCT_Base project contains the code required to set up the system
control unit. To use this project you must add your own state machine. The
LPC1850A_HitexA4_SCT_Blinky project contains the completed SCT state machine that is the
result of following this tutorial.
To follow along with this walk-through, select the CMSISv2pxx_LPC18xx_DriverLib and
LPC1850A_HitexA4_SCT_Base projects. To work from the completed state machine, select
CMSISv2pxx_LPC18xx_DriverLib and LPC1850A_HitexA4_SCT_Blinky. The rest of this tutorial
will assume that the former configuration is being used.
17.3 Adding a new SCT state machine to the project
Now that the project is set up, the next step is to add the state machine to it. The state
machine is described in an .rsm file in the project. Create the file with the Red State
Machine file generator. Make sure that the src folder containing the C source files in the
LPC1850A_HitexA4_SCT_Base project is selected and then select New -> Other from the file
menu or press the New button in the toolbar to bring up the Wizard selection dialog.
Type state in the filter box to find the Red State Machine file generator or just expand
the Red State folder (see Figure 17.1).
LPCXpresso v7 User Guide -
User Guide
All information provided in this document is subject to legal disclaimers
Rev. 7.4 — 16 September, 2014
© 2013-2014 NXP Semiconductors. All rights reserved.
81
NXP Semiconductors
LPCXpresso v7 User Guide
Figure 17.1. Creating a new state machine
Select the Red State Machine file generator and press the Next button. In the New State
Machine dialog, make sure that the src folder is selected. Enter the file name for the state
machine file (e.g. blinky) and press Next. Note that this name will have .rsm appended to it
and will be added to the project. If an rsm file with that name already exists in the workspace,
an error message will appear, and you will need to choose a different name for the file.
Pressing the Finish button would have resulted in the use of the default settings — creating
an SCT state machine with a unified timer and initial and always states pre-populated.
For this example, leave the options in their default conditions except for the unified timer
option. Only the low timer will be used, so deselect the unified timer option. You also need
to choose the target MCU, for example LPC18xx.
Hitting Finish creates a new state machine and opens it in the Red State editor. The
perspective is automatically switched to the Red State perspective. This perspective shows
the different views associated with editing the state machine. It is opened automatically
when an rsm file is loaded (or when a new rsm file is created from the Wizard). The
perspective can be switched using the menus by going to Window -> Open Perspective,
or by using the perspective toolbar in the top right of the LPCXpresso IDE.
LPCXpresso v7 User Guide -
User Guide
All information provided in this document is subject to legal disclaimers
Rev. 7.4 — 16 September, 2014
© 2013-2014 NXP Semiconductors. All rights reserved.
82
NXP Semiconductors
LPCXpresso v7 User Guide
17.4 The blinky state machine overview
The blinky state machine example is based on NXP’s blinky example in their FSM Designer
for the State Configurable Timer documentation. It toggles four outputs sequentially, with
the direction determined by an input signal. The target should be set up with four LEDs on
outputs (named LED1, LED2, LED3 and LED4) and two inputs (named DOWN and RESET).
This example uses only the low ( L) counter of the SCT, activating one of four outputs at
a time. Each time there is a counter match, the output advances. With four LEDs on the
outputs, we should observe the following sequence:
LED1
-> LED2 -> LED3 -> LED4 -> OFF -> LED1 -> LED2 -> ...
If the DOWN input is high, the direction of the sequence is reversed:
LED1
-> OFF -> LED4 -> LED3 -> LED2 -> LED1 -> OFF -> LED4 -> ...
If the RESET input is high, all outputs are set to off. When RESET goes low, the sequence
starts again — either from LED1 if DOWN is low or from LED4 if down is high.
17.5 Naming outputs and inputs
The Outputs for State Machine and Inputs for State Machine views contain the default
inputs and outputs for the SCT. The blue text indicates that it is a fixed property. The black
text is editable. Start by giving descriptive names to the output pins 0 — 3 that will represent
the LEDs.
Figure 17.2. The output and input views for the blinky state machine
Click on Output pin 2 in the Name column and type LED1 to rename it. Next click in the
preload column and select FALSE from the drop-down list. The output is initialized to this
value on a restart. Name the next three output pins to correspond to LED2, LED3, and LED4
and set their preload values to FALSE (see left panel of Figure 17.2).
Note
Two outputs cannot have the same name. Attempting to change a name to
one that is already being used by another output will be ignored and the output
will keep its original name.
Naming the inputs is very similar to naming the outputs. Assign the name DOWN to input pin
0 ( CTIN_0) and RESET to input pin 6 ( CTIN_6). Inputs have no preset value (see right
panel of Figure 17.2).
LPCXpresso v7 User Guide -
User Guide
All information provided in this document is subject to legal disclaimers
Rev. 7.4 — 16 September, 2014
© 2013-2014 NXP Semiconductors. All rights reserved.
83
NXP Semiconductors
LPCXpresso v7 User Guide
17.6 Matching the timer
A key feature of the SCT is the triggering of events based on the value of the timer. To
access this feature add a match input that will be high when the timer is equal to some
value:
1. Add a Low match by pressing the
button in the input toolbar. This will add a new
input. Change its name to maxcount and its type to Match Low.
2. Add another input to store a value to compare with the low counter. Name it speed and
leave its type as const int. Enter the value 40000 in the source column.
3. In the row for maxcount, choose speed from the drop-down in the source column.
The input maxcount will be high when the L counter is equal to the value of speed.
17.7 The states
The next step is to add the states that the SCT will be using. The blinky state machine
has four distinct states corresponding to each LED exclusively being on, and one state
corresponding to no LEDs being on. It also has an extra virtual state described below. The
graphical editor is used to configure the required states and set their names.
17.7.1 Special states
The SCT has several reserved names for states corresponding to special states. Choosing
include initial state and/or include ALWAYS state in the State Machine Wizard
automatically adds these special states to the state machine when it is created. You can
also include them manually by adding a state and giving it the correct reserved name. NXP
described these states as follows:
H_ALWAYS, L_ALWAYS
(split counter mode), U_ALWAYS (unified counter mode):
These are pseudo (or “virtual”) states that do not get mapped into a state
register value for the SCT state machine. It is just a graphical convenience
to represent events that are state independent, or in other words, are
considered to be valid in all defined states
H_ENTRY, L_ENTRY
(counter split mode), U_ENTRY (unified counter mode)
These represent the initial value of the state register the SCT will have after
configuration. It is a useful feature as you might want the state machine
to start from a user defined condition. If not specified, the SCT will be left
in the default configuration after reset, that is, start from state zero. Note
that the tool will map the state numbering at its convenience, so use the
ENTRY feature if the starting state is of relevance for your application
17.7.2 Deleting a state
Red State editor now contains four boxes, representing states, with the labels H_ENTRY,
L_ENTRY, H_ALWAYS and L_ALWAYS. Since this example only uses the L counter, delete the
H_ENTRY and H_ALWAYS states by right-clicking on them in the graphical editor and choosing
delete from the context menu.
17.7.3 Adding states
The L_ENTRY state corresponds to the state with all the LEDs off. To add the four states,
corresponding to each of the LEDs being exclusively on, do the following:
LPCXpresso v7 User Guide -
User Guide
All information provided in this document is subject to legal disclaimers
Rev. 7.4 — 16 September, 2014
© 2013-2014 NXP Semiconductors. All rights reserved.
84
NXP Semiconductors
LPCXpresso v7 User Guide
1. Click on the State button in the Red State editor
2. Click where you would like to place it in the editor (see Figure 17.3).
3. Rename it by clicking on it once to select it, and then clicking on it a second time to
edit the name.
Figure 17.3. Adding a new state
Add the four states and name them LED1on, LED2on, LED3on and LED4on. As with the naming
of inputs and outputs, state names have to be distinct. Red State ignores any attempt to
change the name of a state to that of an existing state.
Drag the states to arrange them on the canvas as shown in Figure 17.4.
LPCXpresso v7 User Guide -
User Guide
All information provided in this document is subject to legal disclaimers
Rev. 7.4 — 16 September, 2014
© 2013-2014 NXP Semiconductors. All rights reserved.
85
NXP Semiconductors
LPCXpresso v7 User Guide
Figure 17.4. The states for the blinky example
The red text of the state labels indicates that there is a problem with that state. Hovering
the cursor above a state will display any errors associated with that state. For example see
Figure 17.5 where Red State is warning that the state machine can never enter this state.
This problem will be addressed in the following sections.
Figure 17.5. Error indication
17.8 Adding transitions
17.8.1 Creating a new transition
Whenever the RESET input is high, the state machine should enter the L_ENTRY state,
regardless of the state machine’s current state. Adding a transition from the L_ENTRY state
is a convenience that avoids the necessity of drawing transitions from every other state
when such a global transition is required.
LPCXpresso v7 User Guide -
User Guide
All information provided in this document is subject to legal disclaimers
Rev. 7.4 — 16 September, 2014
© 2013-2014 NXP Semiconductors. All rights reserved.
86
NXP Semiconductors
LPCXpresso v7 User Guide
Figure 17.6. Adding a transition between states
To add a transition from L_ALWAYS to L_ENTRY select the Transition tool then:
1. Click on the starting state for the transitions ( L_ALWAYS)
2. Move the pointer to the end state for the transition ( L_ENTRY)
3. Click on the end state for the transition
4. Red State creates the new transition.
The label of the new transition is highlighted in red because it does not have a signal
associated with it. See Figure 17.6.
17.8.2 Adding a signal to a transition
Create a signal to link the
RESET
input with the new transition by pressing the add button
in the Signals panel. Next, double-click on the new signal and rename it Reset. Finally,
right-click on Reset and then select Input and then RESET from the pop-up menu – see
Figure 17.7.
LPCXpresso v7 User Guide -
User Guide
All information provided in this document is subject to legal disclaimers
Rev. 7.4 — 16 September, 2014
© 2013-2014 NXP Semiconductors. All rights reserved.
87
NXP Semiconductors
LPCXpresso v7 User Guide
Figure 17.7. Adding a reset signal
The bottom half of the Signals panel now shows the composition of the signal selected in
the top half. Notice the 1 icon next to the input name in the bottom half. This icon indicates
that the signal will fire when the RESET input is high. Right-clicking on it and choosing an
option from the Set I/O condition submenu can change this behavior.
To add the signal to the transition, right-click on the transition’s label and choose Reset
from the Set Signal context menu.
17.8.3 Adding action elements to transitions
The reset transition should turn off all the LEDs. A transition can have at most one action
associated with it. This action, however, can have multiple actions elements associated
with it. For example, an action element might set or clear an output pin.
Right-click on the RESET transition label and choose Add Action -> CLEAR -> LED1.
Repeat for the other three LEDs (see Figure 17.8).
Adding action elements from the context menu automatically creates an action to contain
the chosen action element if the transition has no action associated with it. Otherwise, it
appends the chosen action element to the existing action.
LPCXpresso v7 User Guide -
User Guide
All information provided in this document is subject to legal disclaimers
Rev. 7.4 — 16 September, 2014
© 2013-2014 NXP Semiconductors. All rights reserved.
88
NXP Semiconductors
LPCXpresso v7 User Guide
Figure 17.8. The RESET transition
To keep the state machine in the L_ENTRY state while the RESET signal is high, even if other
transitions are fired, set the transition priority property. Enter 100 in the priority column for
this transition in the State Table view (see Figure 17.9). The state machine transitions to
the state defined by the transition with the highest priority when the signals for multiple
transitions from the current state are satisfied simultaneously. Note that the SCT performs
all actions associated with each satisfied transition.
Figure 17.9. Setting the priority of a transition
17.8.4 Turning on LED1
The next transition we’ll add will be from L_ENTRY to LED1on. It occurs when the counter
reaches speed — i.e. when maxcount is high — and when the DOWN button is not pressed.
When this transition occurs we turn on LED1.
LPCXpresso v7 User Guide -
User Guide
All information provided in this document is subject to legal disclaimers
Rev. 7.4 — 16 September, 2014
© 2013-2014 NXP Semiconductors. All rights reserved.
89
NXP Semiconductors
LPCXpresso v7 User Guide
To build this transition, start by adding a new signal in the Signals panel and name it
increment. Since we want to combine two inputs, right-click on increment and choose Add
AND. You’ll notice that there are two ( none) elements now in the bottom half of the signals
view. Right-click on one of these and choose DOWN from the Input menu. Right-click on
DOWN again and change its I/O condition from HIGH to LOW in the I/O condition context
menu. Now right-click on the other element and choose maxcount from the Input context
menu. See Figure 17.10.
In the editor use the Transition tool to create a new transition from L_ENTRY to LED1on.
Right-click on the transition label and set the signal to increment. Finally, turn on LED1 by
choosing Add Action -> SET -> LED1.
Figure 17.10. A composite signal
17.8.5 Turning off LED1
The next transition we will add is from LED1on back to L_ENTRY. This transition should happen
if we are in state LED1on and the DOWN button is pressed (i.e. the DOWN signal is high)
and the counter has reached speed.
Add another signal and name it decrement. Repeat the steps for the increment signal but
leave the I/O condition for DOWN as HIGH. Draw the transition from LED1on to L_ENTRY and
set decrement as its signal. Add the action element CLEAR LED1 to turn off the LED.
17.8.6 Remaining transitions
Add the remaining transitions, with action elements to turn off the current LED and turn on
the next one according to whether the DOWN input is HIGH or LOW. Note that you can
reuse your increment and decrement signals — there is no need to create multiple copies
of the same signal.
Finally, we want to reset the counter every time that it reaches the value defined by speed.
Add a signal that fires when maxcount is high, then add a loop-back transition on L_ALWAYS
that uses that signal and calls the function Limit low counter. This function instructs the
counter that it has reached its limit and should reset to zero. This behavior is the default for
the counter reaching its limit — see NXP’s documentation on the SCT for other behaviors.
The completed blinky state machine should look like Figure 17.11.
LPCXpresso v7 User Guide -
User Guide
All information provided in this document is subject to legal disclaimers
Rev. 7.4 — 16 September, 2014
© 2013-2014 NXP Semiconductors. All rights reserved.
90
NXP Semiconductors
LPCXpresso v7 User Guide
Figure 17.11. The complete state diagram for the SCT blinky example
17.9 Generating the configuration code
The SCT is configured by setting values to registers. The code that performs this
configuration is created by Red State when the Generate Code button in the State Table
is pressed or when Generate Code is selected from the context menu in the editor. This
code can now be run on the target.
Note:
If the state machine is altered, the code has to be regenerated — the code
generation is not performed automatically when you build your project.
17.9.1 Files generated
When the Generate Code button is pressed four files are generated, overwriting any
previous versions. The first file is the smd file, which contains the description of the state
machine to be processed by NXP’s parser. NXP’s parser then generates the sct_fsm.h and
sct_fsm.c files that contain the configuration code for setting up the SCT. Red State also
generates the sct_user.h that sets up the constants used in the sct_fsm.h and sct_fsm.c
files.
LPCXpresso v7 User Guide -
User Guide
All information provided in this document is subject to legal disclaimers
Rev. 7.4 — 16 September, 2014
© 2013-2014 NXP Semiconductors. All rights reserved.
91
NXP Semiconductors
LPCXpresso v7 User Guide
17.9.2 Issues and warnings
The state machine needs to operate within the constraints of the SCT. Red State generates
warnings if the state machine cannot be implemented on the SCT. The configuration files
are not be generated or updated in this case.
Most issues will be detected as you construct the state machine and will be highlighted
by red text in the editor. Hovering the mouse cursor over the warnings will provide more
information in a pop-up box.
Some problems may only be detected when code is generated. These errors will be listed
in the message box alerting you to the failure.
17.10 Incorporating with your code
The Red State tool generates the code to program the state machine defined in the
editor into the SCT registers. The function sct_fsm_init() must be called to program
the SCT. This function is declared in the sct_fsm.h header file. Since the SCT can only
be programmed when it is stopped and will need some configuration in your code. This
configuration can be done using macros included from lpc18xx_sct.h or lpc43xx_sct.h.
This part of the configuration is not automatically generated and is implemented in the
sct_main.c file for this tutorial.
LPCXpresso v7 User Guide -
User Guide
All information provided in this document is subject to legal disclaimers
Rev. 7.4 — 16 September, 2014
© 2013-2014 NXP Semiconductors. All rights reserved.
92
NXP Semiconductors
LPCXpresso v7 User Guide
18. Red State : Software state machine tutorial
18.1 Software state machine tutorial overview
This section goes through the process of using Red State to create a software state
machine and deploying it to a target. This example uses the RDB1768 debug board,
extending a base project provided in the LPCXpresso IDE.
18.1.1 Building a traffic light example
We are going to make a traffic light system for pedestrians to cross a busy street. This
will be implemented using four outputs hooked up to LEDs and one input hooked up to
a button. We’ll assume that the first three LEDs correspond to the red, amber and green
traffic lights and the fourth lights up a walk sign for the pedestrians.
The traffic lights are green until a pedestrian presses a button. This tutorial implements the
USA traffic light transitions:
green only -> yellow only -> red only -> green only...
When a pedestrian presses the button it will change the traffic lights from green to red,
then turn on the walk sign for a period. Then the walk sign will be turned off and the traffic
lights set to green.
18.2 Creating a new project
18.2.1 Importing the base project
Start by importing the library project for the RDB1768 board. Select import project(s) from
the Quickstart Panel (visible in the C/C++ perspective) — see Figure 18.1.
Figure 18.1. Importing projects
Press browse for the project archive zip text box and locate the RDB1768cmsis2.zip file in
the Examples/NXP/LPC1000/LPC17xx/ folder. Select it then press Next to get a list of projects
contained in the archive.
The archive contains several projects, we are only interested in three of them.
The CMSISv2xx_LPC17xx project contains the required code to use the board. The
LPCXpresso v7 User Guide -
User Guide
All information provided in this document is subject to legal disclaimers
Rev. 7.4 — 16 September, 2014
© 2013-2014 NXP Semiconductors. All rights reserved.
93
NXP Semiconductors
LPCXpresso v7 User Guide
RDB1768cmsis2_RedStateLedTraffic_base project provides the starting point for the tutorial.
The RDB1768cmsis2_RedStateLedTraffic project contains the working solution that would be
generated by following this tutorial.
Select the three project mentioned above and click Finish
them into the workspace. This tutorial assumes that you are
RDB1768cmsis2_RedStateLedTraffic_base project.
to import
using the
18.3 Extending the LED Traffic base project
Switch to the C/C++ perspective and look at the main_ledflash.c file. Elements of the
file are excluded using the preprocessor command #if. Setting the value defined to
ADD_REDSTATE_CODE to 1 will enable the state machine code. Since we have not generated
the code yet it should be left set to 0. In this case, the main while loop contains an infinite
loop which increments an integer. This section demonstrates how to replace the content of
that while loop with the state machine created by Red State.
18.3.1 Add the state machine to the project
The next step is to use the New state machine Wizard to add the state machine. Make
sure that the src folder containing the C source files is selected and then select New>Other from the file menu or press the New button in the toolbar to bring up the Wizard
selection dialog.
Type state in the filter box to find the Red State Machine file generator — see Figure 18.2.
LPCXpresso v7 User Guide -
User Guide
All information provided in this document is subject to legal disclaimers
Rev. 7.4 — 16 September, 2014
© 2013-2014 NXP Semiconductors. All rights reserved.
94
NXP Semiconductors
LPCXpresso v7 User Guide
Figure 18.2. Red State Machine Wizard
Select Red State Machine file generator and press Next. In the New State Machine
dialog make sure that the src folder is selected. Then enter the file name for the state
machine file (e.g. ledState) and press Next (pressing Finish straight away would create
the default SCT state machine rather than a software state machine).
LPCXpresso v7 User Guide -
User Guide
All information provided in this document is subject to legal disclaimers
Rev. 7.4 — 16 September, 2014
© 2013-2014 NXP Semiconductors. All rights reserved.
95
NXP Semiconductors
LPCXpresso v7 User Guide
Figure 18.3. Choosing a filename for a new state machine
Select Software state machine from the Target drop-down list, and keep the other default
options. For a full description of the options see the Software State Machine Wizard options
[110] .
Press Finish to complete the Wizard. the LPCXpresso IDE will switch to the Red State
perspective. The newly created state machine .rsm file is added to your source folder and
opened in the State Machine diagram editor.
Finally, select the State Machine Settings view (usually behind the State Table view).
In the prefix field enter the text pf. This string will be used to prefix components in the
generated C code. Prefixes are used to avoid naming conflicts between different state
machines in the same project.
18.3.2 Adding states to the State Machine
The traffic light will be modeled using six states – see Table 18.1. The Wizard should have
already created the initial state: state 1. Create the remaining 5 states in the editor by
LPCXpresso v7 User Guide -
User Guide
All information provided in this document is subject to legal disclaimers
Rev. 7.4 — 16 September, 2014
© 2013-2014 NXP Semiconductors. All rights reserved.
96
NXP Semiconductors
LPCXpresso v7 User Guide
doing the following: first, click on the state button in the state machine diagram editor;
second, click in the editor where you’d like to place the new state and then release the
mouse button — see Figure 18.4.
The new state is automatically assigned a name ( state 2 in this case). Rename the state
by single-clicking to select it and then single-click it again. Note that double-clicking will not
work — two single-clicks must be performed in succession.
Table 18.1. States used by Traffic Light example
State
state 1
Green
Yellow
Red
Walk
Don’t walk
Description
The initial state of the state machine
The green light is on and all others are off
Only the yellow light on
The walk and red lights are on
The red light is on only (for after the Walk light was been on.)
Figure 18.4. Adding a new state in the State machine editor
Rename state 2 to Green and add the remaining four states in the same way, naming them
as shown in Table 18.1. States can be repositioned by dragging them and can be resized
by dragging the handles of a selected state.
You should now have the states laid out in the state machine editor as in Figure 18.5.
LPCXpresso v7 User Guide -
User Guide
All information provided in this document is subject to legal disclaimers
Rev. 7.4 — 16 September, 2014
© 2013-2014 NXP Semiconductors. All rights reserved.
97
NXP Semiconductors
LPCXpresso v7 User Guide
Figure 18.5. Layout of the states in the State machine editor for the software state machine.
18.3.3 Adding inputs
The values of inputs can be read by the state machine but cannot be set by the state
machine. The traffic lights will have two inputs: the button for the pedestrians to press to
change the lights and a reset signal. Add these two inputs in the Inputs for State Machine
panel by pressing the add button
twice. Delete accidentally added inputs by selecting
their row and pressing the Delete button
.
Figure 18.6. Adding inputs for the Software State Machine
Edit the names of the inputs by clicking in the Name column, naming one buttonPushed and
the other reset. The source column defines the type of these inputs — keep their source
as “int”.
LPCXpresso v7 User Guide -
User Guide
All information provided in this document is subject to legal disclaimers
Rev. 7.4 — 16 September, 2014
© 2013-2014 NXP Semiconductors. All rights reserved.
98
NXP Semiconductors
LPCXpresso v7 User Guide
Figure 18.7. Added inputs for the Software State Machine
18.3.4 Adding outputs
The Outputs for State Machine panel includes variables that can be read and set by the
state machine as well as functions that may be called by the state machine. This example
uses functions to turn the LEDs on and off as well as variables for timing the different stages
of the lights.
Use the Add button
in the Outputs for State Machine panel to add 10 outputs. Name
two of the variables timer and duration to be used for the timing of the lights. Click on their
name to rename them in the table, keeping the type as variable and the source as int.
Enter 0 (the numeral zero) in the preload column for both variables. The variables will be
initialized to these preload values when the state machine is reset.
Figure 18.8. Added outputs for the Software State Machine
Next create the functions. Each light needs two functions: one to turn it on and one to turn it
off. Edit the next row of the output panel to set the name to GreenOn and the type to function.
The source column is ignored for functions. Make the rest of the outputs into functions for
turning on and off the different lights — see Figure 18.8.
18.3.5 The Initial State and the Reset signal
After a reset, the state machine enters the initial state named state 1. The software state
machine requires that the initial state and a reset signal be defined. If you selected include
LPCXpresso v7 User Guide -
User Guide
All information provided in this document is subject to legal disclaimers
Rev. 7.4 — 16 September, 2014
© 2013-2014 NXP Semiconductors. All rights reserved.
99
NXP Semiconductors
LPCXpresso v7 User Guide
initial state in the Wizard there will be a state called state 1 already in the diagram. The
state machine will be initialized this is the state on reset. If include RESET signal was
selected in the Wizard, then there will also be a signal called RESET in the Signals View.
When the RESET signal is detected the current state of the state machine transitions to
the initial state and all outputs are set to their preset values.
The initial state and the RESET signal are defined in the State Machine Settings view that
is the tab behind the State Table by default — see Figure 18.9.
Figure 18.9. Setting the initial state and the reset signals in the State Machine Setting panel
18.3.6 Adding a transition
From the initial state, the state machine will transition to the Green state and call the
appropriate light functions to set just the green light to be on. Add a transition from state
1 to the Green state by choosing the Transition tool, click on state 1 and then on the Green
state — see Figure 18.10.
LPCXpresso v7 User Guide -
User Guide
All information provided in this document is subject to legal disclaimers
Rev. 7.4 — 16 September, 2014
© 2013-2014 NXP Semiconductors. All rights reserved.
100
NXP Semiconductors
LPCXpresso v7 User Guide
Figure 18.10. Adding a transition to the state diagram
18.3.7 Creating a signal
Select the Add signal button
in the Signals panel to add a new signal. Double-click
on the name to change it and enter always. Make this signal always evaluate as true by
comparing a variable to itself. Select the row in the bottom half of the signal panel that says
"( click to change)". Right-click on it and select Add MATCH from the context menu —
see Figure 18.11.
Figure 18.11. Adding a match condition to a signal
The match compares two elements. Initially these are both null and have to be changed.
Right-click on the first null and choose Output -> timer from the context menu. Make sure
LPCXpresso v7 User Guide -
User Guide
All information provided in this document is subject to legal disclaimers
Rev. 7.4 — 16 September, 2014
© 2013-2014 NXP Semiconductors. All rights reserved.
101
NXP Semiconductors
LPCXpresso v7 User Guide
that the element to be set is selected in the bottom half before right-clicking; otherwise the
whole signal may get replaced.
Do the same for the other null value to build the match condition: (timer
== timer).
18.3.8 Adding a signal to a transition
Add the always signal to the transition from state 1 to Green by right-clicking on the transition
label (the text beside the arrow that says ( no signal) ) and selecting Set Signal -> always
from the context menu.
Figure 18.12. Adding a signal to a transition
18.3.9 Adding actions to a transition
A single action is associated with a transition. That action can be composed of multiple
action elements, allowing multiple outputs to be set and functions called when the
transition’s signal is fired and the state machine is in the transition initial state.
When the state machine transitions from state 1 to Green, the green light should turn on and
the other lights should all be off. To implement this behavior right-click on the no action text
beside the arrow and select Add Action -> CALL -> GreenOn. Then repeat this procedure
to call the functions that turn off the other lights.
Remove accidentally added action elements by right-clicking on the transition label and
choosing the item from the delete action element list. Note that the Delete option in the
context menu will delete the entire transition.
The first transition should now be labeled with the text:
(timer == timer)
action 1:
CALL GreenOn
CALL YellowOff
CALL RedOff
CALL WalkOff
18.3.10 Transition on button press
The next transition is fired when the user presses the button – that is, when the input
buttonPushed is non-zero. Add a signal and name it didPush. Right-click on the signal
LPCXpresso v7 User Guide -
User Guide
All information provided in this document is subject to legal disclaimers
Rev. 7.4 — 16 September, 2014
© 2013-2014 NXP Semiconductors. All rights reserved.
102
NXP Semiconductors
LPCXpresso v7 User Guide
element in the bottom half and set it by selecting Input -> buttonPushed from the context
menu.
Next add a transition from Green to Yellow. Click on Select to switch from transition adding
mode and right-click on the transition label to set the signal to didPush.
Add the actions to turn off the green light and turn on the yellow light using the context
(right-click) menu.
A loop-back transition, incrementing a counter, will be used to hold the light on yellow for a
period. First, we set the timer variable to zero by adding the action Set timer. To do this you
right-click on the transition label, select Add Action -> SET -> timer. To enter the value we
need to edit the action element in the Action list. The transition label identifies the action
associated with it on its second line, for example action 2 in this case. Select action 2 in
the Action List and you’ll see the SET operation in the lower half of the Action List. Click
in the Value column and enter the number 0 — see Figure 18.11.
Figure 18.13. Adding a match condition to a signal
Now set the duration variable to 500 by following the same process.
In the Yellow state we’ll add a loop-back transition which increments the timer while the
timer does not equal the variable duration. Add a new signal and name it wait. Add a Not
condition and then a match condition to the signal using the context menu. Add timer
LPCXpresso v7 User Guide -
User Guide
All information provided in this document is subject to legal disclaimers
Rev. 7.4 — 16 September, 2014
© 2013-2014 NXP Semiconductors. All rights reserved.
103
NXP Semiconductors
LPCXpresso v7 User Guide
and duration to the Match condition. Add another function in the Output list and name it
incTimer, remembering to set its type to function.
To make the loop-back transition, select Transition as usual and single-click on the Yellow
state. Single-click on the state again to finish the transition. Add the wait signal to it and
the call the incTimer function.
Add a new signal and name it continue. Edit the signal in the Signal panel so that it matches
the timer to the variable duration. Drag the loop-back transition label so that it is above
the Yellow state. Now add a transition from the Yellow state to the Red state with signal
continue and add actions to turn off the Yellow light, turn on the Red light, set the variable
timer to zero and the variable duration to 250.
The loop-back holds the state machine in the Yellow state until it has looped duration
number of times. Then the continue signal makes the state machine transition to the Red
state.
Add similar transitions to move through the remaining states, pausing in them for
appropreate periods — see Figure 18.14.
Figure 18.14. Layout of the traffic light software state machine.
18.4 Integrating a state machine with existing code
We now have our completed state machine. Next we need to generate the C code for the
state machine and hook it up to the existing code which turns LEDs on and off and handles
external interrupts.
LPCXpresso v7 User Guide -
User Guide
All information provided in this document is subject to legal disclaimers
Rev. 7.4 — 16 September, 2014
© 2013-2014 NXP Semiconductors. All rights reserved.
104
NXP Semiconductors
LPCXpresso v7 User Guide
The state machine is updated by calling its dispatch function with inputs and outputs. The
name of the dispatch function can be set in the State Machine Settings panel. Its default
name is ledState_dispatch for this example. The inputs and outputs for the state machine
are defined by two structs in the main header file (e.g. ledState.h).
18.4.1 Editing main
The main function in main_ledflash.c contains a while loop which increments a variable.
We will be replacing the content of that while loop with a call to the dispatch function.
First, we need to set up the inputs and outputs. The input struct will be a global variable
whose type is defined in ledState.h. Add the ledState.h header file to main_ledflash.c.
#include "ledState.h"
Then enter the following before the main function call:
pf_inputs input; // global access to the input
Next, we initialize the inputs between initializing the LEDs and the start of the while loop.
Also, add the local output struct and initialize it by calling the dispatch function with the
reset signal set to 1. This reset will set the current state to the initial state and fill the output
with their preload values.
// initialise the inputs and outputs:
input.buttonPushed = 0;
input.reset = 1;
pf_outputs out;
ledState_dispatch(input, &out);
input.reset = 0;
Replace the body of the while loop with a call to the delay function and the call to the
dispatch function:
while(1) {
short_delay(10); // slow it down
ledState_dispatch(input, &out);
i++;
}
18.4.2 Generating the state machine code
We now need to generate the code for the dispatch function. With the state machine editor
selected, press the Generate Code button in the State Table panel. This should add four
files to your project. The names of these files are defined in the State Machine Settings
panel. By default you should have the following files:
LPCXpresso v7 User Guide -
User Guide
•
ledState.h
— Header file for the logic of the state machine.
•
ledState.c
•
ledState_actions.h
— The logic of the state machine. Contains the dispatch function and the
input and output data structures.
— The header file for the action functions.
All information provided in this document is subject to legal disclaimers
Rev. 7.4 — 16 September, 2014
© 2013-2014 NXP Semiconductors. All rights reserved.
105
NXP Semiconductors
•
LPCXpresso v7 User Guide
ledState_actions.c
— The functions that are called by the state machine.
The ledState_actions.c file is initially empty. It can be filled with the required template
functions by pressing the Generate Action C Template button in the Actions panel or
by right-clicking in the State Machine editor window and selecting Generate Action
Template.
Warning
Generate Action Template will overwrite any existing content in your
ledState_actions.c file as well as regenerating the other three files.
You are expected to edit the ledState_actions.c file. The other files are regenerated each
time you press the Generate Code button. You are strongly advised not to edit these other
files, as your changes will get overwritten.
18.4.3 Editing the actions C file
Press the Generate Action C Template button to make the function bodies for the action
functions. The LedFlash example contains the leds.h and leds.c files which contain code
for turning on and off the LEDs. Include the leds.h in the ledState_actions.c file.
#include "leds.h"
The LEDs can be turned on by the function led_on(int) and off using led_off(int) passing
it a reference to the LED as the parameter. The LEDs are identified by the constants defined
in leds.h, see Table 18.2.
Table 18.2. The LED ids
Constant
LED_3
LED_2
LED_5
LED_4
Representation
Red
Yellow
Green
Walk Sign
Note that the unusual ordering of the LEDs is due to their layout on the RDB board.
Enter the appropriate calls for turning the LEDs on and off in the function bodies.
/* Action: GreenOff */
void act_GreenOff()
{
led_off (LED_5); // green led
}
/* Action: GreenOn */
void act_GreenOn()
{
led_on (LED_5); // green led
}
/* Action: RedOff */
void act_RedOff()
{
led_off (LED_3); // Red
}
LPCXpresso v7 User Guide -
User Guide
All information provided in this document is subject to legal disclaimers
Rev. 7.4 — 16 September, 2014
© 2013-2014 NXP Semiconductors. All rights reserved.
106
NXP Semiconductors
LPCXpresso v7 User Guide
...
18.4.4 Accessing the outputs
The output variables are stored in a struct defined in the ledState.h file. Its name is of
the form prefix_outputs, where prefix is defined in the State Machine Settings view.
A pointer to the output struct is passed to the dispatch function. From within the action
functions you can get this pointer by calling the prefix_getOutput() function. We use this
pointer to increment the timer value:
/* Action: incTimer */
void pf_incTimer()
{
pf_outputs * out = pf_getOutput();
out->timer++;
}
18.4.5 Setting inputs in interrupt handlers
The state machine will now happily sit in its Green state. Now we need to hook up an external
interrupt so that the state machine knows when a pedestrian has pushed a button. We use
code imported from the RDB1768cmsis2_ExtInt project — the eint0.c and eint0.h files. This
code is included in our base project.
Include the eint0.h header file in the main_ledflash.c file.
#include "eint0.h"
Next add the following line to initialize the interrupt immediately after the LEDs have been
initialized.
// Setup External Interrupt 0 for RDB1768 ISP button
EINT0_init();
In the eint0.c file replace the #include "leds.h" with #include
as an extern global with the following line:
"ledState.h". Declare input
extern pf_inputs input;
Replace the call to leds_invert() from the EINT0_IRQHandler() in the eint0.c file with
input.buttonPushed = 1;
Now when the ISP button on the board is pressed, the buttonPushed input will be set to 1.
Finally we need to have it reset to 0 after the dispatch function has processed the event.
This reset is accomplished by setting the buttonPushed input to 0 after the dispatch function
is called. Place the following line after the call to ledState_dispatch() in the while loop in
the main function:
input.buttonPushed = 0;// clear button push
LPCXpresso v7 User Guide -
User Guide
All information provided in this document is subject to legal disclaimers
Rev. 7.4 — 16 September, 2014
© 2013-2014 NXP Semiconductors. All rights reserved.
107
NXP Semiconductors
LPCXpresso v7 User Guide
18.4.6 Running on the target
Now the traffic lights are ready to be deployed to the target. Switch to the C/C++ perspective
and choose Debug 'RDB1768...' from the Quickstart Panel.
The LED beside the LCD will light up when this example is running on the RDB1768 board.
Pressing the button labeled ISP (between the Ethernet socket and the LCD) makes the
LEDs change in the traffic light sequence — see Figure 18.15.
Figure 18.15. The LEDs on the RDB1768 board.
18.4.7 Other examples
Be sure to check out other examples in the RedState examples folder. The project
RDB1768cmsis2_RedStateTrafficLCD shows how the same state machine can be used with
different peripherals.
LPCXpresso v7 User Guide -
User Guide
All information provided in this document is subject to legal disclaimers
Rev. 7.4 — 16 September, 2014
© 2013-2014 NXP Semiconductors. All rights reserved.
108
NXP Semiconductors
LPCXpresso v7 User Guide
19. Red State : New state machine Wizard
The New State Machine Wizard can create either SCT based state machines or software
state machines. Select the option you require from in the Target box after you have chosen
the location to store the file.
19.1 SCT Wizard options
The New State Machine Wizard has several options for the creating an SCT based state
machine. See Figure 18.15
• Name: A descriptor
• Target: Choose between an SCT state machine and a software state machine. For the
SCT you also choose the MCU and on parts that contain multiple SCTs, the ID of the
SCT to program.
• unified timer: The SCT can be configured as a unified 32-bit counter or it can be split
into two 16-bit counters (the low counter and the high counter).
• include initial state: If checked, special initial states will be automatically added to the
state machine. If the timer is unified, an initial state named U_ENTRY will be added. If the
timer is split, two initial states named L_ENTRY and H_ENTRY will be added. These names
correspond to the low and high state machines respectively.
• include ALWAYS state: If checked, a special virtual state is added to the state machine.
This is in fact independent of the SCT’s state and allows global or state-independent
events to be triggered and represented in the state editor.
• Main file: This is the name of the intermediary file that will be generated from the state
diagram. It will be generated relative to the folder that the state machine is saved in.
LPCXpresso v7 User Guide -
User Guide
All information provided in this document is subject to legal disclaimers
Rev. 7.4 — 16 September, 2014
© 2013-2014 NXP Semiconductors. All rights reserved.
109
NXP Semiconductors
LPCXpresso v7 User Guide
Figure 19.1. The New State Machine Wizard settings for the SCT.
19.2 Software State Machine Wizard options
When Software State Machine is chosen from the Target drop-down you can configure
the following options:
• Name: a descriptor
• Target: choose between and SCT state machine and a software state machine.
• include initial state: if checked, a state will be automatically include as set as the initial
state.
• include RESET signal: if checked, a signal will be automatically included in the new
state machine and set as the RESET signal. The RESET signal is a special signal which
sets the state to the initial state and resets any output whenever it is fired regardless of
the state machine’s current state.
• Main file: what to call the main C file which will be generated by the plug-in. It contains
the logic of the state machine. A corresponding header file is also created.
• Action c file: The state machine may call functions. These functions have to be in the
action c file. The plug-in automatically generates the prototypes in the header file and
can optionally generate a template for the function bodies.
LPCXpresso v7 User Guide -
User Guide
All information provided in this document is subject to legal disclaimers
Rev. 7.4 — 16 September, 2014
© 2013-2014 NXP Semiconductors. All rights reserved.
110
NXP Semiconductors
LPCXpresso v7 User Guide
• Dispatch function name: this is the name of the function that processes the logic of
the state machine. Its inputs are passed to it in a special struct (defined in the main
file’s header).
• Prefix: a prefix used for naming key data structures and functions to ensure that there
are no conflict between other state machines.
Figure 19.2. The New State Machine Wizard settings for the software state machine.
LPCXpresso v7 User Guide -
User Guide
All information provided in this document is subject to legal disclaimers
Rev. 7.4 — 16 September, 2014
© 2013-2014 NXP Semiconductors. All rights reserved.
111
NXP Semiconductors
LPCXpresso v7 User Guide
20. Red State : The state machine editor
20.1 Overview
The state machine editing perspective consists of a graphical editor and 6 views. the
LPCXpresso IDE automatically switches to this perspective when you load an rsm file. In
this section we will give you a brief overview of the main components of Red State’s editor.
Figure 20.1. The Red State perspective
The main window is the state machine diagram editor — see number 1 in Figure 20.1.
The editor is associated with .rsm files. This is where the state machine is graphically
represented. Boxes represent states. Arrows show transitions between states. You can
add states and transitions by selecting them from the pallet on the left. The transitions
have signals and actions associated with them. Any red text in the state machine diagram
indicates a problem with the set up. You can hover your cursor over the text for the full
error description. Use the drop-down in the toolbar to set the zoom level of the diagram.
The Inputs for State Machine view — see number 2 in Figure 20.1 — defines the state
machine’s inputs. The state machine cannot directly affect inputs. Each input has a name,
a type and a source. The name can be any string, but no two inputs can have the same
name in the same state machine. Internally any non-alpha numeric characters are treated
as underscores so the names input 1, input#1 and input_1 would be considered identical.
Different state machines may allow different types. The source describes where an input
is coming from. Note that you may not be able to edit some properties of an input. Fixed
properties are written in blue text.
The Outputs for State Machine view — see number 3 in Figure 20.1 — defines the
outputs available to the state machine. In contrast to the inputs, the state machine may
LPCXpresso v7 User Guide -
User Guide
All information provided in this document is subject to legal disclaimers
Rev. 7.4 — 16 September, 2014
© 2013-2014 NXP Semiconductors. All rights reserved.
112
NXP Semiconductors
LPCXpresso v7 User Guide
directly affect outputs, for example by setting pins or calling functions. The Output view is
very similar to the Input view but includes an additional column. This fourth column is the
“preload” column where you may optionally enter initial values of the outputs. Note that
outputs also include functions that can be called. Like the input view, blue text indicates
non-editable fields.
The Signals view — see number 4 in Figure 20.1 — allows you to create and edit the
triggers for transitions. A signal consists of a logical combination of inputs and outputs. It is
split into two halves: the top lists the signal names which can be associated with a transition;
and the bottom provides the detailed view of the signal and allows it to be constructed via
the context (“right-click”) menu.
The Action List view — see number 5 in Figure 20.1 — allows you to create and edit
compound actions. Only one action can be associated with a transition, but this action
may consist of multiple action elements. Action elements can include setting variables or
outputs and calling functions. Like the Signals view, it is split into two parts. The top part
lists the actions, and the bottom part lists the action elements associated with the action
selected in the top part. Elements can be added and deleted using the context menu. A
single compound action may be used by multiple transitions.
The State Table view — see number 6 in Figure 20.1 — lists all of the transitions in the
state machine and their actions and signals. You can create new states and transitions by
typing into the highlighted “(click to add)” row. Transitions can also be edited here.
The State Machine Settings view — behind the State Table view, see number 7 in
Figure 20.1 — allows the user to change the name of the output file. In the case of the
software state machine, the initial state and reset signals can be set here too. A prefix can
also be included to allow multiple state machines to be used in the same project. For the
SCT, the target MCU and the name of the header file included in the sct_user.h file is set
here. The target SCT can be changed here which is useful if you want to copy an existing
state machine file which was designed for a different SCT.
20.2 States
Once you have created a new state machine you can create states using either the
Diagram Editor or the State Table.
20.2.1 Creating
In the Diagram Editor you select state from the pallet on the left and place it by clicking in
the diagram. This will create a new state with an automatically generated name.
In the State Table you can create states by typing a name in the current or next state
column. This will start to create a transition using the name you entered. If there is already
a state with that name in the state machine, it will be used in the transition, otherwise a
new state will be created.
20.2.2 Naming
A state can be renamed in the Diagram Editor by single-clicking on the state to select it,
and then single-clicking on it again. The state names are required to be unique and not
blank.
There are a few restrictions on the naming of states for SCT state machines. In the SCT
there are several reserved names that indicate special states. NXP describes them as
follows:
LPCXpresso v7 User Guide -
User Guide
All information provided in this document is subject to legal disclaimers
Rev. 7.4 — 16 September, 2014
© 2013-2014 NXP Semiconductors. All rights reserved.
113
NXP Semiconductors
LPCXpresso v7 User Guide
H_ALWAYS, L_ALWAYS
(split counter mode),
U_ALWAYS
(unified counter
mode) :
These are pseudo (or “virtual”) states which do not get mapped into a state
register value for the SCT state machine. It is just a graphical convenience
to represent events which are state independent, or in other words are
considered to be valid in all defined states
H_ENTRY, L_ENTRY
(counter split mode), U_ENTRY (unified counter mode)
These represent the initial value of the state register the SCT will have after
configuration. It is a useful feature as you might want the state machine
to start from a user defined condition. If not specified, the SCT will be left
in the default configuration after reset, that is, start from state zero. Note
that the tool will map the state numbering at its convenience, so use the
ENTRY feature if the starting state is of relevance for your application.
20.2.3 Resizing
The states can be resized in the diagram by selecting them and then dragging the handles
at their corners. If the full state name does not fit inside the state box it will show ellipsis
(...) at the end of the visible part of the name.
20.2.4 Deleting
States can be deleted from the Diagram Editor by selecting them and then either choosing
delete in the edit menu or by right-clicking on them and choosing delete from the context
menu.
20.2.5 Setting initial state
In the software state machine, the name of the initial state can be set in the State Machine
Settings view.
20.3 Transitions
Red State graphically represents transitions as arrows connecting two different states, or
looping back to the same state. They also have a text label describing the signal and any
actions associated with the transition. A transition is composed of five elements: a current
state, a next state, a signal, an action and a priority. When the state machine’s current
state matches the transition’s current state and the transition signal evaluates as true the
transition can occur.
It is possible for the conditions of multiple transitions to be satisfied at the same time. In
that case the state machine will transition to the next state defined by the transition with the
highest priority. The SCT performs all actions from all satisfied transitions. In the software
state machine only the actions associated with the highest priority transition will get called.
If the transitions have equal priority the transition which will get fired is undefined, but one
transition will occur.
20.3.1 Adding transitions
Transitions can be added in the Diagram Editor by selecting Transition from the pallet
on the left. First, select the starting state for the transition, and then select the end state
for the transition.
LPCXpresso v7 User Guide -
User Guide
All information provided in this document is subject to legal disclaimers
Rev. 7.4 — 16 September, 2014
© 2013-2014 NXP Semiconductors. All rights reserved.
114
NXP Semiconductors
LPCXpresso v7 User Guide
A transition can be added using the State table by entering a starting and finishing state
name in the last row of the table. When entering state names into the State Table, you are
able to select existing states from the drop-down list or type a name in. If the typed name
does not match an existing state then a new state is created.
The transition is represented in the diagram as an arrow. It has an information box
associated with it that indicates the signal and actions associated with it.
20.3.2 Deleting transitions
To delete a transition you can select either the transition’s information box or part of the
arrow representing the transition and choose delete from the edit menu or the right-click
menu.
You may delete a transition in the State Table view by selecting it and pressing the delete
button
in the State Table's toolbar.
20.3.3 Adding signals to a transition
Once a signal [116] has been built it can be added to a transition in the Diagram Editor
by right-clicking on the transition’s information box and choosing the signal from the Set
signal sub-menu. To change the signal, simply set it to a different signal.
In the State Table view you can change or set a signal by entering its name in the signal
column for that transition. If the signal you enter does not exist, one with that name will
be created.
20.3.4 Adding actions to a transition
The action associated with a transition can be set in the State Table in a similar way to
setting the signal.
In the Diagram Editor you can add individual action elements directly to a transition. If the
transition has no action already associated with it, a new action will be created to contain the
action elements. If there is already an action associated with this state then the elements
will be added to that action. Note that any other transitions using that action will also have
the new action elements added to them.
Action elements can also be removed from an action by right clicking on the transition
information box and choosing delete action element.
20.3.5 Appearance of transitions
Dragging the selection handles associated with a transition alters its visual appearance in
the state machine Diagram Editor. Selecting either the arrow representing the transition
or the label associated with it will display the selection handles and highlight the arrow.
The arrow initially has five selection handles — three larger ones and two smaller ones —
see Figure 20.1. Dragging the first handle onto another state will change the transition’s
current state — 1 in Figure 20.1. Similarly dragging the last handle onto another state will
change the transition’s next state — 4 in Figure 20.1. Dragging the middle handle will vary
how much the arrow bends — 3 in Figure 20.1. Drag one of the two smaller handles to
create a new bend in the line — 2 in Figure 20.1. You can create multiple bends in the
arrow by dragging the smaller selection handles.
To remove a bend in the arrow, drag the larger handle between two other large handles
and it will become a small handle again.
LPCXpresso v7 User Guide -
User Guide
All information provided in this document is subject to legal disclaimers
Rev. 7.4 — 16 September, 2014
© 2013-2014 NXP Semiconductors. All rights reserved.
115
NXP Semiconductors
LPCXpresso v7 User Guide
Figure 20.2. Selection handles on the transition arrow
20.4 Signals
A signal is a logical combination of inputs and outputs. Signals are constructed in the Signal
view. To create a new signal, single-click the Add signal button
in the Signal view.
This will add a new signal name to the list in the top half. You can rename the signal by
double-clicking on it or using the Rename button in the Signal view. No two signals should
have the same name.
The logic of the signal is set in the bottom half of the Signal view. Initially a signal will have
an entry saying (none). Right-clicking on that element will allow you to replace it with an
appropriate input or output. You can also combine elements using AND and OR.
Note that setting a signal will overwrite the selected element. If the signal name (in the
top half) is the active selection then the root of your signal will get replaced. If you just
want to set a sub-element (like one half of an AND condition for example) make sure
that the element you want to replace is the selected element. Elements that have children
(other subcomponents) will try to use the selected element as a child when it is added. For
example, if an input variable is selected in the bottom part of the Signal view and you apply
an AND to it, the input signal will be replaced by the AND, but one of the children of the
AND condition will be the original input variable.
The SCT has several constraints restricting what can be used as a signal. A signal may
only consist of one of the following:
• a single input or output
• a single timer match condition
• a logical combination of one match condition and one input or output
In the SCT you can specify the I/O condition for an input or output. Once you have added
the input or output to the signal, right-click on it again and choose an option from the I/O
LPCXpresso v7 User Guide -
User Guide
All information provided in this document is subject to legal disclaimers
Rev. 7.4 — 16 September, 2014
© 2013-2014 NXP Semiconductors. All rights reserved.
116
NXP Semiconductors
LPCXpresso v7 User Guide
condition menu to set whether the signal will be fired when it is high, low, on the rising
edge, or on the falling edge.
20.5 Actions
An action consists of a name and a set of action elements associated with it. Action
elements perform tasks like setting an output variable’s state or calling a function. A single
action may be associated with one or more transitions.
A new action can be created by pressing the Add action button
in the Action List,
typing a name into a transition’s action column in the State Table or by adding action
elements to a transition without an action in the Diagram Editor.
Once an action is created it can have elements added to it in the Action List by selecting it
in the top half and then using the right-click menu in the bottom half of the view.
In the SCT the following action elements are available:
• SET - sets an output pin to be high
• CLEAR - sets an output pin to be low
• TOGGLE - calls a set and a clear on an output pin so pin will toggle if conflict resolution
is appropriately set
• CALL - perform a special SCT action, like starting a timer or firing an interrupt
• CAPTURE - capture a timer’s value into the specified capture register
In a software state machine you can add the following elements:
• SET - sets an output variable to a value you enter in the value column in the bottom of
the Action List
• CALL - call a function you defined in the Output view
Action elements can be removed by selecting them and choosing remove action from the
right-click menu – take care to ensure that the element is selected and not just the Action
otherwise you may delete the entire action and all action elements associated with it.
Action elements may be added or removed from transitions in the Diagram Editor by
selecting the transition information box and using the right-click menu.
20.6 Inputs
Inputs are read-only elements that are used in signals. In the SCT these inputs are mostly
predefined and correspond to the pins used by the SCT. In a software state machine you
are free to define inputs of any type.
The names of the inputs can be freely set with the usual requirement of uniqueness. Any
items in the input view that are written in blue are not user editable items. They are not
editable in order to enforce limitations of the state machine. In the SCT for example, you
may change the name associated with input pin 3 but you can’t change its source or type,
nor can you delete it from the inputs.
20.6.1 SCT inputs
Inputs for the SCT have the following types:
LPCXpresso v7 User Guide -
User Guide
All information provided in this document is subject to legal disclaimers
Rev. 7.4 — 16 September, 2014
© 2013-2014 NXP Semiconductors. All rights reserved.
117
NXP Semiconductors
LPCXpresso v7 User Guide
• bool — a binary input from a pin. The pin numbers are defined in the source and are
named CTIN_n, where n is the pin number.
• const int — a constant integer to be used in match conditions, its source is the integer
value it is to be set to.
• Match Low (or High, or Unified) — a match condition which compares the timer
specified in its type name with the const int input variable named in its source.
New const ints and Match ... conditions can be added in the Input view, but the input
pins are fixed.
20.6.2 Software state machine inputs
In the software state machine the inputs can only be of type variable. The C type of
the variable is defined in the source column. It should be noted that these variables are
considered as constants that can’t be directly set by the state machine.
20.7 Outputs
Outputs are elements of the state machine that may be used in actions.
20.7.1 SCT outputs
In the SCT they may have the following types:
• bool — a binary output pin. Its pin number is defined by its source name with CTOUT_n
corresponding to pin number n. An initial value can be set for the output by choosing a
value in the preload column.
• function — special SCT specific calls
• Capture register — a capture register to capture the timer indicated by its source
As with the inputs, most of the pre-populated outputs are not editable except for their
names. Additional outputs can be added using the Add output button
view. These extra outputs are limited to be Capture registers or an IRQ.
in the Output
• To add another interrupt request, add a new output and set its type to function and its
source to IRQ.
• To add a capture register, add a new output and set its type to
choose which timer to capture.
Capture register
and
When using IRQs with the SCT, care must be taken to correctly identify the event
associated with an IRQ. When the state machine fires an IRQ it is handled by the SCT
IRQ handler — e.g. void SCT_IRQHandler (void). The handler must use the SCT event
th
flag register LPC_SCT->EVFLAG to identify which event raised the interrupt. The i bit of this
th
register corresponds to the i event and is 1 if that event has occurred since reset or since
a 1 was last written to it. Setting a bit to 1 will clear it.
The code generated by Red State includes macro definitions linking IRQs with events.
These take the form of your IRQ name prefixed with SCT_IRQ_EVENT_. To acknowledge the
interrupt, the handler should clear the corresponding bit as follows:
LPC_SCT->EVFLAG = (1 << SCT_IRQ_EVENT_samplingComplete);
LPCXpresso v7 User Guide -
User Guide
All information provided in this document is subject to legal disclaimers
Rev. 7.4 — 16 September, 2014
© 2013-2014 NXP Semiconductors. All rights reserved.
118
NXP Semiconductors
LPCXpresso v7 User Guide
Where SCT_IRQ_EVENT_samplingComplete is a generated #define in the sct_fsm.h made by
the parser file corresponding to an IRQ named samplingComplete in the state diagram.
Since there is not necessarily a one-to-one relationship between events and transitions
(multiple transitions may be handled by a single event) it can be appropriate to use the
same IRQ on multiple transitions. However, if the parser assigns IRQs with the same name
to different events, the macro may get defined twice to different values. For example you
may find the following in sct_fsm.h:
#define SCT_IRQ_EVENT_samplingComplete
#define SCT_IRQ_EVENT_samplingComplete
(5)
(6)
In this case, add a new IRQ output in Red State and replace one of the existing IRQs in
the state diagram with the new one.
20.7.2 Software state machine outputs
In a software state machine you can have the following types:
• variable — like the input generic variables their type is entered in the source column. A
preload value can be assigned to initialize the variable.
• function — a function to be called. It is defined in the action header file and the body
should be written in the main action C file. Currently passing of parameters to the function
is not supported.
20.7.3 Preset values
Variables in both the SCT and software state machine can have a preset value. You can
set a preset value by entering it into the preset column in the Output view. Variables are
initialized to their preset values when the state machine is reset.
Note that preload values are not type checked by the code generator. The content of the
preload cell will be directly entered into the generated code as the RHS of an assignment.
For example, to initialize an output of type char with the character a you need to enter 'a'
in the preload cell including the single quotes, whereas to initialize an int you would simply
directly enter a number e.g. 1337 without any quotes, etc.
LPCXpresso v7 User Guide -
User Guide
All information provided in this document is subject to legal disclaimers
Rev. 7.4 — 16 September, 2014
© 2013-2014 NXP Semiconductors. All rights reserved.
119
NXP Semiconductors
LPCXpresso v7 User Guide
21. Red State : Limitations
Red State uses NXP’s SCT tool parser to generate the configuration code for the SCT.
NXP’s documentation notes the following limitations with the parser:
The ultimate goal of the tool is to allow specifying every detail of a complex
SCT design. For the time being, the following limitations are present:
• The SCT global configuration (like the operating mode, the clocks
configuration) has still to be specified manually within the application
code. All specified match and acquired capture values are relative to
those global clock settings
• The conflict resolution register setup is not fully included in the state
machine configuration. The default hardware setup after reset is to take
no action in case of conflicts for events trying to drive the same output
at the same time.
• In the current implementation, it is possible to choose the toggle
action for those outputs which are set and cleared simultaneously
at a specific point in time. This is done by specifying the pin=toggle
attribute in the FZM drawing.
• In case of multiple events driving the same outputs, the programmer
needs to manually modify the generated code to override the current
settings and program the conflict resolution register as desired, as this
feature is not included in the current tool version (1.x)
• The conflict enable register is also not programmed and needs to be
written by the programmer if it is required to trigger a no change conflict
interrupt
• DMA0 and DMA1 support is potentially included in the tool and the
parser, but it has not been extensively tested
—SCT-Tools FSM Designer for the State Configurable Timer, Rev. 2.0,
09 June 2011, NXP Semiconductors
LPCXpresso v7 User Guide -
User Guide
All information provided in this document is subject to legal disclaimers
Rev. 7.4 — 16 September, 2014
© 2013-2014 NXP Semiconductors. All rights reserved.
120
NXP Semiconductors
LPCXpresso v7 User Guide
22. Red State : Frequently Asked Questions
22.1 How do I migrate from a Red State project created in Red
Suite / LPCXpresso v4 to one created in this version
The code generated by Red State in the current version is different from that generated
within Red Suite / LPCXpresso v4. It was updated to allow multiple state machines to be
created in the same project. Each state machine defines a prefix for its key data structures
and functions to ensure that there are no conflicts between them.
The prefix is set in the State Machine Setting view — see number 7 in Figure 20.1.
This section details how to update an existing project to work with the new prefix naming
convention. We assume that you are working from an existing project, with a software
state machine generated by Red State under Red Suite 4. We will use the refactoring
tools to update the old code. This refactoring should be done before regenerating the
state machine code in the LPCXpresso IDE. This procedure is only required once and is
designed to ensure that any code you have written that interacts with the state machine
uses the new naming scheme.
Once these steps have been completed your existing project will be compatable with Red
State in newer versions of LPCXpresso. Be sure to back up your code before applying
these refactorings.
Note : Red State projects created using Red Suite / LPCXpresso after v4 do not need to
be converted in this manner.
Step 1 — Choose a new prefix
Choose a short prefix to use for your state machine. This prefix will be applied to various
variables and functions. Any two statemachines with the same prefix may conflict with each
other. A prefix can be blank. If the prefix is not blank, an underscore character will be
appended to it. For example if the prefix mySM was chosen, the enum containing the state
ids would be named mySM_state. If a blank prefix was chosen the same generated enum
would be named state.
Note
In this refactoring guide we will assume a prefix named
may choose to use a different prefix.
mySM
was used. You
Step 2 — Refactoring the state data structures
Open the header file corresponding to the main output file. The main output file’s name
is listed in the State Machine Setting view. This header file contains declarations for the
enum rs_state; two structs : inpinputSignal and redStateOutput as well as several function
declarations. In this step we need to refactor the name of the enum rs_state as well as the
names representing the different states, STA_STATE_1 for example.
By using the the built-in refactoring tools we can update all references to the elements we
want to change in one go.
Warning
The refactoring tool may attempt to apply the refactoring to all global elements
in your workspace that match the signature of the element being refactored.
Use the refactoring preview option ( CTRL + ENTER) to ensure that the
refactoring is only applied to the correct projects.
LPCXpresso v7 User Guide -
User Guide
All information provided in this document is subject to legal disclaimers
Rev. 7.4 — 16 September, 2014
© 2013-2014 NXP Semiconductors. All rights reserved.
121
NXP Semiconductors
• The enum
LPCXpresso v7 User Guide
rs_state
needs to be renamed to mySM_state.
1. Highlight the text rs_state in the main output header file.
2. Choose the menu item Refactor -> Rename.
3. Enter the new name mySM_state
4. Press CTRL + ENTER to see the refactor preview and apply the change to the current
project.
• For each element of the enum mySM_state rename their prefix from STA_ to
same refactoring tool. For example STA_STATE_1 would become S_STATE_1.
S_
using the
• Note that this step is not required if you do not use the state enum directly in the code
you have written: that is, you do not use the getState() function. These names are
updated any time the code is generated.
Step 3 — Refactor the input and output structs
The input and output struct in the main output header file generated in Red Suite 4 have
prefixes such as i_ on inputs and v_ on outputs. These have been removed in subsequent
versions of LPCXpresso IDE. Use the rename refactoring tool as before to remove these
prefixes from your code; for example, i_reset would become reset and v_timer would
become timer.
Step 4 — Refactor the input and output typedef
Use the refactoring tool as before to rename the following
• Rename the typedef for the input from inputSignal to mySM_inputs.
• Rename the typedef for the output from redStateOutput to mySM_outputs.
Step 5 — Refactor the preload function and the getter functions
Use the refactoring tool as before to rename the following functions
• Rename the preload function from preload to mySM_preload.
• Rename the function getState to mySM_getState.
• Rename the function getInput to mySM_getInput.
• Rename the function getOutput to mySM_getOutput.
Step 6 — Refactor the action function names
In Red Suite / LPCXpresso v4 the function names in the ..._action.h and ..._action.c
files were prefixed with act_. In the current version of LPCXpresso IDE these functions use
the same prefix used elsewhere. For example act_GreenOn would become mySM_GreenOn.
Use the refactoring tool to rename the act_... fuctions in the ..._actions.h file, replacing
the act_ prefix with your new prefix, e.g. smMS_.
Step 7 — Generate code in the current version of LPCXpresso IDE
These refactoring should now have made your existing code compatable with the Red
State code generated in this version of LPCXpresso IDE. The final step is to generate the
state machine code. This code generation can be perfomred by right-clicking in the State
LPCXpresso v7 User Guide -
User Guide
All information provided in this document is subject to legal disclaimers
Rev. 7.4 — 16 September, 2014
© 2013-2014 NXP Semiconductors. All rights reserved.
122
NXP Semiconductors
LPCXpresso v7 User Guide
machine diagram editor and choosing Generate code, or by pressing the Generate code
button in the State Table view.
Review the generated files to ensure that the new names match those you manually
refactored to.
LPCXpresso v7 User Guide -
User Guide
All information provided in this document is subject to legal disclaimers
Rev. 7.4 — 16 September, 2014
© 2013-2014 NXP Semiconductors. All rights reserved.
123
NXP Semiconductors
LPCXpresso v7 User Guide
23. Appendix A – File Icons
Table 23.1. File Icons
Icon
Meaning
C language source file.
C language header file.
Source folder (generally use for source files, including headers)
Folder (use for none-source files)
Source folder with modified build properties
Source file with modified build properties
Project Makefile. Note that the LPCXpresso IDE may automatically
generate these.
C language source file that has been excluded from the project build.
Hollowed out character in icon.
General text file. Often used for files such as linker script files which
end with the extension ‘.ld’.
The blue double arrows at the top of the icon denote that this
particular source file has different project build properties than the
rest of the project.
The orange/gold ‘storage drive’ denotes that this file is connected
to a CVS repository.
The right arrow denotes that the file or directory has been modified
locally and may need committing to the CVS repository. I.e. The
local copy is more up to date than the repository.
This is an executable file.
Directory containing executables.
C Project Directory (Project Explorer View)
C Project Directory linked to a CVS repository. (Project Explorer
View)
LPCXpresso v7 User Guide -
User Guide
All information provided in this document is subject to legal disclaimers
Rev. 7.4 — 16 September, 2014
© 2013-2014 NXP Semiconductors. All rights reserved.
124
NXP Semiconductors
LPCXpresso v7 User Guide
24. Appendix B – Glossary of Terms
Table 24.1. Explanation of the meaning of terms used in this document.
Term
Build artifact
Code Red Technologies
Debug Target
DWARF
ELF
GCC
LPC-Link
LPCXpresso IDE
Newlib
Project
Perspective
Red Probe™
Red Probe+™
Red Suite™
Red Suite NXP Edition
Redlib™
Semihosting
SWD
SWV (Red Trace™)
View
Workspace
LPCXpresso v7 User Guide -
User Guide
Meaning
The ‘Build Artifact’ is the final product of all the build steps (with the exception of any
post dump files produced with ‘objdump’). The Build Artifact is correctly set as the
name of a new project by default, but may be changed manually. This can be useful,
if for example you have copied an existing project (cloned it) and you want the new
project executable to have the name of your new copy of the project.
Company responsible for Red Suite and LPCXpresso IDEs. Acquired by NXP
Semiconductors in April 2013.
The development board (evaluation board) or debug probe connected to a board.
Debug with Attributed Record Format. Developed along with ELF but actually
independent of the Object file format. DWARF is a format defined for carrying debug
information in object files.
Executable and Linking Format. This is the object code file format used by our
development toolchain and most microprocessor toolchains.
GNU Compiler Collection. C/C++ compiler and related tools used by LPCXpresso
IDE.
Low end debug probe for NXP microcontrollers, provided integrated into the NXP
LPCXpresso development boards
A software development environment for creating applications for NXP’s range
of ARM based ‘LPC’ range of Microcontrollers (MCUs). Originally a reduced
functionality version of Red Suite for specific NXP microcontrollers.
Open source C99 runtime library. Can optionally be used instead of Redlib for C
projects, and required for C++ projects.
A collection of source files and settings
In the LPCXpresso IDE, a perspective is a particular collection of ‘Views’ that are
grouped together to be suitable for a particular use. For example the ‘Develop’
perspective, the ‘C/C++ programming’ perspective and the ‘Debug’ perspective.
Debug probe produced by Code Red Technologies that is compatible with both SWD/
SWV and JTAG debug targets. For Cortex-Mx based devices, it will normally default
to using SWD/SWV. For other ARM processors it will default to using JTAG.
Higher performance version of Red Probe.
The Code Red Technologies IDE (Integrated Development Environment) based on
Eclipse with extensions for embedded development. Supported MCUs from a number
of vendors. No longer in development.
Version of Red Suite for NXP microcontrollers only, with variants with 256KB
and 512KB code download limits. Acted as a low cost upgrade path for the free
LPCXpresso IDE. No longer in development
Proprietary non-GNU C90 runtime library (with some C99 extensions). Generally
provides reduced code size compared to Newlib.
The ability to use IO on your debugger host system for your target embedded system.
For example a ‘printf’ will appear in the console window of the debugger.
Serial Wire Debugging (Single Wire Debugging).This is a debug connection
technology available on Cortex-M based parts that allows debug through just 2-wires
unlike 6 for JTAG.
Serial Wire Viewing. This is an additional feature to SWD that allows the LPCXpresso
IDE to give real-time tracing visualization and views from Cortex-M3/M4 based
devices. SWV is only available if SWD is being used.
A ‘View’ is a window in the LPCXpresso IDE that shows a particular file or activity.
A ‘Perspective’ is the layout of many ‘Views’.
The LPCXpresso IDE organizes groups of projects into a ‘Workspace’. A workspace
is stored as a directory on your host PC and has subdirectories containing individual
projects.
All information provided in this document is subject to legal disclaimers
Rev. 7.4 — 16 September, 2014
© 2013-2014 NXP Semiconductors. All rights reserved.
125