1
Operational Qualification/
Performance Qualification
for HPLC Instruments
Operating Instructions
Version:
6.8
Date:
Oktober 2008
© 2008 DIONEX
Doc.: HPLC_OQ_PQ_E_Manual.doc
OQ and PQ Operating Instructions
OQ and PQ Operating Instructions
Table of Contents
1
How to Use this Manual....................................................................................1
2
Introduction .......................................................................................................3
2.1 Defining the Limits .......................................................................................................................3
2.1.1
Operational Qualification (OQ)...............................................................................................3
2.1.2
Performance Qualification (PQ) .............................................................................................3
2.1.3
System Suitability Check (SSC; also: System Suitability Test, SST).....................................3
2.2 Basic Requirements for Successful OQ and PQ ......................................................................4
2.3 Overview of the Checks...............................................................................................................6
2.3.1
UV Detectors Using Analytical Flow Cells..............................................................................6
2.3.2
UV Detectors Using Non-Analytical Flow Cells................................................................... 11
2.3.3
Autosamplers ...................................................................................................................... 13
2.3.4
Pumps ................................................................................................................................. 18
2.3.5
Thermostatted Column Compartments and Column Ovens............................................... 22
2.3.6
Fluorescence Detectors ...................................................................................................... 24
2.3.7
Refractive Index Detectors .................................................................................................. 25
2.3.8
Evaporative Light Scattering Detectors............................................................................... 25
3
Process ............................................................................................................27
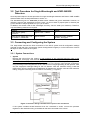
3.1 General Test Procedure............................................................................................................ 27
3.2 Test Procedure for Single Wavelength and VWD-3400RS Detectors .................................. 29
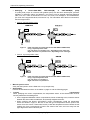
3.3 Connecting and Configuring the System ............................................................................... 29
3.3.1
System Connections ........................................................................................................... 29
3.3.2
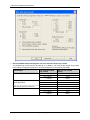
Configuration ....................................................................................................................... 31
3.4 Preparations .............................................................................................................................. 34
3.4.1
Preparing the HPLC System ............................................................................................... 34
3.4.2
Checking the Fluidics .......................................................................................................... 34
3.5 Preparing Chromeleon ............................................................................................................. 35
3.5.1
Template Structure.............................................................................................................. 35
3.5.2
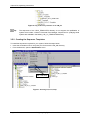
Creating the Sequence Templates...................................................................................... 36
3.5.3
Adapting the Report and Method ........................................................................................ 39
3.5.4
Device Names ..................................................................................................................... 40
3.6 Performing the Checks............................................................................................................. 43
3.7 Check Time ................................................................................................................................ 44
3.8 Evaluating the Sequences........................................................................................................ 44
3.9 Repeating Checks ..................................................................................................................... 44
4
Special Test Procedures for Individual Modules..........................................45
4.1
4.2
Introduction ............................................................................................................................... 45
Dionex VWD-3x00 Detectors: Noise and Drift with Dummy Flow Cells .............................. 45
HPLC_OQ_PQ_E_Manual.doc – Version: 6.8 dated Oktober 2008
Contents: I of IV
OQ and PQ Operating Instructions
4.3 Dionex Autosamplers: Sample Temperature Accuracy........................................................ 45
4.3.1
Test Procedure.................................................................................................................... 45
4.3.2
Connecting and Configuring the System............................................................................. 46
4.3.3
Performing the Check.......................................................................................................... 47
4.3.4
Duration ............................................................................................................................... 47
5
Procedures ......................................................................................................49
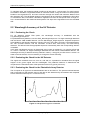
5.1 Baseline Noise, Drift, and Lamp Intensity of the UV Detector.............................................. 49
5.1.1
Theory ................................................................................................................................. 49
5.1.2
Performing and Evaluating the Checks............................................................................... 49
5.2 Wavelength Accuracy of the UV Detector .............................................................................. 50
5.2.1
Performing the Check.......................................................................................................... 50
5.2.2
Evaluating the Check for the UV Detector .......................................................................... 50
5.2.3
Evaluating the Check for the Photodiode Array Detector ................................................... 50
5.2.4
Evaluating the Check for Two-Channel Detectors and the UVD 320S............................... 51
5.2.5
Evaluating the Check for Single Wavelength and VWD-3400RS Detectors ...................... 51
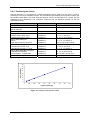
5.3 Linearity of the UV Detector..................................................................................................... 51
5.3.1
Theory ................................................................................................................................. 51
5.3.2
Performing and Evaluating the Check................................................................................. 52
5.4 Precision of the Injection Volume ........................................................................................... 52
5.4.1
Theory ................................................................................................................................. 52
5.4.2
Performing the Check.......................................................................................................... 52
5.5 Carry-over by the Autosampler ............................................................................................... 54
5.5.1
Theory ................................................................................................................................. 54
5.5.2
Performing the Check.......................................................................................................... 54
5.6 Linearity of the Injection Volume............................................................................................. 54
5.6.1
Theory ................................................................................................................................. 54
5.6.2
Performing the Check.......................................................................................................... 55
5.7 Sample Temperature Accuracy of Autosamplers.................................................................. 56
5.7.1
Theory ................................................................................................................................. 56
5.7.2
Performing the Check.......................................................................................................... 56
5.8 Flow Precision........................................................................................................................... 56
5.8.1
Theory ................................................................................................................................. 56
5.8.2
Performing the Check.......................................................................................................... 56
5.9 Solvent Composition of the Gradient Pump: Accuracy, Precision, and Ripple ................. 57
5.9.1
Theory ................................................................................................................................. 57
5.9.2
Performing the Checks........................................................................................................ 57
5.9.3
Performing the Checks for the Dionex P680 and UltiMate 3000 Pumps ............................ 58
5.9.4
Evaluating the Check .......................................................................................................... 58
5.10 Temperature Accuracy of the Column Compartment ........................................................... 59
5.10.1 Theory ................................................................................................................................. 59
5.10.2 Performing the Check.......................................................................................................... 59
5.11 Baseline Noise and Signal Height of the Fluorescence Detector ........................................ 59
5.11.1 Theory ................................................................................................................................. 59
5.11.2 Performing the Check.......................................................................................................... 60
Contents: II of IV
HPLC_OQ_PQ_E_Manual.doc – Version: 6.8 dated Oktober 2008
OQ and PQ Operating Instructions
5.12 Wavelength Accuracy of the Fluorescence Detector............................................................ 60
5.12.1 Performing the Check.......................................................................................................... 60
5.12.2 Remarks on the Manufacturer Specification ....................................................................... 60
5.13 Baseline Noise and Drift of the RI Detector ........................................................................... 61
5.13.1 Theory ................................................................................................................................. 61
5.13.2 Performing and Evaluating the Check................................................................................. 61
5.14 Linearity of the RI Detector ...................................................................................................... 61
5.14.1 Theory ................................................................................................................................. 61
5.14.2 Performing and Evaluating the Check................................................................................. 61
5.15 Baseline Noise of the ELS Detector ........................................................................................ 62
5.15.1 Theory ................................................................................................................................. 62
5.15.2 Performing and Evaluating the Check................................................................................. 62
6
Troubleshooting..............................................................................................63
6.1 General Notes ............................................................................................................................ 63
6.2 Failure of Individual Checks .................................................................................................... 63
6.2.1
UV Detector ......................................................................................................................... 63
6.2.2
Autosampler ........................................................................................................................ 64
6.2.3
Pump ................................................................................................................................... 64
6.2.4
RF2000 Fluorescence Detector .......................................................................................... 64
6.2.5
RI Detector .......................................................................................................................... 65
6.2.6
ELS Detector ....................................................................................................................... 65
7
PGM Files.........................................................................................................67
7.1
7.2
7.3
7.4
7.5
7.6
7.7
7.8
7.9
7.10
7.11
7.12
7.13
Wavelength Accuracy of the Photodiode Detector ............................................................... 67
Baseline Noise, Drift, and Lamp Intensity of the UV Detector.............................................. 70
Linearity of the UV Detector..................................................................................................... 72
Precision of the Injection Volume ........................................................................................... 74
Carry-over by the Autosampler and Linearity of the Injection Volume ............................... 76
Sample Temperature Accuracy ............................................................................................... 78
Solvent Composition of a Gradient Pump: Accuracy, Precision, and Ripple) ................... 80
Temperature Accuracy of a Column Compartment............................................................... 82
Baseline Noise and Signal Height of the Fluorescence Detector ........................................ 84
Wavelength Accuracy of the Fluorescence Detector............................................................ 86
Baseline Noise and Drift of the RI Detector ........................................................................... 88
Linearity of the RI Detector ...................................................................................................... 90
Baseline Noise of the ELS Detector ........................................................................................ 92
8
Example Report...............................................................................................95
HPLC_OQ_PQ_E_Manual.doc – Version: 6.8 dated Oktober 2008
Contents: III of IV
OQ and PQ Operating Instructions
Contents: IV of IV
HPLC_OQ_PQ_E_Manual.doc – Version: 6.8 dated Oktober 2008
OQ and PQ Operating Instructions
1 How to Use this Manual
The layout of this manual is designed to provide quick reference to the sections of interest to the user.
However, we recommend that you review the manual thoroughly before starting Operational or
Performance Qualification in order to obtain full understanding of the procedure.
This manual is provided "as is." Every effort has been made to supply complete and accurate
information and all technical specifications and programs have been developed with the utmost care.
However, Dionex assumes no responsibility and cannot be held liable for any errors, omissions,
damage, or loss that might result from any use of this manual or the information contained therein. We
appreciate your help in eliminating any errors that may appear in this document.
At various points throughout the manual message of particular importance are indicated by the following
symbols whose relevance is as follows:
Tip:
Indicates general information to help obtain optimum performance of the instrument.
The information contained in this document is subject to change without notice.
CHROMELEON®, Summit® HPLC, and UltiMate 3000™ are registered trademarks of Dionex Corp. Any
other mentioned trade or company names are subject to the copyright and the property and trademark
rights of the respective companies.
All rights reserved including those for photomechanical reproduction and storage on electronic media.
Without the written permission of Dionex, no part of this publication may be reproduced in any form
(by means of photocopy, microfilm, or any other process) for any purpose or processed, copied,
transmitted, or distributed in any other form, independent from the means, electronic or mechanical,
that is used.
HPLC_OQ_PQ_E_Manual.doc – Version: 6.8 dated Oktober 2008
Page 1 of 95
OQ and PQ Operating Instructions
Page 2 of 95
HPLC_OQ_PQ_E_Manual.doc – Version: 6.8 dated Oktober 2008
OQ and PQ Operating Instructions
2 Introduction
The increasing number of standards and official regulations provide evidence that it is extremely
important to monitor the used instruments and to make sure that they work as intended if you want to
achieve reliable analytical results. To make the results transparent, quality management according to
ISO 9000 and following monitors and documents the quality of the equipment at different times.
For a description of the Operational Qualification (OQ) and Performance Qualification (PQ)
procedures, refer to the sections below.
2.1 Defining the Limits
According to "The development and application of guidance on equipment qualification of analytical
instruments" of P. Bedson and M. Sargent [Accred. Qual. Assur. (1996) 1: 265 - 274] the following
definitions apply:
2.1.1 Operational Qualification (OQ)
The purpose of Operational Qualification is to prove and document that an analytical system functions
according to its operating specification while the specific environmental conditions are taken into
account. In his specification, the supplier must therefore define exactly the conditions that must be
observed. With varying conditions, e.g. different ambient temperatures, higher limits must be used.
Usually, Operational Qualification is only performed directly after a new device has been installed.
2.1.2 Performance Qualification (PQ)
The purpose of Performance Qualification is to prove and document that an analytical system
functions according to a specification that is suitable for the system's routine operation. As a system is
subject to wear when being operated, it may happen that the supplier's specification is no longer met.
This means: The same procedures are used but the tolerances used for Performance Qualification
are less restrictive than those used for Operational Qualification are.
Performance Qualification is usually performed after repair or regular system service procedures have
been performed.
Using the same procedures for OQ and PQ simplifies the handling.
2.1.3 System Suitability Check (SSC; also: System Suitability Test, SST)
The purpose of SSC is to prove and document that the necessary limits are met for a specific
measuring application. The specific conditions required for that application, e.g., solvents, column
material, and temperature, must be taken into account. The check can be developed by the supplier
on request. However, it is not part of the test procedures below.
Do not use limits that are more restrictive than those used for Performance Qualification are.
HPLC_OQ_PQ_E_Manual.doc – Version: 6.8 dated Oktober 2008
Page 3 of 95
OQ and PQ Operating Instructions
2.2 Basic Requirements for Successful OQ and PQ
As described in section 2.1, OQ and PQ are system-specific procedures. The procedures described
below apply to the following instruments:
Instrument
Pumps
UV Detectors
Page 4 of 95
Supported Model
Dionex ISO-3100A (UltiMate 3000)
Dionex LPG-3400A(B) (UltiMate 3000)
Dionex LPG-3400M(B) (UltiMate 3000)
Dionex DGP-3600A(B) (UltiMate 3000)
Dionex DGP-3600M(B) (UltiMate 3000)
Dionex HPG-3200A (UltiMate 3000)
Dionex HPG-3200M (UltiMate 3000)
Dionex HPG-3200RS (UltiMate 3000)
Dionex HPG-3400A (UltiMate 3000)
Dionex HPG-3400M (UltiMate 3000)
Dionex HPG 3400RS (UltiMate 3000)
Dionex P680
Dionex P580
Dionex M480
Dionex M300
Agilent 1100/1200 series G1310A
Agilent 1100/1200 series G1311B
Agilent 1100/1200 series G1311A
Agilent 1100/1200 series G1312A
Agilent 1100/1200 series G1312B
Pump module of the Waters Alliance 2690 Separation Module
TSP P2000
TSP P4000
Shimadzu LC-2010 pump
Shimadzu LC-10ATvp
Shimadzu LC-10ADvp
Dionex DAD-3000(RS) (UltiMate 3000)
Dionex MWD-3000(RS) (UltiMate 3000)
Dionex VWD-3100 (UltiMate 3000)
Dionex VWD-3400RS (UltiMate 3000)
Dionex PDA-3000 (UltiMate 3000)
Dionex PDA-100
Dionex PDA-100U
Dionex AD25
Dionex UVD 340U
Dionex UVD 170U
Dionex UVD 340S
Dionex UVD 170S
Dionex UVD 160S
Dionex UVD 320S
Agilent 1100/1200 series G1315A
Agilent 1100/1200 series G1315B
Agilent 1100/1200 series G1315C
Agilent 1100/1200 series G1315D
Agilent 1100/1200 series G1314A
Agilent 1100/1200 series G1314B
Agilent 1100/1200 series G1314C
Agilent 1100/1200 series G1365A
Agilent 1100/1200 series G1365B
Agilent 1100/1200 series G1365C
Agilent 1100/1200 series G1365D
Waters PDA996 Diode Array Detector
Waters PDA2996 Diode Array Detector
Waters 2487 Dual Lambda Absorbance Detector
HPLC_OQ_PQ_E_Manual.doc – Version: 6.8 dated Oktober 2008
OQ and PQ Operating Instructions
Instrument
UV Detectors
(Cont'd)
Samplers
Column Compartments
Fluorescence Detectors
Refractive Index
Detectors
Evaporative Light
Scattering Detector
Supported Model
TSP UV1000 Single Lambda Detector
TSP UV2000 Dual Lambda Detector
TSP UV3000 (analog and digital data acquisition)
TSP UV6000 PDA
Shimadzu LC-2010 SPD
Shimadzu SPD-10Avp
Shimadzu SPD-10AVvp
Dionex ACC-3000(T) (UltiMate 3000)
Dionex WPS-3000(T)RS (UltiMate 3000)
Dionex WPS-3000(T)SL (UltiMate 3000)
Dionex WPS-3000(T)PL (UltiMate 3000)
Dionex WPS-3000TBPL Analytical (UltiMate 3000)
Dionex ASI 100
Dionex GINA 50
Dionex GINA 160
Agilent 1100/1200 series G1313A
Agilent 1100/1200 series G1329A
Agilent 1100/1200 series G1329B
Agilent 1100/1200 series G1367A
Agilent 1100/1200 series G1367B
Agilent 1100/1200 series G1367C
Sampler module of the Waters Alliance 2690 Separation Module
Waters WISP 717plus
TSP AS3000/AS3500
Shimadzu LC-2010 autosampler
Shimadzu SIL-HTA
Shimadzu SIL-HTC
Shimadzu SIL-10ADvp
Dionex ACC-3000(T) (UltiMate 3000)
Dionex TCC-3000RS (UltiMate 3000)
Dionex TCC-3000SD (UltiMate 3000)
Dionex TCC-3000 (UltiMate 3000)
Dionex TCC-3100 (UltiMate 3000)
Dionex TCC-3200(B) (UltiMate 3000)
Dionex STH 585
Dionex TCC-100
Agilent 1100/1200 series G1316A
Agilent 1100/1200 series G1316B
Column compartment module of the Waters Alliance 2690 Sep. Module
TSP AS3000/AS3500 (optional)
Shimadzu LC-2010 column compartment
Shimadzu CTO-10Avp
Shimadzu CTO-10ACvp
Shimadzu CTO-10ASvp
Dionex RF2000
Dionex RF1002
Shodex RI-101
Agilent 1100/1200 series G1362A
Polymer Laboratories ELS2100
If you use other instruments or a different system configuration, adapt the procedures correspondingly
( section 3.5).
When qualifying systems that include a Dionex FLM-3x00 Flow Manager, use the
NANO_CAP_LC_Templates (not the HPLC_TEMPLATES).
In addition, Chromeleon 6.50 SP10, 6.60 SP6, or 6.70 SP3 is required.
HPLC_OQ_PQ_E_Manual.doc – Version: 6.8 dated Oktober 2008
Page 5 of 95
OQ and PQ Operating Instructions
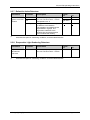
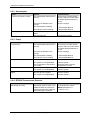
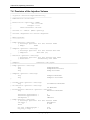
2.3 Overview of the Checks
The following tables provide an overview of the parameters to be checked and list the recommended
PQ limits for each HPLC module.
2.3.1 UV Detectors Using Analytical Flow Cells
Instrument
Parameter
Description
VWD-3100,
VWD-3400RS
(analytical flow
cell) (2)
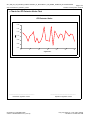
Baseline Noise
Pure water is pumped through the
flow cell. The flow rate is 1 ml/min.
Wavelength: 254 nm
UVD 340S,
UVD 170S,
UVD 340U,
UVD 170U
(analytical flow
cell)(2)
DAD-3000(RS) /
MWD-3000(RS)
(analytical flow
cell)
Drift
OQ
PQ
0.025 mAU 0.050 mAU
0.3 mAU/h
0.3 mAU/h
Lamp Intensity
The lamp intensity is determined at
a measuring wavelength of 230 nm.
> 50 %
> 40 %
Wavelength
Accuracy
Caffeine is injected using water as
solvent. The flow rate is 1 ml/min.
The characteristic maximum of
caffeine is determined at 272.5 nm
and compared to its theoretical
value.
± 2.0 nm
± 2.0 nm
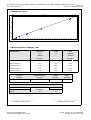
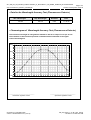
Linearity
Five caffeine solutions are injected
in different concentrations.
Concentration and peak area are
represented in a graph. The
regression coefficient of the
resulting line and the deviations
from it indicate the linearity.
r ≥ 99.97 % r ≥ 99.90 %
RSD ≤ 3 % RSD ≤ 3 %
(up to
2.5 AU)
(up to
2.5 AU)
Pure water is pumped through the
flow cell. The flow rate is 1 ml/min.
Wavelength: 254 nm
0.03 mAU
0.05 mAU
0.8 mAU/h
2.0 mAU/h
> 500000
counts/s
> 400000
counts/s
Wavelength
Accuracy
Pyrene is injected, using methanol
± 0.75 nm
as solvent. The flow rate is 1 ml/min.
The characteristic maximum of
pyrene is determined at 333 nm and
compared to its theoretical value.
± 0.75 nm
Linearity
Five caffeine solutions are injected
in different concentrations.
Concentration and peak area are
represented in a graph. The
regression coefficient of the
resulting line and the deviations
from it indicate the linearity.
r ≥ 99.98 %
RSD ≤ 5 %
(up to
1.5 AU)
r ≥ 99.90 %
RSD ≤ 5 %
(up to
1.5 AU)
Baseline Noise
Pure water is pumped through the
flow cell. The flow rate is 1 ml/min.
Wavelength: 254 nm.
0.03 mAU
0.10 mAU
1.0 mAU/h
1.0 mAU/h
Baseline Noise
Drift
Lamp Intensity
Drift
Wavelength
Accuracy
Page 6 of 95
Limits(1)
Pyrene is injected, using methanol
± 1.0 nm
as solvent. The flow rate is 1 ml/min.
The characteristic maximum of
pyrene is determined at and 333 nm
and compared to its theoretical
value.
± 1.0 nm
HPLC_OQ_PQ_E_Manual.doc – Version: 6.8 dated Oktober 2008
OQ and PQ Operating Instructions
Instrument
Parameter
DAD-3000(RS) /
MWD-3000(RS)
(analytical flow
cell)
(Cont'd)
Linearity
PDA-3000,
PDA 100,
PDA-100U
Baseline Noise
Description
Five caffeine solutions are injected
in different concentrations.
Concentration and peak area are
represented in a graph. The
regression coefficient of the
resulting line and the deviations
from it indicate the linearity.
Limits(1)
OQ
PQ
r ≥ 99.95 % r ≥ 99.90 %
RSD ≤ 5 % RSD ≤ 5 %
(up to
1.5 AU)
(up to
1.5 AU)
0.03 mAU
0.10 mAU
Drift
1.0 mAU/h
1.0 mAU/h
Lamp Intensity
>1300000 >1000000
0 counts/s 0 counts/s
Pure water is pumped through the
flow cell. The flow rate is 1 ml/min.
Wavelength: 254 nm.
Wavelength
Accuracy
Pyrene is injected using methanol
± 1.0 nm
as solvent. The flow rate is 1 ml/min.
The characteristic maximum of
pyrene is determined at 333 nm and
compared to its theoretical value.
PDA-3000,
PDA 100,
PDA-100U
(Cont'd)
Linearity
Five caffeine solutions are injected
in different concentrations.
Concentration and peak area are
represented in a graph. The
regression coefficient of the
resulting line and the deviations
from it indicate the linearity.
r ≥ 99.90 % r ≥ 99.90 %
RSD ≤ 5 % RSD ≤ 5 %
(up to
1.5 AU)
(up to
1.5 AU)
AD25
Baseline Noise
Pure water is pumped through the
flow cell. The flow rate is 1 ml/min.
Wavelength: 254 nm.
0.03 mAU
0.04 mAU
0.2 mAU
0.2 mAU
Not
checked
Not
checked
Wavelength
Accuracy
Caffeine is injected using water as
solvent. The flow rate is 1 ml/min.
The characteristic maximum of
caffeine is determined at 272.5 nm
and compared to its theoretical
value.
± 2.0 nm
± 2.0 nm
Linearity
Five caffeine solutions are injected
in different concentrations.
Concentration and peak area are
represented in a graph. The
regression coefficient of the
resulting line and the deviations
from it indicate the linearity.
r ≥ 99.90 % r ≥ 99.90 %
RSD ≤ 5 % RSD ≤ 5 %
Drift
Lamp Intensity
HPLC_OQ_PQ_E_Manual.doc – Version: 6.8 dated Oktober 2008
(up to
1.5 AU)
± 1.0 nm
(up to
1.5 AU)
Page 7 of 95
OQ and PQ Operating Instructions
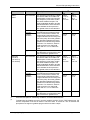
Instrument
UVD 320S,
UVD 160S,
UVD 320,
UVD 160
(analytical flow
cell)
Parameter
Description
Baseline Noise
Drift
Lamp Intensity
(16µl volume)(3)
Pure water is pumped through the
flow cell. The flow rate is 1 ml/min.
Wavelength: 254 nm
Limits(1)
OQ
0.05 mAU
PQ
0.10 mAU
1.0 mAU/h
2.0 mAU/h
> 400000
counts/s
> 200000
counts/s
Wavelength
Accuracy
Pyrene is injected, using methanol
± 2 nm
as solvent. The flow rate is 1 ml/min.
The characteristic maximum of
pyrene is determined at 239 nm and
compared to its theoretical value.
Linearity
Five caffeine solutions are injected
in different concentrations.
Concentration and peak area are
represented in a graph. The
correlation coefficient of the
resulting line and the deviations
from it indicate the linearity.
r ≥ 99.9 % r ≥ 99.9 %
RSD ≤ 5 % RSD ≤ 5 %
(up to
1.5 AU)
(up to
1.5 AU)
Agilent 1100/1200: Drift
G1314A
Lamp Intensity
G1314B
G1314C
Linearity
G1315A
G1315B
G1315C
G1315D
G1365A
G1365B
G1365C
G1365D
Pure water is pumped through the
flow cell. The flow rate is 1 ml/min.
Wavelength: 254 nm.
5.0 mAU/h
5.0 mAU/h
Not
checked
Not
checked
Five caffeine solutions are injected
in different concentrations.
Concentration and peak area are
represented in a graph. The
regression coefficient of the
resulting line and the deviations
from it indicate the linearity.
r ≥ 99.90 % r ≥ 99.90 %
RSD ≤ 5 % RSD ≤ 5 %
(up to
1.5 AU)
(up to
1.5 AU)
Agilent 1100/1200: Baseline Noise
G1315A
G1315B
G1315C
Wavelength
G1315D
Accuracy
G1365A
G1365B
G1365C
G1365D
Pure water is pumped through the
flow cell. The flow rate is 1 ml/min.
Wavelength: 254 nm
0.05 mAU
0.05 mAU
Pyrene is injected, using methanol
± 2 nm
as solvent. The flow rate is 1 ml/min.
The characteristic maximum of
pyrene is determined at 333 nm and
compared to its theoretical value.
± 2 nm
G1314A
G1314B
G1314C
Baseline Noise
Pure water is pumped through the
flow cell at a flow rate of 1.0 ml/min.
Wavelength: 254 nm
0.04 mAU
0.04 mAU
Wavelength
Accuracy
Caffeine is injected using water as
solvent. The flow rate is 1 ml/min.
The characteristic maximum of
caffeine is determined at 272.5 nm
and compared to its theoretical
value.
± 2.0 nm
± 2.0 nm
Page 8 of 95
± 3 nm
HPLC_OQ_PQ_E_Manual.doc – Version: 6.8 dated Oktober 2008
OQ and PQ Operating Instructions
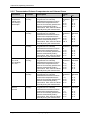
Instrument
Waters PDA996
Waters PDA2996
Parameter
TSP UV1000
Limits(1)
OQ
0.10 mAU
PQ
0.10 mAU
1.0 mAU/h
1.0 mAU/h
Not
checked
Not
checked
Wavelength
Accuracy
Pyrene is injected, using methanol
± 1.0 nm
as solvent. The flow rate is 1 ml/min.
The characteristic maximum of
pyrene is determined at 333 nm and
compared to its theoretical value.
± 1.0 nm
Linearity
Five caffeine solutions are injected
in different concentrations.
Concentration and peak area are
represented in a graph. The
regression coefficient of the
resulting line and the deviations
from it indicate the linearity.
Pure water is pumped through the
flow cell. The flow rate is 1 ml/min.
Wavelength: 254 nm
Baseline Noise
Drift
Lamp Intensity
Waters 2487 Dual
Lambda
Absorbance
Detector
Description
Pure water is pumped through the
flow cell. The flow rate is 1 ml/min.
Wavelength: 254 nm
r ≥ 99.90 % r ≥ 99.90 %
RSD ≤ 5 % RSD ≤ 5 %
(up to
1.5 AU)
(up to
1.5 AU)
0.05 mAU
0.05 mAU
0.5 mAU/h
0.5 mAU/h
Not
checked
Not
checked
Wavelength
Accuracy
Pyrene is injected, using methanol
± 1.0 nm
as solvent. The flow rate is 1 ml/min.
The characteristic maximum of
pyrene is determined at 239 nm and
compared to its theoretical value.
± 1.0 nm
Linearity
Five caffeine solutions are injected
in different concentrations.
Concentration and peak area are
represented in a graph. The
regression coefficient of the
resulting line and the deviations
from it indicate the linearity.
Pure water is pumped through the
flow cell. The flow rate is 1 ml/min.
Wavelength: 254 nm
Baseline Noise
Drift
Lamp Intensity
Baseline Noise
Drift
Lamp Intensity
Wavelength
Accuracy
Linearity
Five caffeine solutions are injected
in different concentrations.
Concentration and peak area are
represented in a graph. The
regression coefficient of the
resulting line and the deviations
from it indicate the linearity.
HPLC_OQ_PQ_E_Manual.doc – Version: 6.8 dated Oktober 2008
r ≥ 99.90 % r ≥ 99.90 %
RSD ≤ 5 % RSD ≤ 5 %
(up to
1.5 AU)
(up to
1.5 AU)
0.50 mAU
0.10 mAU
0.5 mAU/h
1.0 mAU/h
Not
checked
Not
checked
Not
checked
Not
checked
r ≥ 99.90 % r ≥ 99.90 %
RSD ≤ 5 % RSD ≤ 5 %
(up to
1.5 AU)
(up to
1.5 AU)
Page 9 of 95
OQ and PQ Operating Instructions
Instrument
TSP UV2000
Parameter
Description
OQ
0.05 mAU
PQ
0.10 mAU
0.5 mAU/h
1.0 mAU/h
Not
checked
Not
checked
Wavelength
Accuracy
Pyrene is injected, using methanol
± 1.0 nm
as solvent. The flow rate is 1 ml/min.
The characteristic maximum of
pyrene is determined at 239 nm and
compared to its theoretical value.
± 1.0 nm
Linearity
Five caffeine solutions are injected
in different concentrations.
Concentration and peak area are
represented in a graph. The
regression coefficient of the
resulting line and the deviations
from it indicate the linearity.
Pure water is pumped through the
flow cell. The flow rate is 1 ml/min.
Wavelength: 254 nm
Baseline Noise
Drift
Lamp Intensity
TSP UV3000
0.08 mAU
0.15 mAU
0.5 mAU/h
1.0 mAU/h
Not
checked
Not
checked
Wavelength
Accuracy
Pyrene is injected, using methanol
± 1.0 nm
as solvent. The flow rate is 1 ml/min.
The characteristic maximum of
pyrene is determined at 333 nm and
compared to its theoretical value.
± 1.0 nm
Linearity
Five caffeine solutions are injected
in different concentrations.
Concentration and peak area are
represented in a graph. The
regression coefficient of the
resulting line and the deviations
from it indicate the linearity.
Pure water is pumped through the
flow cell. The flow rate is 1 ml/min.
Wavelength: 254 nm
Baseline Noise
r ≥ 99.90 % r ≥ 99.90 %
RSD ≤ 5 % RSD ≤ 5 %
(up to
1.5 AU)
(up to
1.5 AU)
0.06 mAU
0.10 mAU
2.0 mAU/h
4.0 mAU/h
Not
checked
Not
checked
Wavelength
Accuracy
Pyrene is injected, using methanol
± 1.0 nm
as solvent. The flow rate is 1 ml/min.
The characteristic maximum of
pyrene is determined at 333 nm and
compared to its theoretical value.
± 1.0 nm
Linearity
Five caffeine solutions are injected
in different concentrations.
Concentration and peak area are
represented in a graph. The
regression coefficient of the
resulting line and the deviations
from it indicate the linearity.
Baseline Noise
Drift
Lamp Intensity
Page 10 of 95
r ≥ 99.90 % r ≥ 99.90 %
RSD ≤ 5 % RSD ≤ 5 %
(up to
1.5 AU)
Lamp Intensity
TSP UV6000
(Cont'd)
Pure water is pumped through the
flow cell. The flow rate is 1 ml/min.
Wavelength: 254 nm
(up to
1.5 AU)
Drift
TSP UV6000
Limits(1)
r ≥ 99.90 % r ≥ 99.90 %
RSD ≤ 5 % RSD ≤ 5 %
(up to
1.5 AU)
(up to
1.5 AU)
HPLC_OQ_PQ_E_Manual.doc – Version: 6.8 dated Oktober 2008
OQ and PQ Operating Instructions
Instrument
Shimadzu
- LC-2010 SPD
- SPD-10Avp
- SPD-10AVvp
Parameter
Description
Limits(1)
OQ
0.05 mAU
PQ
0.10 mAU
0.8 mAU/h
2.0 mAU/h
Not
checked
Not
checked
Wavelength
Accuracy
Pyrene is injected, using methanol
± 1.0 nm
as solvent. The flow rate is 1 ml/min.
The characteristic maximum of
pyrene is determined at 333 nm and
compared to its theoretical value.
± 1.0 nm
Linearity
Five caffeine solutions are injected
in different concentrations.
Concentration and peak area are
represented in a graph. The
regression coefficient of the
resulting line and the deviations
from it indicate the linearity.
Baseline Noise
Drift
Lamp Intensity
Pure water is pumped through the
flow cell. The flow rate is 1 ml/min.
Wavelength: 254 nm
r ≥ 99.90 % r ≥ 99.90 %
RSD ≤ 5 % RSD ≤ 5 %
(up to
2.5 AU)
(up to
2.5 AU)
(1)
OQ limits with optimum measuring conditions, recommended PQ limits
(2)
When qualifying a detector with a non-analytical flow cell, such as, a micro, nano, or dummy
flow cell, you have to enter the corresponding specifications manually into the report. The
reason is that automatic recognition of micro and nano flow cells is not supported. For
information about the limits for a non-analytical flow cell, refer to the table in section 2.3.2.
(3)
The lamp intensity is measured only for controlled detectors.
2.3.2 UV Detectors Using Non-Analytical Flow Cells
When qualifying a detector with a non-analytical flow cell, such as, a micro or nano flow cell, you have
to enter the corresponding specifications manually into the report. The reason is that automatic
recognition of micro and nano flow cells is not supported or not implemented. The table lists the limits
that apply for non-analytical flow cells.
Instrument
Parameter
Description
VWD-3100,
VWD-3400RS
(micro flow cell)
Baseline Noise
Pure water is pumped through the
flow cell. The flow rate is 1 ml/min.
Wavelength: 254 nm
Drift
Limits(1)
OQ
PQ
0.035 mAU 0.070 mAU
0.3 mAU/h
0.3 mAU/h
Lamp Intensity
The lamp intensity is determined at
a measuring wavelength of 230 nm.
> 50 %
> 40 %
Wavelength
Accuracy
Caffeine is injected using water as
solvent. The flow rate is 1 ml/min.
The characteristic maximum of
caffeine is determined at 272.5 nm
and compared to its theoretical
value.
± 2.0 nm
± 2.0 nm
Linearity
Five caffeine solutions are injected
in different concentrations.
Concentration and peak area are
represented in a graph. The
regression coefficient of the
resulting line and the deviations
from it indicate the linearity.
r ≥ 99.95 % r ≥ 99.90 %
RSD ≤ 3 % RSD ≤ 3 %
HPLC_OQ_PQ_E_Manual.doc – Version: 6.8 dated Oktober 2008
(up to
1.7 AU)
(up to
1.7 AU)
Page 11 of 95
OQ and PQ Operating Instructions
VWD-3100,
VWD-3400RS
(semi-micro flow
cell)
UVD 340S /
UVD 170S /
UVD 340U /
UVD 170U
(micro flow cell)
UVD 340S /
UVD 170S /
UVD 340U /
UVD 170U
(nano flow cell)
(1)
Baseline Noise
Pure water is pumped through the
flow cell. The flow rate is 1 ml/min.
Wavelength: 254 nm
The lamp intensity is determined at
a measuring wavelength of 230 nm.
0.035 mAU 0.070 mAU
Wavelength
Accuracy
Linearity
Drift
Lamp Intensity
Baseline Noise
Drift
0.3 mAU/h
0.3 mAU/h
> 50 %
> 40 %
Caffeine is injected using water as
solvent. The flow rate is 1 ml/min.
The characteristic maximum of
caffeine is determined at 272.5 nm
and compared to its theoretical
value.
± 2.0 nm
± 2.0 nm
Five caffeine solutions are injected
in different concentrations.
Concentration and peak area are
represented in a graph. The
regression coefficient of the
resulting line and the deviations
from it indicate the linearity.
r ≥ 99.95 % r ≥ 99.90 %
RSD ≤ 3 % RSD ≤ 3 %
Pure water is pumped through the
flow cell. The flow rate is 1 ml/min.
Wavelength: 254 nm
0.150 mAU 0.200 mAU
(up to
1.7 AU)
(up to
1.7 AU)
1.5 mAU/h
2.0 mAU/h
> 125000
counts/s
> 100000
counts/s
Wavelength
Accuracy
Pyrene is injected, using methanol
± 0.75 nm
as solvent. The flow rate is 1 ml/min.
The characteristic maximum of
pyrene is determined at 333 nm and
compared to its theoretical value.
± 0.75 nm
Linearity
Five caffeine solutions are injected
in different concentrations.
Concentration and peak area are
represented in a graph. The
regression coefficient of the
resulting line and the deviations
from it indicate the linearity.
r ≥ 99.98 % r ≥ 99.90 %
RSD ≤ 5 % RSD ≤ 5 %
Pure water is pumped through the
flow cell. The flow rate is 1 ml/min.
Wavelength: 254 nm
0.200 mAU 0.300 mAU
Lamp Intensity
Baseline Noise
Drift
(up to
1.5 AU)
(up to
1.5 AU)
3.0 mAU/h
4.0 mAU/h
> 125000
counts/s
> 100000
counts/s
Wavelength
Accuracy
Pyrene is injected, using methanol
± 0.75 nm
as solvent. The flow rate is 1 ml/min.
The characteristic maximum of
pyrene is determined at 333 nm and
compared to its theoretical value.
± 0.75 nm
Linearity
Five caffeine solutions are injected
in different concentrations.
Concentration and peak area are
represented in a graph. The
regression coefficient of the
resulting line and the deviations
from it indicate the linearity.
Lamp Intensity
r ≥ 99.90 % r ≥ 99.90 %
RSD ≤ 5 % RSD ≤ 5 %
(up to
1.0 AU at
8 μl)
(up to
1.0 AU at
8 μl)
OQ limits with optimum measuring conditions, recommended PQ limits
Page 12 of 95
HPLC_OQ_PQ_E_Manual.doc – Version: 6.8 dated Oktober 2008
OQ and PQ Operating Instructions
2.3.3 Autosamplers
Instrument
ACC-3000(T)
WPS-3000(T)RS
(Analytical version
and micro option)
Limits(1)
Parameter
Description
Precision of
Injection
Volume
OQ
Ten injections are analyzed. Each of RSD ≤
them contains 5 µl of the same
0.5 %
standard. The relative standard
deviation of the peak areas indicates
the precision of the injection volume.
PQ
RSD ≤
1.0 %
Linearity of
Injection
Volume
Five injections of the same standard r ≥ 99.95 % r ≥ 99.90 %
sample are analyzed. The injection
RSD ≤
RSD ≤
volumes are different (see section
1.0 %
1.0 %
5.6.2). The injection volume and the
peak area are represented in a
graph. The regression coefficient of
the resulting line and the deviation
from it indicate the linearity.
Carry-Over
After a highly concentrated test
≤ 0.02 %
sample has been injected, a blind
sample is injected. The blind sample
contains only solvent. The peak
area measured in this chromatogram indicates the carry-over.
≤ 0.02 %
Temperature
Accuracy
The sample temperature is
measured using an external
thermometer in a standard vial. The
standard vial is filled with water
(measured at 15 °C).
± 2 °C
± 4 °C
Precision of
Injection
Volume
Ten injections of the same standard RSD ≤
are analyzed. The injection volume
0.3 %
is as follows: 5 µl (analytical
autosampler), 2 µl (micro
autosampler), and 10 µl
(autosampler with 250-µl injection
volume kit). The relative standard
deviation of the peak areas indicates
the precision of the injection volume.
RSD ≤
0.5 %
Linearity of
Injection
Volume
Five injections of the same standard r ≥ 99.99 % r ≥ 99.90 %
sample are analyzed. The injection
RSD ≤
RSD ≤
volumes are different: Analytical
0.5 %
1.0 %
autosampler: 5 µl to 80 µl; Micro
option: 1 µl to 20 µl.
The injection volume and the peak
area are represented in a graph.
The regression coefficient of the
resulting line and the deviation from
it indicate the linearity.
Carry-Over
After a highly concentrated test
≤ 0.01 %
sample has been injected, a blind
sample is injected. The blind sample
contains only solvent. The peak
area measured in this chromatogram indicates the carry-over.
≤ 0.01 %
Temperature
Accuracy
The sample temperature is
measured using an external
thermometer in a standard vial. The
standard vial is filled with water
(measured at 10 °C).
± 4 °C
HPLC_OQ_PQ_E_Manual.doc – Version: 6.8 dated Oktober 2008
± 2 °C
Page 13 of 95
OQ and PQ Operating Instructions
Instrument
WPS-3000(T)SL
(Micro and
analytical
autosampler
versions and
250-µl injection
volume kit)
WPS-3000(T)SL
(Micro and
analytical
autosampler
versions and
250 µl injection
volume kit)
Parameter
Limits(1)
OQ
RSD ≤
0.3 %
PQ
RSD ≤
0.5 %
Precision of
Injection
Volume
Ten injections of the same standard
are analyzed. The injection volume
is as follows: 5 µl (analytical
autosampler), 2 µl (micro
autosampler), and 10 µl
(autosampler with 250-µl injection
volume kit). The relative standard
deviation of the peak areas indicates
the precision of the injection volume.
Linearity of
Injection
Volume
Five injections of the same standard r ≥ 99.99 % r ≥ 99.90 %
sample are analyzed. The injection
RSD ≤
RSD ≤
volumes are different: Analytical
0.5 %
1.0 %
autosampler: 5 µl to 80 µl; Micro
autosampler: 1 µl to 20 µl;
autosampler with 250-µl injection
volume kit: 10 µl to 160 µl. The
injection volume and the peak area
are represented in a graph. The
regression coefficient of the
resulting line and the deviation from
it indicate the linearity.
Carry-Over
After a highly concentrated test
≤ 0.01 %
sample has been injected, a blind
sample is injected. The blind sample
contains only solvent. The peak
area measured in this chromatogram indicates the carry-over.
≤ 0.01 %
Temperature
Accuracy
The sample temperature is
measured using an external
thermometer in a standard vial. The
standard vial is filled with water
(measured at 10 °C).
± 2 °C
± 4 °C
Ten injections are analyzed. Each of RSD ≤
them contains 5 µl of the same
0.3 %
standard. The relative standard
deviation of the peak areas indicates
the precision of the injection volume.
RSD ≤
0.5 %
WPS-3000(T)PL
Precision of
(only with Upgrade Injection
Kit for 250 µl
Volume
syringe)
Page 14 of 95
Description
Linearity of
Injection
Volume
Five injections of the same standard r ≥ 99.99 % r ≥ 99.90 %
sample are analyzed. The injection
RSD ≤
RSD ≤
volumes are different. The injection 0.5 %
1.0 %
volume and the peak area are
represented in a graph. The
regression coefficient of the
resulting line and the deviation from
it indicate the linearity.
Carry-Over
After a highly concentrated test
≤ 0.05 %
sample has been injected, a blind
sample is injected. The blind sample
contains only solvent. The peak
area measured in this chromatogram indicates the carry-over.
≤ 0.05 %
HPLC_OQ_PQ_E_Manual.doc – Version: 6.8 dated Oktober 2008
OQ and PQ Operating Instructions
Instrument
Parameter
Description
Limits(1)
WPS-3000(T)PL
Temperature
(only with Upgrade Accuracy
Kit for 250 µl
syringe)
(Cont'd)
The sample temperature is
measured using an external
thermometer in a standard vial. The
standard vial is filled with water
(Measured at 10 °C).
OQ
± 2 °C
PQ
± 4 °C
WPS-3000TBPL
Analytical
(Standard and
Large Volume
configuration)
Precision of
Injection
Volume
Ten injections are analyzed. Each of RSD ≤
them contains 5 µl (Standard Con0.3 %
figuration) or 20 µl (250 µl injection
volume kit ) of the same standard.
The relative standard deviation of
the peak areas indicates the
precision of the injection volume.
RSD ≤
0.5 %
Linearity of
Injection
Volume
Five injections of the same standard r ≥ 99.99 % r ≥ 99.90 %
sample are analyzed. The injection
RSD ≤
RSD ≤
volumes are different. The injection 0.5 %
1.0 %
volume and the peak area are
represented in a graph. The
regression coefficient of the
resulting line and the deviation from
it indicate the linearity.
Carry-Over
After a highly concentrated test
≤ 0.03 %
sample has been injected, a blind
sample is injected. The blind sample
contains only solvent. The peak
area measured in this chromatogram indicates the carry-over.
≤ 0.05 %
Temperature
Accuracy
The sample temperature is
measured using an external
thermometer in a standard vial. The
standard vial is filled with water
(Measured at 10 °C).
± 2 °C
± 4 °C
Precision of
Injection
Volume
Ten injections are analyzed. Each of RSD ≤
them contains 5 µl of the same
0.3 %
standard. The relative standard
deviation of the peak areas indicates
the precision of the injection volume.
RSD ≤
0.5 %
Linearity of
Injection
Volume
Five injections of the same standard r ≥ 99.99 % r ≥ 99.90 %
sample are analyzed. The injection
RSD ≤
RSD ≤
volumes are different (5 µl to 80 µl). 0.5 %
1.0 %
The injection volume and the peak
area are represented in a graph.
The regression coefficient of the
resulting line and the deviation from
it indicate the linearity.
Carry-Over
After a highly concentrated test
≤ 0.1 %
sample has been injected, a blind
sample is injected. The blind sample
contains only solvent. The peak
area measured in this
chromatogram indicates the carryover.
ASI-100
(250 µl syringe)
HPLC_OQ_PQ_E_Manual.doc – Version: 6.8 dated Oktober 2008
≤ 0.1 %
Page 15 of 95
OQ and PQ Operating Instructions
Instrument
GINA 50,
GINA 160
(250 µl syringe)
Agilent 1100/1200:
G1313A
G1329A
G1329B
G1367A
G1367B
G1367C
Parameter
Limits(1)
OQ
RSD ≤
0.4 %
PQ
RSD ≤
0.5 %
Precision of
Injection
Volume
Six injections are analyzed. Each of
them contains 10 µl of the same
standard sample. The relative
standard deviation of the peak areas
indicates the precison of the
injection volume.
Linearity of
Injection
Volume
Five injections of the same standard r ≥ 99.99 % r ≥ 99.90 %
sample are analyzed. The injection
RSD ≤
RSD ≤
volumes are different (10 µl to
0.5 %
1.0 %
80 µl). Injection volume and peak
area are represented in a graph.
The regression coefficient of the
resulting line and the deviations
from it indicate the linearity.
Carry-Over
After a highly concentrated test
≤ 0.1 %
sample has been injected, a blind
sample is injected. The blind sample
contains only solvent. The peak
area measured in this
chromatogram indicates the carryover.
Ten injections are analyzed. Each of RSD ≤
them contains 5 µl of the same
1.0 %
standard. The relative standard
deviation of the peak areas indicates
the precision of the injection volume.
Precision of
Injection
Volume
≤ 0.1 %
RSD ≤
1.0 %
Linearity of
Injection
Volume
Five injections of the same standard r ≥ 99.99 % r ≥ 99.90 %
sample are analyzed. The injection
RSD
RSD ≤
volumes are different (5 µl to 80 µl). ≤1.0 %
1.0 %
The injection volume and the peak
area are represented in a graph.
The regression coefficient of the
resulting line and the deviation from
it indicate the linearity.
Carry-Over
After a highly concentrated test
≤ 0.2 %
sample has been injected, a blind
sample is injected. The blind sample
contains only solvent. The peak
area measured in this
chromatogram indicates the carryover.
Ten injections are analyzed. Each of RSD ≤
them contains 5 µl of the same
1.0 %
standard. The relative standard
deviation of the peak areas indicates
the precision of the injection volume.
Sampler module of Precision of
the Waters
Injection
Alliance 2690
Volume
Separation Module
Linearity of
Injection
Volume
Page 16 of 95
Description
≤ 0.2 %
RSD ≤
1.0 %
Five injections of the same standard r ≥ 99.90 % r ≥ 99.90 %
sample are analyzed. The injection
RSD ≤
RSD ≤
volumes are different (5 µl to 80 µl). 1.0 %
1.0 %
The injection volume and the peak
area are represented in a graph.
The regression coefficient of the
resulting line and the deviation from
it indicate the linearity.
HPLC_OQ_PQ_E_Manual.doc – Version: 6.8 dated Oktober 2008
OQ and PQ Operating Instructions
Instrument
Parameter
Description
Limits(1)
OQ
≤ 0.1 %
PQ
≤ 0.1 %
Sampler module of Carry-Over
the Waters
Alliance 2690
Separation Module
(Cont'd)
After a highly concentrated test
sample has been injected, a blind
sample is injected. The blind sample
contains only solvent. The peak
area measured in this
chromatogram indicates the carryover.
Waters WISP
717plus
Precison of
Injection
Volume
Ten injections are analyzed. Each of RSD ≤
them contains 5 µl of the same
1.0 %
standard. The relative standard
deviation of the peak areas indicates
the precision of the injection volume.
Linearity of
Injection
Volume
Five injections of the same standard r ≥ 99.90 % r ≥ 99.90 %
sample are analyzed. The injection
RSD ≤
RSD ≤
volumes are different (5 µl to 80 µl). 1.0 %
1.0 %
The injection volume and the peak
area are represented in a graph.
The regression coefficient of the
resulting line and the deviation from
it indicate the linearity.
Carry-Over
After a highly concentrated test
≤ 0.1 %
sample has been injected, a blind
sample is injected. The blind sample
contains only solvent. The peak
area measured in this
chromatogram indicates the carryover.
≤ 0.1 %
Ten injections are analyzed. Each of RSD ≤
them contains 5 µl of the same
1.0 %
standard. The relative standard
deviation of the peak areas indicates
the precision of the injection volume.
RSD ≤
2.0 %
TSP AS3000/3500 Precision of
Injection
Volume
Shimadzu
- LC-2010
- SIL-10HTA
- SIL-10HTC
- SIL-10Advp
RSD ≤
1.0 %
Linearity of
Injection
Volume
Five injections of the same standard r ≥ 99.90 % r ≥ 99.90 %
sample are analyzed. The injection
RSD ≤
RSD ≤
volumes are different (5 µl to 80 µl). 1.5 %
1.5 %
The injection volume and the peak
area are represented in a graph.
The regression coefficient of the
resulting line and the deviation from
it indicate the linearity.
Carry-Over
After a highly concentrated test
≤ 0.1 %
sample has been injected, a blind
sample is injected. The blind sample
contains only solvent. The peak
area measured in this
chromatogram indicates the carryover.
≤ 0.1 %
Precision of
Injection
Volume
Ten injections are analyzed. Each of RSD ≤
them contains 5 µl of the same
0.3 %
standard. The relative standard
deviation of the peak areas indicates
the precision of the injection volume.
RSD ≤
0.5 %
HPLC_OQ_PQ_E_Manual.doc – Version: 6.8 dated Oktober 2008
Page 17 of 95
OQ and PQ Operating Instructions
Instrument
Shimadzu
- LC-2010
- SIL-10HTA
- SIL-10HTC
- SIL-10Advp
(Cont'd)
Parameter
Description
Linearity of
Injection
Volume
Carry-Over
(1)
Limits(1)
OQ
Five injections of the same standard r ≥ 99.90 %
sample are analyzed. The injection
RSD ≤
volumes are different (5 µl to 80 µl;
1.0 %
5 µl to 50 µl for the SIL-10ADvp,
respectively). The injection volume
and the peak area are represented
in a graph. The regression
coefficient of the resulting line and
the deviation from it indicate the
linearity.
PQ
r ≥ 99.90 %
RSD ≤
1.0 %
After a highly concentrated test
≤ 0.02 %
sample has been injected, a blind
sample is injected. The blind sample
contains only solvent. The peak
area measured in this
chromatogram indicates the carryover.
≤ 0.02 %
OQ limits with optimum measuring conditions, recommended PQ limits
2.3.4 Pumps
Instrument
Parameter
ISO-3100A,
LPG-3400A(B),
LPG-3400M(B),
DGP-3600A(B),
DGP-3600M(B),
HPG-3200RS,
HPG-3200A,
HPG-3200M,
HPG3400RS,
HPG-3400A,
HPG-3400M,
P680 and P580
with analytical
pump heads
Flow Precision
Ten injections are analyzed. (When
the Dionex GINA 50 or GINA 160
autosampler is used, six injections
are analyzed.) All of them contain
the same standard sample. The
relative standard deviation and the
standard deviation of the retention
times indicate the flow precision.
The greater value is the valid limit.
LPG-3400A(B),
LPG-3400M(B),
DGP-3600A(B),
DGP-3600M(B),
HPG-3200A,
HPG-3200M,
HPG-3200RS,
HPG-3400A,
HPG-3400M,
HPG-3400RS,
P580 (HPG and
LPG) and
P680 (HPG, LPG,
and DGP: all
mixing chamber
types); all pumps
with analytical
pump heads
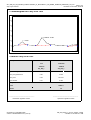
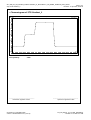
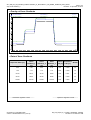
Gradient
Accuracy
A step gradient of two channels is
programmed and measured three
times. The deviation between the
measured and theoretical signal
heights indicates the accuracy with
which the pump forms the gradient.
The deviations between the three
gradient runs indicate the gradient
precision. For channel A, water is
used as solvent; for channel B,
water with 0.1 % Vol. acetone is
used.
Page 18 of 95
Gradient
Precision
Ripple
Description
For each step of the above gradient
runs, the ripple is determined
relative to the absorption of solvent
B.
Limits(1)
OQ
RSD ≤
0.05 % or
SD ≤
0.01 min
PQ
RSD ≤
0.1 % or
SD ≤
0.02 min
HPG:
≤ 0.2 %
LPG/DGP
HPG:
≤ 0.5 %
LPG/DGP
(analytical):
(analytical):
≤ 1.0 %
LPG/DGP
(micro):
≤ 2.0 %
≤ 2.0 %
LPG/DGP
(micro):
≤ 2.0 %
STD ≤
0.5 %
STD ≤
0.5 %
≤ 0.5 %
≤ 0.5 %
HPLC_OQ_PQ_E_Manual.doc – Version: 6.8 dated Oktober 2008
OQ and PQ Operating Instructions
Instrument
Parameter
Description
Limits(1)
OQ
RSD ≤
0.1 % or
SD ≤
0.02 min
M 480 with
analytical pump
heads
Flow Precision
Ten injections are analyzed. (When
the Dionex GINA 50 or GINA 160
autosampler is used, six injections
are analyzed.) All of them contain
the same standard sample. The
relative standard deviation and the
standard deviation of the retention
times indicate the flow precision.
The greater value is the valid limit.
M 480 with
analytical pump
heads – low
pressure gradient
Gradient
Accuracy
Two different step gradients of two
≤ 1.5%
channels are programmed. The
deviation between the measured
and theoretical signal heights
indicates the accuracy with which
the pump forms the gradient. The
deviations between the three
gradient runs indicate the gradient
precision. For channels A and C,
water is used as solvent; for channel
B, water with 0.1 % Vol. acetone is
used.
Gradient
Precision
M480 and M300
High pressure
gradients with
analytical pump
heads
≤ 2.0%
Not checked Not checked
Ripple
For each step of the above gradient
runs, the ripple is determined
relative to the absorption of solvent
B.
≤ 0.5 %
≤ 0.5 %
Gradient
Accuracy
A step gradient of two channels is ≤ 1.5 %
programmed and measured three
times. The deviation between the
measured and theoretical signal
heights indicates the accuracy with
which the pump forms the gradient.
The deviations between the three
gradient runs indicate the gradient
precsion. For channels A and C,
water is used as solvent; for channel
B, water with 0.1 % Vol. acetone is
used.
≤ 2.0 %
Gradient
Precision
M 300
PQ
RSD ≤
0.1 % or
SD ≤
0.02 min
Not checked Not checked
Ripple
For each step of the above gradient
runs, the ripple is determined
relative to the absorption of solvent
B.
≤ 0.5 %
≤ 0.5 %
Flow Precision
Six injections are analyzed. All of
them contain the same standard
sample. The relative standard
deviation and the standard deviation
of the retention times indicate the
flow precision. The greater value is
the valid limit.
RSD ≤
0.1 % or
SD ≤
0.02 min
RSD ≤
0.1 % or
SD ≤
0.02 min
HPLC_OQ_PQ_E_Manual.doc – Version: 6.8 dated Oktober 2008
Page 19 of 95
OQ and PQ Operating Instructions
Instrument
Parameter
Description
Agilent 1100/1200: Flow Precison
G1310A
G1311A
G1312A
G1312B
Agilent 1100/1200: Gradient
Accuracy
G1311A
G1312A
G1312B
Gradient
Precision
Ripple
Pump module of
Flow Precision
the Waters
Alliance 2690
Separation Module
Gradient
Accuracy
Gradient
Precision
Ripple
Page 20 of 95
Ten injections are analyzed. (When
the Dionex GINA 50 or GINA 160
autosampler is used, six injections
are analyzed.) All of them contain
the same standard sample. The
relative standard deviation and the
standard deviation of the retention
times indicate the flow precision.
The greater value is the valid limit.
A step gradient of two channels is
programmed and measured three
times. The deviation between the
measured and theoretical signal
heights indicates the accuracy with
which the pump forms the gradient.
The deviations between the three
gradient runs indicate the gradient
precision. For channel A, water is
used as solvent; for channel B,
water with 0.1 % Vol. acetone is
used.
For each step of the above gradient
runs, the ripple is determined
relative to the absorption of solvent
B.
Ten injections are analyzed. (When
the Dionex GINA 50 or GINA 160
autosampler is used, six injections
are analyzed.) All of them contain
the same standard sample. The
relative standard deviation and the
standard deviation of the retention
times indicate the flow precision.
The greater value is the valid limit.
A step gradient of two channels is
programmed and measured three
times. The deviation between the
measured and theoretical signal
heights indicates the accuracy with
which the pump forms the gradient.
The deviations between the three
gradient runs indicate the gradient
precision. For channel A, water is
used as solvent; for channel B,
water with 0.1 % Vol. acetone is
used.
The ripple is determined relative to
the absorption of solvent B for each
step of the above gradient runs.
Limits(1)
OQ
RSD ≤
0.07 % or
SD ≤
0.02 min
PQ
RSD ≤
0.07 % or
SD ≤
0.02 min
G1311A:
≤ 1.5 %
G1312A/B:
≤ 0.7 %
STD ≤
0.5 %
G1311A:
≤ 1.5 %
G1312A/B:
≤ 0.7 %
STD ≤
0.5 %
≤ 0.5 %
≤ 0.5 %
RSD ≤
4.0 % or
SD ≤
0.1 min
RSD ≤
4.0% or
SD ≤
0.1 min
≤ 0.5 %
≤ 0.5 %
STD ≤
0.5 %
STD ≤
0.5 %
≤ 0.5 %
≤ 0.5 %
HPLC_OQ_PQ_E_Manual.doc – Version: 6.8 dated Oktober 2008
OQ and PQ Operating Instructions
Instrument
P2000
P4000
(2)
Parameter
Flow Precision
Ten injections are analyzed. (When
the Dionex GINA 50 or GINA 160
autosampler is used, six injections
are analyzed.) All of them contain
the same standard sample. The
relative standard deviation and the
standard deviation of the retention
times indicate the flow precision.
The greater value is the valid limit.
Gradient
Accuracy
A step gradient of two channels is
programmed and measured three
times. The deviation between the
measured and theoretical signal
heights indicates the accuracy with
which the pump forms the gradient.
The deviations between the three
gradient runs indicate the gradient
precision. For channel A, water is
used as solvent; for channel B,
water with 0.1 % Vol. acetone is
used.
Gradient
Precision
Shimadzu
- LC-2010
- LC-10ATvp
- LC-10ADvp
Description
Limits(1)
OQ
RSD ≤
1.5 % or
SD ≤
0.04 min
PQ
RSD ≤
2.0% or
SD ≤
0.06 min
≤ 1.0 %
≤ 2.0 %
STD ≤
1.0 %
STD ≤
2.0 %
Ripple
The ripple is determined relative to
the absorption of solvent B for each
step of the above gradient runs.
≤ 0.5 %
≤ 0.5 %
Flow Precision
Ten injections are analyzed. (When
the Dionex GINA 50 or GINA 160
autosampler is used, six injections
are analyzed.) All of them contain
the same standard sample. The
relative standard deviation and the
standard deviation of the retention
times indicate the flow precision.
The greater value is the valid limit.
RSD ≤
0.075 % or
SD ≤
0.02 min
RSD ≤
0.15 % or
SD ≤
0.04 min
Gradient
Accuracy
A step gradient of two channels is
programmed and measured three
times. The deviation between the
measured and theoretical signal
heights indicates the accuracy with
which the pump forms the gradient.
The deviations between the three
gradient runs indicate the gradient
precision. For channel A, water is
used as solvent; for channel B,
water with 0.1 % Vol. acetone is
used.
≤ 1.0 %
≤ 2.0 %
STD ≤
0.5 %
STD ≤
0.5 %
≤ 0.5 %
≤ 0.5 %
Gradient
Precision
Ripple
The ripple is determined relative to
the absorption of solvent B for each
step of the above gradient runs.
(1)
OQ limits with optimum measuring conditions, recommended PQ limits
(2)
To determine the gradient accuracy and the gradient precision for the TSP P2000 pump, the
solvent composition must be as follows: 0.50 and 100% of solvent B. This is because the
pump does not support a gradient program with more than 9 steps.
HPLC_OQ_PQ_E_Manual.doc – Version: 6.8 dated Oktober 2008
Page 21 of 95
OQ and PQ Operating Instructions
2.3.5 Thermostatted Column Compartments and Column Ovens
Instrument
Parameter
Description
Limits(1)
OQ
± 2 °C
Measured
at(3):
35 °C,
40 °C,
50 °C
PQ
± 3 °C
Measured
at(3):
35 °C,
40 °C,
45 °C
Column
compartment
module of the
ACC-3000(T)
autosampler
Temperature
Accuracy
A 3-step temperature gradient is
programmed. An externally
calibrated thermometer is used to
measure the temperature that is
reached. If technically possible, the
data are automatically read by
Chromeleon. Else, enter the values
manually during the measurement.
TCC-3000RS
Temperature
Accuracy
A 4-step temperature gradient is
programmed. An externally
calibrated thermometer is used to
measure the temperature that is
reached. If technically possible, the
data are automatically read by
Chromeleon. Else, enter the values
manually during the measurement.
± 1 °C
Measured
at:
10 °C,
30 °C,
60 °C,
105 °C
± 2 °C
Measured
at:
15 °C,
30 °C,
60 °C,
90 °C
TCC-3000SD
Temperature
Accuracy
A 4-step temperature gradient is
programmed. An externally
calibrated thermometer is used to
measure the temperature that is
reached. If technically possible, the
data are automatically read by
Chromeleon. Else, enter the values
manually during the measurement.
± 1 °C
Measured
at:
10 °C,
30 °C,
50 °C,
65 °C
± 2 °C
Measured
at:
10 °C,
30 °C,
45 °C,
60 °C
TCC-3000,
TCC-3100,
TCC-3200(B),
TCC-100
Temperature
Accuracy
A 4-step temperature gradient is
programmed. An externally
calibrated thermometer is used to
measure the temperature that is
reached. If technically possible, the
data are automatically read by
Chromeleon. Else, enter the values
manually during the measurement.
± 1 °C
Measured
at:
10 °C,
30 °C,
60 °C,
80 °C
± 2 °C
Measured
at:
15 °C,
30 °C,
45 °C,
60 °C
STH 585
Temperature
Accuracy
A 4-step temperature gradient is
programmed. An externally
calibrated thermometer is used to
measure the temperature that is
reached. If technically possible, the
data are automatically read by
Chromeleon. Else, enter the values
manually during the measurement.
± 1 °C
Measured
at:
5 °C,
20 °C,
60 °C,
85 °C
± 2 °C
Measured
at:
15 °C,
30 °C,
45 °C,
60 °C
Agilent 1100/1200: Temperature
G1316A
Accuracy
G1316B
A 4-step temperature gradient is
programmed. An externally
calibrated thermometer is used to
measure the temperature that is
reached. If technically possible, the
data are automatically read by
Chromeleon. Else, enter the values
manually during the measurement.
± 2 °C
Measured
at:
5 °C,
20 °C,
60 °C,
80 °C
± 2 °C
Measured
at:
15 °C,
30 °C,
45 °C,
60 °C
Page 22 of 95
HPLC_OQ_PQ_E_Manual.doc – Version: 6.8 dated Oktober 2008
OQ and PQ Operating Instructions
Instrument
Parameter
Description
Limits(1)
OQ
± 1 °C
Measured
(2,3)
at :
35 °C,
45 °C,
55 °C
PQ
± 2 °C
Measured
at(2,3):
35 °C,
45 °C,
55 °C
Column
compartment
module of the
Waters Alliance
2690 Separation
Module
Temperature
Accuracy
A 3-step temperature gradient is
programmed. An externally
calibrated thermometer is used to
measure the temperature that is
reached. If technically possible, the
data are automatically read by
Chromeleon. Else, enter the values
manually during the measurement.
Column oven of
the TSP
AS3000/AS3500
Autosamplers
Temperature
Accuracy
A 4-step temperature gradient is
programmed. An externally
calibrated thermometer is used to
measure the temperature that is
reached. If technically possible, the
data are automatically read by
Chromeleon. Else, enter the values
manually during the measurement.
± 2 °C
Measured
at:
20 °C,
40 °C,
60 °C,
80 °C
± 3 °C
Measured
at:
25 °C,
35 °C,
45 °C,
60 °C
Shimadzu
Column
Compartments:
- LC-2010
- CTO-10ASvp
Temperature
Accuracy
A 3-step temperature gradient is
programmed. An externally
calibrated thermometer is used to
measure the temperature that is
reached. If technically possible, the
data are automatically read by
Chromeleon. Else, enter the values
manually during the measurement.
± 3 °C
Measured
(2)
at :
20 °C,
40 °C,
60 °C
± 3 °C
Measured
at(2):
25 °C,
35 °C,
45 °C,
60 °C
Shimadzu
Column
Compartment:
- CTO-10Avp
Temperature
Accuracy
A 3-step temperature gradient is
programmed. An externally
calibrated thermometer is used to
measure the temperature that is
reached. If technically possible, the
data are automatically read by
Chromeleon. Else, enter the values
manually during the measurement.
± 3 °C
Measured
at(2,3):
35 °C,
60 °C,
80 °C
± 3 °C
Measured
at(2,3):
35 °C,
45 °C,
60 °C
Shimadzu
Column
Compartment:
- CTO-10ACvp
Temperature
Accuracy
A 3-step temperature gradient is
programmed. An externally
calibrated thermometer is used to
measure the temperature that is
reached. If technically possible, the
data are automatically read by
Chromeleon. Else, enter the values
manually during the measurement.
± 3 °C
Measured
(2)
at :
20 °C,
60 °C,
80 °C
± 3 °C
Measured
at(2):
25 °C,
45 °C,
60 °C
(1)
OQ limits with optimum measuring conditions, recommended PQ limits
(2)
It is not possible to set the temperature on the column compartment module when the
retention time is negative. The first measurement reading is 10 minutes after the sample has
been started. At this time, equilibration of the column compartment may not be complete.
Therefore, the same temperature is set also for the second measuring point. The column
compartment module has passed the check even if the target temperature is reached only for
the second measuring point.
(3)
According to the specification of the column compartment module, only target temperatures
above ambient are permitted. That is why measuring points below 35 °C are not evaluated.
HPLC_OQ_PQ_E_Manual.doc – Version: 6.8 dated Oktober 2008
Page 23 of 95
OQ and PQ Operating Instructions
2.3.6 Fluorescence Detectors
Instrument
RF 2000
Parameter
Description
OQ
PQ
Baseline Noise
Pure water is pumped through the
flow cell: The flow rate is 1 ml/min.
Excitation wavelength: 350 nm
emission wavelength: 394 nm
0.30 mV
0.30 mV
Signal
Minimum
Pure water is pumped through the
flow cell. The flow rate is 1 ml/min.
Excitation wavelength: 350 nm. It is
observed how the signal changes
when the emission wavelength
changes from 450 nm to 394 nm.
> 40 mV
> 40 mV
80 mV
80 mV
Wavelength
Accuracy(2)
Pure water is pumped through the
10 nm
flow cell. The flow rate is 1 ml/min.
At the excitation wavelength of
350 nm, the emission wavelength is
varied from 380 nm to 410 nm in
1 nm increments. The relative signal
maximum is compared to the
theoretical maximum.
10 nm
Baseline Noise
Pure water is pumped through the
flow cell. The flow rate is 1 ml/min.
Excitation wavelength: 350 nm
emission wavelength: 394 nm
0.60 mV
0.60 mV
Signal
Minimum
Pure water is pumped through the
flow cell. The flow rate is 1 ml/min.
Excitation wavelength: 350 nm. It is
observed how the signal changes
when the emission wavelength
changes from 450 nm to 394 nm.
> 40 mV
> 40 mV
80 mV
80 mV
Pure water is pumped through the
10 nm
flow cell at 1.0 ml/min At an
excitation wavelength of 350 nm, the
emission wavelength is varied from
380 nm to 410 nm in 1 nm
increments. The relative signal
maximum is compared to the
theoretical maximum.
10 nm
Signal
Maximum
RF 1002
Limits(1)
Signal
Maximum
Wavelength
Accuracy(2)
(1)
OQ limits with optimum measuring conditions, recommended PQ limits
(2)
The manufacturer specification of 2 nm for the excitation and emission wavelengths can be
checked only using a special flow cell and a mercury lamp. For OQ and PQ, the instrument
should preferably be checked with the components used for the measurements.
Page 24 of 95
HPLC_OQ_PQ_E_Manual.doc – Version: 6.8 dated Oktober 2008
OQ and PQ Operating Instructions
2.3.7 Refractive Index Detectors
Instrument
Shodex RI-101
Agilent 1100/1200
G1362A
Parameter
Baseline Noise
Drift
Linearity
(1)
Description
Pure water is pumped through the
flow cell. The flow rate is 1 ml/min.
Temperature: 35 °C
Five glycerin solutions are injected
in different concentrations.
Concentration and peak area are
represented in a graph. The
regression coefficient of the
resulting line and the deviations
from it indicate the linearity.
Limits(1)
OQ
50 nRIU
PQ
50 nRIU
500 nRIU/
h
2500 nRIU/h
r > 99.9 %
r > 99.9 %
OQ limits with optimum measuring conditions, recommended PQ limits
2.3.8 Evaporative Light Scattering Detectors
Instrument
Polymer
Laboratories
ELS 2100
(1)
Parameter
Baseline Noise
Description
Pure water is pumped through the
flow cell. The flow rate is 1 ml/min.
Limits(1)
OQ
0.3 mV
PQ
0.3 mV
OQ limits with optimum measuring conditions, recommended PQ limits
HPLC_OQ_PQ_E_Manual.doc – Version: 6.8 dated Oktober 2008
Page 25 of 95
OQ and PQ Operating Instructions
Page 26 of 95
HPLC_OQ_PQ_E_Manual.doc – Version: 6.8 dated Oktober 2008
OQ and PQ Operating Instructions
3 Process
3.1 General Test Procedure
All required materials are provided in the Performance Qualification kit (part no. 4832.5000A).
Article No.
Description
All kits
709.7021
10 µl sample loop (1/16“)
2261.0102
VS - 2 VA 1/16“ connecting unit
2200.5502
Single-part, hand-tight fitting
3323.0010
Standards kit (caffeine and Pyrene)
709.6000.066
Finger-tight 33 mm fitting set (5 sets: ferrule and fitting screws)
Kits with pressure regulator (available until spring 2007) also include
2251.6010A
Pressure regulator (complete)
Kits with restriction tubing (available since spring 2007) also include
5035.3000
Restriction tubing (ID: 0.18 mm; length: 15 m)
2261.0102
connecting unit (VS - 2 VA 1/16“)
2251.6001
PEEK tubing (ID: 0.25 mm; length: 0.10 m)
Quantity
1
1
2
1
0.2
1
1
1
1
For a kit without sample loop, order part no. 4832.5010A.
The Standards kit (part no. 3323.0010) contains the seven required caffeine/pyrene standards. The
standard at position RA8 (or 8) contains water as solvent. Due to legal shipping restrictions, the
pyrene standard is shipped in solid form. Before you can use the standard, dissolve the solid pyrene in
1 ml of methanol (HPLC-grade):
Unscrew the cap from the 2 ml vial labeled 3 µg Pyrene.
Add about 1 ml of methanol (HPLC-grade), which is about half the vial volume.
Screw the cap onto the vial. Make sure that the cap seals tight.
Shake the vial for about 10 seconds to dissolve the solid pyrene.
Place the vial at the appropriate position in the autosampler.
Tip:
The pyrene standard is used for checking the wavelength accuracy of all UV detectors
(except the Dionex VWD-3100 and VWD-3400 detectors, the AD25 detector, and any
other supported single wavelength detectors; see Section 3.2). Concentrations deviating
by 30 % do not affect the test results.
Sample Position
Substance
Concentration Checks
Dionex
(1)
Sampler
Any
Sampler
RA1
1
Pyrene in
methanol
3 µg/ml
Wavelength accuracy of UV
detector (see section 3.2 for a
list of excluded detectors)
RA2
2
Caffeine in water
10 µg/ml
Linearity of injection volume (for
sample loop volumes > 50 µl)
Detector linearity
Carry over by the autosampler
HPLC_OQ_PQ_E_Manual.doc – Version: 6.8 dated Oktober 2008
Page 27 of 95
OQ and PQ Operating Instructions
Sample Position
Dionex
(1)
Sampler
Any
Sampler
RA3
3
Substance
Concentration Checks
Caffeine in water
60 µg/ml
RA4
4
Caffeine in water
140 µg/ml
Wavelength accuracy
(VWD-3400RS, single
wavelength detectors)
Precision of injection volume
and flow (Gina 50,
ACC-3000, and WPS-3000 with
sample loop volumes > 200 µl)
Linearity of injection volume (for
sample loop volumes ≤ 50 µl)
Detector linearity
Precision of injection volume
and flow (not for Gina 50)
Detector linearity
RA5
5
Caffeine in water
220 µg/ml
Precision of injection volume
and flow
(WPS-3000(T)SL Micro)
Detector linearity
RA6
6
Caffeine in water
300 µg/ml
Detector linearity
RA7
7
Caffeine in water
2000 µg/ml
Carry-over by the autosampler
RA8
8
Water (solvent)
Carry-over by the autosampler
(1)
Dionex autosamplers: ASI-100(T), WPS-3000(T)SL / PL, WPS-3000TBPL Analytical,
WPS-3000(T)RS and ACC-3000(T)
For the five standards required for qualifying the RI detector, order part no. 3325.0010
Sample Position
ASI-100 WPS-3000xx(2)
Substance
Concentration
Checks
RA9
RB1
Any
Sampler
9
RA10
RB2
10
Glycerin in water
10 mg/ml
RI detector linearity
RA11
RB3
11
Glycerin in water
15 mg/ml
RI detector linearity
RA12
RB4
12
Glycerin in water
25 mg/ml
RI detector linearity
RA13
RB5
13
Glycerin in water
35 mg/ml
RI detector linearity
(2)
Glycerin in water
5 mg/ml
RI detector linearity
xx: WPS-3000(T)SL / PL, WPS-3000TBPL Analytical, WPS-3000(T)RS und ACC-3000(T)
In addition, the following solvents are required:
Solvent
Methanol (HPLC grade) –
Channel A
Quantity
Approx. 100 ml
Checks
Wavelength accuracy of UV Detector (exceptions
see section 3.2)
Water (HPLC grade) –
Channel A
Approx. 600 –
1200 ml
All tests except wavelength accuracy of the UV
detector (exceptions see section 3.2)
Water (HPLC grade) with
0.1 % Vol. acetone –
Channel B
Approx. 300 ml
Gradient accuracy, gradient precision, and ripple
For qualifying the column compartment, a calibrated thermometer is required. The thermometer is
provided in the Column Thermostat PQ kit (part no. 5705.0050A).
For qualifying the column compartment of the ACC-3000(T), a flexible temperature sensor (Temperature Sensor Type K for Thermometer P600, part no. 6820.0010) is required in addition to the Column
Thermostat PQ kit.
Page 28 of 95
HPLC_OQ_PQ_E_Manual.doc – Version: 6.8 dated Oktober 2008
OQ and PQ Operating Instructions
3.2 Test Procedure for Single Wavelength and VWD-3400RS
Detectors
Some important steps in the test procedure for single wavelength detectors and Dionex VWD-3400RS
detectors differ from the steps described in section 3.1:
The Standards kit (part no. 3323.0010) includes seven caffeine and pyrene standards. However, as
caffeine is used for the wavelength accuracy check, you do not have to prepare (that is, dissolve) the
pyrene standard. Sample position RA1 (or 1) is not used.
In addition, the solvent used for the wavelength accuracy check is water (not methanol). Therefore,
only the following solvents are required:
Solvent
Water (HPLC-grade) –
Channel A
Water (HPLC-grade) with 0.1 %
Vol. acetone – Channel B
Quantity
Approx. 700 – 1300 ml
Checks
All
Approx. 300 ml
Gradient accuracy, gradient
precision, and ripple
3.3 Connecting and Configuring the System
The steps below describe the fluid connections of the HPLC system and all configuration settings
required for OQ and PQ in Chromeleon (Server Configuration Program) or on the instrument. Perform
all steps for each module in the system.
3.3.1 System Connections
System
Remove the column from the system. In both positions of the motorized switching valve of the
autosampler, thoroughly rinse all fluid components of the autosampler and injection valve with
water. Rinse also the pump thoroughly with water. Only then, connect the pressure regulator or
restriction tubing from the Performance Qualification kit to the injection valve and the UV detector,
using the fitting screws shipped with the kit. Use the 33 mm finger-tight fitting for the injection valve
and the single-part hand-tight fitting for the UV detector. With the restriction tubing, install the
PEEK tubing from the Performance Qualification kit between the injection valve and the restriction
tubing, using the connecting units from the kit if necessary ( Figure 1).
Figure 1: Restriction tubing installed between injection valve and detector
If the system includes several detectors that are connected in series, connect the pressure
regulator or the restriction tubing to the detector that was connected to the column.
HPLC_OQ_PQ_E_Manual.doc – Version: 6.8 dated Oktober 2008
Page 29 of 95
OQ and PQ Operating Instructions
Qualifying
a
Dionex P680 DGP,
DGP-3600A(B),
or
DGP-3600M(B)
pump
To qualify both pumps of a Dionex dual gradient pump with the same autosampler, pressure
regulator or restriction tubing, and detector, you have to use an external motorized switching
valve, such as, a valve in the Dionex TCC-100, TCC-3100, TCC-3200(B) or TCC-3000RS/SD..
(For a list of the supported valves, see section 3.5). For information about the fluid connections,
see the images below.
Case a: 6-port/2-position valve
Figure 2:
Fluid connection for testing the Dionex P680 DGP and DGP-600A,
using a 6-port/2-position valve
Left: The valve is in position A or 1, depending on the valve type
Right: The valve is in position B or 2, depending on the valve type
Case b: 10-port/2-position valve
Figure 3:
Fluid connection for testing the Dionex P680 DGP and DGP-600A,
using a 10-port/2-position valve
Left: The valve is in position A
Right: The valve is in position B
Manual injection valve
Verify that the injection valve is fitted with a 10-µl sample loop.
Autosampler
Position the standards as shown in the tables on page 27 and the following pages.
compartment
Column
When qualifying the column compartments, the temperature sensor of the thermometer must be
securely attached to the heating block.
On the supported Shimadzu column compartments, loosen a fastening screw, insert the sensor
between the screw and the metal block, and carefully retighten the screw.
When qualifying the Dionex ACC-3000(T) column compartment, install the temperature
sensor as shown in Figure 4. Be sure to use the type K temperature sensor (and not the
sensor from the Column Thermostat PQ Kit). Install the temperature sensor behind the left
capillary clip, from a vertical point of view in the center of the oven, and 2 cm away from the
right edge of the heat-conductive pad.
Page 30 of 95
HPLC_OQ_PQ_E_Manual.doc – Version: 6.8 dated Oktober 2008
OQ and PQ Operating Instructions
Position of the sensor tip behind the capillary clip
Figure 4: ACC-3000(T) – Position of the temperature sensor
3.3.2 Configuration
RF2000
fluorescence
detector
Before you connect the RF2000 fluorescence detector with Chromeleon, set the ZWAVE
parameter to 1. You can set this value only on the instrument:
Disable the keyboard interlock by simultaneously pressing <Shift> and <CE>.
Press <func> until the ZWAVE command appears on the display.
Press <1> on the number keypad and confirm with <Enter>.
Enable remote operation. To do so, press <func>, until the RS232 command appears on the
display. Confirm with <Enter>, and then press <func>. On the display, the reading is
CONNECT. Confirm with <Enter>. You can then connect the instrument with Chromeleon.
AD25 UV detector
On the Signals page for the AD25 in the Server Configuration program, change the unit to mAU
(instead of AU) and the factor to 1000 (instead of 1.000).
WPS-3000(T)PL autosampler
For successful qualification of the Dionex WPS-3000(T)PL autosampler, make sure that the
Upgrade Kit for a 250 µl-syringe is installed.
WPS-3000TBPL Analytical autosampler
In order to ensure a successful qualifcation, the Dionex WPS-3000TBPL Analytical autosampler
must be equipped with the standard or large volume configuration. In addition, it must be activated
in the Server Configuration on the Options page of the "WPS-3000TBPL Analytical“ driver:
HPLC_OQ_PQ_E_Manual.doc – Version: 6.8 dated Oktober 2008
Page 31 of 95
OQ and PQ Operating Instructions
Dionex (UltiMate 3000) autosamplers with user-defined sample loop volume
The sample loop volume must be at least 20 µl. In addition, you must set the sample loop volume
in the Server Configuration program to a value predefined by Chromeleon (see table).
Autosampler
WPS-3000(T)PL
WPS-3000(T)SL /
WPS-3000(T)RS
With 250 µl injection volume kit
ACC-3000(T)
Page 32 of 95
User-defined sample
loop volume
20 – 39 µl
40 – 124 µl
> 125 µl
20 – 39 µl
40 – 129 µl
> 130 µl
344 µl
21 – 49 µl
51 – 199 µl
> 200 µl
Sample loop volume
setting
20 µl
50 µl
125 µl
20 µl
Micro
Analytical
344 µl
20 µl
50 µl
200 µl
HPLC_OQ_PQ_E_Manual.doc – Version: 6.8 dated Oktober 2008
OQ and PQ Operating Instructions
Qualifying the column compartment
Option A Using the Column Thermostat PQ kit:
Connect the thermometer to a free COM port on the Chromeleon server PC. Install the
Dostmann Thermometer P500/P600 in the Chromeleon Server Configuration program. On the
General tab page, select the COM port to which the thermometer is connected. In addition,
install a virtual channel (Device name: VirtualChannels_01; signal Name: TemperatureOVEN).
Tip:
When changing the temperature sensor, you may have to adapt the calibration
values and sensor type setting of the thermometer. Otherwise, the thermometer
may show the wrong temperature. This is especially important when qualifying the
column compartment of the ACC-3000(T), which is qualified using a type K
temperature sensor.
Option B Automatic data acquisition as analog signal:
In the Chromeleon Server Configuration program, install the analog output of the external
thermometer (Device: Integrator Driver) as an analog channel named TemperatureOVEN.
Option C Manual data acquisition:
In the Chromeleon Server Configuration program, install the STH_manual device. The driver
is available under Generic on the Manufacturers list. Verify that the driver is in Demo Mode.
In addition, install a virtual channel (device name: VirtualChannels_01, signal name:
TemperatureOVEN). During the chromatographic run, you can then enter the temperature
indicated on the external thermometer on the OQ_PQ_STH_manual control panel. Option C
does not support qualification of the Agilent, Shimadzu, and Waters column compartments.
Tip:
Sequence templates created with Chromeleon < 6.50 can be used in Chromeleon
6.50 only after you have deleted the STH_manual.connect line from the
COLUMN_OVEN program file. If you created new sequence templates from the
Chromeleon 6.50 or later master templates, you do not need to adapt the program
file manually.
Tip:
Note that option C (qualifying the column compartment with manual data acquisition)
is not supported for Agilent, Shimadzu, and Waters instruments.
HPLC_OQ_PQ_E_Manual.doc – Version: 6.8 dated Oktober 2008
Page 33 of 95
OQ and PQ Operating Instructions
3.4 Preparations
3.4.1 Preparing the HPLC System
To prepare the HPLC system for OQ or PQ, follow the steps below. Perform all steps for the
instruments in the system, observing the correct order.
UV Detector
Turn on the detector lamp. Allow the lamp to be on for at least six hours before you start the check.
When you use one of the following detectors, just turn on the UV lamp: DAD-3000(RS),
MWD-3000(RS), PDA-100, PDA-3000, VWD-3100, VWD-3400RS, AD25, TSP UV1000, TSP
UV2000, TSP UV3000, TSP UV6000, or Shimadzu SPD-10AVvp.
Refractive Index Detector
When you use an RI detector, turn on the instrument at least one hour before you start the check.
Rinse the reference cell and the sample cell at a flow rate of 10.0 ml/min (mobile phase: water). If
you check the wavelength accuracy of the UV detector using methanol (all detectors except the
Dionex VWD-3x00 detectors and all single wavelength detectors), disconnect the fluid components
of the RI detector from the HPLC system after you have rinsed the cells with water.
Fluorescence Detector
Turn on the detector lamp. Allow the lamp to be on for approximately 30 minutes before you start
the check.
Evaporative Light Scattering Detector
Turn on the detector lamp. Allow the lamp to be on for approximately 30 minutes before you start
the check.
Autosampler
Before you start the check, rinse the autosampler thoroughly with water. To do so, inject 250 µl of
water at least five times (If the allowed maximum injection volume of the autosampler is smaller,
inject five times the largest possible volume). Make sure that the fluid components and the syringe
are free of air bubbles. (Note: Although methanol is used as solvent for the first OQ and PQ check,
rinse the autosampler with water, as water is the solvent for all successive checks. Automatically
rinsing the system after the wavelength accuracy check ensures that the fluid system is sufficiently
prepared.)
Pump
When qualifying an RI detector, rinse the entire HPLC system with water. If you want to check the
wavelength accuracy for the UV detector, disconnect the fluid components of the RI detector from
the HPLC system before you rinse channel A with methanol. When qualifying Dionex VWD3400RS detectors and all single wavelength detectors, or if the wavelength accuracy is not
checked, use water to rinse channel A. In this special case, you need not disconnect the fluid
components of the RI detector from the HPLC system. For gradient pumps, use water + 0.1 % Vol.
acetone to rinse channel B. For a ternary high-pressure gradient system or an M480 low-pressure
gradient pump, use water to rinse channel C.
3.4.2 Checking the Fluidics
Injection Valve and Autosampler
Verify that there are no pressure fluctuations when the valve switches from Load to Inject and vice
versa. Pressure fluctuations indicate system leakage or contamination. Eliminate any leaks and
contamination before you start the check.
Page 34 of 95
HPLC_OQ_PQ_E_Manual.doc – Version: 6.8 dated Oktober 2008
OQ and PQ Operating Instructions
3.5 Preparing Chromeleon
3.5.1 Template Structure
To prepare Chromeleon for Operational Qualification or Performance Qualification, follow the steps
below:
The Wizard generates sequence templates from the master sequence of the Chromeleon CD,
providing only sequences that match the timebase. In addition, the Wizard adapts the programs
automatically to the devices installed in the timebase ( Figure 5, step 1). For each check that is
performed on the same system, a separate copy of the sequence template is made ( Figure 5, step
2). OQ/PQ is then performed with the sequences of the copied template ( section 3.6) for OQ/PQ. In
this way, you may need to adapt the sequence templates only once to the device configuration to be
checked.
Step 1: OQ/PQ Setup
Step 2: Instruments OQ/PQ
Figure 5: Performing OQ/PQ
The PQ_OQ directory on the Chromeleon CD has the following subdirectories ( Figure 5):
ED_TEMPLATES, HPLC_TEMPLATES, IC_TEMPLATES and NANO_CAP_LC_TEMPLATES, Demo,
and Reports.
The HPLC_TEMPLATES directory contains all master sequences required for OQ or PQ of a common
HPLC configuration. This directory has a SPECIAL HPLC TEMPLATES subdirectory for special tests
( section 4). When creating the sequence templates, the Wizard provides only those sequences that
match the timebase. For IC and BioLC systems, the Wizard provides the sequences from the
IC_TEMPLATES directory. For systems with electrochemical detector, the sequences from the
ED_TEMPLATES directory are provided. For nano, cap, and micro systems, the Wizard provides the
sequences from the NANO_CAP_LC_TEMPLATES directory, and for HPLC systems, the Wizard
provides the sequences from the HPLC_TEMPLATES directory. The Dionex PDA-100 and PDA-3000
detectors are included in the master sequences of the IC_TEMPLATES and HPLC_TEMPLATES
directories. These OQ/PQ operating instructions refer only to the sequences of the
HPLC_TEMPLATES directory.
HPLC_OQ_PQ_E_Manual.doc – Version: 6.8 dated Oktober 2008
Page 35 of 95
OQ and PQ Operating Instructions
Figure 6: PQ_OQ directory structure on the CM_CD
Tip:
The sequences of the HPLC_TEMPLATES directory do not support the qualification of
systems that include a Dionex FLM-3x00 Flow Manager. Sequences for qualifying these
systems are available in the NANO_CAP_LC_TEMPLATES directory.
3.5.2 Creating the Sequence Templates
To install the sequences required for your system, follow the steps below:
Insert the Chromeleon CD or verify that you can access the PQ_OQ directory.
From the Browser, open the Qualification menu.
OQ or PQ Setup
Figure 7: Selecting OQ or PQ setup
Page 36 of 95
HPLC_OQ_PQ_E_Manual.doc – Version: 6.8 dated Oktober 2008
OQ and PQ Operating Instructions
Select OQ Setup or PQ Setup. A Wizard assists you in copying the sequences. Clicking Next>
takes you to the next Wizard step.
Figure 8: OQ/PQ setup wizard welcome page
Select the timebase for which you want to perform OQ or PQ. Enter the name of the computer on
which the timebase is installed.
Figure 9: Selecting a timebase
HPLC_OQ_PQ_E_Manual.doc – Version: 6.8 dated Oktober 2008
Page 37 of 95
OQ and PQ Operating Instructions
Select the source directory of the master sequences. Select PQ_OQ.
Figure 10: Selecting the source directory
Enter a unique name for the timebase. The directory that contains all sequence templates is then
saved under this name.
Figure 11: Entering the location for saving the template
Page 38 of 95
HPLC_OQ_PQ_E_Manual.doc – Version: 6.8 dated Oktober 2008
OQ and PQ Operating Instructions
A list of sequences is displayed, based on the timebase configuration in the Chromeleon Server
Configuration program.
Figure 12: List of sequences for the timebase
When Chromeleon cannot automatically determine the pump type or the pump variant, you can
adapt the sequences as required. This applies to the Dionex M480 pump, that is, the HPG_M480
sequence for the M480 HPG and LPG_M480 sequence for the M480 LPG. It also applies to the
mixing chamber size of the Dionex P680 and UltiMate 3000 pumps, except for the low-pressure
micro pumps - volume of the installed mixing chamber (STD_GRAD sequence for the standard
mixing chamber, Micro_Grad sequence when the MicroFlow Kit is installed, and LONG_GRAD
sequence when a mixing chamber extension is installed).
In all other cases, the selection is read-only.
Select the sequences required for the checks that you want to perform ( section 4). The selected
sequences are automatically copied to the corresponding datasource. When installation is
complete, the report opens on the Specification page.
Tip:
If you use the TSP UV1000 UV detector, you can select the sequences only if the UV
lamp is turned on in the detector.
3.5.3 Adapting the Report and Method
Disable writing protection (on the Edit menu, click Layout Mode), and then enter the
charge number, expiry date, and actual concentration of the standard
customer name and tester name
component that generates the backpressure [default: capillary (L: 15 m; ID: 0.18 mm)]
For all devices listed in the table below, the instrument names and limits recommended by Dionex
are automatically entered into the report only when you open the report after the Warm up sample.
The information is not yet entered when the sequence is copied. Do not fill in the report for the
supported devices (see below). The limits are listed from line 154 on. Change the limits only if
you do not want to use the limits recommended by Dionex.
HPLC_OQ_PQ_E_Manual.doc – Version: 6.8 dated Oktober 2008
Page 39 of 95
OQ and PQ Operating Instructions
Tip:
When you use a Dionex UVD 170S, UVD 340S, UVD 170U, UVD 340U, VWD-3100 or
VWD-3400RS detector with a non-analytical flow cell, you have to enter the specifications
listed in section 2.3.2 or 4.2 manually into the report. The reason is that automatic
recognition of flow cell is not supported or not implemented.
The serial number is entered automatically for the following devices: all devices of the Agilent
1100/1200 series, all devices of the Dionex UltiMate 3000 series, all P680 and P580 pumps, the
Dionex ASI-100 autosampler, the Dionex PDA-100, AD25, UVD 340U, and UVD 170U detectors,
and the supported Shimadzu devices. For all other devices, enter the serial number in column K
from line 141 on. (The fields have a yellow background.) Delete the value in the related input field
by clicking Clear Values on the Edit menu. This removes the Chromeleon variable from the cell
and clears the audit.xxx entry for the cell on the status bar.
When qualifying instruments that are not listed in the table below, enter the model name in column
H (fields with a yellow background), deleting the existing audit.xxx entry as before. From line 159
on, enter the limits in the column with the related model name.
Enable writing protection (on the Edit menu, clicking Layout Mode).
SAVE the report. To do so, click Save Report Definition on the Workspace menu.
To check the linearity of the UV detector, adapt the amounts in the QNT file of the sequence to the
actual amounts of the used standards.
3.5.4 Device Names
The PGM files of the installed sequences apply to the following devices, device names, and channel
names, as determined in the Chromeleon Server Configuration program:
Device
Entire system
Pumps
Page 40 of 95
Supported Model
Waters Alliance 2690 Separation Module
Dionex HPG-3200RS (UltiMate 3000)
Dionex HPG 3400RS (UltiMate 3000)
Device Name:
Pump Device Name:
Name
HPLC_System
Dionex ISO-3100A (UltiMate 3000)
Dionex LPG-3400A(B) (UltiMate 3000)
Dionex HPG-3200A (UltiMate 3000)
Dionex HPG-3200M (UltiMate 3000)
Dionex HPG-3400A (UltiMate 3000)
Dionex HPG-3400M (UltiMate 3000)
Dionex P680 (all models except P680A DGP-6)
Dionex P580
Dionex M480
Dionex M300
Agilent 1100/1200 series G1310A
Agilent 1100/1200 series G1311A
Agilent 1100/1200 series G1312A
Agilent 1100/1200 series G1312B
Pump module of the Waters Alliance 2690 Separation
Module
TSP P2000
TSP P4000
Shimadzu LC-2010 pump
Shimadzu LC-10ATvp
Shimadzu LC-10ADvp
Dionex LPG-3400M(B) (UltiMate 3000)
Pump
Pump Module
Pump
MicroPump
HPLC_OQ_PQ_E_Manual.doc – Version: 6.8 dated Oktober 2008
OQ and PQ Operating Instructions
Device
Pumps
(Cont'd)
Column switching
valve for
qualifying Dionex
DGP pumps
UV detectors
Supported Model
Dionex DGP-3600A(B) (UltiMate 3000)
Dionex P680 DGP-6:
Left pump unit
Right pump unit
Dionex DGP-3600M(B) (UltiMate 3000)
Left pump unit
Right pump unit
MSV of the Dionex TCC-3000RS (UltiMate 3000)
MSV of the Dionex TCC-3000SD (UltiMate 3000)
MSV of the Dionex TCC-3100 (UltiMate 3000)
MSV of the Dionex TCC-3200(B) (UltiMate 3000)
MSV of the TCC-100
Reodyne RV/EV Valve
Reodyne LabPro Valve
Valco Multi Position Valve
Valco Two Position Valve
Dionex DAD-3000 (RS) (UltiMate 3000)
Dionex MWD-3000 (RS) (UltiMate 3000)
Dionex PDA-3000 (UltiMate 3000)
Dionex VWD-3100 (UltiMate 3000)
Dionex VWD-3400RS (UltiMate 3000)
Dionex PDA-100
Dionex AD25
Dionex UVD 340U
Dionex UVD 170U
Dionex UVD 340S
Dionex UVD 170S
Dionex UVD 160S
Dionex UVD 320S
Agilent 1100/1200 series G1315A
Agilent 1100/1200 series G1315B
Agilent 1100/1200 series G1315C
Agilent 1100/1200 series G1315D
Agilent 1100/1200 series G1314A
Agilent 1100/1200 series G1314B
Agilent 1100/1200 series G1314C
Agilent 1100/1200 series G1365A
Agilent 1100/1200 series G1365B
Agilent 1100/1200 series G1365C
Agilent 1100/1200 series G1365D
Waters PDA996 Diode Array Detector
Waters PDA2996 Diode Array Detector
Waters 2487 Dual Lambda Absorbance Detector
TSP UV1000 Single Lambda Detector
TSP UV2000 Dual Lambda Detector
TSP UV3000 (digital and analog data acquisition)
TSP UV6000 PDA
Shimadzu LC-2010 SPD
Shimadzu SPD-10Avp
Shimadzu SPD-10AVvp
UV channel
names
HPLC_OQ_PQ_E_Manual.doc – Version: 6.8 dated Oktober 2008
Name
PumpLeft
PumpRight
LoadingPump
MicroPump
as device name:
ColumnOven
Valve
UV
UV_VIS_1,
UV_VIS_2,
UV_VIS_3
Page 41 of 95
OQ and PQ Operating Instructions
Device
Samplers
Samplers
(Cont'd)
Column
thermostats
Supported Model
Dionex ACC-3000(T) (UltiMate 3000)
Dionex WPS-3000(T)RS (UltiMate 3000)
Dionex WPS-3000(T)SL (UltiMate 3000)
Dionex WPS-3000(T)PL (UltiMate 3000)
Dionex WPS-3000TBPL Analytical (UltiMate 3000)
Dionex ASI-100
Dionex GINA 50
Dionex GINA 160
HP1100 G1313A
Agilent 1100/1200 series G1329A
Agilent 1100/1200 series G1329B
Agilent 1100/1200 series G1367A
Agilent 1100/1200 series G1367B
Agilent 1100/1200 series G1367C
Sampler module of the Waters Alliance 2690 Separation
Module
TSP AS3000/AS3500
Shimadzu LC-2010 sampler
Shimadzu SIL-HTA
Shimadzu SIL-HTC
Shimadzu SIL-10ADvp
Dionex ACC-3000(T) (UltiMate 3000)
Dionex TCC-3000RS (UltiMate 3000)
Dionex TCC-3000SD (UltiMate 3000)
Dionex TCC-3000 (UltiMate 3000)
Dionex TCC-3100 (UltiMate 3000)
Dionex TCC-3200(B) (UltiMate 3000)
Dionex TCC-100
Dionex STH 585
Agilent 1100/1200 series G1316A
Agilent 1100/1200 series G1316B
Column compartment module of the Waters Alliance 2690
Separation Module
Shimadzu LC-2010 column compartment
Shimadzu CTO-10Avp
Shimadzu CTO-10ACvp
Shimadzu CTO-10Asvp
Column oven of the TSP AS3000/AS3500 Autosampler
Signal name of
the external
thermometer
Device name of
the virtual channel
Name
Sampler
Sampler
ColumnOven
Sampler
TemperatureOV
EN
VirtualChannels
_01
Fluorescence
detectors
Dionex RF2000
Dionex RF1002
Emission
RI detector
Shodex RI-101
Agilent 1100/1200 series G1362A
RI
ELS detector
Polymer Laboratories ELS2100
ELSD
Tip:
When you start the batch, the following warnings may appear:
{SOLVENT_CHANGE (91)}
SOLVENT_CHANGE (91): Warning P0001: The program start time is undefined.
{SOLVENT_CHANGE - Sampler}
Missing inject command.
{Pump} Eluent %A changed from methanol to water. Is this correct?
{OQ_COLUMN_OVEN (64) – TemperatureOven}
Page 42 of 95
Setting of property ‘Average’ overrides channel type default.
HPLC_OQ_PQ_E_Manual.doc – Version: 6.8 dated Oktober 2008
OQ and PQ Operating Instructions
When qualifying a column compartment with manual data acquisition with Chromeleon 6.50 or later,
you can use sequence templates that were created with Chromeleon < 6.50 only after you have
deleted the STH_manual.connect line from the COLUMN_OVEN program file.
Use the above names in the Chromeleon Server Configuration program also when you use
instruments other than those listed. If you do not use these names, the system cannot automatically
select the checks to be performed and the appropriate sequences. It may then be necessary to adapt
the program files manually.
3.6 Performing the Checks
To copy the template ( section 3.5.2), follow the steps below:
In the Browser, open the Qualification menu.
Select Instruments OQ or Instruments PQ. A Wizard guides you through copying the
sequences. Clicking Next > takes you to the next Wizard steps.
Select the timebase for which you want to perform OQ or PQ. Enter the name of the computer on
which the timebase is installed.
Select the source directory of the template to be used.
Enter a unique name for saving the copy (default: template name + date).
A list is displayed containing all sequences of the corresponding template. Click to select the
sequences
required
for
the
checks
(
section
4).
After the sequences have been copied, the batch list of the corresponding timebase is
automatically opened. Start the batch to process the sequences.
The checks are processed in the following order:
1. Fluid preparation of the system (Warm up sequence)
2. Temperature accuracy of the column compartment for manual data acquisition
(Column Oven sequence)
3. Wavelength accuracy of the UV detector (Wavelength sequence)
4. Baseline noise, drift, and lamp intensity of the UV detector (UV Noise Drift sequence)
5. Precision of injection volume and flow (Injector Flow Repro sequence and Injector Flow
Repro_P680DGP_Left sequence if necessary)
6. Linearity of the UV detector (UV Linearity sequence)
7. Linearity of the injection volume (Sampler Lin CO sequence)
8. Carry-over by the autosampler (Sampler Lin CO sequence)
9. Baseline noise, signal height, and wavelength accuracy of the fluorescence detector
(Fluorescence sequence)
10. Baseline noise and drift of the RI detector (RI_Noise_Drift sequence)
11. Linearity of the RI detector (RI_Linearity sequence)
12. Baseline noise of the evaporative light scattering detector (ELS_Noise sequence)
13. Solvent composition of gradient pumps: accuracy, precision, and ripple (LPG_M480 or
HPG_M480 sequences; STD_GRAD, MICRO_GRAD, or LONG_GRAD sequences, or
STD_GRAD_P680DGP_Left or LONG_GRAD_P680DGP_Left sequences)
14. Solvent composition for ternary high-pressure gradient pumps: accuracy, precision, and ripple
between channels C and B (Tern_Grad_C_B sequence)
15. Temperature accuracy of the column compartments for automatic data acquisition (Column Oven
sequence)
16. Resetting the solvent flow rate to 0.05 ml/min (Stop sequence)
Tip:
When you use a manual injection valve, make sure that no air is injected with the
samples. Besides, inject five times the sample loop volume, that is, inject at least 50 µl.
HPLC_OQ_PQ_E_Manual.doc – Version: 6.8 dated Oktober 2008
Page 43 of 95
OQ and PQ Operating Instructions
3.7 Check Time
If the column compartment and the RI detector are not included in the check, the entire check takes
approximately 3.5 hours. Depending on the check, more time may be required:
2 more hours when checking Dionex P680 pumps, UltiMate 3000 pumps with mixing chamber
extension, or an UltiMate 3000 LPG-3400M(B) pump (LONG_GRAD sequence instead of the
STD_GRAD or MICRO_GRAD sequence)
2 more hours when checking Dionex P680 DGP or UltiMate 3000 DGP pumps (standard
configuration)
4 more hours when checking Dionex P680 DGP pumps, UltiMate 3000 DGP micro pumps, or
pumps with mixing chamber extension
3 more hours when checking the column thermostat
1.5 more hours when checking the RI detector
0.5 more hours when checking the ELS detector
2 more hours when checking a ternary high-pressure gradient system (channels C and B)
After the wavelength accuracy of the UV detector has been checked, that is, after approximately 15
min. or 3 h 15 min., you are prompted to change the solvent for channel A from methanol to water. If
necessary, connect the fluid components of the RI detector to the system. If an autosampler is
installed, OQ/PQ will then run automatically.
Exemption: It is not necessary to change the solvent manually when qualifying systems in which the
UV detector is a Dionex VWD-3400RS or a single wavelength detector.
3.8 Evaluating the Sequences
To evaluate the detector linearity, enter the actual concentrations for the used standards into the
amount columns of the QNT file.
The master sequence on the Chromeleon-CD and thus, all copies made from it for OQ and PQ are
linked to the corresponding report. Do not change this report (for exceptions, section 3.5.3). In
the report, many references link the separate data sheets. When lines or columns are inserted or
deleted, the references are lost and thus, the calculations will be wrong!
To ensure that the data are correctly read and processed in the report, print the report as Batch
Report from the Browser. Select the sequence for which you want to print the report. Verify that no
sample is selected! On the File menu, select Batch Report, and then click OK to start printing.
3.9 Repeating Checks
It may be necessary to repeat one or several checks. In this case, refer to section 6. This section
provides possible causes for the failure. According to GLP, you have to repeat all checks following the
one that failed. The reason is that almost all checks require that the previous check be passed
successfully.
Example: If the UV detector linearity check fails, the results regarding the linearity of the injection
volume are questionable because the detector linearity is a prerequisite for checking the injection
volume.
Page 44 of 95
HPLC_OQ_PQ_E_Manual.doc – Version: 6.8 dated Oktober 2008
OQ and PQ Operating Instructions
4 Special Test Procedures for Individual Modules
4.1 Introduction
This section describes test procedures that fundamentally differ from the procedures described in
section 3. These procedures refer to a certain instrument; they cannot be used for any other
instrument. In addition, all test sequences must be run one after the other, as the tests require
different system configurations. The test procedures described in sections 3 and 5 serve as a basis;
this section focuses on the differences in particular. Whenever the test steps are identical, you are
referred to sections 3 and 5.
The sequence templates for these tests are available in the SPECIAL_HPLC_TEMPLATES directory
(see Figure 6). Start the OQ/PQ Setup from this directory as described in section 3.5.2.
4.2 Dionex VWD-3x00 Detectors: Noise and Drift with Dummy Flow
Cells
For qualifying the Dionex VWD-3100 and VWD-3400 detectors with dummy flow cell, you have to add
the UV_NOISE_DRIFT_VWD3x00 sequence manually to the batch list. This sequence can be used
only for the above detectors and the test procedure requires that the flow cell be changed twice.
The following table shows the drift and noise limits for dummy flow cells. The specifications have to be
entered into the report manually.
Instrument
Parameter
VWD-3100,
Baseline Noise
VWD-3400RS
(dummy flow cell)
(1)
Description
Measured with the dummy flow
cell included in the shipment
(without fluidics).
Limits(1)
OQ
PQ
0.010 mAU 0.020 mAU
OQ limits with optimum measuring conditions, recommended PQ limits
4.3 Dionex Autosamplers: Sample Temperature Accuracy
This section describes how the sample temperature accuracy is determined for the following Dionex
autosamplers: WPS-3000TRS, WPS-3000TPL, WPS-3000TBPL Analytical, WPS-3000TSL, and ACC3000T. For this test, only the autosampler is required. The other modules of the HPLC system are not
required.
4.3.1 Test Procedure
The following table lists the materials required for performing the test.
Part No.
6820.0010
5705.0050A
Description
Type K temperature sensor for P600 thermometers
Column Thermostat PQ Kit
Quantity
1
1
In addition, a standard glass vial (1.8 ml) is required. Fill the vial with water (do not seal).
HPLC_OQ_PQ_E_Manual.doc – Version: 6.8 dated Oktober 2008
Page 45 of 95
OQ and PQ Operating Instructions
4.3.2 Connecting and Configuring the System
System connections
Connect the type K temperature sensor to the thermometer and make the settings (that is,
adapt the sensor type and calibration values) as described in the instructions for the
thermometer.
Fill an open standard glass vial (1.8 ml) with water and place it at sample position RC8.
Insert the temperature sensor into the vial at a right angle until the tip touches the vial bottom.
Figure 13: Temperature sensor inserted into the vial
Rotate the carousel until the carousel cover closes completely.
Figure 14: Cover closed
Page 46 of 95
HPLC_OQ_PQ_E_Manual.doc – Version: 6.8 dated Oktober 2008
OQ and PQ Operating Instructions
Configuration
Connect the thermometer to a free COM port on the Chromeleon Server PC. Install the Dostmann
Thermometer P500/P600 in the Chromeleon Server Configuration program On the General page,
select the COM port to which the thermometer is connected. In addition, install a virtual channel
(Device Name: VirtualChannels_01, Signal Name: TemperatureOVEN).
Preparing Chromeleon
To qualify the sample
SAMPLER_TEMP_ACC
temperature
accuracy,
select
the
following
sequence:
4.3.3 Performing the Check
Set the sample temperature to 10°C (15°C for the ACC-3000T). When the nominal temperature is
reached, the external thermometer is used to record the sample temperature over a period of
30 minutes.
Tip:
Do not perform any autosampler commands during the test. Moving the needle arm or
carousel may damage the thermometer or autosampler.
4.3.4 Duration
The test takes approximately 45 minutes.
HPLC_OQ_PQ_E_Manual.doc – Version: 6.8 dated Oktober 2008
Page 47 of 95
OQ and PQ Operating Instructions
Page 48 of 95
HPLC_OQ_PQ_E_Manual.doc – Version: 6.8 dated Oktober 2008
OQ and PQ Operating Instructions
5 Procedures
5.1 Baseline Noise, Drift, and Lamp Intensity of the UV Detector
5.1.1 Theory
Drift and baseline noise are important factors for UV detectors. Increased baseline noise considerably
reduces the sensitivity, as it is not possible to distinguish between low-level signals and noise. With
increased drift, it is more difficult to integrate the signals correctly because the less stable the baseline
is, the more inaccurate is integration.
The baseline noise of the detector mainly depends on the lamp. There is a considerable increase in
noise if an old lamp with poor light intensity is used. This is also true when the flow cell is dirty. In
addition, make sure that the measuring and ambient conditions are constant and that the flow cell is
free from gas bubbles.
To measure the drift of a UV detector, also make sure that the measuring and ambient conditions are
constant. In addition, it is very important that the lamp has been burning for several hours. In the
detector environment, avoid drafts and direct sunlight.
0,41
Rauschen_Drift_3DFELD_MeOH_UVD2 #1
Rauschen_Drift_3DFELD_MeOH_UVD2 #12
mAU
Detector noise drift and lamp intensity
Detector noise drift and lamp intensity
UV_VIS_1
UV_VIS_1
WVL:254 nm
0,30
0,20
0,10
0,00
0,10
0,20
0,30
0,40
0,50
0,60
0,76
2,34
min
3,00
4,00
5,00
6,00
7,00
8,00
9,00
10,00
11,00
11,63
Figure 15: Lamp drift: Directly after the lamp has been turned on (bottom chromatogram)
and after it has been burning for six hours (top chromatogram)
The lamp intensity decreases while the lamp is burning. Besides, the lamp ages when it is turned on
and off very often.
5.1.2 Performing and Evaluating the Checks
The checks for noise, drift, and lamp intensity are included in the UV_Noise_Drift sequence. For those
checks, water is pumped through the cell at a flow rate of 1 ml/min. The UV signal is recorded at
254 nm.
If the lamp intensity can be determined, it is read directly from Chromeleon (wavelength: = 254 nm).
However, for the Dionex VWD-3100 and VWD-3400RS detectors, the lamp intensity is determined at
a wavelength of = 230 nm. The results are no absolute measured physical quantities (such as, the
luminous density or luminous flux). That is why deviations of 5 % from lamp to lamp and from detector
to detector are quite normal. Therefore, to evaluate the data compare them to previously determined
values.
HPLC_OQ_PQ_E_Manual.doc – Version: 6.8 dated Oktober 2008
Page 49 of 95
OQ and PQ Operating Instructions
To calculate noise, the measuring signal is split into 20 intervals of 1 minute each. For each interval,
Chromeleon calculates a regression based on measured values, using the method of least squares.
Parallel to the regression line, two lines are drawn through the values with maximum distance from
this regression line. The calculated values are averaged for all 20 intervals to establish the final value.
To calculate the drift, Chromeleon calculates a regression line from all data points within a range of 1
to 21 minutes based on the method of least squares. The slope of the regression line is the calculated
drift.
5.2 Wavelength Accuracy of the UV Detector
5.2.1 Performing the Check
For UV detectors without PDA option, the wavelength accuracy is established with the
UV_Wavelength sequence.
For photodiode array detectors, use the DAD_Wavelength sequence. For single wavelength detectors
and the Dionex VWD-3400RS detector, use the Wavelength_Single sequence. Separate sequences
are available for the following detectors: Dionex UVD 160, UVD 160S, UVD 320, UVD 320S detetors,
the TSP UV 2000 detector, and the Shimadzu LC-2010 SPD, SPD-10Avp, and SPD-10AVvp
detectors. The Wizard uses the appropriate sequence automatically when the corresponding detector
is installed.
In all cases, wavelength accuracy is determined using pyrene in methanol (c = 3 µg/ml) at a flow rate
of 1 ml/min. However, for single wavelength detectors and the Dionex VWD-3400RS detector, the
wavelength accuracy is determined using caffeine in water (c = 60 µg/ml) at a flow rate of 1 ml/min. As
water is used as solvent, it is not necessary to change the solvent manually.
5.2.2 Evaluating the Check for the UV Detector
The signals are recorded at 331 nm, 333 nm, and 335 nm. A parabola is calculated from the signal
heights of the pyrene signal and the wavelengths. The parabola maximum is determined and
compared to the theoretical value of the spectral maximum for pyrene (333.3 nm).
5.2.3 Evaluating the Check for the Photodiode Array Detector
The UV spectrum for pyrene is recorded between 250 nm and 350 nm. The spectral maxima between
250 nm and 290 nm and between 330 nm and 350 nm are determined by Chromeleon and compared
to their theoretical values (272.1 nm and 333.3 nm).
60,0
Pyrene 100%
%
333.2
271.8
50,0
40,0
317.8
30,0
20,0
10,0
0,0
-10,0
249,4
nm
260,0
270,0
280,0
290,0
300,0
310,0
320,0
330,0
340,0
348,2
Figure 16: UV Spectrum of pyrene in methanol
Page 50 of 95
HPLC_OQ_PQ_E_Manual.doc – Version: 6.8 dated Oktober 2008
OQ and PQ Operating Instructions
5.2.4 Evaluating the Check for Two-Channel Detectors and the UVD 320S
For the following detectors, the signals are recorded at 235 nm, 240 nm, and 245 nm: Dionex
UVD 160, UVD 160S, UVD 320, UVD 320S detector, the TSP UV2000 detector, and the Waters
2487 detector. A parabola is calculated from the signal heights of the pyrene signal and the
wavelengths. The maximum of the parabola is determined and compared to the theoretical value
of the spectral maximum for pyrene (239.4 nm).
For the Shimadzu detectors, the signals are recorded at 333 nm and 335 nm. A parabola is
calculated from the signal heights of the pyrene signal and the wavelengths. The maximum of the
parabola is determined and compared to the theoretical value of the spectral maximum for pyrene
(333.3 nm).
5.2.5 Evaluating the Check for Single Wavelength and VWD-3400RS Detectors
For the following detectors, the signals are recorded at 270 nm, 272 nm and 274 nm: Dionex VWD3100, VWD-3400, and AD25 detectors and the G1314A, G1314B, and G1314C detectors of the
Agilent 1100/ 200 series. A parabola is calculated from the signal heights of the caffeine signal and
the wavelengths. The maximum of the parabola is determined and compared to the theoretical value
of the spectral maximum for caffeine (272.5 nm).
5.3 Linearity of the UV Detector
5.3.1 Theory
The detector linearity mainly depends on the optical and electronic systems. With electronic systems,
non-linearity is caused by dark current and dark current drift. Dark measurements can be used to
compensate the influence of these factors. However, with decreasing light intensity (caused by lamp
ageing or absorption of the solvent or sample), the influence of the dark current on the linearity
increases. As water is the solvent for this check, the influence of the solvent is negligible. The
influence of the sample is fully used to determine the detector linearity. Consider that the resulting
deviations of the linear behavior are only important with high absorption rates (> 1.5 AU).
300
Peak area [mAU*min]
250
200
150
100
50
0
0
50
100
150
200
250
300
350
Concentration [ppm]
Figure 17: Linearity of the detector signal depending on the peak area
HPLC_OQ_PQ_E_Manual.doc – Version: 6.8 dated Oktober 2008
Page 51 of 95
OQ and PQ Operating Instructions
5.3.2 Performing and Evaluating the Check
The detector linearity is established with the UV_Linearity sequence. The detector linearity is
determined at 272 nm using five different caffeine standards (set concentrations: 10 µg/ml, 60 µg/ml,
140 µg/ml, 220 µg/ml, and 300 µg/ml, dissolved in water; the actual concentrations are entered into
the QNT file and taken into account). Water is used as solvent. The flow rate is 1 ml/min. The peak
area and concentration are represented in a graph and the regression line is determined. The
regression coefficient and the relative standard deviation of this line indicate the linearity.
Tip:
Depending on which injection module you use, it may happen that the peak height of the
sample with the highest concentration increases 1500 mAU. This is usually not within the
linearity range of UV detectors. Thus, the limits for the regression coefficient and the
relative standard deviation may not be met. In this case, reduce the injection volume for
all samples used for the linearity check so that the peak height of the sample with the
highest concentration is in the linearity range of the tested detector, i.e., usually below
1500 mAU. As an exception, a linearity range of up to 2500 mAU is specified for the
supported Shimadzu detectors and the Dionex VWD-3100 and VWD-3400RS detectors
with an analytical flow cell installed. The Dionex VWD-3100 and VWD-3400RS detectors
with a semimicro or micro analytical flow cell installed have a specified linearity range of
up to 1700 mAU.
If an autosampler is used when the Dionex PDA-100 or PDA-3000 detectors are tested,
only 8 µl of sample will be injected by default. However, when qualifying the Dionex
VWD-3100 and VWD-3400RS detectors using an autosampler, 13 µl of sample will be
injected.
5.4 Precision of the Injection Volume
5.4.1 Theory
The precision of the injection volume is mainly influenced by the quality of the autosampler syringe
and the syringe volume that has been adjusted to the injection volume. In addition, the mechanics for
the syringe movement is a decisive factor for the accuracy and precision of the injection volume.
Especially when you use a manual injection valve, verify that there are no air bubbles in the sample.
If a manual injection valve is used, inject at least five times the sample loop volume; i.e. inject at least
50 µl.
Varying injection volumes affect the peak areas even if the same standard is injected.
5.4.2 Performing the Check
With the Injector_Flow_Repro sequence, a caffeine standard (solvent: water at a flow rate of
0.3 ml/min; wavelength: 272 nm) is injected six or ten times. The autosampler type determines the
injection volume, standard, and the number of injection (see the table).
The relative standard deviation of the peak areas of the six or ten injections indicates the precision of
the injection volume.
Page 52 of 95
HPLC_OQ_PQ_E_Manual.doc – Version: 6.8 dated Oktober 2008
OQ and PQ Operating Instructions
Autosampler
Standard* used
Injection volume
Number of
injections
10
6
Other
Dionex Gina 50
Dionex Gina 160
Dionex ACC-3000(T)
- Sample loop volume: 200 µl
Dionex WPS-3000(T)SL
- Micro
- with 250 µl injection volume kit
Dionex WPS-3000TBPL Analytical
- Large Volume configuration
Dionex WPS-3000(T)RS Micro option
*) Also see section 3.1.
Standard 4
Standard 3
5 µl
10 µl
Standard 3
20 µl
Standard 5
Standard 3
2 µl
10 µl
10
10
Standard 3
Standard 5
20 µl
2 µl
10
10
10
HPLC_OQ_PQ_E_Manual.doc – Version: 6.8 dated Oktober 2008
Page 53 of 95
OQ and PQ Operating Instructions
5.5 Carry-over by the Autosampler
5.5.1 Theory
After a highly concentrated sample, a sample containing only solvent is injected. Ideally, only the
signal for the solvent is displayed in the chromatogram. However, if a signal for the sample is
displayed, this indicates the carry-over by the autosampler. As the highly concentrated sample
exceeds the linearity range of the detector, a reference sample with a considerably lower
concentration is also injected.
5.5.2 Performing the Check
The carry-over by the autosampler is measured with samples 6 to 9 of the Sampler_Lin_CO sequence
(solvent: water at a flow rate of 0.3 ml/min, wavelength: 272 nm). Samples 6 and 9 contain water
(same vial). Sample 7 contains a solution of caffeine in water; the concentration is 10 µg/ml (standard
2 - reference sample). Sample 8 contains a solution of caffeine in water; the concentration is
2000 µg/ml (standard 7). The carry-over (CO in [%]) is calculated as follows:
CO
AreaWater ,corr
AreaConc:2000 mg / ml
AreaWater ,CarryOver AreaWater
c HighConcentratedSample
AreaRe ference
cRe ference
AreaWater ,CarryOver AreaWater
AreaRe ference
cRe ference
cConc 2000 mg / ml
AreaWater ,corr :
Area of the caffeine peak in the water sample (sample 9 – sample 6)
AreaConc:2000 mg / ml :
Peak area of the highly concentrated caffeine sample (sample 8)
AreaWater ,CarryOver :
Peak area of the water injection (sample 9: solvent and caffeine
peaks) after the carry-over sample (sample 8)
AreaWater :
Peak area of the water injection (sample 6: solvent peak) before the
carry-over sample (sample 8)
AreaRe ference :
Peak area of the reference sample (sample 7)
cRe ference :
Caffeine concentration of the reference solution (conc.: 10 µg/ml)
cConc:2000 mg / ml :
Caffeine concentration of the carry-over solution (conc.: 2000 µg/ml)
5.6 Linearity of the Injection Volume
5.6.1 Theory
The linearity of the injection volume and its precision depend on the quality of the syringe and the
syringe volume that has been adjusted to the injection volume. Besides, the quality of the autosampler
mechanics also affects the result.
Select the concentration of the standard, which is injected in different volumes, in such a way that the
detector works in the linear range for all injections; usually between 10 mAU and 1000 mAU.
Page 54 of 95
HPLC_OQ_PQ_E_Manual.doc – Version: 6.8 dated Oktober 2008
OQ and PQ Operating Instructions
5.6.2 Performing the Check
With the Sampler_Lin_CO sequence, a caffeine standard (solvent: water at a flow rate of 1 ml/min,
wavelength: 272 nm) is injected five times. The autosampler type determines the injection volume and
the standard (see table). The peak area and injection volume are represented in a graph and the
regression line is determined. The correlation coefficient and the standard deviation of this line
indicate the linearity.
Autosampler
Others
Dionex Gina 50
Dionex Gina 160
Shimadzu SIL-10ADvp
Dionex ACC-3000(T)
- Sample loop volume: 20 µl
- Sample loop volume: 50 µl
Dionex WPS-3000(T)SL
- Micro
- with 250 µl injection volume kit
Dionex WPS-3000(T)PL
- sample loop volume: 20 µl
- sample loop volume: 21 - 99 µl
Dionex WPS-3000TBPL Analytical
- Standard-configuration
- Large Volume - configuration
Dionex WPS-3000(T)RS Micro Option
*) Also see section 3.1.
Standard* used
Standard 2
Standard 2
Injection volume
5, 10, 20, 40, and 80 µl
10, 20, 40, 60, and 80 µl
Standard 2
5, 10, 20, 40, and 50 µl
Standard 3
Standard 3
1, 3, 5, 7, and 10 µl
5, 10, 15, 20, and 25 µl
Standard 3
Standard 2
1, 5, 10, 15, and 20 µl
10, 20, 40, 80, and 160 µl
Standard 3
Standard 3
1, 3, 6, 9, and 12 µl
1, 5, 10, 15, and 20 µl
Standard 3
Standard 2
Standard 3
5, 10, 15, 20 und 25 µl
20, 50, 80, 110 und 140 µ
1, 5, 10, 15 und 20 µl
40
Area [mAU*min]
35
30
25
20
15
10
5
0
0
10
20
30
40
50
60
70
80
90
Injection Volume [µl]
Figure 18: Linearity of the injection volume
HPLC_OQ_PQ_E_Manual.doc – Version: 6.8 dated Oktober 2008
Page 55 of 95
OQ and PQ Operating Instructions
5.7 Sample Temperature Accuracy of Autosamplers
5.7.1 Theory
The sample temperature accuracy mainly depends on the cooling and heating accuracy of the
autosampler, the insulation of the sample compartment, and the thermal transfer from the carousel to
the vial.
5.7.2 Performing the Check
The sample temperature accuracy is determined with the help of an external thermometer. The
temperature sensor is placed in a standard vial (1.8 ml) filled with water. The carousel cover must be
closed during the test. The autosampler temperature is set to a nominal temperature (e.g., 10°C),
depending on the autosampler type. When the nominal temperature is reached, the sample (water)
temperature is recorded over a period of 30 minutes. Within the 30 minutes, the sample temperature
reaches a stable value. The temperature accuracy is the temperature difference between the sample
temperature and the nominal autosampler temperature.
5.8 Flow Precision
5.8.1 Theory
The flow precision can be determined very exactly by weighing out which quantity of solvent is
delivered over a specific period. For statistic evaluation of the results, repeat this measurement
several times. However, this requires a lot of work: The measuring time must be at least five minutes if
it is not electronically linked to the weighing process. Otherwise, inaccuracies in the timing affect the
results. An additional disadvantage is that the procedure cannot be automated and that the used
scales must be very exact.
As an alternative, the flow precision can be determined by injecting the same sample standard
multiple times. The flow precision primarily affects the precision of the retention time. This method is
used during automated OQ and PQ.
5.8.2 Performing the Check
The precision of the flow and the precision of the injection volume are established with the
Injector_Flow_Repro sequence. Standard 4 is injected ten times, using an injection volume of 5 µl for
each injection (deviations see the table in section 5.4.2).
The relative standard deviation or the standard deviation of the retention times of the six or ten
injections indicates the flow precision. The larger of the values is the valid limit.
Page 56 of 95
HPLC_OQ_PQ_E_Manual.doc – Version: 6.8 dated Oktober 2008
OQ and PQ Operating Instructions
5.9 Solvent Composition of the Gradient Pump:
Accuracy, Precision, and Ripple
5.9.1 Theory
If the gradient pump composes the solvent inaccurately, this will mainly effect the retention times. To
keep the measuring effort low, different compositions are checked based on the ASTM instructions.
Use 100% water for solvent A. Solvent B is a mixture of water and acetone (0.1% Vol.). Acetone is
highly absorbing in the range of = 265 nm. The gradient can be observed in a chromatogram. There
are no injections required.
250
OQ_LPG #4
mAU
Low Pressure Gradient_3
UV_VIS_1
WVL:265 nm
%D: 0,0 %
%C: 0,0 %
100,0
99,0
200
150
100
50,0
50
0
Water with 0.1 % Acetone: 0,0 %
0,0
Flow: 2,000 mL/min
-50
0,0
min
2,0
4,0
6,0
8,0
10,0
12,0
14,0
16,0
18,0
20,0
22,0
24,0
Figure 19: Theoretical (broken line) and real gradients
(STD_GRAD standard sequence for gradient pumps)
5.9.2 Performing the Checks
Except for the TSP P2000 Pump, the following solvent compositions (in %B) are mixed: 0, 1, 50, 99,
and 100. The solvent composition (in %B) for the TSP P2000 Pump is as follows: 0, 50, and 100%.
This is because the pump does not support gradient programs with more than 9 steps.
For the described arrangement and non-changing solvent composition, the ripple is indicated by the
signal noise.
To qualify a gradient pump (except the Dionex UltiMate 3000 pumps), the STD_GRAD sequence is
required.
For the Dionex M480 an M300 pumps, separate sequences are available, which are automatically
selected by the Wizard.
For the ternary high-pressure gradient systems from Shimadzu, the Wizard automatically selects
TERN_GRAD_C_B sequence. This sequence is used to determine the accuracy and the precision of
the gradient and the ripple between the solvent channels C and B.
HPLC_OQ_PQ_E_Manual.doc – Version: 6.8 dated Oktober 2008
Page 57 of 95
OQ and PQ Operating Instructions
5.9.3 Performing the Checks for the Dionex P680 and UltiMate 3000 Pumps
Five sequences are provided for qualifying the Dionex LPG-3400A(B), DPG-3600A(B), HPG-3200A,
HPG-3200M, HPG-3200RS, HPG-3400A, HPG-3400M, HPG-3400RS, and P680 pumps:
STD_GRAD,
MICRO_GRAD,
LONG_GRAD,
STD_GRAD_P680DGP_Left,
and
LONG_GRAD_P680DGP_Left.
The MICRO_GRAD sequence is used to qualify a pump with MicroFlow kit (e.g., an HPG-3200M or
HPG-3400M). The gradient program corresponds to the program of the STD_GRAD sequence.
However, the mixing volume of a pump with MicroFlow kit is lower than the volume of a pump with
standard mixing chamber. That is why the detector signal is detected earlier. This fact is considered
for the evaluation of the check.
The LONG_GRAD sequence is used if a mixing chamber extension (600 µl or 1200 µl for
UltiMate 3000 pumps, or 1250 µl for the P680 pump) is installed. A higher mixing chamber volume
increases the equilibration time of the gradient. The gradient program has been adapted accordingly
and evaluation of the check considers this.
For DGP pumps (P680 and UltiMate 3000 DGP-3600A(B)), qualification is performed for both pump
units. The sequences STD_GRAD and LONG_GRAD are used to check the right pump unit. The
sequences STD_GRAD_P680DGP_Left and LONG_GRAD_P680DGP_Left are used to check the left
pump unit.
For the UltiMate 3000 LPG-3400M(B) and DGP-3600M(B) micro pumps, only the LONG_GRAD and
LONG_GRAD_P680DGP_Left sequences are available.
5.9.4 Evaluating the Check
To facilitate the comparison, the absorption values are converted and expressed as %B. To
compensate the detector drift, the absorption of the pure solvent A is measured at the beginning and
at the end of the gradient. These values are the basis for the regression line that is used to correct the
baseline of the entire chromatogram.
To define the gradient accuracy, the measured step height is compared to the height that must
theoretically result from the solvent composition.
To define the precision, three gradients are recorded. The standard deviations of the step heights
indicate the precision. The gradient precision is not determined for M480 pumps. For M480 pumps, a
second gradient is measured in addition to the gradient described above. For the second gradient,
channel C delivers water as solvent.
The ripple is determined for all steps. A one-minute interval is defined for each step. For each interval,
Chromeleon uses the data to calculate a regression line, based on the method of least squares.
Parallel to the regression line, two lines are drawn through the measured minimum and maximum
value. The noise is the distance between these two lines. This is an indication for the ripple.
Page 58 of 95
HPLC_OQ_PQ_E_Manual.doc – Version: 6.8 dated Oktober 2008
OQ and PQ Operating Instructions
5.10 Temperature Accuracy of the Column Compartment
5.10.1 Theory
Depending on the type of application, temperature fluctuations of the solvent and especially of the
column can result in considerable retention time fluctuations. In addition to the precision of the
temperature achieved with the column compartment, the accuracy is important as well. Only high
accuracy allows transferring applications to different systems.
5.10.2 Performing the Check
Four measuring points are used to check the temperature accuracy of the column compartment. The
check is performed with the Column_Oven sequence. The achieved temperature is measured with an
external, calibrated thermometer.
The achieved temperatures are compared to the set values. The difference indicates the temperature
accuracy.
Exception:
It is not possible to set the temperature on the column compartment module of the Waters Alliance
2690 Separation Module or on the Shimadzu column compartments (LC-2010 CTO, CTO-10Avp,
CTO-10ACvp und CTO-10Asvp) when the retention time is negative. The first measurement
reading is 10 minutes after the sample has been started. At this time, equilibration of the column
compartment may not be complete. Therefore, the same temperature is set for the second
measuring point (50°C), too. The column compartment module has passed the check even if the
target temperature is reached only for the second measuring point. This means that evaluation is
performed for three measuring points only.
Due to its small temperature range, evaluation for the Dionex ACC-3000(T) is performed for three
measuring points only.
Tip:
With the column compartment of the Waters Alliance 2690 Separation Module, the set
temperature can be changed during a sample only when the autosampler is injecting.
That is why 1µl of water is injected for qualifying the column compartment of the Waters
Alliance 2690 Separation Module.
5.11 Baseline Noise and Signal Height of the Fluorescence Detector
5.11.1 Theory
Drift and baseline noise are important specifications for the detector. Increased baseline noise
considerably reduces the detection sensitivity, as it is not possible to distinguish between small signals
and noise.
The baseline noise of the detector mainly depends on the lamp. There is a considerable increase in
noise if an old lamp with poor light intensity is used. In addition, contamination in the flow cell leads to
an increase noise level. Also, make sure that the measuring and ambient conditions are constant.
Verify that there are no gas bubbles in the flow cell.
In addition to the absolute value of the baseline noise, the signal height to noise ratio is important. The
signal height mainly depends on the condition of the lamp and the flow cell. A contaminated flow cell
may result in a higher fluorescence signal.
HPLC_OQ_PQ_E_Manual.doc – Version: 6.8 dated Oktober 2008
Page 59 of 95
OQ and PQ Operating Instructions
5.11.2 Performing the Check
The Fluorescence sequence is used to determine the noise and the signal height. When testing the
Dionex RF2000, make sure that the detector's ZWAVE parameter is set to 1 ( 3.3). Water is
pumped through the flow cell at a flow rate of 1ml/min. The excitation wavelength is 350 nm; the
emission wavelength is 394 nm.
To determine the noise, the measuring signal is split into thirty intervals of thirty seconds each. For
each interval, Chromeleon calculates a regression line, based on the method of least squares. The
noise value is the distance between two parallel lines and the regression line through the lowest and
highest values. For the calculated values, the thirty interval values are averaged.
5.12 Wavelength Accuracy of the Fluorescence Detector
5.12.1 Performing the Check
The Fluorescence sequence is used to determine the wavelength accuracy of the emission spectrum.
When testing the Dionex RF 2000 detector, make sure that the ZWAVE parameter is set to 1 on the
instrument (see section 3.4.1). Water is pumped through the flow cell at a flow rate of 1ml/min. For an
excitation wavelength of 350 nm, the emission wavelength changes in 1nm increments from 380 nm
to 410 nm. The relative signal maximum is compared to the theoretical maximum.
Em = 410
Emission
EM:380 nm
Em = 409
Em = 408
Em = 407
Em = 406
Em = 405
Em = 404
Em = 403
Em = 402
Em = 401
Em = 400
Em = 399
Em = 398
Em = 397
Em = 396
Em = 395
Em = 394
Em = 393
Em = 392
Em = 391
Em = 390
Em = 389
Em = 388
Em = 387
Em = 386
Fluorescence_Detector_Wavelength
Em = 385
Em = 384
Em = 383
Em = 382
OQ_FLUORESCENCE #2
mV
Em = 381
40,0
35,0
30,0
25,0
20,0
15,0
10,0
5,0
0,0
-5,0
0,00
min
0,50
1,00
1,50
2,00
2,50
3,00
3,50
4,00
4,50
5,00
5,50
6,00
6,50
7,00
7,50
8,00
Figure 20: Chromatogram for defining the relative maximum of the emission
spectra between 380 nm and 410 nm
5.12.2 Remarks on the Manufacturer Specification
It is only possible to check the manufacturer specification of 2 nm for the excitation and the emission
wavelengths by using a special flow cell and a mercury lamp. For OQ and PQ, the instrument should
preferably be checked with the components used for the measurements.
Page 60 of 95
HPLC_OQ_PQ_E_Manual.doc – Version: 6.8 dated Oktober 2008
OQ and PQ Operating Instructions
5.13 Baseline Noise and Drift of the RI Detector
5.13.1 Theory
Drift and baseline noise are important specifications for a detector. Increased baseline noise
considerably reduces the detection sensitivity, as it is not possible to distinguish between small signals
and noise. With increased drift, it is more difficult to integrate the signals correctly because the less
stable the baseline is, the more inaccurate is integration.
The baseline noise of the detector mainly depends on the lamp. There is a considerable increase in
noise if an old lamp with poor light intensity is used. This is also true when the reference and/or
sample cell is dirty. In addition, make sure that the measuring and ambient conditions are constant
and that the flow cell is free from gas bubbles.
To measure the drift of a RI detector, make sure that the measuring and ambient conditions are
constant. In addition, it is very important that the lamp has been burning for several hours and that the
flow cell has been rinsed sufficiently.
5.13.2 Performing and Evaluating the Check
The RI_NOISE_DRIFT sequence includes both the checks of the noise and the drift. Water is pumped
through the sample cell at a flow rate of 1 ml/min; the reference cell, too, has been rinsed with water
before. The RI signal is recorded at a temperature of 35°C.
To calculate drift and noise, the measuring signal is split into 20 intervals of 1 minute each. For each
interval, Chromeleon calculates a regression based on measured values, using the method of least
squares. The slope of the curve indicates the drift of the measured signal; the absolute value of the
slope indicates the absolute value of the drift. Parallel to the regression line, two lines are drawn
through the measured minimum and maximum value. The noise is the distance between these two
lines. The calculated values are averaged for all 20 intervals to establish the final value.
5.14 Linearity of the RI Detector
5.14.1 Theory
The detector linearity mainly depends on the optical and electronic systems. With electronic systems,
non-linearity is caused by dark current and dark current drift. Dark measurements can be used to
compensate the influence of these factors. However, with decreasing light intensity (caused by lamp
ageing or absorption of the solvent or sample), the influence of the dark current on the linearity
increases. As water is the solvent in both the sample and reference cells, the influence of the solvent
is negligible. The influence of the sample is fully used to determine the detector linearity. Consider that
the resulting deviations of the linear behavior are only important with high sample concentrations and
high absorption rates (> 600 µRIU).
5.14.2 Performing and Evaluating the Check
To establish the detector linearity, the RI_LINEARITY sequence is required. The detector linearity is
determined using five glycerin standards (set concentrations: 5 mg/ml, 10 mg/ml, 15 mg/ml, 25 mg/ml,
and 35 mg/ml, dissolved in water; the actual concentrations are entered into the QNT file and taken
into account). Water is used as solvent. The flow rate is 1 ml/min. The peak area and concentration
are represented in a graph and the regression line is determined. The regression coefficient of this line
indicates the linearity.
HPLC_OQ_PQ_E_Manual.doc – Version: 6.8 dated Oktober 2008
Page 61 of 95
OQ and PQ Operating Instructions
5.15 Baseline Noise of the ELS Detector
5.15.1 Theory
Baseline noise is an important specification for a detector. Increased baseline noise considerably
reduces the detection sensitivity, as it is not possible to distinguish between small signals and noise.
The baseline noise of the evaporative light scattering detector mainly depends on the lamp. There is a
considerable increase in noise if an old lamp with poor light intensity is used. The evaporator
temperature and carrier gas flow also affect the noise. Therefore, make sure that the measuring and
ambient conditions are kept constant.
5.15.2 Performing and Evaluating the Check
The ELS_NOISE sequence is used for the noise test. Water is pumped through the detector at a flow
rate of 1 ml/min. The conditions for recording the ELS signal are as follows:
Nebuliser temperature:
Evaporator temperature: 90°C
50°C
Carrier gas flow:
1.6 [email protected] bar
To calculate drift and noise, the measuring signal is split into 20 intervals of 1 minute each. For each
interval, Chromeleon calculates a regression based on measured values, using the method of least
squares. Parallel to the regression line, two lines are drawn through the measured minimum and
maximum value. The noise is the distance between these two lines. The calculated values are
averaged for all 20 intervals to establish the final value.
Page 62 of 95
HPLC_OQ_PQ_E_Manual.doc – Version: 6.8 dated Oktober 2008
OQ and PQ Operating Instructions
6 Troubleshooting
6.1 General Notes
A system pressure that is well above 130 bar for a flow rate of 1 ml/min (solvent: water) after the
pressure regulator has been connected indicates that a capillary is contaminated. Inspect and
exchange the capillaries and the pressure regulator to ensure that OQ and PQ are correctly
performed.
If problems occur during the checks that cannot be solved observing the notes below, also refer to
the respective sections in the instruments' manuals.
6.2 Failure of Individual Checks
6.2.1 UV Detector
Check
Wavelength accuracy
Baseline noise
Drift
Reason
Spectrum calibration was not
successful during connect in
Chromeleon.
Increased drift
The solvent is contaminated.
The lamp is too old.
There are air bubbles in the flow
cell.
The detector is not yet warmed.
The system is not equilibrated.
The lamp is defective.
There are fluctuations in the
ambient temperature.
Lamp intensity
Detector linearity
The lamp is too old.
The flow cell is incorrectly
installed.
The lamp is too old.
The concentration of standards
is not correct.
The peak height of the sample
with the highest concentration is
not in the linearity range
specified for the detector, i.e.,
usually > 1500 mAU (for
Shimadzu detectors and Dionex
VWD-3100 and VWD-3400RS
detectors > 2500 mAU).
HPLC_OQ_PQ_E_Manual.doc – Version: 6.8 dated Oktober 2008
Remedial Action
First, disconnect and then,
reconnect the detector.
See below.
Exchange the solvent.
Exchange the lamp.
Prime the flow cell.
Allow the detector sufficient time
to warm up.
Rinse the system.
Exchange the lamp.
If necessary, close the windows
and shield the instrument from
the air conditioning system.
Exchange the lamp.
Install the flow cell correctly.
Exchange the lamp.
Use new standards.
Reduce the injection volume for
all samples used for the detector
linearity check so that the peak
height of the sample with the
highest concentration is in the
linearity range of the detector,
i.e., usually < 1500 mAU.
Page 63 of 95
OQ and PQ Operating Instructions
6.2.2 Autosampler
Check
Precision of injection volume
Reason
The autosampler draws air from
the vial.
There are air bubbles in the
syringe.
The autosampler is leaking.
The injection valve is leaking.
Linearity of Injection Volume
The detector linearity check
failed.
The syringe is old.
Remedial Action
Either there is too little sample
volume in vial or the value set for
the Needle Depth parameter is
too low.
Prime the syringe.
Autosampler Manual
Autosampler Manual
See above.
Exchange the syringe.
6.2.3 Pump
Check
Flow precision
Reason
The autosampler draws air from
the vial.
There are air bubbles in the
syringe.
The autosampler is leaking.
The injection valve is leaking.
Gradient accuracy
Gradient precision
Ripple
There is air in the system.
The system is not equilibrated.
The composition of solvent B is
not correct.
There is air in the system.
The system is not equilibrated.
There is air in the system.
The system is not equilibrated.
Remedial Action
Either there is too little sample
volume in vial or the value set for
the Needle Depth parameter is
too low.
Prime the syringe.
Autosampler Manual
Autosampler Manual
Prime the system.
Rinse the system.
Make sure that the solvent
composition is correct.
Prime the system.
Rinse the system.
Prime the system.
Rinse the system.
6.2.4 RF2000 Fluorescence Detector
Check
Wavelength accuracy
Page 64 of 95
Reason
The Raman peak of water is not
visible because the instrument
performs an Autozero whenever
the wavelength is changed.
Remedial Action
On the instrument, set the
ZWAVE parameter to 1
( section 3.4.1)
HPLC_OQ_PQ_E_Manual.doc – Version: 6.8 dated Oktober 2008
OQ and PQ Operating Instructions
6.2.5 RI Detector
Check
Baseline noise
Reason
There are air bubbles in the flow
cell.
Drift
The solvent is contaminated.
There are fluctuations in the
ambient temperature.
There are air bubbles in the flow
cell.
Detector linearity
The concentration of the
standard is not correct.
Remedial Action
Rinse the sample and reference
cells for up to one hour, using
degassed water (flow rate:
1 ml/min). Repeatedly press the
Purge key. If necessary, repeat
the procedure with methanol.
Use new solvent.
Position the detector at a
location with few temperature
fluctuations.
Rinse the sample and reference
cells with degassed water (see
above).
Use fresh standards.
6.2.6 ELS Detector
Check
Baseline noise
Baseline spikes
Reason
The pump pulsation is too high.
Remedial Action
Purge the pump and all channels
if necessary.
The gas supply is contaminated. Replace the gas supply.
HPLC_OQ_PQ_E_Manual.doc – Version: 6.8 dated Oktober 2008
Page 65 of 95
OQ and PQ Operating Instructions
Page 66 of 95
HPLC_OQ_PQ_E_Manual.doc – Version: 6.8 dated Oktober 2008
OQ and PQ Operating Instructions
7 PGM Files
As described in section 3.5, the OQ and PQ Setup Wizards adapt the program files to the instruments
installed in the related timebase. The section lists the PGM files for the instruments of a Dionex HPLC
system.
7.1 Wavelength Accuracy of the Photodiode Detector
;==================================================================
; Wavelength Accuracy for detectors UVD 340S, UVD 170S, PDA-100
; ----------------------------------------------------------------; PGM-Version 09-02-2000
;
;
; Restriction capillary: l = 13 m, ID = 0.13 mm, PEEK
; Solvent:
Methanol, degassed via online degasser
;
; HPLC-System:
; -----------;
; Pump specific settings
; Settings specific for the Dionex P580
; Pump:
P580
;
; Sampler specific settings
; Settings specific for the Dionex ASI-100
; Sampler:
ASI-100 (T)
;
; Detector specific settings
; Settings specific for the Dionex UVD 340S
; Detector:
Diodearray UVD 340S
;
; Sample:
Pyrene 3µg/ml
;==================================================================
; Pump specific settings
Log
Pump.ModelNo
Log
Pump.ModelVariant
Log
Pump.SerialNo
; Sampler specific settings
Log
Log
;
Sampler.ModelNo
Sampler.SerialNo
; Column Oven specific settings
Log
ColumnOven.ModelNo
; UV Detector specific settings
Log
UV.ModelNo
; Fluorescence detector specific settings
Log
Emission.ModelNo
Pressure.LowerLimit =
10
Pressure.UpperLimit =
300
%A.Equate =
"Methanol"
; Pump specific settings
; Settings specific for the Dionex P580
%A.Type =
Automatic
UV_VIS_1.Wavelength =
331
HPLC_OQ_PQ_E_Manual.doc – Version: 6.8 dated Oktober 2008
Page 67 of 95
OQ and PQ Operating Instructions
UV_VIS_1.Bandwidth =
UV_VIS_1.Step =
UV_VIS_1.Average =
UV_VIS_2.Wavelength =
UV_VIS_2.Bandwidth =
UV_VIS_2.Step =
UV_VIS_2.Average =
UV_VIS_3.Wavelength =
UV_VIS_3.Bandwidth =
UV_VIS_3.Step =
UV_VIS_3.Average =
UV_VIS_4.Wavelength =
UV_VIS_4.Bandwidth =
UV_VIS_4.Step =
UV_VIS_4.Average =
1
0.20
On
333
1
0.20
On
335
1
0.20
On
250
1
0.20
On
; Detector specific settings
; Settings specific for the Dionex UVD 340S
3DFIELD.MaxWavelength =
350.0
3DFIELD.MinWavelength =
250.0
3DFIELD.BunchWidth =
1.9
3DFIELD.Step =
0.2
3DFIELD.RefWavelength =
600.0
3DFIELD.RefBandwidth =
1.9
UV_VIS_1.RefWavelength =
600
UV_VIS_1.RefBandwidth =
1
UV_VIS_2.RefWavelength =
600
UV_VIS_2.RefBandwidth =
1
UV_VIS_3.RefWavelength =
600
UV_VIS_3.RefBandwidth =
1
UV_VIS_4.RefWavelength =
600
UV_VIS_4.RefBandwidth =
1
; Autosampler specific settings
; Settings specific for the Dionex ASI-100
Sampler.InjectMode =
Normal
Sampler.UpSpeed =
10.0
Sampler.DownSpeed =
10.0
Sampler.SampleHeight =
0.50
Sampler.WashSpeed =
50.00
Sampler.DispSpeed =
50.00
Sampler.FillSpeed =
25.00
SyringeDelay =
5
Flow =
1.000
0.000 UV.Autozero
; Detector specific settings
Inject
3DFIELD.AcqOn
UV_VIS_1.AcqOn
UV_VIS_2.AcqOn
UV_VIS_3.AcqOn
UV_VIS_4.AcqOn
1.250
3DFIELD.AcqOff
Page 68 of 95
HPLC_OQ_PQ_E_Manual.doc – Version: 6.8 dated Oktober 2008
OQ and PQ Operating Instructions
UV_VIS_1.AcqOff
UV_VIS_2.AcqOff
UV_VIS_3.AcqOff
UV_VIS_4.AcqOff
End
HPLC_OQ_PQ_E_Manual.doc – Version: 6.8 dated Oktober 2008
Page 69 of 95
OQ and PQ Operating Instructions
7.2 Baseline Noise, Drift, and Lamp Intensity of the UV Detector
;==================================================================
; Noise and Drift
; --------------; PGM-Version 09-02-2000
;
; Restriction capillary: PEEK
;
ID: 0.13 mm
;
Length: 13 m
;
Back Pressure: 90 bar
;
; Solvent A : Water (HPLC quality)
;
; Solvent degassed via online degasser
;
; HPLC-System:
; -----------;
; Pump specific settings
; Settings specific for the Dionex P580
; Pump:
P580
;
; Sampler specific settings
; Settings specific for the Dionex ASI-100
; Sampler:
ASI-100 (T)
;
; Detector specific settings
; Settings specific for the Dionex UVD 340S
; Detector:
Diodearray UVD 340S
;
;==================================================================
; Pump specific settings
Log
Pump.ModelNo
Log
Pump.ModelVariant
Log
Pump.SerialNo
; Sampler specific settings
Log
Log
;
Sampler.ModelNo
Sampler.SerialNo
; Column Oven specific settings
Log
ColumnOven.ModelNo
; UV Detector specific settings
Log
UV.ModelNo
; Fluorescence detector specific settings
Log
Emission.ModelNo
Pressure.LowerLimit =
10
Pressure.UpperLimit =
300
%A.Equate =
"Water"
; Pump specific settings
; Settings specific for the Dionex P580
Page 70 of 95
HPLC_OQ_PQ_E_Manual.doc – Version: 6.8 dated Oktober 2008
OQ and PQ Operating Instructions
%A.Type =
Flow =
Automatic
1.000
UV_VIS_1.Wavelength =
UV_VIS_1.Step =
UV_VIS_1.Average =
254
1.0
On
; Detector specific settings
; Settings specific for the Dionex UVD 340S
3DFIELD.Step =
1
UV_VIS_1.Bandwidth =
1
UV_VIS_1.RefWavelength =
600
UV_VIS_1.RefBandwidth =
1
; Sampler specific settings
; Settings specific for the Dionex ASI-100
Sampler.InjectMode =
Normal
Sampler.UpSpeed =
10.0
Sampler.DownSpeed =
10.0
Sampler.SampleHeight =
0.50
Sampler.WashSpeed =
50.00
Sampler.DispSpeed =
50.00
Sampler.DrawSpeed =
25.00
Sampler.SyringeDelay =
5
0.000 UV.Autozero
; Detector specific settings
Inject
UV_VIS_1.AcqOn
1.000 Log
Protocol
254 nm in [counts/s]"
LampIntensity
"The lamp intensity is given at
20.000 UV_VIS_1.AcqOff
End
HPLC_OQ_PQ_E_Manual.doc – Version: 6.8 dated Oktober 2008
Page 71 of 95
OQ and PQ Operating Instructions
7.3 Linearity of the UV Detector
;================================================================
; UV Detector Linearity
; --------------------------------------------------------------; PGM-Version 22-05-2001
;
; Restriction capillary: PEEK
;
ID: 0.13 mm
;
Length: 13 m
;
Back Pressure: 80 bar
;
; Solvent A : Water (HPLC quality)
;
; Solvent degassed via online degasser
;
; HPLC-System:
; -----------;
; Pump specific settings
; Settings specific for the Dionex P580
; Pump:
P580
;
; Sampler specific settings
; Settings specific for the Dionex ASI-100
; Sampler:
ASI-100 (T)
;
; Detector specific settings
; Settings specific for the Dionex UVD 340S
; Detector:
Diodearray UVD 340S
;
; Samples:
Caffeine 10 µg/ml, 60 µg/ml, 140 µg/ml, 220
µg/ml, 300 µg/ml
;
;==================================================================
; Pump specific settings
Log
Pump.ModelNo
Log
Pump.ModelVariant
Log
Pump.SerialNo
; Sampler specific settings
Log
Log
;
Sampler.ModelNo
Sampler.SerialNo
; Column Oven specific settings
Log
ColumnOven.ModelNo
; UV Detector specific settings
Log
UV.ModelNo
; Fluorescence detector specific settings
Log
Emission.ModelNo
Pressure.LowerLimit =
10
Pressure.UpperLimit =
300
%A.Equate =
"Water"
; Pump specific settings
; Settings specific for the Dionex P580
Automatic
%A.Type =
Flow =
1.000
Page 72 of 95
HPLC_OQ_PQ_E_Manual.doc – Version: 6.8 dated Oktober 2008
OQ and PQ Operating Instructions
UV_VIS_1.Wavelength =
UV_VIS_1.Step =
UV_VIS_1.Average =
272
0.20
On
; Detector specific settings
; Settings specific for the Dionex UVD 340S
3DFIELD.Step =
0.2
UV_VIS_1.Bandwidth =
1
UV_VIS_1.RefWavelength =
600
UV_VIS_1.RefBandwidth =
1
; Sampler specific settings
; Settings specific for the Dionex ASI-100
Sampler.InjectMode =
Normal
Sampler.UpSpeed =
10.0
Sampler.DownSpeed =
10.0
Sampler.SampleHeight =
0.50
Sampler.WashSpeed =
50.00
Sampler.DispSpeed =
50.00
Sampler.DrawSpeed =
25.00
Sampler.SyringeDelay =
5
0.000 UV.Autozero
; Detector specific settings
Inject
UV_VIS_1.AcqOn
1.250 UV_VIS_1.AcqOff
End
HPLC_OQ_PQ_E_Manual.doc – Version: 6.8 dated Oktober 2008
Page 73 of 95
OQ and PQ Operating Instructions
7.4 Precision of the Injection Volume
;================================================================
; Injector and Flow Reproducibility
; --------------------------------------; PGM-Version 22-05-2001
;
; Restriction capillary: PEEK
;
ID: 0.13 mm
;
Length: 13 m
;
Back Pressure: 80 bar
;
; Solvent A : Water (HPLC quality)
;
; Solvent degassed via online degasser
;
; HPLC-System:
; -----------;
; Pump specific settings
; Settings specific for the Dionex P580
; Pump:
P580
;
; Sampler specific settings
; Settings specific for the Dionex ASI-100
; Sampler:
ASI-100 (T)
;
; Detector specific settings
; Settings specific for the Dionex UVD 340S
; Detector:
Diodearray UVD 340S
;
; Sample:
Caffeine 140 µg/ml
;==================================================================
; Pump specific settings
Log
Pump.ModelNo
Log
Pump.ModelVariant
Log
Pump.SerialNo
; Sampler specific settings
Log
Log
;
Sampler.ModelNo
Sampler.SerialNo
; Column Oven specific settings
Log
ColumnOven.ModelNo
; UV Detector specific settings
Log
UV.ModelNo
; Fluorescence detector specific settings
Log
Emission.ModelNo
Pressure.LowerLimit =
2
Pressure.UpperLimit =
300
%A.Equate =
"Water"
; Pump specific settings
; Settings specific for the Dionex P580
%A.Type =
Automatic
0.300
Flow =
UV_VIS_1.Wavelength =
UV_VIS_1.Step =
Page 74 of 95
272
0.20
HPLC_OQ_PQ_E_Manual.doc – Version: 6.8 dated Oktober 2008
OQ and PQ Operating Instructions
UV_VIS_1.Average =
On
; Detector specific settings
; Settings specific for the Dionex UVD 340S
3DFIELD.Step =
0.2
UV_VIS_1.Bandwidth =
1
UV_VIS_1.RefWavelength =
600
UV_VIS_1.RefBandwidth =
1
; Sampler specific settings
; Settings specific for the Dionex ASI-100
Sampler.InjectMode =
Normal
Sampler.UpSpeed =
10.0
Sampler.DownSpeed =
10.0
Sampler.SampleHeight =
0.50
Sampler.WashSpeed =
50.00
Sampler.DispSpeed =
50.00
Sampler.DrawSpeed =
25.00
Sampler.SyringeDelay =
5
0.000 UV.Autozero
; Detector specific settings
Inject
UV_VIS_1.AcqOn
3.000 UV_VIS_1.AcqOff
End
HPLC_OQ_PQ_E_Manual.doc – Version: 6.8 dated Oktober 2008
Page 75 of 95
OQ and PQ Operating Instructions
7.5 Carry-over by the Autosampler and Linearity of the Injection
Volume
;================================================================
; Injector Linearity and Carry over
; --------------------------------------------------------------; PGM-Version 22-05-2001
;
; Restriction capillary: PEEK
;
ID: 0.13 mm
;
Length: 13 m
;
Back Pressure: 80 bars
;
; Solvent A : Water (HPLC quality)
;
; Solvent degassed via online degasser
;
; HPLC-System:
; -----------;
; Pump specific settings
; Settings specific for the Dionex P580
; Pump:
P580
;
; Sampler specific settings
; Settings specific for the Dionex ASI-100
; Sampler:
ASI-100 (T)
;
; Detector specific settings
; Settings specific for the Dionex UVD 340S
; Detector:
Diodearray UVD 340S
;
; Samples:
Caffeine 10 µg/ml (Linearity)
;
Caffeine 300 µg/ml (Carry over)
;
Water (Carry over)
;
;==================================================================
; Pump specific settings
Log
Pump.ModelNo
Log
Pump.ModelVariant
Log
Pump.SerialNo
; Sampler specific settings
Log
Log
;
Sampler.ModelNo
Sampler.SerialNo
; Column Oven specific settings
Log
ColumnOven.ModelNo
; UV Detector specific settings
Log
UV.ModelNo
; Fluorescence detector specific settings
Log
Emission.ModelNo
Pressure.LowerLimit =
Pressure.UpperLimit =
%A.Equate =
; Pump specific settings
Page 76 of 95
10
300
"Water"
HPLC_OQ_PQ_E_Manual.doc – Version: 6.8 dated Oktober 2008
OQ and PQ Operating Instructions
; Settings specific for the Dionex P580
%A.Type =
Automatic
Flow =
1.00
UV_VIS_1.Wavelength =
UV_VIS_1.Step =
UV_VIS_1.Average =
272
0.50
On
; Detector specific settings
; Settings specific for the Dionex UVD 340S
3DFIELD.Step =
0.5
UV_VIS_1.Bandwidth =
1
UV_VIS_1.RefWavelength =
600
UV_VIS_1.RefBandwidth =
1
; Sampler specific settings
; Settings specific for the Dionex ASI-100
Sampler.InjectMode =
Normal
Sampler.UpSpeed =
10.0
Sampler.DownSpeed =
10.0
Sampler.SampleHeight =
0.50
Sampler.WashSpeed =
50.00
Sampler.DispSpeed =
50.00
Sampler.DrawSpeed =
25.00
Sampler.SyringeDelay =
5
0.000 UV.Autozero
; Detector specific settings
Inject
UV_VIS_1.AcqOn
1.250 UV_VIS_1.AcqOff
End
HPLC_OQ_PQ_E_Manual.doc – Version: 6.8 dated Oktober 2008
Page 77 of 95
OQ and PQ Operating Instructions
7.6 Sample Temperature Accuracy
;================================================================
; Autosampler temperature accuracy
; --------------------------------------------------------------; PGM-Version: February 02, 2007
;
;
; HPLC-System:
; -----------;
; Pump specific settings
; Pump:
Dionex DGP-3600A Pump (UltiMate 3000)
;
; Sampler specific settings
; Sampler:
Dionex WPS-3000(T)Pulledloop
Autosampler (UltiMate 3000)
;
; Detector specific settings
; Detector:
Dionex VWD-3400 UV_VIS Detector (UltiMate 3000)
;
; Sample:
Water (Vial uncapped)
;==================================================================
; Pump specific settings
Log
Pump.ModelNo
Log
Pump.ModelVariant
Log
Pump.SerialNo
; Sampler specific settings
Log
Sampler.ModelNo
Log
Sampler.SerialNo
Log
Sampler.ModelVariant
Log
Sampler.Temperature
Log
Sampler.LoopVolume
; Column Oven specific settings
Log
Log
ColumnOven.ModelNo
ColumnOven.SerialNo
; UV Detector specific settings
Log
Log
UV.ModelNo
UV.SerialNo
; Fluorescence detector specific settings
; RI Detector specific settings
; ELS Detector specific settings
Page 78 of 95
HPLC_OQ_PQ_E_Manual.doc – Version: 6.8 dated Oktober 2008
OQ and PQ Operating Instructions
Sampler.AcquireExclusiveAccess
Pump.Pressure.LowerLimit =
Pump.Pressure.UpperLimit =
0 [bar]
300 [bar]
; Virtual channel settings
VirtualChannels_01.SamplingStep =
TemperatureOVEN.Type =
TemperatureOVEN.Formula
1.00
Fixed
Formula=Temperature_1
; Sampler settings
Sampler.TempCtrl =
Sampler.Temperature.Nominal =
Sampler.ReadyTempDelta =
On
10.0 [°C]
0.5 [°C]
0.000
Message"Make sure that the thermometer is located correctly in the
vial (refer to the manual for details)."
Message"Caution: To avoid damage to the system, do not perform
sampler commands while the test is running."
Wait Sampler.Ready
Wait Sampler.TemperatureReady
Sampler.Inject
TemperatureOven.AcqOn
30.000
Message"The test is now complete. Please remove the
thermometer."
log Sampler.Temperature.Value
TemperatureOven.AcqOff
Sampler.ReleaseExclusiveAccess
End
HPLC_OQ_PQ_E_Manual.doc – Version: 6.8 dated Oktober 2008
Page 79 of 95
OQ and PQ Operating Instructions
7.7 Solvent Composition of a Gradient Pump:
Accuracy, Precision, and Ripple (Standard Gradient)
;================================================================
; Low Pressure Gradient Pump
; --------------------------; PGM-Version 22-05-2001
;
; Restriction capillary: PEEK
;
ID: 0.13 mm
;
Length: 13 m
;
Back Pressure: 80 bar
;
; Solvent A : Water (HPLC quality)
; Solvent B : Water + 0.1 % Acetone (both HPLC quality)
;
; Solvents degassed via online degasser
;
; HPLC-System:
; -----------;
; Pump specific settings
; Settings specific for the Dionex P580
; Pump:
P580
;
; Sampler specific settings
; Settings specific for the Dionex ASI-100
; Sampler:
ASI-100 (T)
;
; Detector specific settings
; Settings specific for the Dionex UVD 340S
; Detector:
Diodearray UVD 340S
;
;==================================================================
; Pump specific settings
Log
Pump.ModelNo
Log
Pump.ModelVariant
Log
Pump.SerialNo
; Sampler specific settings
Log
Log
;
Sampler.ModelNo
Sampler.SerialNo
; Column Oven specific settings
Log
ColumnOven.ModelNo
; UV Detector specific settings
Log
UV.ModelNo
; Fluorescence detector specific settings
Log
Emission.ModelNo
-2.000 Pressure.LowerLimit =
10
Pressure.UpperLimit =
300
%A.Equate =
"Water"
%B.Equate =
"Water with 0.1 % Acetone"
; Pump specific settings
; Settings specific for the Dionex P580
Automatic
%A.Type =
%B.Type =
Automatic
Page 80 of 95
HPLC_OQ_PQ_E_Manual.doc – Version: 6.8 dated Oktober 2008
OQ and PQ Operating Instructions
UV_VIS_1.Step =
UV_VIS_1.Average =
UV_VIS_1.Wavelength =
4.0
On
265
; Detector specific settings
; Settings specific for the Dionex UVD 340S
3DFIELD.Step =
4.0
UV_VIS_1.Bandwidth =
1
UV_VIS_1.RefWavelength =
600
UV_VIS_1.RefBandwidth =
1
0.000 UV.Autozero
; Detector specific settings
Inject
UV_VIS_1.AcqOn
Flow =
%B =
%C =
%D =
2.000
0.0
0.0
0.0
1.000 %B =
%B =
0.0
1.0
4.000 %B =
%B =
1.0
50.0
8.000 %B =
%B =
50.0
99.0
12.000 %B =
%B =
99.0
100.0
15.000 %B =
%B =
100.0
0.0
24.000 UV_VIS_1.AcqOff
Flow =
%B =
%C =
%D =
2.000
0.0
0.0
0.0
End
HPLC_OQ_PQ_E_Manual.doc – Version: 6.8 dated Oktober 2008
Page 81 of 95
OQ and PQ Operating Instructions
7.8
Temperature Accuracy of a Column Compartment
(Automatic Temperature Measurement)
;================================================================
; Temperature Accuracy of Column Oven
; --------------------------------------------------------------; PGM-Version: 09-02-2000
;
; This program file is used to determine the temperature accuracy
; of the column. The temperature is measured with an external ther; mometer. The values are recorded automatically with as analog
; signals.
;
;
; HPLC-System:
; -----------;
; Settings specific for the Dionex TCC-3200
; Column Thermostat:
TCC-3200 (UltiMate 3000)
;
;==================================================================
; Pump specific settings
Log
Pump.ModelNo
Log
Pump.ModelVariant
Log
Pump.SerialNo
; Sampler specific settings
Log
Log
;
Sampler.ModelNo
Sampler.SerialNo
; Column Oven specific settings
Log
ColumnOven.ModelNo
; UV Detector specific settings
Log
UV.ModelNo
; Fluorescence detector specific settings
Log
Emission.ModelNo
-35.000 ColumnOven.Temperature =
10.00
0.000 Inject
ColumnOven.Temperature =
TemperatureOVEN.Step =
TemperatureOVEN.Average =
TemperatureOVEN.AcqOn
9.900 ColumnOven.Temperature =
10.00
1.00
On
10.00
10.000 ColumnOven.Temperature =
20.00
49.900 ColumnOven.Temperature =
20.00
50.000 ColumnOven.Temperature =
60.00
89.900 ColumnOven.Temperature =
60.00
90.000 ColumnOven.Temperature =
80.00
130.000 ColumnOven.Temperature =
80.00
Page 82 of 95
HPLC_OQ_PQ_E_Manual.doc – Version: 6.8 dated Oktober 2008
OQ and PQ Operating Instructions
130.100 TemperatureOVEN.AcqOff
ColumnOven.Temperature =
End
25.00
HPLC_OQ_PQ_E_Manual.doc – Version: 6.8 dated Oktober 2008
Page 83 of 95
OQ and PQ Operating Instructions
7.9 Baseline Noise and Signal Height of the Fluorescence Detector
;================================================================
; Noisetest for fluorescence detector
; --------------------------------------; PGM-Version 09-02-2000
;
; Restriction capillary: PEEK
;
ID: 0.13 mm
;
Length: 13 m
;
Back Pressure: 90 bar
;
; Solvent A : Water (HPLC quality)
;
; Solvent degassed via online degasser
;
; HPLC-System:
; ----------; Pump specific settings
; Settings specific for the Dionex P580
; Pump:
P580
;
; Fluorescence detector specific settings
; Settings specific for the Dionex RF2000
; Detector:
Fluorescence Detector RF2000
;
;==================================================================
; Pump specific settings
Log
Pump.ModelNo
Log
Pump.ModelVariant
Log
Pump.SerialNo
; Sampler specific settings
Log
Log
;
Sampler.ModelNo
Sampler.SerialNo
; Column Oven specific settings
Log
ColumnOven.ModelNo
; UV Detector specific settings
Log
UV.ModelNo
; Fluorescence detector specific settings
Log
Emission.ModelNo
Pressure.LowerLimit =
10
Pressure.UpperLimit =
300
%A.Equate =
"Water"
; Pump specific settings
; Settings specific for the Dionex P580
%A.Type =
Automatic
Flow =
-1.00
1.000
Emission.ExWavelength =
Emission.EmWavelength =
Emission.Gain =
Emission.Response =
Emission.Step =
Emission.Average =
; Detector specific settings
Page 84 of 95
350
450
4.0
1.5
1
Off
HPLC_OQ_PQ_E_Manual.doc – Version: 6.8 dated Oktober 2008
OQ and PQ Operating Instructions
; Settings specific for the Dionex RF2000
Emission.Sensitivity =
Med
-0.50
Emission.Autozero
0.000
Emission.AcqOn
Inject
Emission.EmWavelength =
1.000
394
17.000 Emission.AcqOff
End
HPLC_OQ_PQ_E_Manual.doc – Version: 6.8 dated Oktober 2008
Page 85 of 95
OQ and PQ Operating Instructions
7.10 Wavelength Accuracy of the Fluorescence Detector
;================================================================
; Wavelength accuracy for fluorescence detector
; --------------------------------------------------------------; PGM-Version 09-02-2000
;
; Restriction capillary: PEEK
;
ID: 0.13 mm
;
Length: 13 m
;
Back Pressure: 90 bar
;
; Solvent A : Water (HPLC quality)
;
; Solvent degassed via online degasser
;
; HPLC-System:
; ----------; Pump specific settings
; Settings specific for the Dionex P580
; Pump:
P580
;
; Fluorescence detector specific settings
; Settings specific for the Dionex RF2000
; Detector:
Fluorescence Detector RF2000
;
;==================================================================
; Pump specific settings
Log
Pump.ModelNo
Log
Pump.ModelVariant
Log
Pump.SerialNo
; Sampler specific settings
Log
Log
;
Sampler.ModelNo
Sampler.SerialNo
; Column Oven specific settings
Log
ColumnOven.ModelNo
; UV Detector specific settings
Log
UV.ModelNo
; Fluorescence detector specific settings
Log
Emission.ModelNo
Pressure.LowerLimit =
10
Pressure.UpperLimit =
300
%A.Equate =
"Water"
; Pump specific settings
; Settings specific for the Dionex P580
%A.Type =
Automatic
-2.00
Flow =
1.000
Emission.ExWavelength =
Emission.EmWavelength =
Emission.Gain =
Emission.Response =
Emission.Step =
Emission.Average =
350
450
4.0
1.5
1
Off
Page 86 of 95
HPLC_OQ_PQ_E_Manual.doc – Version: 6.8 dated Oktober 2008
OQ and PQ Operating Instructions
; Detector specific settings
; Settings specific for the Dionex RF2000
Emission.Sensitivity =
Med
-1.0
-0.5
Emission.Autozero
Emission.EmWavelength =
0.000
Inject
0.250
0.500
0.750
1.000
1.250
1.500
1.750
2.000
2.250
2.500
2.750
3.000
3.250
3.500
3.750
4.000
4.250
4.500
4.750
5.000
5.250
5.500
5.750
6.000
6.250
6.500
6.750
7.000
7.250
7.500
8.000
Emission.AcqOn
Emission.EmWavelength
Emission.EmWavelength
Emission.EmWavelength
Emission.EmWavelength
Emission.EmWavelength
Emission.EmWavelength
Emission.EmWavelength
Emission.EmWavelength
Emission.EmWavelength
Emission.EmWavelength
Emission.EmWavelength
Emission.EmWavelength
Emission.EmWavelength
Emission.EmWavelength
Emission.EmWavelength
Emission.EmWavelength
Emission.EmWavelength
Emission.EmWavelength
Emission.EmWavelength
Emission.EmWavelength
Emission.EmWavelength
Emission.EmWavelength
Emission.EmWavelength
Emission.EmWavelength
Emission.EmWavelength
Emission.EmWavelength
Emission.EmWavelength
Emission.EmWavelength
Emission.EmWavelength
Emission.EmWavelength
Emission.AcqOff
End
=
=
=
=
=
=
=
=
=
=
=
=
=
=
=
=
=
=
=
=
=
=
=
=
=
=
=
=
=
=
380
381
382
383
384
385
386
387
388
389
390
391
392
393
394
395
396
397
398
399
400
401
402
403
404
405
406
407
408
409
410
HPLC_OQ_PQ_E_Manual.doc – Version: 6.8 dated Oktober 2008
Page 87 of 95
OQ and PQ Operating Instructions
7.11 Baseline Noise and Drift of the RI Detector
;===================================================================
; Noise and Drift for RI Detectors
; -----------------------------------------------------------------; PGM-Version: December 20, 2002
;
; Restriction capillary: PEEK
;
ID: 0.13 mm
;
Length: 13 m
;
Back Pressure: 90 bar
;
; Eluent A : Water (HPLC quality)
;
; Solvent degassed via online degasser
;
;
;
; HPLC-System:
; -----------;
; Pump specific settings
; Pump:
Dionex P580 Pump
;
; Sampler specific settings
; Sampler:
Dionex ASI-100(T) Autosampler
;
; Detector specific settings
; Detector:
Dionex UVD 340S PDA
;
; Detector specific settings
; Detector:
Shodex RI-101
;
;===================================================================
; Pump specific settings
Log
Pump.ModelNo
Log
Pump.ModelVariant
Log
Pump.SerialNo
; Sampler specific settings
Log
;
Log
Sampler.ModelNo
Sampler.SerialNo
; Column Oven specific settings
; RI Detector specific settings
Log
RI.ModelNo
; Pump specific settings
Pressure.LowerLimit =
10[bar]
Pressure.UpperLimit =
300[bar]
%A.Equate =
"Water"
Flow =
1.000
; Pump specific settings
; Settings specific for the Dionex P580
%A.Type =
Automatic
Page 88 of 95
HPLC_OQ_PQ_E_Manual.doc – Version: 6.8 dated Oktober 2008
OQ and PQ Operating Instructions
RI_1.Step =
RI_1.Average =
1.50
On
; Detector specific settings
; Settings specific for the Shodex RI-101
RI.Temperature.Nominal =
35
Purge =
off
Rise_Time =
0.50
Polarity =
Minus
Baseline_Shift =
0
; Sampler specific settings
; Settings specific for the Dionex ASI-100
Sampler.InjectMode =
Normal
Sampler.UpSpeed =
10.0
Sampler.DownSpeed =
10.0
Sampler.SampleHeight =
0.50
Sampler.WashSpeed =
50.00
Sampler.DispSpeed =
50.00
Sampler.DrawSpeed =
25.00
Sampler.SyringeDelay =
5
-40.000
; Detector specific settings
RI.Autozero
; Settings specific for complete systems
Wait Sampler.Ready
; Column Oven specific settings
; Pump specific settings
Wait RI.Ready
Purge =
on
-39.500 Purge =
off
-39.000 Purge =
On
-38.500 Purge =
Off
-38.000 Purge =
On
-20.000 Purge =
Off
-3.000 RI.Autozero
0.000
; Pump specific settings
Inject
RI_1.AcqOn
20.000 RI_1.AcqOff
End
HPLC_OQ_PQ_E_Manual.doc – Version: 6.8 dated Oktober 2008
Page 89 of 95
OQ and PQ Operating Instructions
7.12 Linearity of the RI Detector
;================================================================
; RI Detector Linearity
; --------------------------------------------------------------; PGM-Version December 20, 2002
;
; Restriction capillary: PEEK
;
ID: 0.13 mm
;
Length: 13 m
;
Back Pressure: 80 bar
;
; Eluent A : Water (HPLC quality)
;
; Solvent degassed via online degasser
;
; HPLC-System:
; -----------;
; Pump specific settings
; Pump:
Dionex P580 Pump
;
; Sampler specific settings
; Sampler:
Dionex ASI-100(T) Autosampler
;
; Detector specific settings
; Detector:
Dionex UVD 340S PDA
; Detector specific settings
; Detector:
Shodex RI-101
;
; Samples:
Glycerine 5 mg/ml, 10 mg/ml, 15 mg/ml, 25
mg/ml, 35 mg/ml
;
;==================================================================
; Pump specific settings
Log
Pump.ModelNo
Log
Pump.ModelVariant
Log
Pump.SerialNo
; Sampler specific settings
Log
;
Log
Sampler.ModelNo
Sampler.SerialNo
; Column Oven specific settings
; UV Detector specific settings
Log
UV.ModelNo
; Fluorescence detector specific settings
; RI Detector specific settings
Log
Page 90 of 95
RI.ModelNo
HPLC_OQ_PQ_E_Manual.doc – Version: 6.8 dated Oktober 2008
OQ and PQ Operating Instructions
Pressure.LowerLimit =
Pressure.UpperLimit =
%A.Equate =
10[bar]
300[bar]
"Water"
; Pump specific settings
; Settings specific for the Dionex P580
%A.Type =
Automatic
Flow =
1.000
RI_1.Step =
RI_1.Average =
0.2
On
; Detector specific settings
; Settings specific for the Shodex RI-101
RI.Temperature.Nominal =
35
Purge =
off
Recorder_Range =
512.00
Integrator_Range =
500
Rise_Time =
0.50
Polarity =
plus
Baseline_Shift =
0
; Sampler specific settings
; Settings specific for the Dionex ASI-100
Sampler.InjectMode =
Normal
Sampler.UpSpeed =
10.0
Sampler.DownSpeed =
10.0
Sampler.SampleHeight =
0.50
Sampler.WashSpeed =
50.00
Sampler.DispSpeed =
50.00
Sampler.DrawSpeed =
25.00
Sampler.SyringeDelay =
5
0.000
; Detector specific settings
RI.Autozero
; Settings specific for complete systems
; Pump specific settings
Wait Sampler.Ready
; Column Oven specific settings
Wait RI.Ready
Inject
RI_1.AcqOn
2.000 RI_1.Acqoff
End
HPLC_OQ_PQ_E_Manual.doc – Version: 6.8 dated Oktober 2008
Page 91 of 95
OQ and PQ Operating Instructions
7.13 Baseline Noise of the ELS Detector
;================================================================
; Noise for ELS Detectors
;---------------------------------------------------------------; PGM-Version: January 08, 2007
; Pressure regulator:
Pressure: 103+/-25 bar, Flow: 0.3-2 ml/min
; Eluent A :
Water (HPLC quality)
;
;
;
;
Solvent degassed via online degasser
HPLC-System:
Pump specific settings
Pump:
Dionex P680 Pump
; Sampler specific settings
; Sampler:
Dionex ASI-100(T) Autosampler
; Detector specific settings
; Detector:
not specified
; ELS-Detector specific settings
; Detector:
Polymer Laboratories ELS 2100 Detector
;===============================================================
; Pump specific settings
Log
Pump.ModelNo
Log
Pump.ModelVariant
Log
Pump.SerialNo
; Sampler specific settings
Log
Log
;
;
;
;
;
Sampler.SerialNo
Column Oven specific settings
UV Detector specific settings
Fluorescence detector specific settings
RI Detector specific settings
ELS Detector specific settings
Log
Pump.Pressure.LowerLimit =
Pump.Pressure.UpperLimit =
ELSD.ModelNo
10 [bar]
300 [bar]
Pump.%A.Equate =
"Water"
Pump.%B =
0.0
Pump.%C =
0.0
Pump.%D =
0.0
; Pump specific settings
Pump.Flow =
Page 92 of 95
Sampler.ModelNo
1.000
HPLC_OQ_PQ_E_Manual.doc – Version: 6.8 dated Oktober 2008
OQ and PQ Operating Instructions
ELS_1.Average =
ELS_1.Step =
On
0.10 [s]
; Detector specific settings
; Settings specific for the Polymer Laboratories ELS 2100
Detector
ELSD.Standby = NoStandby
ELSD.LightSourceIntensity =
90 [%]
ELSD.PMTGain =
1.0
ELSD.SmoothWidth =
1
ELSD.EvaporatorTemperature =
90 [°C]
ELSD.NebuliserTemperature =
50 [°C]
ELSD.CarrierFlow =
1.60 [slm]
; Sampler specific settings
; Settings specific for the Dionex ASI-100
Sampler.InjectMode =
Normal
Sampler.UpSpeed =
10.0
Sampler.DownSpeed =
10.0
Sampler.SampleHeight =
0.50
Sampler.WashSpeed =
50.00
Sampler.DispSpeed =
50.00
Sampler.DrawSpeed =
25.00
Sampler.SyringeDelay =
5
0.000
; Detector specific settings
ELSD.Autozero
; Settings specific for complete systems
; Pump specific settings
Wait Sampler.Ready
; Column Oven specific settings
Wait ELSD.Ready
Sampler.Inject
ELS_1.AcqOn
21.000
ELS_1.AcqOff
End
HPLC_OQ_PQ_E_Manual.doc – Version: 6.8 dated Oktober 2008
Page 93 of 95
OQ and PQ Operating Instructions
Page 94 of 95
HPLC_OQ_PQ_E_Manual.doc – Version: 6.8 dated Oktober 2008
OQ and PQ Operating Instructions
8
Example Report
For an OQ example report, refer to the following pages.
The report was generated for the following system configuration:
P580 LPG
ASI-100
UVD 340S
STH 585
RI-101
RF 2000
HPLC_OQ_PQ_E_Manual.doc – Version: 6.8 dated Oktober 2008
Page 95 of 95
Seq: DQ_PQ_OQ_FOQ\PQ_OQ\HPLC\DEMO_for_Manual\HPLC_OQ_DEMO_RUNS\OQ_WARM_UP
Page 1 of 3
Runtime: 14-Apr-2004 14:36:35
Smp: Warm up
Operational Qualification
• Instruments
Instrument Name
Model
Supplier's Name
Serial Number
Pump
P680 LPG
DIONEX
1920401
Autosampler
ASI-100
DIONEX
1860410
Column Oven
TCC-100
DIONEX
1850409
UV Detector
UVD 340U
DIONEX
1830402
Fluorescence Detector
Other
DIONEX
not available
RI Detector
Other
Shodex
not available
ELS Detector
Other
DIONEX
not available
Chromeleon Datasystem
V. 6.60 Build 1428
DIONEX
11
• Additional Information
Customer:
Customer's Name
Operator:
Operator's Name
Operator's Jobtitle
Execution Date:
Apr-14-04
Period between two Qualifications:
6 months
Next Qualification:
Oct-04
______________________________
Reviewer's signature // Date
Chromeleon (c) DIONEX 2008
Version 6.80 SR5 Build 2413 (137116)
______________________________
Operator's signature // Date
PQ_OQ_Report_6_8 / SPECIFICATION
Printed: 27-10-2008 3:24 PM
Seq: DQ_PQ_OQ_FOQ\PQ_OQ\HPLC\DEMO_for_Manual\HPLC_OQ_DEMO_RUNS\OQ_WARM_UP
Page 2 of 3
Runtime: 14-Apr-2004 14:36:35
Smp: Warm up
• Accessories
Accessories
Name
Lot No.
Exp. Date
Back Pressure Device
Capillary (L:15 m; ID:0,18 mm)
Sample 1
Pyrene in Methanol 3 µg/ml
LA-91960
Jul-02
Sample 2
Caffeine in Water 10 µg/ml
LA-91955
Jul-02
Sample 3
Caffeine in Water 60 µg/ml
LA-91956
Jul-02
Sample 4
Caffeine in Water 140 µg/ml
LA-91957
Jul-02
Sample 5
Caffeine in Water 220 µg/ml
LA-91958
Jul-02
Sample 6
Caffeine in Water 300 µg/ml
LA-91959
Jul-02
Sample 7
Caffeine in Water 2000 µg/ml
LA-91959
Jul-02
Sample 8
Water (HPLC-Grade)
Sample 9
Glycerine in Water 5 mg/ml
Sample 10
Glycerine in Water 10 mg/ml
Sample 11
Glycerine in Water 15 mg/ml
Sample 12
Glycerine in Water 25 mg/ml
Sample 13
Glycerine in Water 35 mg/ml
Sample 14
Water (Uncapped Vial)
Solvent A
Water (HPLC-Grade)
Solvent A for Wavelength Accuracy
Methanol (HPLC-Grade)
Solvent B for Gradient
Water + 0.1 % Acetone
Solvent C for Gradient
Water (HPLC-Grade)
Thermometer
SN: 43077
Temperature Sensor
SN: 111988
______________________________
Reviewer's signature // Date
Chromeleon (c) DIONEX 2008
Version 6.80 SR5 Build 2413 (137116)
______________________________
Operator's signature // Date
PQ_OQ_Report_6_8 / SPECIFICATION
Printed: 27-10-2008 3:24 PM
Seq: DQ_PQ_OQ_FOQ\PQ_OQ\HPLC\DEMO_for_Manual\HPLC_OQ_DEMO_RUNS\OQ_WARM_UP
Page 3 of 3
Runtime: 14-Apr-2004 14:36:35
Smp: Warm up
• Limits
Criterion
Adjusted Limits
Limits with Optimized Conditions
Noise (UV)
0.030 mAU
0.030 mAU
Drift (UV)
0.80 mAU/h
0.80 mAU/h
Lamp Intensity (UV)
500000 counts/s
500000 counts/s
Detector Wavelength Accuracy
+/- 0.75 nm
+/- 0.75 nm
Detector Linearity (Corr.)
99.980 %
99.980 %
Detector Linearity
5.000 % RSD
5.000 % RSD
Injector Presicision (Area)
0.300 % RSD
0.300 % RSD
Flow Presicision (Ret. Time)
0.0100 min SD
0.0100 min SD
0.050 % RSD
0.050 % RSD
Carry Over (Area)
0.100 %
0.100 %
Injector Linearity (Corr.)
99.99000 %
99.99000 %
Injector Linearity
0.500 % RSD
0.500 % RSD
Temperature of Injector
n.a.
n.a.
Gradient Accuracy
1.000 %
1.000 %
Gradient Presicision
0.500 % STD
0.500 % STD
Pump Ripple
0.500 %
0.500 %
Temperature of Column Oven
+/- 1.0 °C
+/- 1.0 °C
Noise (RF)
0.30 mV
0.30 mV
Signal (RF) min
40.00 mV
40.00 mV
Signal (RF) max
80.00 mV
80.00 mV
Wavelength Accuracy (RF)
+/- 10 nm
+/- 10 nm
Noise (RI)
50.0 nRIU
50.0 nRIU
Drift (RI)
500.0 nRIU/h
500.0 nRIU/h
Detector Linearity (Corr.) (RI)
99.900 %
99.900 %
Noise (ELS)
0.3 mV
0.3 mV
(UV)
______________________________
Reviewer's signature // Date
Chromeleon (c) DIONEX 2008
Version 6.80 SR5 Build 2413 (137116)
______________________________
Operator's signature // Date
PQ_OQ_Report_6_8 / SPECIFICATION
Printed: 27-10-2008 3:24 PM
Seq: DQ_PQ_OQ_FOQ\PQ_OQ\HPLC\DEMO_for_Manual\HPLC_OQ_DEMO_RUNS\OQ_DAD_WAVELENGTH
Page 1 of 2
Runtime: 13-Apr-2004 19:32:27
Smp: Detector wavelength accuracy_DAD
Operational Qualification
• Wavelength Accuracy of the DAD
• Instruments and Fluidics
Instrument Name
Model
Supplier's Name
Serial Number
Pump
P680 LPG
DIONEX
1920401
Autosampler
ASI-100
DIONEX
1860410
Column Oven
TCC-100
DIONEX
1850409
UV Detector
UVD 340U
DIONEX
1830402
Chromeleon Datasystem
V. 6.60 Build 1428
DIONEX
11
Accessories
Name
Back Pressure Device
Capillary (L:15 m; ID:0,18 mm)
Sample 1
Pyrene in Methanol 3 µg/ml
Solvent A for Wavelength Accuracy
Methanol (HPLC-Grade)
Additional Information
Customer:
Customer's Name
Operator:
Operator's Name
Operator's Jobtitle
Execution Date:
Apr-13-04
Next Qualification:
Oct-04
• Limits, Values and Test Results
Limit
Obs. Value
Result
Wavelength Accuracy at 272,1 nm
+/- 0.75 nm
-0.22 nm
Test passed
Wavelength Accuracy at 333,3 nm
+/- 0.75 nm
-0.02 nm
Test passed
______________________________
Reviewer's signature // Date
Chromeleon (c) DIONEX 2008
Version 6.80 SR5 Build 2413 (137116)
______________________________
Operator's signature // Date
PQ_OQ_Report_6_8 / DET_WAVELENGTH_DAD
Printed: 27-10-2008 2:53 PM
Seq: DQ_PQ_OQ_FOQ\PQ_OQ\HPLC\DEMO_for_Manual\HPLC_OQ_DEMO_RUNS\OQ_DAD_WAVELENGTH
Page 2 of 2
Runtime: 13-Apr-2004 19:32:27
Smp: Detector wavelength accuracy_DAD
• Data for the Wavelength Accuracy Test (DAD)
Observed Wavelength
[nm]
Testpoint
Expected
Abs.Critical
Calculated
Result
Wavelength [nm] Deviation[nm] Deviation[nm]
Pyrene Maximum 1
271.88
272.10
0.75
-0.22
ok
Pyrene Maximum 2
333.28
333.30
0.75
-0.02
ok
• Pyrene-Spectrum for the Wavelength Accuracy Test (DAD)
60.0
Pyrene
%
100% at 0.31 min
271.9
50.0
333.3
40.0
317.9
261.0
30.0
20.0
251.1
10.0
0.0
-10.0
250
nm
260
270
280
______________________________
Reviewer's signature // Date
Chromeleon (c) DIONEX 2008
Version 6.80 SR5 Build 2413 (137116)
290
300
310
320
330
340
350
______________________________
Operator's signature // Date
PQ_OQ_Report_6_8 / DET_WAVELENGTH_DAD
Printed: 27-10-2008 2:53 PM
Seq: DQ_PQ_OQ_FOQ\PQ_OQ\HPLC\DEMO_for_Manual\HPLC_OQ_DEMO_RUNS\OQ_UV_NOISE_DRIFT
Page 1 of 3
Runtime: 13-Apr-2004 23:12:48
Smp: Detector noise drift and lamp intensity
Operational Qualification
• UV Detector Noise and Drift
• Instruments and Fluidics
Instrument Name
Model
Supplier's Name
Serial Number
Pump
P680 LPG
DIONEX
1920401
Autosampler
ASI-100
DIONEX
1860410
Column Oven
TCC-100
DIONEX
1850409
UV Detector
UVD 340U
DIONEX
1830402
Chromeleon Datasystem
V. 6.60 Build 1428
DIONEX
11
Accessories
Name
Back Pressure Device
Capillary (L:15 m; ID:0,18 mm)
Solvent A
Water (HPLC-Grade)
• Additional Information
Customer:
Customer's Name
Operator:
Operator's Name
Operator's Jobtitle
Execution Date:
Apr-13-04
Next Qualification:
Oct-04
• Limits, Values and Test Results
Limit
Observed Value
Result
Noise (UV)
0.030 mAU
0.021 mAU
Test passed
Drift (UV)
0.80 mAU/h
0.44 mAU/h
Test passed
500000 counts/s
1026240 counts/s
Test passed
Lamp Intensity (UV)
Remark: Noise and drift are measured dynamically with a floated cell. The limits are different from
published specifications, because they are valid for static conditions only (empty cell).
Reviewer's signature // Date
Chromeleon (c) DIONEX 2008
Version 6.80 SR5 Build 2413 (137116)
Operator's signature // Date
PQ_OQ_Report_6_8 / DET_NOISE_AND_DRIFT
Printed: 27-10-2008 3:16 PM
Seq: DQ_PQ_OQ_FOQ\PQ_OQ\HPLC\DEMO_for_Manual\HPLC_OQ_DEMO_RUNS\OQ_UV_NOISE_DRIFT
Page 2 of 3
Runtime: 13-Apr-2004 23:12:48
Smp: Detector noise drift and lamp intensity
• Data for Detector Noise Test
Segment No.
Noise [mAU]
1
0.024
2
0.018
3
0.021
4
0.019
5
0.024
6
0.027
7
0.020
8
0.024
9
0.020
10
0.017
11
0.023
12
0.016
13
0.026
14
0.016
15
0.018
16
0.022
17
0.022
18
0.018
19
0.025
20
0.026
Average:
0.021 mAU
Limit:
0.030 mAU
Result:
______________________________
Reviewer's signature // Date
Chromeleon (c) DIONEX 2008
Version 6.80 SR5 Build 2413 (137116)
ok
______________________________
Operator's signature // Date
PQ_OQ_Report_6_8 / DET_NOISE_AND_DRIFT
Printed: 27-10-2008 3:16 PM
Seq: DQ_PQ_OQ_FOQ\PQ_OQ\HPLC\DEMO_for_Manual\HPLC_OQ_DEMO_RUNS\OQ_UV_NOISE_DRIFT
Page 3 of 3
Runtime: 13-Apr-2004 23:12:48
Smp: Detector noise drift and lamp intensity
• Chart for Noise Test
Detector Noise
0.10
0.09
0.08
0.07
0.06
0.05
0.04
0.03
0.02
0.01
0.00
0
2
4
6
8
10
12
14
16
18
20
Segment No.
______________________________
Reviewer's signature // Date
Chromeleon (c) DIONEX 2008
Version 6.80 SR5 Build 2413 (137116)
______________________________
Operator's signature // Date
PQ_OQ_Report_6_8 / DET_NOISE_AND_DRIFT
Printed: 27-10-2008 3:16 PM
Seq: DQ_PQ_OQ_FOQ\PQ_OQ\HPLC\DEMO_for_Manual\HPLC_OQ_DEMO_RUNS\OQ_INJECTOR_FLOW_REPRO
Page 1 of 3
Smp: Injector and flow reproducibility_10
Runtime: 14-Apr-2004 00:20:19
Operational Qualification
• Injector and Flow Reproducibility
• Instruments and Fluidics
Instrument Name
Model
Supplier's Name Serial Number
Pump
P680 LPG
DIONEX
1920401
Autosampler
ASI-100
DIONEX
1860410
Column Oven
TCC-100
DIONEX
1850409
UV Detector
UVD 340U
DIONEX
1830402
Chromeleon Datasystem
V. 6.60 Build 1428
DIONEX
11
Accessories
Name
Back Pressure Device
Capillary (L:15 m; ID:0,18 mm)
Sample 4
Caffeine in Water 140 µg/ml
Solvent A
Water (HPLC-Grade)
• Additional Information
Customer:
Customer's Name
Operator:
Operator's Name
Operator's Jobtitle
Execution Date:
Apr-14-04
Next Qualification:
Oct-04
• Limits, Values and Test Results
Injector Presicision (Area)
Limit
Observed Value
Result
0.300 % RSD
0.188 % RSD
Test passed
0.050 % RSD
0.104 % RSD
0.0100 min SD
0.0011 min SD
Flow Presicision (Ret. Time)
______________________________
Reviewer's signature // Date
Chromeleon (c) DIONEX 2008
Version 6.80 SR5 Build 2413 (137116)
Test passed
______________________________
Operator's signature // Date
PQ_OQ_Report_6_8 / INJ_REPRO_AND_RET_REPRO
Printed: 27-10-2008 2:54 PM
Seq: DQ_PQ_OQ_FOQ\PQ_OQ\HPLC\DEMO_for_Manual\HPLC_OQ_DEMO_RUNS\OQ_INJECTOR_FLOW_REPRO
Page 2 of 3
Smp: Injector and flow reproducibility_10
Runtime: 14-Apr-2004 00:20:19
• Data for Injector and Flow Reproducibility Test: Volume 5.0 µl
Ret.Time
Area
min
mAU*min
Caffeine
Caffeine
UV_VIS_1
UV_VIS_1
Injector and flow reproducibility_1
1.0067
93.036
Injector and flow reproducibility_2
1.0100
92.955
Injector and flow reproducibility_3
1.0100
93.025
Injector and flow reproducibility_4
1.0100
92.907
Injector and flow reproducibility_5
1.0100
92.872
Injector and flow reproducibility_6
1.0100
92.656
Injector and flow reproducibility_7
1.0100
92.663
Injector and flow reproducibility_8
1.0100
92.725
Injector and flow reproducibility_9
1.0100
92.537
Injector and flow reproducibility_10
1.0100
92.952
Average:
1.0097
92.833
RSD:
0.104 %
0.188 %
RSD Limit:
0.050 %
0.300 %
SD:
0.0011
SD Limit:
0.0100
Sample Name
Result:
______________________________
Reviewer's signature // Date
Chromeleon (c) DIONEX 2008
Version 6.80 SR5 Build 2413 (137116)
ok
ok
______________________________
Operator's signature // Date
PQ_OQ_Report_6_8 / INJ_REPRO_AND_RET_REPRO
Printed: 27-10-2008 2:54 PM
Seq: DQ_PQ_OQ_FOQ\PQ_OQ\HPLC\DEMO_for_Manual\HPLC_OQ_DEMO_RUNS\OQ_INJECTOR_FLOW_REPRO
Page 3 of 3
Smp: Injector and flow reproducibility_10
Runtime: 14-Apr-2004 00:20:19
• Charts for Injector and Flow Reproducibility Test
Area % Deviation from Mean Value
1.00
0.60
0.20
-0.20
1
2
3
4
5
6
7
8
9
10
9
10
-0.60
-1.00
Sample No.
Retention Time % Deviation from Mean Value
1.00
0.75
0.50
0.25
0.00
-0.25
-0.50
-0.75
-1.00
1
2
3
4
5
6
7
8
Sample No.
______________________________
Reviewer's signature // Date
Chromeleon (c) DIONEX 2008
Version 6.80 SR5 Build 2413 (137116)
______________________________
Operator's signature // Date
PQ_OQ_Report_6_8 / INJ_REPRO_AND_RET_REPRO
Printed: 27-10-2008 2:54 PM
Seq: DQ_PQ_OQ_FOQ\PQ_OQ\HPLC\DEMO_for_Manual\HPLC_OQ_DEMO_RUNS\OQ_UV_LINEARITY
Page 1 of 2
Runtime: 14-Apr-2004 00:33:46
Smp: Detector linearity_5
Operational Qualification
• UV Detector Linearity
• Instruments and Fluidics
Instrument Name
Model
Supplier's Name
Serial Number
Pump
P680 LPG
DIONEX
1920401
Autosampler
ASI-100
DIONEX
1860410
Column Oven
TCC-100
DIONEX
1850409
UV Detector
UVD 340U
DIONEX
1830402
Chromeleon Datasystem
V. 6.60 Build 1428
DIONEX
11
Accessories
Name
Back Pressure Device
Sample 2
Sample 3
Sample 4
Sample 5
Sample 6
Solvent A
Capillary (L:15 m; ID:0,18 mm)
Caffeine in Water 10 µg/ml
Caffeine in Water 60 µg/ml
Caffeine in Water 140 µg/ml
Caffeine in Water 220 µg/ml
Caffeine in Water 300 µg/ml
Water (HPLC-Grade)
• Additional Information
Customer:
Customer's Name
Operator:
Operator's Name
Operator's Jobtitle
Execution Date:
Apr-14-04
Next Qualification:
Oct-04
• Limits, Values and Test Results
Detector Linearity (Corr.)
(UV)
Detector Linearity
Limit
Observed Value
Result
99.980 %
99.999 %
Test passed
5.000 % RSD
0.422 % RSD
Test passed
______________________________
Reviewer's signature // Date
Chromeleon (c) DIONEX 2008
Version 6.80 SR5 Build 2413 (137116)
______________________________
Operator's signature // Date
PQ_OQ_Report_6_8 / DET_LINEARITY
Printed: 27-10-2008 3:16 PM
Seq: DQ_PQ_OQ_FOQ\PQ_OQ\HPLC\DEMO_for_Manual\HPLC_OQ_DEMO_RUNS\OQ_UV_LINEARITY
Page 2 of 2
Runtime: 14-Apr-2004 00:33:46
Smp: Detector linearity_5
• Data for Detector Linearity
Sample Name
Amount
Area
ppm
mAU*min
Caffeine
Caffeine
UV_VIS_1
UV_VIS_1
10.0
4.258
Detector linearity_2
60.0
25.036
Detector linearity_3
140.0
58.740
Detector linearity_4
220.0
92.094
Detector linearity_5
300.0
124.911
Detector linearity_1
• Calibration Curve
140
Caffeine
Area [mAU*min]
External
UV_VIS_1
100
50
ppm
0
0
50
100
150
200
250
Cal.Type
Number of Points
Offset
Slope
UV_VIS_1
UV_VIS_1
UV_VIS_1
UV_VIS_1
Lin
5
0.000
0.417
Correlation Coefficient
RSD
99.999 %
0.422 %
99.980 %
5.000 %
ok
ok
Limit:
Result:
______________________________
Reviewer's signature // Date
Chromeleon (c) DIONEX 2008
Version 6.80 SR5 Build 2413 (137116)
310
______________________________
Operator's signature // Date
PQ_OQ_Report_6_8 / DET_LINEARITY
Printed: 27-10-2008 3:16 PM
Seq: DQ_PQ_OQ_FOQ\PQ_OQ\HPLC\DEMO_for_Manual\HPLC_OQ_DEMO_RUNS\OQ_RI_NOISE_DRIFT
Page 1 of 3
Runtime: 31-Jan-2003 16:10:23
Smp: RI-Detector noise drift
Operational Qualification
• RI Detector Noise and Drift
• Instruments and Fluidics
Instrument Name
Model
Supplier's Name
Serial Number
Pump
P680 HPG
DIONEX
1920105
Autosampler
ASI-100
DIONEX
9932012
Column Oven
TCC-100
DIONEX
Demo
RI Detector
RI-101
Shodex
not available
Chromeleon Datasystem
Version: 6.80 SR5 Build 2413
DIONEX
(137116)
Accessories
Name
Back Pressure Device
Capillary (L:15 m; ID:0,18 mm)
Solvent A
Water (HPLC-Grade)
11
• Additional Information
Customer:
Customer's Name
Operator:
Operator's Name
Operator's Jobtitle
Execution Date:
Jan-31-03
Next Qualification:
Jul-03
• Limits, Values and Test Results
Noise (RI)
Drift (RI)
Limit
Observed Value
Result
50.0 nRIU
26.6 nRIU
Test passed
500.0 nRIU/h
321.8 nRIU/h
Test passed
Remark: Noise and drift are measured dynamically with a floated cell. The limits are different from
published specifications, because they are valid for static conditions only (empty cell).
Reviewer's signature // Date
Chromeleon (c) DIONEX 2008
Version 6.80 SR5 Build 2413 (137116)
Operator's signature // Date
PQ_OQ_Report_6_8 / RI_NOISE_AND_DRIFT
Printed: 27-10-2008 2:55 PM
Seq: DQ_PQ_OQ_FOQ\PQ_OQ\HPLC\DEMO_for_Manual\HPLC_OQ_DEMO_RUNS\OQ_RI_NOISE_DRIFT
Page 2 of 3
Runtime: 31-Jan-2003 16:10:23
Smp: RI-Detector noise drift
• Data for Detector Noise and Drift Test
Segment No.
Noise [nRIU]
Amount of Drift [nRIU/h]
1
25.3
173.299
2
26.3
231.224
3
36.8
282.414
4
44.8
839.815
5
27.2
4.386
6
30.3
214.676
7
24.7
204.259
8
19.0
953.907
9
30.5
494.897
10
22.8
344.469
11
29.8
47.102
12
23.4
923.453
13
21.6
4.237
14
19.8
221.655
15
25.2
181.431
16
22.7
3.639
17
23.7
185.468
18
25.5
545.040
19
23.4
163.138
20
28.5
417.141
Average:
26.6 nRIU
321.8 nRIU/h
Limit:
50.0 nRIU
500.0 nRIU/h
ok
ok
Result:
______________________________
Reviewer's signature // Date
Chromeleon (c) DIONEX 2008
Version 6.80 SR5 Build 2413 (137116)
______________________________
Operator's signature // Date
PQ_OQ_Report_6_8 / RI_NOISE_AND_DRIFT
Printed: 27-10-2008 2:55 PM
Seq: DQ_PQ_OQ_FOQ\PQ_OQ\HPLC\DEMO_for_Manual\HPLC_OQ_DEMO_RUNS\OQ_RI_NOISE_DRIFT
Page 3 of 3
Runtime: 31-Jan-2003 16:10:23
Smp: RI-Detector noise drift
• Charts for Noise and Drift Test
Detector Noise
75.00
60.00
45.00
30.00
15.00
0.00
0
2
4
6
8
10
12
14
16
18
20
16
18
20
Segment No.
Amount of Drift
1000.00
800.00
600.00
400.00
200.00
0.00
0
2
4
6
8
10
12
14
Segment No.
______________________________
Reviewer's signature // Date
Chromeleon (c) DIONEX 2008
Version 6.80 SR5 Build 2413 (137116)
______________________________
Operator's signature // Date
PQ_OQ_Report_6_8 / RI_NOISE_AND_DRIFT
Printed: 27-10-2008 2:55 PM
Seq: DQ_PQ_OQ_FOQ\PQ_OQ\HPLC\DEMO_for_Manual\HPLC_OQ_DEMO_RUNS\OQ_RI_LINEARITY
Page 1 of 2
Runtime: 24-Feb-2003 09:45:59
Smp: RI_Detector linearity_5
Operational Qualification
• RI Detector Linearity
• Instruments and Fluidics
Instrument Name
Model
Supplier's Name
Serial Number
Pump
P680 HPG
DIONEX
1920105
Autosampler
ASI-100
DIONEX
9932012
Column Oven
TCC-100
DIONEX
Demo
RI Detector
RI-101
Shodex
not available
Chromeleon Datasystem
Version: 6.80 SR5 Build 2413DIONEX
(137116)
Accessories
Name
Back Pressure Device
Sample 9
Sample 10
Sample 11
Sample 12
Sample 13
Solvent A
Capillary (L:15 m; ID:0,18 mm)
Glycerine in Water 5 mg/ml
Glycerine in Water 10 mg/ml
Glycerine in Water 15 mg/ml
Glycerine in Water 25 mg/ml
Glycerine in Water 35 mg/ml
Water (HPLC-Grade)
11
• Additional Information
Customer:
Customer's Name
Operator:
Operator's Name
Operator's Jobtitle
Execution Date:
Feb-24-03
Next Qualification:
Aug-03
• Limits, Values and Test Results
Detector Linearity (Corr.) (RI)
______________________________
Reviewer's signature // Date
Chromeleon (c) DIONEX 2008
Version 6.80 SR5 Build 2413 (137116)
Limit
Observed Value
Result
99.900 %
99.999 %
Test passed
______________________________
Operator's signature // Date
PQ_OQ_Report_6_8 / RI_LINEARITY
Printed: 27-10-2008 2:54 PM
Seq: DQ_PQ_OQ_FOQ\PQ_OQ\HPLC\DEMO_for_Manual\HPLC_OQ_DEMO_RUNS\OQ_RI_LINEARITY
Page 2 of 2
Runtime: 24-Feb-2003 09:45:59
Smp: RI_Detector linearity_5
• Data for Detector Linearity
Sample Name
Amount
Area
Height
µRIU*min
µRIU
Glycerine
Glycerine
Glycerine
RI_1
RI_1
RI_1
5.00
10.00
15.00
25.00
35.00
6.536
12.223
17.967
29.214
40.476
77.6
144.5
210.4
343.2
473.2
RI_Detector linearity_1
RI_Detector linearity_2
RI_Detector linearity_3
RI_Detector linearity_4
RI_Detector linearity_5
Glycerine
Area [µRIU*min]
45.0
External
RI_1
30.0
20.0
10.0
0.0
0.0
10.0
20.0
30.0
40.0
Cal.Type
Number of Points
Offset
Slope
RI
RI
RI
RI
LOff
5
0.926
1.131
Correlation Coefficient
99.999 %
Limit:
Result:
______________________________
Reviewer's signature // Date
Chromeleon (c) DIONEX 2008
Version 6.80 SR5 Build 2413 (137116)
99.900 %
ok
______________________________
Operator's signature // Date
PQ_OQ_Report_6_8 / RI_LINEARITY
Printed: 27-10-2008 2:54 PM
Seq: DQ_PQ_OQ_FOQ\PQ_OQ\HPLC\DEMO_for_Manual\HPLC_OQ_DEMO_RUNS\OQ_SAMPLER_LIN_CO
Page 1 of 2
Runtime: 14-Apr-2004 00:43:39
Smp: Injector linearity_5
Operational Qualification
• Injector Linearity
• Instruments and Fluidics
Instrument Name
Model
Supplier's Name Serial Number
Pump
P680 LPG
DIONEX
1920401
Autosampler
ASI-100
DIONEX
1860410
Column Oven
TCC-100
DIONEX
1850409
UV Detector
UVD 340U
DIONEX
1830402
Chromeleon Datasystem
V. 6.60 Build 1428
DIONEX
11
Accessories
Name
Back Pressure Device
Capillary (L:15 m; ID:0,18 mm)
Sample 2
Caffeine in Water 10 µg/ml
Solvent A
Water (HPLC-Grade)
• Additional Information
Customer:
Customer's Name
Operator:
Operator's Name
Operator's Jobtitle
Execution Date:
Apr-14-04
Next Qualification:
Oct-04
• Limits, Values and Test Results
Limit
Observed Value
Result
Injector Linearity (Corr.)
99.99000 %
99.99979 %
Test passed
Injector Linearity
0.500 % RSD
0.238 % RSD
Test passed
______________________________
Reviewer's signature // Date
Chromeleon (c) DIONEX 2008
Version 6.80 SR5 Build 2413 (137116)
______________________________
Operator's signature // Date
PQ_OQ_Report_6_8 / INJ_LINEARITY
Printed: 27-10-2008 3:11 PM
Seq: DQ_PQ_OQ_FOQ\PQ_OQ\HPLC\DEMO_for_Manual\HPLC_OQ_DEMO_RUNS\OQ_SAMPLER_LIN_CO
Page 2 of 2
Runtime: 14-Apr-2004 00:43:39
Smp: Injector linearity_5
• Calibration Curve
40.0 Caffeine
Area [mAU*min]
External
UV_VIS_1
30.0
20.0
10.0
0.0
0.0
µl
10.0
20.0
30.0
40.0
50.0
60.0
70.0
80.0
90.0
• Data for Injector Linearity Test
Sample Name
Ret.Time
Inj.Vol.
Area
min
µl
mAU*min
Caffeine
Caffeine
UV_VIS_1
UV_VIS_1
Injector linearity_1
0.31
5.0
2.029
Injector linearity_2
0.31
10.0
4.274
Injector linearity_3
0.32
20.0
8.795
Injector linearity_4
0.33
40.0
17.746
Injector linearity_5
0.34
80.0
35.591
Cal.Type
Number of Points
Offset
Slope
UV_VIS_1
UV_VIS_1
UV_VIS_1
UV_VIS_1
LOff
5
-0.184
0.447
Correlation Coefficient
RSD
99.99979 %
0.238 %
99.99000 %
0.500 %
ok
ok
Limit:
Result:
______________________________
Reviewer's signature // Date
Chromeleon (c) DIONEX 2008
Version 6.80 SR5 Build 2413 (137116)
______________________________
Operator's signature // Date
PQ_OQ_Report_6_8 / INJ_LINEARITY
Printed: 27-10-2008 3:11 PM
Seq: DQ_PQ_OQ_FOQ\PQ_OQ\HPLC\DEMO_for_Manual\HPLC_OQ_DEMO_RUNS\OQ_SAMPLER_LIN_CO
Page 1 of 2
Runtime: 26-Jan-2007 15:30:06
Smp: Inject solvent
Operational Qualification
• Injector Carry Over
• Instruments and Fluidics
Instrument Name
Model
Supplier's Name Serial Number
Pump
LPG-3400M
DIONEX
1340410
Autosampler
WPS-3000PL
DIONEX
7
Column Oven
TCC-3200
DIONEX
Demo
UV Detector
UVD 340U
DIONEX
4310409
Chromeleon Datasystem
V. 6.80 SP2 Build 2258 (Beta)DIONEX
Accessories
Name
Back Pressure Device
Capillary (L:15 m; ID:0,18 mm)
Sample 2
Caffeine in Water 10 µg/ml
Sample 7
Caffeine in Water 2000 µg/ml
Sample 8
Water (HPLC-Grade)
Solvent A
Water (HPLC-Grade)
11
• Additional Information
Customer:
Customer's Name
Operator:
Operator's Name
Operator's Jobtitle
Execution Date:
Jan-26-07
Next Qualification:
Jul-07
• Limits, Values and Test Results
Carry Over (Area)
______________________________
Reviewer's signature // Date
Chromeleon (c) DIONEX 2008
Version 6.80 SR5 Build 2413 (137116)
Limit
Observed Value
Result
0.050 %
no data
Test passed
______________________________
Operator's signature // Date
PQ_OQ_Report_6_8 / INJ_CARRY_OVER
Printed: 27-10-2008 3:11 PM
Seq: DQ_PQ_OQ_FOQ\PQ_OQ\HPLC\DEMO_for_Manual\HPLC_OQ_DEMO_RUNS\OQ_SAMPLER_LIN_CO
Page 2 of 2
Runtime: 26-Jan-2007 15:30:06
Smp: Inject solvent
• Chromatogram for Carry Over Test
3.00 OQ_SAMPLER_LIN_CO #9
mAU
Inject solvent
UV_VIS_1
WVL:272 nm
2.50
2.00
1.50
1.00
2 - Caffeine - 0.567
1 - 0.200
0.50
3 - 1.150
-0.00
-0.50
0.00
min
0.10
0.20
0.30
0.40
0.50
0.60
0.70
0.80
0.90
1.00
1.10
1.25
• Data for Carry Over Test
Sample Name
Ret.Time
Area
min
mAU*min
Caffeine
Caffeine
UV_VIS_1
UV_VIS_1
Inject solvent_Reference
0.58
0.132
Carry over_Reference
0.55
4.842
Carry over
0.53
447.221
Inject solvent
0.57
0.093
Carry over:
no data
Limit:
0.050 %
Result:
______________________________
Reviewer's signature // Date
Chromeleon (c) DIONEX 2008
Version 6.80 SR5 Build 2413 (137116)
ok
______________________________
Operator's signature // Date
PQ_OQ_Report_6_8 / INJ_CARRY_OVER
Printed: 27-10-2008 3:11 PM
Seq: DQ_PQ_OQ_FOQ\PQ_OQ\HPLC\DEMO_for_Manual\HPLC_OQ_DEMO_RUNS\OQ_FLUORESCENCE
Page 1 of 3
Runtime: 30-May-2001 00:36:00
Smp: Fluorescence_Detector_Noise
Operational Qualification
• Fluorescence Detector Noise
• Instruments and Fluidics
Instrument Name
Model
Supplier's Name
Serial Number
Pump
P580 LPG
DIONEX
9730 028
Autosampler
ASI-100
DIONEX
9932012
Column Oven
STH 585
DIONEX
not available
Fluorescence Detector
RF2000
DIONEX
not available
Chromeleon Datasystem
Version: 6.80 SR5 Build 2413
DIONEX
(137116)
Accessories
Name
Back Pressure Device
Capillary (L:15 m; ID:0,18 mm)
Solvent A
Water (HPLC-Grade)
11
• Additional Information
Customer:
Customer's Name
Operator:
Operator's Name
Operator's Jobtitle
Execution Date:
May-30-01
Next Qualification:
Nov-01
• Limits, Values and Test Results
Limit
Observed Value
Result
Noise (RF)
0.30 mV
0.10 mV
Test passed
Signal (RF) min
40.00 mV
42.97 mV
Test passed
Signal (RF) max
80.00 mV
43.10 mV
Test passed
______________________________
Reviewer's signature // Date
Chromeleon (c) DIONEX 2008
Version 6.80 SR5 Build 2413 (137116)
______________________________
Operator's signature // Date
PQ_OQ_Report_6_8 / RF_DET_NOISE
Printed: 27-10-2008 2:53 PM
Seq: DQ_PQ_OQ_FOQ\PQ_OQ\HPLC\DEMO_for_Manual\HPLC_OQ_DEMO_RUNS\OQ_FLUORESCENCE
Page 2 of 3
Runtime: 30-May-2001 00:36:00
Smp: Fluorescence_Detector_Noise
• Data for RF Detector Noise
Segment No.
Noise [mV]
1
0.118
2
0.109
3
0.099
4
0.074
5
0.101
6
0.109
7
0.123
8
0.069
9
0.089
10
0.066
11
0.073
12
0.097
13
0.149
14
0.080
15
0.076
16
0.074
17
0.151
18
0.052
19
0.129
20
0.110
21
0.091
22
0.112
23
0.109
24
0.079
25
0.128
26
0.113
27
0.101
28
0.113
29
0.108
30
0.073
Average:
0.10 mV
Limit:
0.30 mV
Result:
______________________________
Reviewer's signature // Date
Chromeleon (c) DIONEX 2008
Version 6.80 SR5 Build 2413 (137116)
ok
______________________________
Operator's signature // Date
PQ_OQ_Report_6_8 / RF_DET_NOISE
Printed: 27-10-2008 2:53 PM
Seq: DQ_PQ_OQ_FOQ\PQ_OQ\HPLC\DEMO_for_Manual\HPLC_OQ_DEMO_RUNS\OQ_FLUORESCENCE
Page 3 of 3
Runtime: 30-May-2001 00:36:00
Smp: Fluorescence_Detector_Noise
• Charts for RF Detector Noise Test
RF Detector Noise
0.16
0.14
0.12
0.10
0.08
0.06
0.04
0
5
10
15
20
25
30
Segment No.
______________________________
Reviewer's signature // Date
Chromeleon (c) DIONEX 2008
Version 6.80 SR5 Build 2413 (137116)
______________________________
Operator's signature // Date
PQ_OQ_Report_6_8 / RF_DET_NOISE
Printed: 27-10-2008 2:53 PM
Seq: DQ_PQ_OQ_FOQ\PQ_OQ\HPLC\DEMO_for_Manual\HPLC_OQ_DEMO_RUNS\OQ_FLUORESCENCE
Page 1 of 2
Runtime: 30-May-2001 00:54:06
Smp: Fluorescence_Detector_Wavelength
Operational Qualification
• Fluorescence Detector Wavelength Accuracy
• Instruments and Fluidics
Instrument Name
Model
Supplier's Name
Serial Number
Pump
P580 LPG
DIONEX
9730 028
Autosampler
ASI-100
DIONEX
9932012
Column Oven
STH 585
DIONEX
not available
Fluorescence Detector
RF2000
DIONEX
not available
Chromeleon Datasystem
Version: 6.80 SR5 Build 2413
DIONEX
(137116)
Accessories
Name
Back Pressure Device
Capillary (L:15 m; ID:0,18 mm)
Solvent A
Water (HPLC-Grade)
11
• Additional Information
Customer:
Customer's Name
Operator:
Operator's Name
Operator's Jobtitle
Execution Date:
May-30-01
Next Qualification:
Nov-01
• Limits, Values and Test Results
Wavelength Accuracy (RF)
______________________________
Reviewer's signature // Date
Chromeleon (c) DIONEX 2008
Version 6.80 SR5 Build 2413 (137116)
Limit
Obs. Deviation
Result
+/- 10 nm
0 nm
Test passed
______________________________
Operator's signature // Date
PQ_OQ_Report_6_8 / RF_DET_WAVE
Printed: 27-10-2008 2:53 PM
Seq: DQ_PQ_OQ_FOQ\PQ_OQ\HPLC\DEMO_for_Manual\HPLC_OQ_DEMO_RUNS\OQ_FLUORESCENCE
Page 2 of 2
Runtime: 30-May-2001 00:54:06
Smp: Fluorescence_Detector_Wavelength
• Data for the Wavelength Accuracy Test (Fluorescence Detector)
Obs. Wavelength
397 nm
Exp. Wavelength
Deviation
Limit
397 nm
0 nm
+/- 10 nm
• Chromatogram of Wavelength Accuracy Test (Fluorescence Detector)
The emission wavelength is changed from 380 nm to 410 nm in steps of 1 nm per 15 sec.
The maximum of the emission spectrum is determinated as maximum of the signal
of this chromatogram.
40.0
OQ_FLUORESCENCE #2
mV
Emission
EM:380 nm
30.0
20.0
10.0
-5.0
0.00
min
1.25
2.50
______________________________
Reviewer's signature // Date
Chromeleon (c) DIONEX 2008
Version 6.80 SR5 Build 2413 (137116)
3.75
5.00
6.25
8.00
______________________________
Operator's signature // Date
PQ_OQ_Report_6_8 / RF_DET_WAVE
Printed: 27-10-2008 2:53 PM
Seq: DQ_PQ_OQ_FOQ\PQ_OQ\HPLC\DEMO_for_Manual\HPLC_OQ_DEMO_RUNS\OQ_STD_GRAD
Page 1 of 3
Runtime: 14-Apr-2004 10:10:40
Smp: STD Gradient_1
Operational Qualification
• Step Accuracy of the STD Gradient_1
• Instruments and Fluidics
Instrument Name
Model
Supplier's Name
Serial Number
Pump
P680 LPG
DIONEX
1920401
UV Detector
UVD 340U
DIONEX
1830402
Chromeleon Datasystem
V. 6.60 Build 1428
DIONEX
11
Accessories
Name
Back Pressure Device
Capillary (L:15 m; ID:0,18 mm)
Solvent A
Water (HPLC-Grade)
Solvent B for Gradient
Water + 0.1 % Acetone
• Additional Information
Customer:
Customer's Name
Operator:
Operator's Name
Operator's Jobtitle
Execution Date:
Next Qualification:
Apr-14-04
Oct-04
• Limits and Test Results
Limit
Observed max. Deviation
Step Accuracy
1.000 %
0.275 %
Test passed
Step Ripple
0.500 %
0.025 %
Test passed
______________________________
Reviewer's signature // Date
Chromeleon (c) DIONEX 2008
Version 6.80 SR5 Build 2413 (137116)
Result of all Steps
______________________________
Operator's signature // Date
PQ_OQ_Report_6_8 / PUMP_GRADIENT
Printed: 27-10-2008 3:15 PM
Seq: DQ_PQ_OQ_FOQ\PQ_OQ\HPLC\DEMO_for_Manual\HPLC_OQ_DEMO_RUNS\OQ_STD_GRAD
Page 2 of 3
Runtime: 14-Apr-2004 10:10:40
Smp: STD Gradient_1
• Chromatogram of STD Gradient_1
250 OQ_STD_GRAD #2
mAU
STD Gradient_1
UV_VIS_1
WVL:265 nm
200
150
100
50
0
-50
0.0
min
2.0
Flow [ml/min]:
4.0
6.0
8.0
10.0
12.0
14.0
16.0
18.0
20.0
22.0
24.0
2.000
______________________________
Reviewer's signature // Date
Chromeleon (c) DIONEX 2008
Version 6.80 SR5 Build 2413 (137116)
______________________________
Operator's signature // Date
PQ_OQ_Report_6_8 / PUMP_GRADIENT
Printed: 27-10-2008 3:15 PM
Seq: DQ_PQ_OQ_FOQ\PQ_OQ\HPLC\DEMO_for_Manual\HPLC_OQ_DEMO_RUNS\OQ_STD_GRAD
Page 3 of 3
Runtime: 14-Apr-2004 10:10:40
Smp: STD Gradient_1
• Data of STD Gradient_1
Observed Value [mAU]
Expected Calculated Abs. Critical
Calculated
Value [%] Value [%] Deviation [%] Deviation [%]
Result
0.00
0.00
0.000
1.000
0.000
ok
2.40
1.00
1.118
1.000
0.118
ok
106.65
50.00
49.725
1.000
-0.275
ok
212.37
99.00
99.017
1.000
0.017
ok
214.48
100.00
100.000
1.000
0.000
ok
• Ripple of STD Gradient_1
Step [%]
Ripple
[mAU]
Calculated
Ripple [%]
Critical
Ripple [%]
Result
1.00
0.007
0.003
0.500
ok
50.00
0.018
0.008
0.500
ok
99.00
0.053
0.025
0.500
ok
______________________________
Reviewer's signature // Date
Chromeleon (c) DIONEX 2008
Version 6.80 SR5 Build 2413 (137116)
______________________________
Operator's signature // Date
PQ_OQ_Report_6_8 / PUMP_GRADIENT
Printed: 27-10-2008 3:15 PM
Seq: DQ_PQ_OQ_FOQ\PQ_OQ\HPLC\DEMO_for_Manual\HPLC_OQ_DEMO_RUNS\OQ_STD_GRAD
Page 1 of 3
Runtime: 14-Apr-2004 10:36:48
Smp: STD Gradient_2
Operational Qualification
• Step Accuracy of the STD Gradient_2
• Instruments and Fluidics
Instrument Name
Model
Supplier's Name
Serial Number
Pump
P680 LPG
DIONEX
1920401
UV Detector
UVD 340U
DIONEX
1830402
Chromeleon Datasystem
V. 6.60 Build 1428
DIONEX
11
Accessories
Name
Back Pressure Device
Capillary (L:15 m; ID:0,18 mm)
Solvent A
Water (HPLC-Grade)
Solvent B for Gradient
Water + 0.1 % Acetone
• Additional Information
Customer:
Customer's Name
Operator:
Operator's Name
Operator's Jobtitle
Execution Date:
Next Qualification:
Apr-14-04
Oct-04
• Limits and Test Results
Limit
Observed max. Deviation
Step Accuracy
1.000 %
0.212 %
Test passed
Step Ripple
0.500 %
0.017 %
Test passed
______________________________
Reviewer's signature // Date
Chromeleon (c) DIONEX 2008
Version 6.80 SR5 Build 2413 (137116)
Result of all Steps
______________________________
Operator's signature // Date
PQ_OQ_Report_6_8 / PUMP_GRADIENT
Printed: 27-10-2008 3:15 PM
Seq: DQ_PQ_OQ_FOQ\PQ_OQ\HPLC\DEMO_for_Manual\HPLC_OQ_DEMO_RUNS\OQ_STD_GRAD
Page 2 of 3
Runtime: 14-Apr-2004 10:36:48
Smp: STD Gradient_2
• Chromatogram of STD Gradient_2
250 OQ_STD_GRAD #3
mAU
STD Gradient_2
UV_VIS_1
WVL:265 nm
200
150
100
50
0
-50
0.0
min
2.0
Flow [ml/min]:
4.0
6.0
8.0
10.0
12.0
14.0
16.0
18.0
20.0
22.0
24.0
2.000
______________________________
Reviewer's signature // Date
Chromeleon (c) DIONEX 2008
Version 6.80 SR5 Build 2413 (137116)
______________________________
Operator's signature // Date
PQ_OQ_Report_6_8 / PUMP_GRADIENT
Printed: 27-10-2008 3:15 PM
Seq: DQ_PQ_OQ_FOQ\PQ_OQ\HPLC\DEMO_for_Manual\HPLC_OQ_DEMO_RUNS\OQ_STD_GRAD
Page 3 of 3
Runtime: 14-Apr-2004 10:36:48
Smp: STD Gradient_2
• Data of STD Gradient_2
Observed Value [mAU]
Expected Calculated Abs. Critical
Calculated
Value [%] Value [%] Deviation [%] Deviation [%]
Result
0.00
0.00
0.000
1.000
0.000
ok
2.47
1.00
1.150
1.000
0.150
ok
106.78
50.00
49.788
1.000
-0.212
ok
212.30
99.00
98.991
1.000
-0.009
ok
214.46
100.00
100.000
1.000
0.000
ok
• Ripple of STD Gradient_2
Step [%]
Ripple
[mAU]
Calculated
Ripple [%]
Critical
Ripple [%]
Result
1.00
0.033
0.015
0.500
ok
50.00
0.036
0.017
0.500
ok
99.00
0.012
0.006
0.500
ok
______________________________
Reviewer's signature // Date
Chromeleon (c) DIONEX 2008
Version 6.80 SR5 Build 2413 (137116)
______________________________
Operator's signature // Date
PQ_OQ_Report_6_8 / PUMP_GRADIENT
Printed: 27-10-2008 3:15 PM
Seq: DQ_PQ_OQ_FOQ\PQ_OQ\HPLC\DEMO_for_Manual\HPLC_OQ_DEMO_RUNS\OQ_STD_GRAD
Page 1 of 3
Runtime: 14-Apr-2004 11:02:57
Smp: STD Gradient_3
Operational Qualification
• Step Accuracy of the STD Gradient_3
• Instruments and Fluidics
Instrument Name
Model
Supplier's Name
Serial Number
Pump
P680 LPG
DIONEX
1920401
UV Detector
UVD 340U
DIONEX
1830402
Chromeleon Datasystem
V. 6.60 Build 1428
DIONEX
11
Accessories
Name
Back Pressure Device
Capillary (L:15 m; ID:0,18 mm)
Solvent A
Water (HPLC-Grade)
Solvent B for Gradient
Water + 0.1 % Acetone
• Additional Information
Customer:
Customer's Name
Operator:
Operator's Name
Operator's Jobtitle
Execution Date:
Next Qualification:
Apr-14-04
Oct-04
• Limits and Test Results
Limit
Observed max. Deviation
Step Accuracy
1.000 %
0.174 %
Test passed
Step Ripple
0.500 %
0.011 %
Test passed
______________________________
Reviewer's signature // Date
Chromeleon (c) DIONEX 2008
Version 6.80 SR5 Build 2413 (137116)
Result of all Steps
______________________________
Operator's signature // Date
PQ_OQ_Report_6_8 / PUMP_GRADIENT
Printed: 27-10-2008 3:15 PM
Seq: DQ_PQ_OQ_FOQ\PQ_OQ\HPLC\DEMO_for_Manual\HPLC_OQ_DEMO_RUNS\OQ_STD_GRAD
Page 2 of 3
Runtime: 14-Apr-2004 11:02:57
Smp: STD Gradient_3
• Chromatogram of STD Gradient_3
250 OQ_STD_GRAD #4
mAU
STD Gradient_3
UV_VIS_1
WVL:265 nm
200
150
100
50
0
-50
0.0
min
2.0
Flow [ml/min]:
4.0
6.0
8.0
10.0
12.0
14.0
16.0
18.0
20.0
22.0
24.0
2.000
______________________________
Reviewer's signature // Date
Chromeleon (c) DIONEX 2008
Version 6.80 SR5 Build 2413 (137116)
______________________________
Operator's signature // Date
PQ_OQ_Report_6_8 / PUMP_GRADIENT
Printed: 27-10-2008 3:15 PM
Seq: DQ_PQ_OQ_FOQ\PQ_OQ\HPLC\DEMO_for_Manual\HPLC_OQ_DEMO_RUNS\OQ_STD_GRAD
Page 3 of 3
Runtime: 14-Apr-2004 11:02:57
Smp: STD Gradient_3
• Data of STD Gradient_3
Observed Value [mAU]
Expected Calculated Abs. Critical
Calculated
Value [%] Value [%] Deviation [%] Deviation [%]
Result
0.00
0.00
0.000
1.000
0.000
ok
2.50
1.00
1.163
1.000
0.163
ok
106.87
50.00
49.826
1.000
-0.174
ok
212.29
99.00
98.976
1.000
-0.024
ok
214.48
100.00
100.000
1.000
0.000
ok
• Ripple of STD Gradient_3
Step [%]
Ripple
[mAU]
Calculated
Ripple [%]
Critical
Ripple [%]
Result
1.00
0.012
0.006
0.500
ok
50.00
0.023
0.011
0.500
ok
99.00
0.017
0.008
0.500
ok
______________________________
Reviewer's signature // Date
Chromeleon (c) DIONEX 2008
Version 6.80 SR5 Build 2413 (137116)
______________________________
Operator's signature // Date
PQ_OQ_Report_6_8 / PUMP_GRADIENT
Printed: 27-10-2008 3:15 PM
Seq: DQ_PQ_OQ_FOQ\PQ_OQ\HPLC\DEMO_for_Manual\HPLC_OQ_DEMO_RUNS\OQ_STD_GRAD
Page 1 of 2
Runtime: 14-Apr-2004 11:02:57
Smp: STD Gradient_3
Operational Qualification
• Reproducibility of the Stand. Gradient
• Instruments and Fluidics
Instrument Name
Model
Supplier's Name
Serial Number
Pump
P680 LPG
DIONEX
1920401
UV Detector
UVD 340U
DIONEX
1830402
Chromeleon Datasystem
V. 6.60 Build 1428
DIONEX
11
Accessories
Name
Back Pressure Device
Capillary (L:15 m; ID:0,18 mm)
Solvent A
Water (HPLC-Grade)
Solvent B for Gradient
Water + 0.1 % Acetone
• Additional Information
Customer:
Customer's Name
Operator:
Operator's Name
Operator's Jobtitle
Execution Date:
Next Qualification:
Apr-14-04
Oct-04
• Limits and Test Results
Limit
Gradient Presicision
0.500 %
______________________________
Reviewer's signature // Date
Chromeleon (c) DIONEX 2008
Version 6.80 SR5 Build 2413 (137116)
Observed max. STD Result of all Steps
0.051 %
Test passed
______________________________
Operator's signature // Date
PQ_OQ_Report_6_8 / PUMP_GRADIENT_REPRO
Printed: 27-10-2008 3:15 PM
Seq: DQ_PQ_OQ_FOQ\PQ_OQ\HPLC\DEMO_for_Manual\HPLC_OQ_DEMO_RUNS\OQ_STD_GRAD
Page 2 of 2
Runtime: 14-Apr-2004 11:02:57
Smp: STD Gradient_3
• Overlay of three Gradients
1 - OQ_STD_GRAD #4
2 - OQ_STD_GRAD #2
250 3 - OQ_STD_GRAD #3
mAU
STD Gradient_3
STD Gradient_1
STD Gradient_2
UV_VIS_1
UV_VIS_1
UV_VIS_1
WVL:265 nm
200
150
100
50
3
2
0 1
-50
0.0
min
2.0
4.0
6.0
8.0
10.0
12.0
14.0
16.0
18.0
20.0
22.0
24.0
• Data of three Gradients
Expected Value [%]
Calculated
Value
Gradient_1
[%]
Calculated
Value
Gradient_2
[%]
0.00
0.00
0.00
0.00
0.50
0.000
ok
1.00
1.12
1.15
1.16
0.50
0.023
ok
50.00
49.72
49.79
49.83
0.50
0.051
ok
99.00
99.02
98.99
98.98
0.50
0.020
ok
100.00
100.00
100.00
100.00
0.50
0.000
ok
______________________________
Reviewer's signature // Date
Chromeleon (c) DIONEX 2008
Version 6.80 SR5 Build 2413 (137116)
Calculated
Value
Critical Calculated
Result
Gradient_3 STD [%] STD [%]
[%]
______________________________
Operator's signature // Date
PQ_OQ_Report_6_8 / PUMP_GRADIENT_REPRO
Printed: 27-10-2008 3:15 PM
Seq: DQ_PQ_OQ_FOQ\PQ_OQ\HPLC\DEMO_for_Manual\HPLC_OQ_DEMO_RUNS\OQ_COLUMN_OVEN
Page 1 of 2
Runtime: 14-Apr-2004 11:29:06
Smp: Oven Temperature
Operational Qualification
• Temperature Accuracy of the Column Oven
• Instruments and Fluidics
Instrument Name
Model
Supplier's Name
Serial Number
Pump
P680 LPG
DIONEX
1920401
Autosampler
ASI-100
DIONEX
1860410
Column Oven
TCC-100
DIONEX
1850409
UV Detector
UVD 340U
DIONEX
1830402
Chromeleon Datasystem
V. 6.60 Build 1428
DIONEX
11
Accessories
Thermometer
SN: 43077
Temperature Sensor
SN: 111988
• Additional Information
Customer:
Customer's Name
Operator:
Operator's Name
Operator's Jobtitle
Execution Date:
Apr-14-04
Next Qualification:
Oct-04
• Limits, Values and Test Results
Limit
Temperature of Column
Oven
+/- 1.0 °C
______________________________
Reviewer's signature // Date
Chromeleon (c) DIONEX 2008
Version 6.80 SR5 Build 2413 (137116)
Obs. max. Deviation
0.4 °C
Result
Test passed
______________________________
Operator's signature // Date
PQ_OQ_Report_6_8 / COLUMN OVEN
Printed: 27-10-2008 2:51 PM
Seq: DQ_PQ_OQ_FOQ\PQ_OQ\HPLC\DEMO_for_Manual\HPLC_OQ_DEMO_RUNS\OQ_COLUMN_OVEN
Page 2 of 2
Runtime: 14-Apr-2004 11:29:06
Smp: Oven Temperature
• Data for Temperature Accuracy
Setpoint
Measured
Temperature
Temperature
[°C]
[°C]
Deviation
Result
[°C]
80
80.4
0.4
ok
60
60.2
0.2
ok
30
30.3
0.3
ok
10
10.1
0.1
ok
0.4
ok
Obs. max. Deviation
Limit:
+/- 1.0
If the setpoint temperature of 10°C cannot be reached, the reason can be that the ambient
temperature is too high. Nevertheless, the test is passed, if the measured temperature
is at least 15°C below ambient.
______________________________
Reviewer's signature // Date
Chromeleon (c) DIONEX 2008
Version 6.80 SR5 Build 2413 (137116)
______________________________
Operator's signature // Date
PQ_OQ_Report_6_8 / COLUMN OVEN
Printed: 27-10-2008 2:51 PM