1
IBM ~ pSeries
High Performance Switch
Tuning and Debug Guide
Version 1.0
April 2005
IBM Systems and Technology Group
Cluster Performance Department
Poughkeepsie, NY
Contents
1.0 Introduction..................................................................................................... 4
2.0 Tunables and settings for switch software...................................................... 5
2.1 MPI tunables for Parallel Environment........................................................ 5
2.1.1 MP_EAGER_LIMIT .............................................................................. 5
2.1.2 MP_POLLING_INTERVAL and MP_RETRANSMIT_INTERVAL ......... 5
2.1.3 MP_REXMIT_BUF_SIZE and MP_REXMIT_BUF_CNT ...................... 6
2.1.4 MEMORY_AFFINITY ........................................................................... 6
2.1.5 MP_TASK_AFFINITY........................................................................... 7
2.1.6 MP_CSS_INTERRUPT ........................................................................ 7
2.2 MPI-IO ........................................................................................................ 7
2.3 chgsni command......................................................................................... 8
3.0 Tunables and settings for AIX 5L ................................................................... 9
3.1 IP tunables.................................................................................................. 9
3.2 File cache ................................................................................................... 9
3.3 svmon and vmstat commands .................................................................. 10
3.3.1 svmon................................................................................................. 11
3.3.2 vmstat................................................................................................. 12
3.4 Large page sizing...................................................................................... 13
3.5 Large pages and IP support...................................................................... 15
3.6 Memory affinity for a single LPAR............................................................. 15
3.7 Amount of memory available .................................................................... 15
3.8 Debug settings in the AIX 5L kernel.......................................................... 16
4.0 Daemon configuration .................................................................................. 16
4.1 RSCT daemons ........................................................................................ 16
4.2 LoadLeveler daemons .............................................................................. 17
4.2.1 Reducing the number of daemons running ........................................ 17
4.2.2 Reducing daemon communication and placing daemons on a switch 17
4.2.3 Reducing logging................................................................................ 17
4.3 Settings for AIX 5L threads ....................................................................... 18
4.4 AIX 5L mail, spool, and sync daemons..................................................... 18
4.5 Placement of POE managers and LoadLeveler scheduler ....................... 18
5.0 Debug settings and data collection tools ...................................................... 19
5.1 lsattr tuning ............................................................................................... 19
5.1.1 driver_debug setting........................................................................... 19
5.1.2 ip_trc_lvl setting.................................................................................. 19
5.2 CPUs and frequency................................................................................. 19
5.3 Affinity LPARs........................................................................................... 20
5.4 Small Real Mode Address Region on HMC GUI....................................... 20
5.5 Deconfigured L3 cache ............................................................................. 20
5.6 Service focal point..................................................................................... 20
5.7 errpt command.......................................................................................... 21
5.8 HMC error logging..................................................................................... 21
5.9 Multiple versions of MPI libraries .............................................................. 21
pshpstuningguidewp040105.doc
Page 2
5.10 MP_PRINTENV ...................................................................................... 22
5.11 MP_STATISTICS.................................................................................... 23
5.12 Dropped switch packets.......................................................................... 24
5.12.1 Packets dropped because of a software problem on an endpoint .... 24
5.12.2 Packets dropped in the ML0 interface .............................................. 26
5.12.3 Packets dropped because of a hardware problem on an endpoint... 27
5.12.4 Packets dropped in the switch hardware .......................................... 28
5.13 MP_INFOLEVEL..................................................................................... 28
5.14 LAPI_DEBUG_COMM_TIMEOUT .......................................................... 29
5.15 LAPI_DEBUG_PERF.............................................................................. 29
5.16 AIX 5L trace for daemon activity ............................................................. 30
6.0 Conclusions and summary ........................................................................... 30
7.0 Additional reading......................................................................................... 30
7.1 HPS documentation .................................................................................. 30
7.2 MPI documentation ................................................................................... 31
7.3 AIX 5L performance guides ...................................................................... 31
7.4 IBM Redbooks .......................................................................................... 31
7.5 POWER4 .................................................................................................. 31
pshpstuningguidewp040105.doc
Page 3
1.0 Introduction
~
®
This paper is intended to help you tune and debug the performance of the IBM
pSeries® High Performance Switch (HPS) on IBM Cluster 1600 systems. It is not intended to be
a comprehensive guide, but rather to help in initial tuning and debugging of performance issues.
Additional detailed information on the materials presented here can be found in sources noted in
the text and listed in section 7.0.
This paper assumes an understanding of MPI and AIX 5L™, and that you are familiar with and
have access to the Hardware Management Console (HMC) for pSeries systems.
This paper is divided into four sections. The first deals with HPS-specific tunables for tuning the
HPS subsystems. The second section deals with tuning AIX 5L and its components for optimal
performance of the HPS system. The third section deals with tuning various system daemons in
both AIX 5L and cluster environments to prevent impact on high-performance parallel
applications. The final section deals with debugging performance problems on the HPS.
Before debugging a performance problem in the HPS, review the HPS and AIX 5L tuning as well
as daemon controls. Many problems are specifically related to these subsystems. If a
performance problem persists after you follow the instructions in the debugging section, call IBM
service for additional tools and help.
We want to thank the following people in the IBM Poughkeepsie development organization for
their help in writing this paper:
Robert Blackmore
George Chochia
Frank Johnston
Bernard King-Smith
John Lewars
Steve Martin
Fernando Pizzano
Bill Tuel
Richard Treumann
pshpstuningguidewp040105.doc
Page 4
2.0 Tunables and settings for switch software
To optimize the HPS, you can set shell variables for Parallel Environment MPI-based workloads
and for IP-based workloads. This section reviews the shell variables that are most often used for
performance tuning. For a complete list of tunables and their usage, see the documentation listed
in section 7 of this paper.
2.1 MPI tunables for Parallel Environment
The following sections list the most common MPI tunables for applications that use the HPS.
Along with each tunable is a description of the variable, what it is used for, and how to set it
appropriately.
2.1.1 MP_EAGER_LIMIT
The MP_EAGER_LIMIT variable tells the MPI transport protocol to use the "eager" mode for
messages less than or equal to the specified size. Under the "eager" mode, the sender sends the
message without knowing if the matching receive has actually been posted by the destination
task. For messages larger than the EAGER_LIMIT, a rendezvous must be used to confirm that
the matching receive has been posted
The sending task does not have to wait for an okay from the receiver before sending the data, so
the effective start-up cost for a small message is lower in “eager” mode. As a result, any
messages that are smaller than the EAGER_LIMIT are typically faster, especially if the
corresponding receive has already been posted. If the receive has not been posted, the transport
incurs an extra copy cost on the target, because data is staged through the early-arrival buffers.
However, the overall time to send a small message might still be less in "eager" mode. Welldesigned MPI applications often try to post each MPI_RECV before the message is expected, but
because tasks of a parallel job are not in lock step, most applications have occasional early
arrivals.
The maximum message size for the “eager” protocol is currently 65536 bytes, although the
default value is lower. An application for which a significant fraction of the MPI messages are
less than 65536 bytes might see a performance benefit from setting MP_EAGER_LIMIT. If
MP_EAGER_LIMIT is increased above the default value, it might also be necessary to increase
MP_BUFFER_MEM, which determines the amount of memory available for early arrival
buffers. Higher “eager” limits or larger task counts either demand more buffer memory or reduce
the number of unlimited “eager” messages that can be outstanding, and therefore can also impact
performance.
2.1.2 MP_POLLING_INTERVAL and
MP_RETRANSMIT_INTERVAL
The MP_POLLING_INTERVAL and MP_RETRANSMIT_INTERVAL variables control how
often the protocol code checks whether data that was previously sent is assumed to be lost and
needs to be retransmitted. When the values are larger, this checking is done less often. There are
two different environment variables because the check can be done by an MPI/LAPI service
pshpstuningguidewp040105.doc
Page 5
thread, and from within the MPI/LAPI polling code that is invoked when the application makes
blocking MPI calls.
MP_POLLING_INTERVAL specifies the number of microseconds an MPI/LAPI service thread
should wait (sleep) before it checks whether any data previously sent by the MPI task needs to be
retransmitted. MP_RETRANSMIT_INTERVAL specifies the number of passes through the
internal MPI/LAPI polling routine between calls before checking whether any data needs to be
resent. When the switch fabric, adapters, and nodes are operating properly, data that is sent
arrives intact, and the receiver sends the source task an acknowledgment for the data. If the
sending task does not receive such an acknowledgment within a reasonable amount of time
(determined by the variable MP_RETRANSMIT_INTERVAL), it assumes the data has been lost
and tries to resend it.
Sometimes when many MPI tasks share the switch adapters, switch fabric, or both, the time it
takes to send a message and receive an acknowledgment is longer than the library expects. In this
case, data might be retransmitted unnecessarily. Increasing the values of
MP_POLLING_INTERVAL and MP_RETRANSMIT_INTERVAL decrease the likelihood of
unnecessary retransmission but increase the time a job is delayed when a packet is actually
dropped.
2.1.3 MP_REXMIT_BUF_SIZE and MP_REXMIT_BUF_CNT
You can improve application performance by allowing a task that is sending a message shorter
than the “eager” limit to return the send buffer to the application before the message has reached
its destination, rather than forcing the sending task to wait until the data has actually reached the
receiving task and the acknowledgement has been returned. To allow immediate return of the
send buffer to the application, LAPI attempts to make a copy of the data in case it must be
retransmitted later (unlikely but not impossible). LAPI copies the data into a retransmit buffer
(REXMIT_BUF) if one is available. The MP_REXMIT_BUF_SIZE and
MP_REXMIT_BUF_CNT environment variables control the size and number of the retransmit
buffers allocated by each task.
2.1.4 MEMORY_AFFINITY
The POWER4™ and POWER4+™ models of the pSeries 690 have more than one multi-chip
module (MCM). An MCM contains eight CPUs and frequently has two local memory cards. On
these systems, application performance can improve when each CPU and the memory it accesses
are on the same MCM.
Setting the AIX MEMORY_AFFINITY environment variable to MCM tells the operating system
to attempt to allocate the memory from within the MCM containing the processor that made the
request. If memory is available on the MCM containing the CPU, the request is usually granted.
If memory is not available on the local MCM, but is available on a remote MCM, the memory is
taken from the remote MCM. (Lack of local memory does not cause the job to fail.)
pshpstuningguidewp040105.doc
Page 6
2.1.5 MP_TASK_AFFINITY
Setting MP_TASK_AFFINITY to SNI tells parallel operating environment (POE) to bind each
task to the MCM containing the HPS adapter it will use, so that the adapter, CPU, and memory
used by any task are all local to the same MCM. To prevent multiple tasks from sharing the same
CPU, do not set MP_TASK_AFFINITY to SNI if more than four tasks share any HPS adapter.
If more than four tasks share any HPS adapter, set MP_TASK_AFFINITY to MCM, which allows
each MPI task to use CPUs and memory from the same MCM, even if the adapter is on a remote
MCM. If MP_TASK_AFFINITY is set to either MCM or SNI, MEMORY_AFFINITY should be
set to MCM.
2.1.6 MP_CSS_INTERRUPT
The MP_CSS_INTERRUPT variable allows you to control interrupts triggered by packet arrivals.
Setting this variable to no implies that the application should run in polling mode. This setting is
appropriate for applications that have mostly synchronous communication. Even applications that
make heavy use of MPI_ISEND/MPI_IRECV should be considered synchronous unless there is
significant computation between the ISEND/IRECV postings and the MPI_WAITALL. The
default value for MP_CSS_INTERRUPT is no.
For applications with an asynchronous communication pattern (one that uses non-blocking MPI
calls), it might be more appropriate to set this variable to yes. Setting MP_CSS_INTERRUPT to
yes can cause your application to be interrupted when new packets arrive, which could be
helpful if a receiving MPI task is likely to be in the middle of a long numerical computation at the
time when data from a remote-blocking send arrives.
2.2 MPI-IO
The most effective use of MPI-IO is when an application takes advantage of file views and
collective operations to read or write a file in which data for each task is dispersed across the file.
To simplify we focus on read, but write is similar.
An example is reading a matrix with application-wide scope from a single file, with each task
needing a different fragment of that matrix. To bring in the fragment needed for each task,
several disjoint chunks must be read. If every task were to do POSIX read of each chunk, the
GPFS file system handle it correctly. However, because each read() is independent, there is little
chance to apply an effective strategy.
When the same set of reads is done with collective MPI-IO, every task specifies all the chunks it
needs to one MPI-IO call. Because the call is collective, the requirements of all the tasks are
known at one time. As a result, MPI can use a broad strategy for doing the I/O.
When MPI-IO is used but each call to read or write a file is local or specifies only a single chunk
of data, there is much less chance for MPI-IO to do anything more than a simple POSIX read()
would do. Also, when the file is organized by task rather than globally, there is less MPI-IO can
do to help. This is the case when each task's fragment of the matrix is stored contiguously in the
file rather than having the matrix organized as a whole.
pshpstuningguidewp040105.doc
Page 7
Sometimes MPI-IO is used in an application as if it were basic POSIX read/write, either because
there is no need for more complex read/write patterns or because the application was previously
hand-optimized to use POSIX read/write. In such cases, it is often better to use the
IBM_largeblock_io hint on MPI_FILE_OPEN. By default, the PE/MPI implementation of MPIIO tries to take advantage of the information the MPI-IO interface can provide to do file I/O more
efficiently. If the MPI-IO calls do not use MPI_data types and file views or collective I/O, there
might not be enough information to do any optimization. The hint shuts off the attempt to
optimize and makes MPI-IO calls behave much like the POSIX I/O calls that GPFS already
handles well.
2.3 chgsni command
The chgsni command is used to tune the HPS drivers by changing a list of settings. The basic
syntax for chgsni is:
chgsni -l <HPS device name > -a <variable>=<new value>
Multiple variables can be set in a single command.
The key variables to set for TCP/IP are spoolsize and rpoolsize. To change the send IP pools for
HPS, change the spoolsize parameter. To change the receive IP pool, change the rpoolsize
parameter.
The IP buffer pools are allocated in partitions of up to 16MB each. Each increase in the buffer
that crosses a 16 MB boundary allocates an additional partition. If you are running a pSeries 655
system with two HPS links, allocate two partitions (32MB) of buffer space. If you are running a
p690+ system with eight HPS links, set the buffer size to 128MB. If you are running in an LPAR
and have a different number of links, scale the buffer size accordingly.
IP buffer settings are global across all HPS links in an AIX 5L partition. This means you only
need to change the setting on one interface. All other interfaces get the new setting. In other
words, if you run the chgsni command against sn0, the new setting takes effect under sn1, sn2,
and so on, up to the number of links in a node or partition. The following command sets the IP
buffer pools for either a p655 with two HPS links or a p690 LPAR:
chgsni -l sni0 -a spoolsize=33554432 -a rpoolsize=33554432
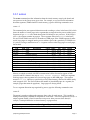
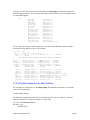
To see the values for the current chgsni settings, use the lsattr command. The following example
shows the settings on the HPS sni0 link.
lsattr -E -l sni0
> lsattr -E -l sni0
base_laddr
0x3fff9c00000
driver_debug
0x0
int_level
1040
ip_kthread
0x1
ip_trc_lvl
0x00001111
num_windows
16
perf_level
0x00000000
rdma_xlat_limit 0x8000000000000000
pshpstuningguidewp040105.doc
base address
Device driver trace level
interrupt level
IP kthread flag
IP trace level
Number of windows
Device driver perf level
RDMA translation limit
False
True
False
True
True
False
True
True
Page 8
rfifosize
rpoolsize
spoolsize
0x1000000
0x02000000
0x02000000
receive fifo size
IP receive pool size
IP send pool size
False
True
True
3.0 Tunables and settings for AIX 5L
Several settings in AIX 5L impact the performance of the HPS. These include the IP and
memory subsystems. The following sections provide a brief overview of the most commonly
used tunables. For more information about these subjects, see the AIX 5L tuning manuals listed
in section 7.0.
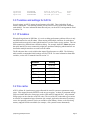
3.1 IP tunables
When defining subnets for HPS links, it is easier to debug performance problems if there is only
one HPS interface for each IP subnet. When running with multiple interfaces for each subnet,
applications do not typically control which interface is used to send or receive packets. This can
make connectivity problems more difficult to debug. For example, the RSCT cthats subsystem
that polls interfaces to assert connectivity might have problems identifying which interfaces are
down when multiple interfaces are on the same IP subnet.
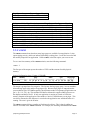
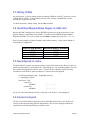
The IP subsystem has several variables that impact IP performance over HPS. The following
table contains recommended initial settings used for TCP/IP. For more information about these
variables, see the AIX 5L manuals listed in section 7.0.
Parameter
sb_max
Setting
1310720
tcp_sendspace
655360
tcp_recvspace
655360
rfc1323
tcp_mssdflt
ipforwarding
1
1448
1
3.2 File cache
AIX 5L defines all virtual memory pages allocated for most file systems as permanent storage
pages. Files mapped from the GPFS file cache are an exception. A subset of permanent storage
pages are further defined as client pages (such as NFS and JFS2 mapped files). All permanent
storage pages can be referred to as the file cache. The size of the file cache tends to grow unless
an increase in computational page allocations (for example, application data stored in memory)
causes the operating system to run low on available virtual memory frames, or the files being
memory mapped become unavailable (for example, a file system becomes unmounted).
pshpstuningguidewp040105.doc
Page 9
The overhead in maintaining the file cache can impact the performance of large parallel
applications. Much of the overhead is associated with the sync() system call (by default, run
every minute from the syncd daemon). The sync() system call scans all of the pages in the file
cache to determine if any pages have been modified since the last sync(), and therefore need to be
written to disk. This type of delay affects larger parallel applications more severely, and those
with frequent synchronizing collective calls (such as MPI_ALLTOALL or MPI_BARRIER) are
affected the most. A synchronizing operation like MPI_ALLTOALL can be completed only after
the slowest task involved has reached it. Unless an effort is made to synchronize the sync
daemons across a cluster, the sync() system call runs at different times across all of the LPARs.
Unless the time between synchronizing operations for the application is large compared to the
time required for a sync(), the random delays from sync() operations on many LPARs can slow
the entire application. To address this problem, tune the file cache to reduce the amount of work
each sync() must do..
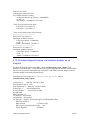
To determine if the system is impacted by an increasing file cache, run the vmstat -v command
and check the numperm and numclient percentages. Here is an example:
vmstat -v
[. . .]
0.6
10737
0.0
0
0.0
numperm percentage
file pages
compressed percentage
compressed pages
numclient percentage
[. . .]
If the system tends to move towards a high numperm level, here are a couple of approaches to
address performance concerns:
•
•
Use vmo tunables to tune page replacement. By decreasing the maxperm percentage
and maxclient percentage, you can try to force page replacement to steal permanent
and client pages before computational pages. Read the vmo man page before changing
these tunables, and test any vmo changes incrementally. Always consult IBM service
before changing the vmo tunables strict_maxperm and strict_maxclient.
If most of the permanent file pages allocated are listed as being client pages, these might
be NFS pages. If NFS accesses are driving the file cache up, consider periodically
unmounting the NFS file systems (for example, use automount to mount file systems as
they are required).
3.3 svmon and vmstat commands
The svmon and vmstat commands are very helpful in analyzing problems with virtual memory.
To find an optimal problem size, it helps to understand how much memory is available for an
HPS application before paging starts. In addition, if an application uses large pages, it must know
how much of that resource is available. Because processes compete for the memory, and memory
allocation changes over time, you need to understand the process requirements. The following
sections introduce how to use the svmon and vmstat commands for debugging. For more
information, see the AIX 5L performance and tuning guide and the related man pages.
pshpstuningguidewp040105.doc
Page 10
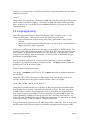
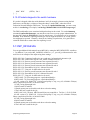
3.3.1 svmon
The svmon command provides information about the virtual memory usage by the kernel and
user processes in the system at any given time. For example, to see system-wide information
about the segments (256MB chunk of virtual memory), type the following command as root:
svmon -S
The command prints out segment information sorted according to values in the Inuse field, which
shows the number of virtual pages in the segment that are mapped into the process address space.
Segments of type work with a blank description field belong to user processes. If the LPage is
set to Y, the segment contains large pages. These segments always have 65536 in the Inuse,
Pin, and Virtual fields because this is the number of 4KB pages in the 256MB segment. In other
words, large pages are mapped into the process address space with a granularity of 256MB even
if a process is using a small fraction of it. A segment can have either large pages or small pages,
but not both.
Vsid
101810
161836
1e09de
9e0
190899
20002
0
70b07
c0b0c
1b00bb
a09aa
Esid
-
Type
Description
work
work
work kernel heap
work kernel heap
work mbuf pool
work page table area
work kernel segment
work other kernel segments
work other kernel segments
work vmm software hat
work loader segment
LPage
Y
Y
Y
Y
-
Inuse
65536
65536
30392
26628
15793
7858
6394
4096
4096
4096
3074
Pin Pgsp Virtual
65536
0
65536
65536
0
65536
92
0
30392
20173
0
26628
15793
0
15793
168 7690
7858
3327 953
6394
4096
0
4096
4096
0
4096
4096
0
4096
0
0
3074
Memory overhead associated with HPS communication buffers allocated in support of MPI
processes and IP is shown in the map as other kernel segments. Unlike user segments
with large pages, these segments have just one large page or 4096 4KB pages. The segment
named mbuf pool indicates a system-wide pool of pinned memory allocated for mbufs mostly
used in support of IP. The Pin field shows the number of pinned 4KB pages in a segment (for
example, pages that cannot be paged out). Large pages are always pinned.
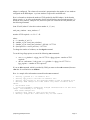
To see a segment allocation map organized by process, type the following command as root:
svmon -P
The output is sorted according to the aggregate Inuse value for each process. This is useful in
finding virtual memory demands for all processes on the node. The virtual segment ID (Vsid) is a
unique segment ID that is listed in more than one process when processes share data (for
example, if multiple MPI tasks use shared memory or program text).
Pid Command
381118 sppm
Inuse
Pin Pgsp Virtual 64-bit Mthrd LPage
448221 3687 2675 449797 Y
Y
N
pshpstuningguidewp040105.doc
Page 11
PageSize
4KB
16MB
Vsid
1f187f
218a2
131893
0
1118b1
d09ad
1611b6
31823
1a187a
c17ec
b11ab
Inuse
448221
0
Esid
11
70000000
17
0
8001000a
90000000
90020014
10
ffffffff
f00000002
9fffffff
Pin
3687
0
Pgsp Virtual
2675 449797
0
0
Type Description
LPage
work text data BSS heap
work default shmat/mmap
work text data BSS heap
work kernel segment
work private load
work loader segment
work shared library text
clnt text data BSS heap
work application stack
work process private
pers shared library text,
-
Inuse Pin Pgsp
56789
0
0
33680
0
0
21840 324
0
4902 3327 2563
1405
0
0
1039
0
42
169
0
65
145
0
50
0
0
31 22
0
10
0
-
Virtual
56789
33680
21840
6419
1405
1226
194
50
31
-
3.3.2 vmstat
The vmstat command can show how many large pages are available for an application. It also
reports paging activity, which can indicate if thrashing is taking place. It can also be used to find
the memory footprint of an application. Unlike svmon, it does not require you to run as root.
To see a one-line summary of the vmstat statistics, enter the following command:
vmstat -l
The first part of the output reports the number of CPUs and the amount of usable physical
memory.
System Configuration: lcpu=32 mem=157696MB
kthr
memory
page
faults
cpu
large-page
----- --------------------- ---------------------------- ------------------ ------------------ -----------r b avm
fre
re pi po fr sr cy in sy cs us sy id wa alp flp
3 1 35953577 5188383 0 0 0 0 0 0 3334 2080 176 1 0 99 0 213 7787
The output is grouped into five categories. The last one, the large-page group, has two members:
allocated large pages (alp) and free large pages (flp). Because large pages are mapped into the
process address space in 256MB segments, the maximum number of segments an application can
get is flp * 16 / 256 . alp. This includes HPS buffers allocated in support of MPI processes on
the adapters and buffers for IP. If only one application is running on a node or LPAR, the
memory footprint of the application is the number of Active Virtual Memory (avm) pages. This
can also be measured as the difference in avm before the application was started and when it is
running. The avm is given in 4K units.
The vmstat command allows sampling at fixed intervals of time. This is done by adding an
interval in seconds to the vmstat command. For example, the following command shows vmstat
pshpstuningguidewp040105.doc
Page 12
statistics in 5-second intervals, with the first set of statistics being the statistics since the node or
LPAR was last booted.
vmstat 5
The pi and po of the page group is the number of 4KB pages read from and written to the paging
device between consecutive samplings. If po is high, it could indicate that thrashing is taking
place. In that case, it is a good idea to run the svmon command to see the system-wide virtual
segment allocation.
3.4 Large page sizing
Some HPC applications that use Technical Large Pages (TLPs) can benefit from a 5 - 20%
increase in performance. There are two reasons why TLPs boost performance:
• Because the hardware prefetch streams cross fewer page boundaries, they are more
efficient.
• Because missing the translation lookaside buffer is less likely, there is a better chance of
using a fast path for address translation.
TLPs must be configured by the root user and require a system reboot as described below. The
operating system limits the maximum number of TLP to about 80% of the total physical storage
on the system. The application can choose to use small pages only, large pages only, or both.
Using both small and large pages is also known as an advisory mode recommended for high
performance computing applications.
You can enable the application for TLPs by using the loader flag, by means of the ldedit
command, or by using the environment variable at run time. The ldedit command enables the
application for TLPs in the advisory mode:
ldedit –b lpdata <executable path name>
You can use –b nolpdata to turn TLPs off. The –b lpdata loader flag on the ld command does
the same thing.
Setting the LDR_CNTRL environment variable enables TLPs in the advisory mode for all
processes spawned from a shell process and their children. Here is an example:
export LDR_CNTRL=LARGE_PAGE_DATA=Y
Setting the environment variable has a side effect for MPI jobs spawned by the MPI daemons
from the shell process, because it also enables the daemons for TLPs. This takes away about
512MB of physical memory from an application. TLPs by their nature are pinned in memory
(they cannot be paged out). In addition, TLPs are mapped into the process address space with
segment granularity (256MB) even if the process uses only a few bytes in that segment. As a
result, each of the two MPI daemons gets 256MB of pinned memory. For that reason, you should
avoid using the LDR_CNTRL environment variable with MPI jobs.
Using TLPs boosts the performance of the MPI protocol stack. Some of the TLPs are reserved by
the HPS adapter code at boot time and are not available to an application as long as the HPS
pshpstuningguidewp040105.doc
Page 13
adapter is configured. The volume of reservation is proportional to the number of user windows
configured on the HPS adapter. A private window is required for each MPI task.
Here is a formula to calculate the number of TLPs needed by the HPS adapter. In the formula
below, number_of_sni refers to the number of sniX logical interfaces present in the partition. To
obtain the num_windows, send pool size, and receive pool size values for the AIX partition, run
the following command:
lsattr -El sniX (where X is the device minor number: 0, 1, 2, etc.)
total_num_windows = num_windows + 7
number of TLP required = A + B + C + D
where:
A = 1 + (number_of_sni * 2)
B = (number_of_sni * total_num_windows)
C = (number_of_sni * total_num_windows * 262144) / 16777216
D = (send pool size + receive pool size) / 16777216
To change the number of windows, use the chgsni command.
To set the Large Page option, use one of the following vmo commands:
•
•
vmo -r -o v_pinshm=1 -o lgpg_size=16777216 -o lgpg_regions= <number of TLP
required>
dsh -vn <node name> "echo y|vmo -r -o v_pinshm=1 -o lgpg_size=16777216 -o
lgpg_regions = <number of TLP required>"
If you use dsh command, which is provided by CSM, you must use the echo command, because
vmo asks for verification to run bosboot.
Here is a sample of the information returned from the vmo command.
> Setting v_pinshm to 1 in nextboot file
> Setting lgpg_size to 16777216 in nextboot file
> Setting lgpg_regions to the required number of TLP in nextboot file
> Warning: some changes will take effect only after a bosboot and a
reboot
> Run bosboot now?
> A previous bosdebug command has changed characteristics of this boot
image. Use bosdebug -L to display
what these changes are.
> bosboot: Boot image is 19877 512 byte blocks.
> Warning: changes will take effect only at next reboot
pshpstuningguidewp040105.doc
Page 14
3.5 Large pages and IP support
One of the most important ways to improve IP performance on the HPS is to ensure that large
pages are enabled. Large pages are required to allocate a number of large pages which will used
by the HPS IP driver at boot time.
Each snX needs one large page for the IP FIFO, plus the number of send pools and receive pools
shared among all adapters. Here is the formula for the number of large pages, assuming that the
send pool and receive pool each need two pages.
(N_adapters*(1 + 2send pools + 2receive pools))
To check whether the driver is using large pages, run the following command:
/usr/sbin/ifsn_dump -a | grep use_lg_pg
If large pages are being used, you should see this result:
use_lg_pg 0x00000001
If large pages are not used for the IP pools, the ifsn_dump -r traces (discussed later) report this
with the following messages:
[02] 1099351956s 0831707096ns 0x000c sn_setup_if_env: large page check failed!
lgpg_size=0x1000000, lgpg_cnt=[. . .]
[02] 1099351956s 0831708002ns 0x000d sn_setup_if_env: large page check failed!
num_pages=0x4, lgpg_numfrb=[. . .]
3.6 Memory affinity for a single LPAR
If you are running with one big LPAR containing all processors on a p690 machine, you need to
ensure that memory affinity is set correctly. To do this using vmo, set memory_affinity =
1.
This works with the AIX 5L shell variable MEMORY_AFFINITY and with the MPI variable
MP_TASK_AFFINITY described earlier.
3.7 Amount of memory available
To properly size the number of large pages on a system, or to determine the largest problem size
that an MPI task can run, you need to determine the amount of configured memory in your
LPAR. To do this, run the following command:
lsattr -E -l sys0 -a realmem
To find the actual physical real memory installed on you CEC or LPAR, run the following
command:
lscfg -vp | grep GB
pshpstuningguidewp040105.doc
Page 15
If you have eight cards for p690 (or four cards for p655), this command also indicates whether
you have full memory bandwidth.
3.8 Debug settings in the AIX 5L kernel
The AIX 5L kernel has several debug settings that affect the performance of an application. To
make sure you are running with all the debug settings in the kernel turned off, run the following
command:
bosdebug -L
The output will look something like this:
Memory debugger
Memory sizes
Network memory sizes
Kernel debugger
Real Time Kernel
off
0
0
off
off
Check the output to make sure that all the debug settings are off. To change any of these settings,
run the following command:
bosdebug -o <variable>=off
After you make changes to the kernel settings, run the following command and then reboot:
bosboot -a
4.0 Daemon configuration
Several daemons on AIX 5L and the HPS can impact performance. These daemons run
periodically to monitor the system, but can interfere with performance of parallel applications. If
there are as many MPI tasks as CPUs, then when these demons run, they must temporarily take a
CPU away from a task. This perturbs the performance of the application if one task takes a little
longer to reach a synchronization point in its execution as compared to other tasks. Lowering the
frequency of these daemons can improve performance or repeatability of the performance of a
parallel application.
4.1 RSCT daemons
If you are using RSCT Peer Domain (such as VSD, GPFS, LAPI striping, or fail over), check the
IBM.ConfigRMd daemon and the hats_nim daemon. If you see these daemons taking cycles,
restart the daemons with AIXTHREAD_SCOPE=S.
pshpstuningguidewp040105.doc
Page 16
4.2 LoadLeveler daemons
The LoadLeveler® daemons are needed for MPI applications using HPS. However, you can
lower the impact on a parallel application by changing the default settings for these daemons.
You can lower the impact of the LoadLeveler daemons by:
• Reducing the number of daemons running
• Reducing daemon communication or placing daemons on a switch
• Reducing logging
4.2.1 Reducing the number of daemons running
Stop the keyboard daemon
On LoadL_config:
# Specify whether to start the keyboard daemon
X_RUNS_HERE
= False
Allow only a few public schedd to run for submitting jobs or POE
On LoadL_config:
LOCAL_CONFIG = $(tilde)/LoadL_config.local.$(hostname)
On LoadL_config.local.plainnode:
SCHEDD_RUNS_HERE = False
On LoadL_config.local.scheddnode:
SCHEDD_RUNS_HERE = True
On LoadL_admin for schedd node to make public:
node_name.xxx.xxx.xxx: type = machine
alias = node_name1.xxx.xxx.xxx node_name2.xxx.xxx.xxx
schedd_host=true
4.2.2 Reducing daemon communication and placing
daemons on a switch
On LoadL_config:
# Set longer to reduce daemon messages. This will slow response to failures.
POLLING_FREQUENCY
= 600
POLLS_PER_UPDATE
=1
MACHINE_UPDATE_INTERVAL
= 1200
Use the switch traffic for daemon communication.
4.2.3 Reducing logging
On LoadL_config:
# reduce LoadLeveler activity to minimum. Warning: You will not be notified of failures.
NEGOTIATOR_DEBUG
= -D_ALWAYS
NEGOTIATOR_DEBUG
= -D_ALWAYS
STARTD_DEBUG
= -D_ALWAYS
pshpstuningguidewp040105.doc
Page 17
SCHEDD_DEBUG
= -D_ALWAYS
4.3 Settings for AIX 5L threads
Several variables help you use AIX 5L threads to tune performance. These are the recommended
initial settings for AIX 5L threads when using HPS. Set them in the /etc/environment file.
AIXTHREAD_SCOPE=S
AIXTHREAD_MNRATIO=1:1
AIXTHREAD_COND_DEBUG=OFF
AIXTHREAD_GUARDPAGES=4
AIXTHREAD_MUTEX_DEBUG=OFF
AIXTHREAD_RWLOCK_DEBUG=OFF
To see the current settings on a running system, run the following command:
ps ewaux | grep -v grep | grep -v AIXTHREAD_SCOPE
4.4 AIX 5L mail, spool, and sync daemons
AIX 5L automatically starts daemons for print spooling and mail. Because these are usually not
needed on HPS systems, they can be turned off. To dynamically turn off these daemons on a
running system, use the following commands:
stopsrc -s sendmail
stopsrc -s qdeamon
stopsrc -s writesrv
You can also change the frequency when the syncd daemon for the file system runs.
In the /sbin/rc.boot file, change the number of seconds setting between syncd calls by increasing
the default value of 60 to something higher. Here is an example:
nohup /usr/sbin/syncd 300 > /dev/null 2>&1 &
You also need to change the sync_release_ilock value to 1 by using the following command:
ioo -p -o sync_release_ilock=1
4.5 Placement of POE managers and LoadLeveler scheduler
Select one node to run POE managers for MPI jobs and to run the LoadLeveler scheduler. If
possible, do not use a compute node. If you do use a compute node, make sure that the CPUs on
it do not all try to run an MPI task. Otherwise, tasks assigned to that node will run slightly slower
than tasks on other compute nodes. A single slow task in a parallel job is likely to slow the entire
job.
pshpstuningguidewp040105.doc
Page 18
5.0 Debug settings and data collection tools
Several debug settings and data collection tools can help you debug a performance problem on
systems using HPS. This section contains a subset of the most common setting changes and
tools. If a performance problem persists after you check the debug settings and the data that was
collected, call IBM service for assistance.
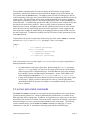
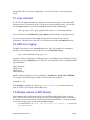
5.1 lsattr tuning
The lsattr command lists two trace and debug-level settings for the HPS links. The following
settings are recommended for peak performance and are the defaults.
Parameter
driver_debug
ip_trc_lvl
Setting
0
0x1111
5.1.1 driver_debug setting
The driver_debug setting is used to increase the amount of information collected by the HPS
device drivers. eave this setting set to default value unless you are directed to change it by IBM
service.
5.1.2 ip_trc_lvl setting
The ip_trc_lvl setting is used to change the amount of data collected by the IP driver. Leave this
setting set to default value unless you are directed to change it by IBM service.
5.2 CPUs and frequency
Performance of parallel application can be impacted by the number of CPUs on an LPAR and by
the speed of the processors. To see how many CPUs are available and the frequency they run at,
run any of the following commands:
lsdev -Cc processor
lsattr -E -l proc#
bindprocessor -q
prtconf
pmcycles –m
If you mix slow CPUs and fast CPUs within a parallel job, the slowest CPU determines the speed
for the entire job.
pshpstuningguidewp040105.doc
Page 19
5.3 Affinity LPARs
On p690 systems, if you are running with more than one LPAR for each CEC, make sure you are
running affinity LPARs. To check affinity between CPU, memory, and HPS links, run the
associativity scripts on the LPARs.
To check the memory affinity setting, run the vmo command.
5.4 Small Real Mode Address Region on HMC GUI
Because the HMC and hypervisor code on POWER4 systems uses up physical memory, some
physical memory is unavailable to the LPARs. To make sure that Small Real Mode Address
Region on the HMC GUI is set on, make sure the ulimit –a output shows you all unlimited.
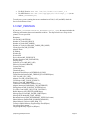
Here are some examples of physical memory and available memory. Actual values depend on
your hardware configuration.
Physical Real Memory
64GB
128GB
256GB
512GB
Maximum Memory Available
61.5GB
120GB
240GB
495GB
5.5 Deconfigured L3 cache
The p690 and p655 systems can continue running if parts of the hardware fail. However, this can
lead to unexpectedly lower performance on a long-running job. One of the degradations observed
has been the deconfiguration of the L3 cache. To check for this condition, run the following
command on each LPAR to make sure that no L3 cache has been deconfigured:
/usr/lib/boot/bin/dmpdt_chrp > /tmp/dmpdt_chrp.out
vi /tmp/dmpdt_chrp.out
Search for L3 and
i-cache-size
08000000
d-cache-size
08000000
[................]
[................]
If you get a value other than the one above, then part or all of your L3 is deconfigured.
5.6 Service focal point
The Service Focal Point (SFP) application runs on the HMC and provides a user interface for
viewing events and performing problem determination. SFP resource managers monitor the
system and record information about serviceable events.
pshpstuningguidewp040105.doc
Page 20
On the HMC GUI, select Service Applications -> Service Focal Point -> Select Serviceable
Events.
5.7 errpt command
On AIX 5L, the errpt command lists a summary of system error messages. Some of the HPS
subsystem errors are collected by errpt. To find out if you have hardware errors, you can either
run the errpt command, or you can run the dsh command from the CSM manager:
dsh errpt | grep “ 0223” | grep sysplanar0 (The value 0223 is the month and day.)
You can also look at /var/adm/sni/sni_errpt_capture on the LPAR that is reporting the error.
If you see any errors from sni in the errpt listing, check the sni logs for more specific
information. The HPS logs are found in a set of directories under the /var/adm/sni directory.
5.8 HMC error logging
The HMC records errors in the /var/hsc/log directory. Here is an example of a command to
check for cyclical redundancy check (CRC) errors in the FNM_Recover.log:
grep -i evtsum FNM_Recov.log | grep -i crc
In general, if Service Focal Point is working properly, you should not need to check the low-level
FNM logs such as the FNM_Recov file. However, for completeness, these are additional FNM
logs on the HMC:
FNM_Comm.log
FNM_Ice.log
FNM_Init.log
FNM_Route.log
Another debug command you can run on the HMC is lsswtopol -n 1 -p $PLANE_NUMBER.
For example, run the following command to check the link status for plane 0:
lsswtopol -n 1 -p0
If the lsswtopol command calls out links as ”service required,” but these links do not
show up in Service Focal Point, contact IBM service.
5.9 Multiple versions of MPI libraries
One common problem on clustered systems is having different MPI library levels on various
nodes. This can occur when a node is down for service while an upgrade is made, or when there
are multiple versions of the libraries for each node and the links are broken. To check the library
levels across a large system, use the following dsh commands:
• For LAPI libraries: dsh sum /opt/rsct/lapi/lib/liblapi_r.a (or run with
MP_INFOLEVEL=2)
pshpstuningguidewp040105.doc
Page 21
•
•
For HAL libraries: dsh sum /usr/sni/aix52/lib/libhal_r.a
For MPI libraries: dsh sum /usr/lpp/ppe.poe/lib/libmpi_r.a (or run
with MP_PRINTENV=yes)
To make sure you are running the correct combination of HAL, LAPI, and MPI, check the
Service Pack Release Notes.
5.10 MP_PRINTENV
If you set MP_PRINTENV=YES or MP_PRINTENV=script_name, the output includes the
following information about environmental variables. The output for the user script is also
printed, if it was specified.
Hostname
Job ID (MP_PARTITION)
Number of Tasks (MP_PROCS)
Number of Nodes (MP_NODES)
Number of Tasks per Node (MP_TASKS_PER_NODE)
Library Specifier (MP_EUILIB)
Adapter Name
IP Address
Window ID
Network ID
Device Name (MP_EUIDEVICE)
Window Instances (MP_INSTANCES)
Striping Setup
Protocols in Use (MP_MSG_API)
Effective Libpath (LIBPATH)
Current Directory
64 Bit Mode
Threaded Library
Requested Thread Scope (AIXTHREAD_SCOPE)
Thread Stack Allocation (MP_THREAD_STACKSIZE/Bytes)
CPU Use (MP_CPU_USE)
Adapter Use (MP_ADAPTER_USE)
Clock Source (MP_CLOCK_SOURCE)
Priority Class (MP_PRIORITY)
Connection Timeout (MP_TIMEOUT/sec)
Adapter Interrupts Enabled (MP_CSS_INTERRUPT)
Polling Interval (MP_POLLING_INTERVAL/sec)
Use Flow Control (MP_USE_FLOW_CONTROL)
Buffer Memory (MP_BUFFER_MEM/Bytes)
Message Eager Limit (MP_EAGER_LIMIT/Bytes)
Message Wait Mode(MP_WAIT_MODE)
Retransmit Interval (MP_RETRANSMIT_INTERVAL/count)
Shared Memory Enabled (MP_SHARED_MEMORY)
Shared Memory Collective (MP_SHM_CC)
Collective Shared Memory Segment Page Size (KBytes)
Large Page Environment
Large Page Memory Page Size (KBytes)
pshpstuningguidewp040105.doc
Page 22
MEMORY_AFFINITY
Single Thread Usage(MP_SINGLE_THREAD)
Hints Filtered (MP_HINTS_FILTERED)
MPI-I/O Buffer Size (MP_IO_BUFFER_SIZE)
MPI-I/O Error Logging (MP_IO_ERRLOG)
MPI-I/O Node File (MP_IO_NODEFILE)
MPI-I/O Task List (MP_IO_TASKLIST)
System Checkpointable (CHECKPOINT)
LoadLeveler Gang Scheduler
DMA Receive FIFO Size (Bytes)
Max outstanding packets
LAPI Max Packet Size (Bytes)
LAPI Ack Threshold (MP_ACK_THRESH)
LAPI Max retransmit buf size (MP_REXMIT_BUF_SIZE)
LAPI Max retransmit buf count (MP_REXMIT_BUF_CNT)
LAPI Maximum Atom Size
LAPI use bulk transfer (MP_USE_BULK_XFER)
LAPI bulk min message size (MP_BULK_MIN_MSG_SIZE)
LAPI no debug timeout (MP_DEBUG_NOTIMEOUT)
Develop Mode (MP_EUIDEVELOP)
Standard Input Mode (MP_STDINMODE)
Standard Output Mode (MP_STDOUTMODE)
Statistics Collection Enabled (MP_STATISTICS)
Number of Service Variables set (MP_S_*)
Interrupt Delay (us) (MP_INTRDELAY)
Sync on Connect Usage (MP_SYNC_ON_CONNECT)
Internal Pipe Size (KBytes)(MP_PIPE_SIZE)
Ack Interval (count)(MP_ACK_INTERVAL)
LAPI Buffer Copy Size (MP_COPY_SEND_BUF_SIZE)
User Script Name (MP_PRINTENV)
Size of User Script Output
5.11 MP_STATISTICS
If MP_STATISTICS is set to yes, statistics are collected. However, these statistics are written
only when a call is made to mp_statistics_write, which takes a pointer to a file descriptor as its
sole argument. These statistics can be zeroed out with a call to mp_statistics_zero. This can be
used with calls to mp_statistics_write to determine the communication statistics in different
portions of the user application. These statistics are useful for determining if there are excessive
packet retransmits, in addition to giving the total number of packets, messages, and data sent or
received. The late arrivals are useful in determining how often a receive was posted before the
matching message arrived. Early arrivals indicate how often a message is received before the
posting of the matching receive.
MP_STATISTICS take the values yes and print. If the value is set to print, the statistics
are printed for each task in the job at MPI_FINALIZE. If you set MP_STATISTICS to print,
you should also set MP_LABELIO to yes so you know which task each line of output came
from.
The following is a sample output of the statistics.
pshpstuningguidewp040105.doc
Page 23
MPCI: sends = 14
MPCI: sendsComplete = 14
MPCI: sendWaitsComplete = 17
MPCI: recvs = 17
MPCI: recvWaitsComplete = 13
MPCI: earlyArrivals = 5
MPCI: earlyArrivalsMatched = 5
MPCI: lateArrivals = 8
MPCI: shoves = 10
MPCI: pulls = 13
MPCI: threadedLockYields = 0
MPCI: unorderedMsgs = 0
LAPI: Tot_dup_pkt_cnt=0
LAPI: Tot_retrans_pkt_cnt=0
LAPI: Tot_gho_pkt_cnt=0
LAPI: Tot_pkt_sent_cnt=14
LAPI: Tot_pkt_recv_cnt=15
LAPI: Tot_data_sent=4194
LAPI: Tot_data_recv=3511
5.12 Dropped switch packets
Lower than expected performance can be caused by dropped packets on the HPS switch. Packets
sent over a switch interface can be dropped in several ways, as described in the following
sections.
5.12.1 Packets dropped because of a software problem on an
endpoint
Packets are sometimes dropped at one of the endpoints of the packet transfer. In this case, you
should be able to run AIX 5L commands to see some evidence on the endpoint that dropped the
packet. For example, run /usr/sni/sni.snap -l {adapter_number} to get the
correct endpoint data. This is best taken both before and after re-creating the problem. The
sni.snap creates a new archive in /var/adm/sni/snaps. For example, /usr/sni/sni.snap l 1 produces a hostname.adapter_no.timestamp file such as
/var/adm/sni/snaps/c704f2n01.1.041118122825.FEFE5.sni.snap.tar.Z.
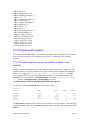
For IP traffic, looking at netstat -D data is a good place to start:
netstat -D
Source
[. . .]
sn_dmx0
sn_dmx1
sn_if0
sn_if1
ml_if0
Ipkts
Opkts
Idrops
Odrops
156495
243602
156495
243602
0
N/A
N/A
140693
241028
98
0
0
0
0
0
N/A
N/A
0
13
10
The ifsn_dump command provides interface-layer statistics for the sni interfaces. This tool helps
you diagnose packet drops seen in netstat -D and also prints some drops that are not shown under
netstat.
pshpstuningguidewp040105.doc
Page 24
Run the following command:
/usr/sbin/ifsn_dump -a
The data is collected in sni.snap (sni_dump.out.Z), and provides useful information, such as the
local mac address:
mac_addr 0:0:0:40:0:0
If you are seeing arpq drops, ensure the source has the correct mac_addr for its destination.
The ndd statistics listed in ifsn_dump are useful for measuring packet drops in relation to the
overall number of packets sent and received. ifsn_dump provides 64-bit counters for drops,
sends, and receives, using msw and lsw 32-bit words. These 64-bit counters can be more useful
than the 32-bit counters listed in netstat, because these 32-bit counters (limited to 4GB) can be
quickly wrapped under heavy traffic loads on the switch.
Here is an example of ndd statistics listed by the ifsn_dump –a command:
|
|
|
|
|
|
|
|
|
|
|
|
|
|
|
|
|
|
|
|
|
|
|
|
|
|
|
|
|
|
|
|
|
|
|
|
|
|
|
|
ndd_ipackets_msw
ndd_ipackets_lsw
ndd_ibytes_msw
ndd_ibytes_lsw
ndd_recvintr_msw
ndd_recvintr_lsw
ndd_ierrors
ndd_opackets_msw
ndd_opackets_lsw
ndd_obytes_msw
ndd_obytes_lsw
ndd_xmitintr_msw
ndd_xmitintr_lsw
ndd_oerrors
ndd_nobufs
ndd_xmitque_max
ndd_xmitque_ovf
ndd_recvintr_msw
ndd_recvintr_lsw
ndd_ierrors
ndd_opackets_msw
ndd_opackets_lsw
ndd_obytes_msw
ndd_obytes_lsw
ndd_xmitintr_msw
ndd_xmitintr_lsw
ndd_oerrors
ndd_nobufs
ndd_xmitque_max
ndd_xmitque_ovf
ndd_ipackets_drop
ndd_ibadpackets
ndd_opackets_drop
ndd_xmitque_cur
ndd_ifOutUcastPkts_msw
ndd_ifOutUcastPkts_lsw
ndd_ifOutMcastPkts_msw
ndd_ifOutMcastPkts_lsw
ndd_ifOutBcastPkts_msw
ndd_ifOutBcastPkts_lsw
pshpstuningguidewp040105.doc
0x00000000 [0]
0x00026357 [156503]
0x00000000 [0]
0x012756be [19355326]
0x00000000 [0]
0x00000000 [0]
0x00000000 [0]
0x00000000 [0]
0x00022595 [140693]
0x00000000 [0]
0x01172099 [18292889]
0x00000000 [0]
0x00000000 [0]
0x00000000 [0]
0x00000000 [0]
0x00000000 [0]
0x00000000 [0]
0x00000000 [0]
0x00000000 [0]
0x00000000 [0]
0x00000000 [0]
0x00022595 [140693]
0x00000000 [0]
0x01172099 [18292889]
0x00000000 [0]
0x00000000 [0]
0x00000000 [0]
0x00000000 [0]
0x00000000 [0]
0x00000000 [0]
0x00000000 [0]
0x00000000 [0]
0x00000000 [0]
0x00000000 [0]
0x00000000 [0]
0x00020e67 [134759]
0x00000000 [0]
0x00000000 [0]
0x00000000 [0]
0x0000172e [5934]
Page 25
To help you isolate the exact cause of packet drops, the ifsn_dump -a command also lists the
following debug statistics. If you isolate packet drops to these statistics, you will probably need
to contact IBM support.
dbg:
|
|
|
|
|
|
|
|
|
|
|
|
|
|
|
|
|
sNet_drop
sRTF_drop
sMbuf_drop
sFifo_drop
sQueue_drop
rPool_drop
m_reject
rsvd_pool_used
recv_not_ready
recv_bad_flag
recv_bad_type
alloc_cntl_fail
spkt_timeout
bad_health_drop
phantom_recv_intr
same_thresh_cnt
last_recv_thresh
0x00000000 [0]
0x00000000 [0]
0x00000000 [0]
0x00000000 [0]
0x00000000 [0]
0x00000000 [0]
0x00000000 [0]
0x00000000 [0]
0x00000000 [0]
0x00000000 [0]
0x00000000 [0]
0x00000000 [0]
0x00000000 [0]
0x00000000 [0]
0x00000000 [0]
0x00000000 [0]
0x0000000000000000 [0]
To see some packet drops (such as arpq drops), you must use the kdb ifnet structure (which is
common for many interfaces). Here is an example:
echo ifnet | kdb[ . . .]
SLOT 2 ---- IFNET INFO ----(@ 075AF098)---name........ sn0
unit........ 00000000 mtu......... 0000FFE0
flags....... 08800843
(UP|BROADCAST|RUNNING|SIMPLEX|NOECHO|BPF|IFBUFMGT|CANTCHANGE...
[. . .]
init()...... 00000000 output().... 075AE498 start()..... 00000000
done()...... 00000000 ioctl()..... 075AE4B0 reset()..... 00000000
watchdog().. 00000000 ipackets.... 00026549 ierrors..... 00000000
opackets.... 00022778 oerrors..... 00000000 collisions.. 00000000
next........ 075AF2C8 type........ 00000038 addrlen..... 00000000
hdrlen...... 00000018 index....... 00000003
ibytes......
omcasts.....
baudrate....
devno.......
tap().......
arprev()....
ifq_tail....
ifq_drops...
0127BA9E obytes...... 0117B005 imcasts..... 00000000
00000000 iqdrops..... 00000000 noproto..... 00000000
00000000 arpdrops.... 00000002 ifbufminsize 00000200
8000002300000000 chan........ 2FF38EB0 multiaddrs.. 00000000
00000000 tapctl...... FFFFFFFFFFFFFFFF arpres().... 00000000
00000000 arpinput().. 00000000 ifq_head.... 00000000
00000000 ifq_len..... 00000000 ifq_maxlen.. 00000200
00000000 ifq_slock... 00000000 slock....... 00000000
5.12.2 Packets dropped in the ML0 interface
For ml0 drops to a destination, use the mltdd_dump -k command to determine if a valid ml0
route exists to destination:
/usr/sbin/mltdd_dump -k
The following example shows the route to ml0 destination 192.168.2.3, which is a valid and
complete ml0 route. If a route is incomplete, it is not valid.
mlr_next = 0x0000000000000000
mlr.state = 160
(COMPLETE)
pshpstuningguidewp040105.doc
Page 26
There are two routes.
sending packet using route No. 1
ml ip address structure, starting:
ml flag (ml interface up or down) = 0x00000000
ml tick = 0
ml ip address = 0xc0a80203, 192.168.2.3
There are two preferred route pairs:
from local if 0 to remote if 0
from local if 1 to remote if 1
There are two actual routes (two preferred).
--------------------------------------from local if 0 to remote if 0
destination ip address structure:
if flag (up or down) = 0x000000c1
if tick = 0
ipaddr = 0xc0a80003, 192.168.0.3
--------------------------------------from local if 1 to remote if 1
destination ip address structure:
if flag (up or down) = 0x000000c1
if tick = 0
ipaddr = 0xc0a80103, 192.168.1.3
5.12.3 Packets dropped because of a hardware problem on an
endpoint
To check for dropped packets at the HMC, check /var/adm/sni/sni_errpt_capture. Each
hardware event has an entry. If you don't have the register mappings for error bits, check whether
the errors are recoverable (non-MP-Fatal) or MP-Fatal. (MP-Fatal errors take longer to recover
from and could be associated with more drops.)
The following is an example of Recoverable/Non Mp Fatal entry in
/var/adm/sni/sni_errpt_capture:
Current time is:
Mon Oct 4 05:08:51 2004
Errpt Sequence num is: 3229
Errpt Timestamp is: Mon Oct 4 05:08:51 2004
Event TOD is:
2004160209010410
Event TOD date:
Oct 04 09:02:16 2004
Not MP Fatal
DSS Log count = 07
1st Attn type = Recoverable
2nd Attn type = Recoverable
1st Alert type = Alert 02 - SMA Detected Error FNM handles callout
SMA chip (GFW #)
3
SMA location
U1.28-P1-H1/Q1
SMA logically defined in this LPAR
sni1
Failure Signature
8073D001
pshpstuningguidewp040105.doc
Page 27
MAC WOF
[. . .]
(2F870): Bit: 1
5.12.4 Packets dropped in the switch hardware
If a packet is dropped within the switch hardware itself (for example, when traversing the link
between two switch chips), evidence of the packet drop is on the HMC, where the switch
Federation Network Manager (FNM) runs. You can run /opt/hsc/bin/fnm.snap to create a snap
archive in /var/hsc/log (for example, /var/hsc/log/c704hmc1.2004-11-19.12.50.33.snap.tar.gz).
The FNM code handles errors associated with packet drops in the switch. To run the fnm.snap
command (/opt/hsc/bin/fnm.snap), you must have root access or set up proper authentication. In
the snap data, check the FNM_Recov.* logs for switch errors. If a certain type of error reached a
threshold in the hardware, reporting for that type of error might be disabled. As a result, packet
loss might not be reported. Generally, when you are looking for packet loss, it's a good idea to
restart the FNM code to ensure that error reporting is reset.
5.13 MP_INFOLEVEL
You can get additional information from an MPI job by setting the MPI_INFOLEVEL variable to
2. In addition, if you set the MP_LABELIO variable to yes, you can get information for each
task. Here is an example of the output using these settings:
INFO: 0031-364 Contacting LoadLeveler to set and query information for interactive job
INFO: 0031-380 LoadLeveler step ID is test_mach1.customer.com.2507.0
INFO: 0031-118 Host test_mach1.customer.com requested for task 0
INFO: 0031-118 Host test_mach2.customer.com requested for task 1
INFO: 0031-119 Host test_mach1.customer.com allocated for task 0
INFO: 0031-120 Host address 10.10.10.1 allocated for task 0
INFO: 0031-377 Using sn1 for MPI euidevice for task 0
INFO: 0031-119 Host test_mach2.customer.com allocated for task 1
INFO: 0031-120 Host address 10.10.10.2 allocated for task 1
INFO: 0031-377 Using sn1 for MPI euidevice for task 1
1:INFO: 0031-724 Executing program: <spark-thread-bind.lp>
0:INFO: 0031-724 Executing program: <spark-thread-bind.lp>
1:LAPI version #7.9 2004/11/05 1.144 src/rsct/lapi/lapi.c, lapi, rsct_rir2, rir20446a 32bit(us)
library compiled on Wed Nov 10 06:44:38 2004
1:LAPI is using lightweight lock.
1:Bulk Transfer is enabled.
1:Shared memory not used on this node due to sole task running.
1:The LAPI lock is used for the job
0:INFO: 0031-619 32bit(us) MPCI shared object was compiled at Tue Nov 9 12:36:54 2004
0:LAPI version #7.9 2004/11/05 1.144 src/rsct/lapi/lapi.c, lapi, rsct_rir2, rir20446a 32bit(us)
library compiled on Wed Nov 10 06:44:38 2004
0:LAPI is using lightweight lock.
0:Bulk Transfer is enabled.
0:Shared memory not used on this node due to sole task running.
0:The LAPI lock is used for the job
pshpstuningguidewp040105.doc
Page 28
5.14 LAPI_DEBUG_COMM_TIMEOUT
If the LAPI protocol experiences communication timeouts, set the environment variable
LAPI_DEBUG_COMM_TIMEOUT to PAUSE. This causes the application to issue a pause()
call when encountering a timeout, which stops the application instead of closing it.
5.15 LAPI_DEBUG_PERF
The LAPI_DEBUG_PERF flag is not supported and should not be used in production. However,
it can provide useful information about packet loss. If you suspect packet drops are reducing
performance, set the LAPI_DEBUG_PERF flag to yes (export LAPI_DEBUG_PERF=yes).
The following additional information is sent to standard error in the job output:
_retransmit_pkt_cnt
Tot_retrans_pkt_cnt
LAPI Tot_retrans_pkt_cnt
Shared Tot_retrans_pkt_cnt
Be aware that some retransmissions in the initialization stage are normal.
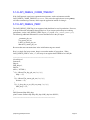
Here is a simple Perl script (count_drops) to count the number of lost packets. When
LAPI_DEBUG_PERF is set to yes, this script is run against the STDERR of an LAPI job.
=============================================
#!/usr/bin/perl
$retrans=0;
$dup=0;
$ftbl_drop=0;
$diff=0;
while ( <STDIN> )
{
if( /(.*)Shared Tot_dup_pkt_cnt(.*)= (.*)/) {
$dup += $3;
}
if( /(.*)Shared Tot_retrans_pkt_cnt(.*)= (.*)/) {
$retrans += $3;
}
if( /(.*)_drop_due_to_usr_ftbl_not_setup(.*)= (.*)/) {
$ftbl_drop += $3;
}
}
$diff=$retrans-$dup-$ftbl_drop;
printf "retrans=$retrans dup=$dup ftbl_drop=$ftbl_drop lost=$diff\n";
==============================================
pshpstuningguidewp040105.doc
Page 29
5.16 AIX 5L trace for daemon activity
If you suspect that a system daemon is causing a performance problem on your system, run
AIX 5L trace to check for daemon activity. For example, to find out which daemons are taking
up CPU time, use the following process:
trace -j 001,002,106,200,10c,134,139,465 -a -o /tmp/trace.aux -L 40000000 -T 20000000
sleep XX (XX is the time for your trace)
trcstop
trcrpt -O 'cpuid=on exec=on pid=on tid=on' /tmp/trace.aux > /tmp/trace.out
Look at /tmp/trace.out
pprof XX (XX is the time for your trace)
Look at:
pprof.cpu
pprof.famcpu
pprof.famind
pprof.flow
pprof.namecpu
pprof.start
pprof.cpu
You will find all these files on the $PWD at the time you run it.
tprof -c -A all -x sleep XX (XX is the time for your trace)
Look at: sleep.prof (you will find this file on the $PWD at the time you run it)
6.0 Conclusions and summary
Peak performance of HPS systems depends on properly tuning the HPS, and on correctly setting
application shell variables and AIX 5L tunables.
Because there are many sources of performance data, correct tuning takes time. As has been
demonstrated, the HPS performs very well. If tuning is needed, there are several good tools to use
to determine performance problems.
7.0 Additional reading
This section lists documents that contain additional information about the topics in this white
paper.
7.1 HPS documentation
pSeries High Performance Switch - Planning, Installation and Service, GA22-7951-02
pshpstuningguidewp040105.doc
Page 30
7.2 MPI documentation
Parallel Environment for AIX 5L V4.1.1 Hitchhiker's Guide, SA22-7947-01
Parallel Environment for AIX 5L V4.1.1 Operation and Use, Volume 1, SA22-7948-01
Parallel Environment for AIX 5L V4.1.1 Operation and Use, Volume 2, SA22-7949-01
Parallel Environment for AIX 5L V4.1.1 Installation, GA22-7943-01
Parallel Environment for AIX 5L V4.1.1 Messages, GA22-7944-01
Parallel Environment for AIX 5L V4.1.1 MPI Programming Guide, SA22-7945-01
Parallel Environment for AIX 5L V4.1.1 MPI Subroutine Reference, SA22-7946-01
7.3 AIX 5L performance guides
AIX 5L Version 5.2 Performance Management Guide, SC23-4876-00
AIX 5L Version 5.2 Performance Tools Guide and Reference, SC23-4859-03
7.4 IBM Redbooks™
AIX 5L Performance Tools Handbook, SG24-6039-01
7.5 POWER4
POWER4 Processor Introduction and Tuning Guide, SG24-7041-00
How to Control Resource Affinity on Multiple MCM or SCM pSeries Architecture in an HPC
Environment:
http://www.redbooks.ibm.com/redpapers/abstracts/redp3932.html
pshpstuningguidewp040105.doc
Page 31
© IBM Corporation 2005
IBM Corporation
Marketing Communications
Systems Group
Route 100
Somers, New York 10589
Produced in the United States of America
April 2005
All Rights Reserved
This document was developed for products
and/or services offered in the United States.
IBM may not offer the products, features, or
services discussed in this document in other
countries.
The information may be subject to change
without notice. Consult your local IBM
business contact for information on the
products, features and services available in
your area.
All statements regarding IBM’s future
directions and intent are subject to change or
withdrawal without notice and represent goals
and objectives only.
~
IBM, the IBM logo,
, AIX 5L,
LoadLeveler, POWER4, POWER4+, pSeries
and Redbooks are trademarks or registered
trademarks of International Business
Machines Corporation in the United States or
other countries or both. A full list of U.S.
trademarks owned by IBM may be found at
http://www.ibm.com/legal/copytrade.shtml.
Other company, product, and service names
may be trademarks or service marks of others.
IBM hardware products are manufactured
from new parts, or new and used parts.
Regardless, our warranty terms apply.
Copying or downloading the images contained
in this document is expressly prohibited
without the written consent of IBM.
This equipment is subject to FCC rules. It will
comply with the appropriate FCC rules before
final delivery to the buyer.
Information concerning non-IBM products was
obtained from the suppliers of these products
or other public sources. Questions on the
capabilities of the non-IBM products should be
addressed with the suppliers.
All performance information was determined in
a controlled environment. Actual results may
vary. Performance information is provided
“AS IS” and no warranties or guarantees are
expressed or implied by IBM.
The IBM home page on the Internet can be
found at http://www.ibm.com.
The pSeries home page on the Internet can be
found at
http://www.ibm.com/servers/eserver/pseries.
pshpstuningguidewp040105.doc
Page 32