1
Hitachi Universal Storage Platform V
Hitachi Universal Storage Platform VM
Hitachi Performance Manager User’s Guide
Performance Monitor and Server Priority Manager
FASTFIND LINKS
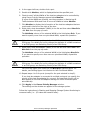
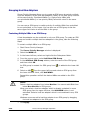
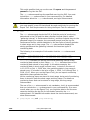
Document Organization
Product Version
Getting Help
Contents
MK-96RD617-08
Copyright © 2008 Hitachi Data Systems
Corporation, ALL RIGHTS RESERVED
Notice: No part of this publication may be
reproduced or transmitted in any form or by
any means, electronic or mechanical,
including photocopying and recording, or
stored in a database or retrieval system for
any purpose without the express written
permission of Hitachi Data Systems
Corporation (hereinafter referred to as
“Hitachi Data Systems”).
Hitachi Data Systems reserves the right to
make changes to this document at any time
without notice and assumes no responsibility
for its use. Hitachi Data Systems products
and services can only be ordered under the
terms and conditions of Hitachi Data Systems’
applicable agreements. All of the features
described in this document may not be
currently available. Refer to the most recent
product announcement or contact your local
Hitachi Data Systems sales office for
information on feature and product
availability.
This document contains the most current
information available at the time of
publication. When new and/or revised
information becomes available, this entire
document will be updated and distributed to
all registered users.
Hitachi, the Hitachi logo, and Hitachi Data
Systems are registered trademarks and
service marks of Hitachi, Ltd. The Hitachi
Data Systems logo is a trademark of Hitachi,
Ltd.
Dynamic Provisioning, ShadowImage, and
TrueCopy are registered trademarks or
trademarks of Hitachi Data Systems.
All other brand or product names are or may
be trademarks or service marks of and are
used to identify products or services of their
respective owners.
ii
Hitachi Universal Storage Platform V/VM Hitachi Performance Manager User’s Guide
Contents
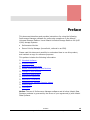
Preface .................................................................................................. vii
Overview of Performance Manager ........................................................ 1-1
About Performance Manager Operations ................................................ 2-1
Understanding Statistical Storage Ranges .....................................................2-3
Parity Group Usage Statistics .......................................................................2-4
Volume Usage Statistics ..............................................................................2-5
External Volume Group Usage Statistics........................................................2-5
External Volume Usage Statistics .................................................................2-6
Channel Processor Usage Statistics ..............................................................2-6
Disk Processor Usage Statistics ....................................................................2-6
DRR Processor Usage Statistics....................................................................2-9
Write Pending Rate and Cache Memory Usage Statistics ................................2-9
Access Path Usage Statistics ......................................................................2-10
Hard Disk Drive Workload Statistics............................................................2-11
Port Traffic Statistics .................................................................................2-12
LU Paths Traffic Statistics ..........................................................................2-12
Traffic between HBAs and Storage System Ports .........................................2-13
Performance of High-Priority Hosts.............................................................2-13
Upper-Limit Control ..................................................................................2-14
Performance Monitor ................................................................................2-17
Server Priority Manager.............................................................................2-18
Preparing for Performance Manager Operations ...................................... 3-1
Performance Monitor Limitations..................................................................3-3
Export Tool Limitations................................................................................3-5
Contents
Hitachi Universal Storage Platform V/VM Hitachi Performance Manager User’s Guide
iii
Using the Performance Manager GUI ..................................................... 4-1
Performance Monitor Window ..................................................................... 4-2
Performance Management Window, Physical Tab ......................................... 4-3
LDEV Tab of the Performance Monitor Window............................................. 4-9
Port-LUN Tab of the Performance Monitor Window ..................................... 4-15
WWN Tab of the Performance Monitor Window .......................................... 4-21
Monitoring Options Window ...................................................................... 4-25
Other Windows........................................................................................ 4-29
Port Tab of the Server Priority Manager Window......................................... 4-30
WWN Tab of the Server Priority Manager Window ...................................... 4-34
Performance Monitor Operations ........................................................... 5-1
Start Monitoring......................................................................................... 5-2
View the Monitoring Results........................................................................ 5-4
Starting and Stopping Storage System Monitoring......................................... 5-6
Viewing Usage Statistics on Parity Groups .................................................... 5-8
Viewing Usage Statistics on Volumes in Parity Groups ................................. 5-10
Viewing Usage Statistics on External Volume Groups................................... 5-14
Viewing Usage Statistics on External Volumes in External Volume Groups ..... 5-16
Viewing Usage Statistics on Channel Processors ......................................... 5-18
Viewing Usage Statistics on Disk Processors ............................................... 5-19
Viewing Usage Statistics on Data Recovery and Reconstruction Processors ... 5-21
Viewing Write Pending and Cache Memory Usage Statistics ......................... 5-22
Viewing Usage Statistics on Access Paths................................................... 5-24
Viewing I/O Rates for Disks ...................................................................... 5-27
Viewing Transfer Rates for Disks ............................................................... 5-30
Viewing I/O Rates for Ports ...................................................................... 5-34
Viewing Transfer Rates for Ports ............................................................... 5-37
Viewing Details about the I/O and Transfer Rates....................................... 5-40
Viewing LU Paths I/O Rates ...................................................................... 5-41
Viewing LU Paths Transfer Rates ............................................................... 5-43
Monitoring Paths between Host Bus Adapters and Ports .............................. 5-45
Viewing I/O Rates between HBAs .............................................................. 5-45
Viewing Transfer Rates between HBAs....................................................... 5-48
Server Priority Manager Operation ......................................................... 6-1
If One-to-One Connections Link HBAs and Ports ........................................... 6-3
If Many-to-Many Connections Link HBAs and Ports ....................................... 6-6
Starting Server Priority Manager................................................................ 6-11
Analyzing Traffic Statistics ........................................................................ 6-13
Setting Priority for Ports on the Storage System ......................................... 6-14
Setting Upper-Limit Values to Traffic at Non-prioritized Ports ....................... 6-15
iv
Contents
Hitachi Universal Storage Platform V/VM Hitachi Performance Manager User’s Guide
Setting a Threshold...................................................................................6-16
Monitoring All Traffic between HBAs and Ports ............................................6-18
Analyzing Traffic Statistics .........................................................................6-21
Setting Priority for Host Bus Adapters.........................................................6-22
Setting Upper-Limit Values for Non-Prioritized WWNs ..................................6-24
Setting a Threshold...................................................................................6-25
Changing the SPM Name of a Host Bus Adapter ..........................................6-26
Replacing a Host Bus Adapter ....................................................................6-27
Grouping Host Bus Adapters ......................................................................6-28
Using the Export Tool ........................................................................... 7-1
Requirements for Using the Export Tool .....................................................7-16
Installing the Export Tool on a Windows Computer......................................7-17
Installing the Export Tool on a UNIX Computer ...........................................7-18
Preparing a Command File.........................................................................7-19
Preparing a Batch File ...............................................................................7-22
Running the Export Tool............................................................................7-24
Command Syntax .....................................................................................7-30
svpip Subcommand...................................................................................7-32
retry Subcommand ...................................................................................7-33
login Subcommand ...................................................................................7-34
show Subcommand...................................................................................7-35
group Subcommand..................................................................................7-37
short-range Subcommand .........................................................................7-54
long-range Subcommand ..........................................................................7-58
outpath Subcommand ...............................................................................7-62
option Subcommand .................................................................................7-63
apply Subcommand ..................................................................................7-64
set subcommand ......................................................................................7-64
help Subcommand ....................................................................................7-66
Java Command for Exporting Data In Files..................................................7-66
Troubleshooting ................................................................................... 8-1
Acronyms and Abbreviations
Index
Contents
Hitachi Universal Storage Platform V/VM Hitachi Performance Manager User’s Guide
v
vi
Contents
Hitachi Universal Storage Platform V/VM Hitachi Performance Manager User’s Guide
Preface
This document describes and provides instructions for using the following
Performance Manager software for performing operations on the Hitachi
Universal Storage Platform V and Hitachi Universal Storage Platform VM (USP
V/VM) storage systems.
•
Performance Monitor
•
Server Priority Manager (henceforth, referred to as SPM)
Please read this document carefully to understand how to use this product,
and maintain a copy for reference purposes.
This preface includes the following information:
Intended Audience
Product Version
Document Revision Level
Source Document(s) for this Revision
Changes in this Revision
Document Organization
Referenced Documents
Document Conventions
Convention for Storage Capacity Values
Getting Help
Comments
Notice: The use of Performance Manager software and all other Hitachi Data
Systems products is governed by the terms of your agreement(s) with Hitachi
Data Systems.
Preface
Hitachi Universal Storage Platform V/VM Hitachi Performance Manager User’s Guide
vii
Intended Audience
This document is intended for system administrators, Hitachi Data Systems
representatives, and Authorized Service Providers who are involved in
installing, configuring, and operating the Hitachi Universal Storage Platform V
and VM storage systems.
This document assumes the following:
•
The user has a background in data processing and understands RAID
storage systems and their basic functions.
•
The user is familiar with the Universal Storage Platform V and/or VM
storage system and has read the Universal Storage Platform V/VM User
and Reference Guide.
•
The user is familiar with the Storage Navigator software for the Universal
Storage Platform V/VM and has read the Storage Navigator User’s Guide.
•
The user is familiar with the operating system and Web browser software
on the system hosting the Hitachi Universal Storage Platform V/VM Storage
Navigator remote console software.
Note: There are different types of users for Hitachi Universal Storage Platform
V/VM: storage administrators and storage partition administrators. The
functions described in this manual are limited depending on the user type. For
details on the limitations, see Storage Partition Administrators Limitations. For
details on the user types, see the Storage Navigator User’s Guide.
Product Version
This document revision applies to Universal Storage Platform V/VM microcode
60-03-0x and higher.
Document Revision Level
Revision
viii
Date
Description
MK-96RD617-P
February 2007
Preliminary Release
MK-96RD617-00
April 2007
Initial Release, supersedes and replaces MK-96RD617-P
MK-96RD617-01
June 2007
Revision 1, supersedes and replaces MK-96RD617-00
MK-96RD617-02
July 2007
Revision 2, supersedes and replaces MK-96RD617-01
MK-96RD617-03
September 2007
Revision 3, supersedes and replaces MK-96RD617-02
MK-96RD617-04
November 2007
Revision 4, supersedes and replaces MK-96RD617-03
MK-96RD617-05
January 2008
Revision 5, supersedes and replaces MK-96RD617-04
MK-96RD617-06
March 2008
Revision 6, supersedes and replaces MK-96RD617-05
Preface
Hitachi Universal Storage Platform V/VM Hitachi Performance Manager User’s Guide
Revision
Date
Description
MK-96RD617-07
March 26 2008
Revision 7, supersedes and replaces MK-96RD617-06
MK-96RD617-08
May 2008
Revision 8, supersedes and replaces MK-96RD617-07
Source Documents for this Revision
•
MK-96RD617-08d-RSD-V03
Changes in This Revision
•
Added notes throughout this document to contact Hitachi Data Systems
Support Center for Volume Migration support.
•
Added notes throughout this document concerning the CU as the
monitoring target.
•
Added new section Causes of Invalid Monitoring Data.
Document Organization
The following table provides an overview of the contents and organization of
this document. Click the chapter title in the left column to go to that chapter.
The first page of each chapter provides links to the sections in that chapter.
Chapter
Description
Chapter 1 - Overview of
Performance Manager
Describes the performance management software products that allow
you to monitor and tune storage system performance.
Chapter 2 About_Performance_Manager
_Operations
Provides an overview of Performance Manager operations.
Chapter 3 - Preparing for
Performance Manager
Operations
Explains the preparations for Performance Manager operations.
Chapter 4 - Using the
Performance Manager GUI
Explains the use of the Performance Manager windows.
Chapter 5 - Performance
Monitor Operations
Explains Performance Monitor operations.
Chapter 6 - Server Priority
Manager Operation
Explains Server Priority Manager operations.
Chapter 7 - Using the Export
Tool
Explains using the Export Tool.
Chapter 8 - Troubleshooting
Provides troubleshooting information on Performance Monitor, Server
Priority Manager, and Export Tool.
Acronyms and Abbreviations
Defines the acronyms and abbreviations used in this document.
Index
Lists the topics in this document in alphabetical order.
Preface
Hitachi Universal Storage Platform V/VM Hitachi Performance Manager User’s Guide
ix
Referenced Documents
Hitachi Universal Storage Platform V/VM:
•
Hitachi Compatible Mirroring for IBM FlashCopy User’s Guide, MK-96RD614
•
Hitachi Copy-on-Write Snapshot User’s Guide, MK-96RD607
•
Hitachi Dynamic Provisioning User's Guide, MK-96RD641
•
Hitachi LUN Manager User’s Guide, MK-96RD615
•
Hitachi ShadowImage for IBM® z/OS® User’s Guide, MK-96RD619
•
Hitachi ShadowImage User’s Guide, MK-96RD618
•
Hitachi Storage Navigator Messages, MK-96RD613
•
Hitachi Storage Navigator User’s Guide, MK-96RD621
•
Hitachi TrueCopy for IBM z/OS User’s Guide, MK-96RD623
•
Hitachi TrueCopy User’s Guide, MK-96RD622
•
Hitachi Universal Replicator for IBM z/OS User’s Guide, MK-96RD625
•
Hitachi Universal Replicator User’s Guide, MK-96RD624
•
Hitachi Virtual Partition Manager User’s Guide, MK-96RD629
Document Conventions
The terms “Universal Storage Platform V” and “Universal Storage Platform VM”
refer to all models of the Hitachi Universal Storage Platform V and VM storage
systems, unless otherwise noted.
This document uses the following typographic conventions:
Convention
Description
Bold
Indicates text on a window, other than the window title, including menus,
menu options, buttons, fields, and labels. Example: Click OK.
Italic
Indicates a variable, which is a placeholder for actual text provided by the
user or system. Example: copy source-file target-file
Note: Angled brackets (< >) are also used to indicate variables.
screen/code
Indicates text that is displayed on screen or entered by the user.
Example: # pairdisplay -g oradb
< > angled brackets
Indicates a variable, which is a placeholder for actual text provided by the
user or system. Example: # pairdisplay -g <group>
Note: Italic font is also used to indicate variables.
x
[ ] square brackets
Indicates optional values. Example: [ a | b ] indicates that you can choose
a, b, or nothing.
{ } braces
Indicates required or expected values. Example: { a | b } indicates that
you must choose either a or b.
Preface
Hitachi Universal Storage Platform V/VM Hitachi Performance Manager User’s Guide
Convention
Description
Indicates that you have a choice between two or more options or
arguments. Examples:
| vertical bar
[ a | b ] indicates that you can choose a, b, or nothing.
{ a | b } indicates that you must choose either a or b.
underline
Indicates the default value. Example: [ a | b ]
This document uses the following icons to draw attention to information:
Icon
Meaning
Description
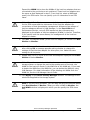
Note
Calls attention to important and/or additional information.
Tip
Provides helpful information, guidelines, or suggestions for performing
tasks more effectively.
Caution
Warns the user of adverse conditions and/or consequences (e.g.,
disruptive operations).
WARNING
Warns the user of severe conditions and/or consequences (e.g.,
destructive operations).
Convention for Storage Capacity Values
Physical storage capacity values (e.g., disk drive capacity) are calculated
based on the following values:
1
1
1
1
1
KB = 1,000 bytes
MB = 1,0002 bytes
GB = 1,0003 bytes
TB = 1,0004 bytes
PB = 1,0005 bytes
Logical storage capacity values (e.g., logical device capacity) are calculated
based on the following values:
1
1
1
1
1
1
KB = 1,024 bytes
MB = 1,0242 bytes
GB = 1,0243 bytes
TB = 1,0244 bytes
PB = 1,0245 bytes
block = 512 bytes
Preface
Hitachi Universal Storage Platform V/VM Hitachi Performance Manager User’s Guide
xi
Getting Help
If you need to call the Hitachi Data Systems Support Center, please provide as
much information about the problem as possible, including:
•
The circumstances surrounding the error or failure.
•
The content of any error message(s) displayed on the host system(s).
•
The content of any error message(s) displayed on Storage Navigator.
•
The USP V/VM Storage Navigator configuration information saved on
diskette using the FD Dump Tool (see the Storage Navigator User’s Guide).
•
The service information messages (SIMs), including reference codes and
severity levels, displayed by Storage Navigator.
The Hitachi Data Systems customer support staff is available 24 hours/day,
seven days a week. If you need technical support, please call:
•
United States: (800) 446-0744
•
Outside the United States: (858) 547-4526
Comments
Please send us your comments on this document. Make sure to include the
document title, number, and revision. Please refer to specific section(s) and
paragraph(s) whenever possible.
•
E-mail: [email protected]
•
Fax: 858-695-1186
•
Mail:
Technical Writing, M/S 35-10
Hitachi Data Systems
10277 Scripps Ranch Blvd.
San Diego, CA 92131
Thank you! (All comments become the property of Hitachi Data Systems
Corporation.)
xii
Preface
Hitachi Universal Storage Platform V/VM Hitachi Performance Manager User’s Guide
1
Overview of Performance Manager
The Hitachi Universal Storage Platform V and Hitachi Universal Storage
Platform VM (herein after referred to as USP V/VM) includes a suite of
performance management software products that allow you to monitor and
tune storage system performance.
The Performance Manager suite includes the following:
Performance Monitor
Server Priority Manager
Restrictions: The Auto Migration function is not supported in this version.
Overview of Performance Manager
Hitachi Universal Storage Platform V/VM Hitachi Performance Manager User’s Guide
1-1
Performance Monitor
Performance Monitor lets you obtain usage statistics about physical hard
disk drives, volumes, processors or other resources in your storage system.
Performance Monitor also lets you obtain statistics about workloads on disk
drives and traffic between hosts and the storage system. The Performance
Management window displays a line graph that indicates changes in the
usage rates, workloads, or traffic. You can view information in the window and
analyze trends in disk I/Os and detect peak I/O time. If system performance is
poor, you can use information in the window to detect bottlenecks in the
system.
When using Performance Monitor, you must specify the volumes to be
monitored in (control units).. Therefore, depending on your disk subsystem
configuration, the list may display performance statistics for some volumes
and not display performance statistics for other volumes. This can occur, if the
range of used CUs does not match the range of CUs monitored by Performance
Monitor.
To correctly display performance statistics of a parity group and a LUSE
volume, you must specify as follows:
1-2
•
Specify all volumes belonging to the parity group as the monitoring targets.
•
Specify all volumes making up the LUSE volume as the monitoring targets.
Overview of Performance Manager
Hitachi Universal Storage Platform V/VM Hitachi Performance Manager User’s Guide
Server Priority Manager
Server Priority Manager lets you tune the system to provide high-priority hosts
with relatively higher throughput. Server Priority Manager can prevent
production servers from suffering lowered performance. For details, see
Overview of Server Priority Manager.
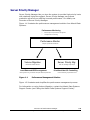
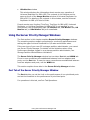
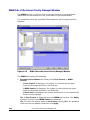
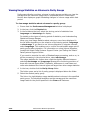
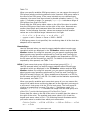
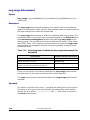
Figure 1-1 illustrates the performance management solution from Hitachi Data
Systems.
Performance Monitoring
•
•
Base component of performance management
Total performance monitoring
Performance Monitor
Analysis of performance bottleneck
Volume Migration
Server Priority Mgr
Host I./O controlling to specific port
Effective use of HDD resource
Load-Balanced HDD Arrangement
Prioritized Host I/O Controlling
Data migration tuning to maximize subsystem backend performance
Figure 1-1
Process scheduling to prioritized host I/O.
Performance Management Solution
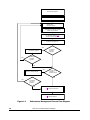
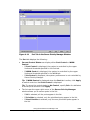
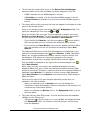
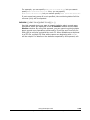
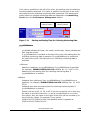
Figure 1-2 illustrates and simplifies the performance management process.
For information on using Volume Migration, contact the Hitachi Data Systems
Support Center (see Calling the Hitachi Data Systems Support Center).
Overview of Performance Manager
Hitachi Universal Storage Platform V/VM Hitachi Performance Manager User’s Guide
1-3
Start Storage Navigator
Start Performance Monitor
Set and Start
Monitoring Options
Use Performance Monitor to gather
system usage statistics.
Turn Monitoring Options (Long
Range or Short Range) off
Analyze data for low performance,
conduct trend analysis, etc.
YES
Is workload
balancing
required?
Use Volume Migration
Is additional
monitoring
required?
YES
NO
YES
Use Server Priority Manager
Is system tuning
required to
prioritized hosts?
NO
YES
Is additional
monitoring
required?
NO
Exit Performance Monitor
Exit Storage Navigator
Figure 1-2
1-4
Performance Management Process Flow Diagram
Overview of Performance Manager
Hitachi Universal Storage Platform V/VM Hitachi Performance Manager User’s Guide
2
About Performance Manager
Operations
This chapter gives an overview of performance manager operations.
Components
Overview of Performance Monitor
Overview of Server Priority Manager
Overview of Export Tool
Interoperability with Other Products
About Performance Manager Options
Hitachi Universal Storage Platform V/VM Hitachi Performance Manager User’s Guide
2-1
Components
To be able to use Performance Manager, you need:
•
The USP V/VM storage system.
•
The Performance Manager program products (At minimum, Performance
Monitor is required. Server Priority Manager is optional).
•
A WWW client computer connected to the USP V/VM storage system via
LAN.
To use Performance Manager, you must use the WWW client computer to log
on to the SVP. When you are logged on, the Storage Navigator program, which
is a Java™ applet, automatically downloads to the WWW client computer. You
can perform Performance Manager operations in the Storage Navigator
window.
For details about requirements for WWW client computers, see the Storage
Navigator User’s Guide.
Cautions:
If Performance Monitor is not enabled, you cannot use Server Priority
Manager.
Performance management operations (Performance Monitor and Server
Priority Manager) involve the collection of large amounts of monitoring
data. This requires considerable Web client computer memory. It is
therefore recommended that you exit the Storage Navigator program to
release system memory when not conducting performance management
operations.
2-2
About Performance Manager Options
Hitachi Universal Storage Platform V/VM Hitachi Performance Manager User’s Guide
Overview of Performance Monitor
Performance Monitor tracks your storage system and lets you obtain statistics
about the following:
•
resources in your storage system
•
workloads on disk and ports
If your system encounters some problem (for example, if server hosts suffer
delayed response times), Performance Monitor can help you detect the cause
of the problem.
Performance Monitor can also display the status of remote copies by TrueCopy,
TrueCopy for IBM z/OS, Universal Replicator, and Universal Replicator for IBM
z/OS. The displayed contents are the same as those displayed in the Usage
Monitor windows of each remote copy function.
The Export Tool enables you to save information on the Performance
Management window into files, so you can use spreadsheet or database
software to analyze the monitoring results. For detailed information about the
Export Tool, see Overview of Export Tool.
Understanding Statistical Storage Ranges
Performance Monitor has two kinds of periods (ranges) for collecting and
storing statistics: short range and long range. The difference of the two ranges
and the statistics at which they are targeted is as follows:
•
Storing in short range
If the number of CUs to be monitored is 64 or less, Performance Monitor
collects statistics at a user-specified interval that is between 1 and 15
minutes, and stores them between 1 and 15 days.
If the number of CUs to be monitored is 65 or more, Performance Monitor
collects statistics at a user-specified interval that is 5, 10 or 15 minutes,
and stores them between 8 hours and 1 day.
All the statistics that can be monitored by Performance Monitor are
collected and stored in short range.
•
Storing in long range
Performance Monitor collects statistics at fixed 15-minutes interval, and
stores them for 3 months (i.e., 93 days).
The usage statistics about resources in the storage system are collected
and stored also in long range, in parallel with in short range. However,
some of the usage statistics about resources cannot be collected in long
range.
About Performance Manager Options
Hitachi Universal Storage Platform V/VM Hitachi Performance Manager User’s Guide
2-3
Performance Management window can display the statistics within the
range of the storing periods above. You can specify a part of the storing period
to display the statistics on the lists and graphs of Performance Monitor.
All statistics, except some information related to Volume Migration, can be
displayed in short range (for the storing period corresponding to the setting for
the collecting interval) on Performance Management window. In addition,
usage statistics about resources in the storage system can be displayed in
both short range and long range because they are monitored in both ranges.
When you display usage statistics about resources, you can select the
displayed range.
For information on using Volume Migration, contact the Hitachi Data Systems
Support Center (see Calling the Hitachi Data Systems Support Center.
For more about statistics that can be monitored in short and long ranges, see
the description of Performance Management window in Performance
Monitor Window. For more about the relationship between collection interval
and the storing period of the statistics, see Monitoring Options Window.
Parity Group Usage Statistics
A parity group is a group of hard disk drives (HDDs) that form the basic unit of
storage for the USP V/VM storage system. All HDDs in a parity group must
have the same physical capacity. The USP V/VM supports three types of parity
groups as follows:
•
RAID-1 parity group
A RAID-1 parity group consists of two pairs of HDDs in a mirrored
configuration.
•
RAID-5 parity group
A RAID-5 parity group consists of four or eight HDDs. One of these HDDs is
used as a parity disk.
•
RAID-6 parity group
A RAID-6 parity group consists of eight HDDs. Two of these HDDs are used
as a parity disk.
If the monitor data shows overall high parity group usage, you should consider
installing additional HDDs and using Volume Migration to migrate the highusage volumes to the new parity groups. If the monitor data shows that parity
group usage is not balanced, you can use Volume Migration to migrate
volumes from high-usage parity groups to low-usage parity groups.
For information on using Volume Migration, contact the Hitachi Data Systems
Support Center (see Calling the Hitachi Data Systems Support Center.
For details on how to view usage statistics about parity groups, see Viewing
Usage Statistics on Parity Groups.
2-4
About Performance Manager Options
Hitachi Universal Storage Platform V/VM Hitachi Performance Manager User’s Guide
Volume Usage Statistics
Performance Monitor displays the average and maximum usage, including
sequential and random access, of each volume (LDEV) in a parity group. The
volume usage is the time in use (sequential and random access) of the
physical drives of each LDEV, averaged by the number of physical drives in the
parity group.
If the monitor data shows overall high volume usage, you should consider
installing additional hardware (e.g., HDDs, DKAs, cache). If the monitor data
shows that volume usage is not balanced, you can use Volume Migration to
migrate high-usage volumes to higher HDD classes and/or to lower-usage
parity groups. The volume usage data can also be used to analyze the access
characteristics of volumes and determine the appropriate RAID level and/or
HDD type for the volumes.
For information on using Volume Migration, contact the Hitachi Data Systems
Support Center (see Calling the Hitachi Data Systems Support Center.
For details on how to view usage statistics about volumes, see Viewing Usage
Statistics on Volumes in Parity Groups.
External Volume Group Usage Statistics
If the USP V/VM storage system is connected to an external storage system by
Universal Volume Manager, Performance Monitor can also monitor the usage
conditions on external hard disk drives.
When you use Universal Volume Manager to map the volumes in the external
storage system as volumes in the USP V/VM storage system, the mapped
volumes in the external storage system are called external volumes. These
external volumes are registered in groups by Universal Volume Manager.
Performance Monitor can monitor the usage conditions for external volume
groups.
An external volume group is just a group for managing external volumes.
Unlike a parity group, it does not contain any parity information. However,
some Performance Monitor windows treat external volume groups as parity
groups.
The information that can be monitored about an external volume group differs
from that of a usual parity group. For details on how to view usage conditions
about external volume groups, see Viewing Usage Statistics on External
Volume Groups.
About Performance Manager Options
Hitachi Universal Storage Platform V/VM Hitachi Performance Manager User’s Guide
2-5
External Volume Usage Statistics
An external volume is a volume existing in an external storage system that is
mapped to a volume in the USP V/VM storage system using Universal Volume
Manager. Performance Monitor can monitor and display the usage conditions
for external volumes.
The information that can be monitored for an external volume differs from that
of a typical volume. For details on how to view usage conditions about external
volumes, see Viewing Usage Statistics on External Volumes in External Volume
Groups.
Channel Processor Usage Statistics
A channel processor (CHP), which is contained in a channel adapter (CHA),
processes host commands and controls data transfer between hosts and the
cache. A channel adapter contains multiple channel processors that process
host commands and control data transfer. A channel adapter can also be called
port controller.
If monitoring data shows high overall CHP usage, you should consider
installing additional CHAs. If monitoring data shows that CHP usage is not
balanced, you should consider moving some devices that are defined on
overloaded ports to ports with lower-usage CHPs to balance front-end usage.
For details on how to view usage statistics about channel adapters and channel
processors groups, see Viewing Usage Statistics on Channel Processors.
Disk Processor Usage Statistics
A disk processor (DKP), which is contained in a disk adapter (DKA), controls
data transfer between the cache and the disk devices. A disk adapter contains
multiple disk processors (DKPs).
If monitor data shows high DKP usage overall, you should consider installing
additional HDDs and/or DKAs, and then using Volume Migration to migrate the
high-write-usage volumes (especially sequential writes) to the new parity
groups. If the monitor data shows that DKP usage is not balanced, you can
use Volume Migration to migrate volumes from high-usage parity groups to
low-usage parity groups.
For information on using Volume Migration, contact the Hitachi Data Systems
Support Center (see Calling the Hitachi Data Systems Support Center.
When considering migrating a volume from one parity group to another, take
the following steps:
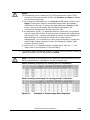
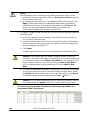
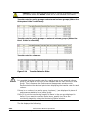
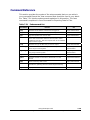
1. Refer to Table 2-1 to determine the parity groups from which you want to
migrate volumes.
2-6
About Performance Manager Options
Hitachi Universal Storage Platform V/VM Hitachi Performance Manager User’s Guide
The information in the table does not apply to the USP VM storage system
because USP VM has only one pair of DKA. If you are using USP VM and
you want to know usage rates of DKPs, check the usage rate of each parity
group . For details on how to view usage statistics about disk adapters and
disk processors, see Viewing Usage Statistics on Disk Processors.
2. Check the usage rate of each parity group to find parity groups whose
usage rate is lower than the parity groups that you want to migrate. It is
recommended you migrate volumes from higher-usage parity groups to
lower-usage parity groups.
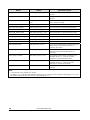
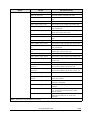
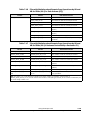
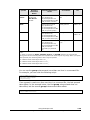
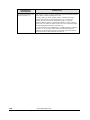
Table 2-1 Migrating Volumes in USP V Storage Systems When Disk
Processor Usage Rate is High
Cluster
Disk Adapter
1
DKA1AU
Disk Processor
Migrating Volumes in USP V Storage System
DKP40-1AU
Migrate volumes from parity groups with the following
IDs to another parity group:
DKP41-1AU
DKP42-1AU
DKP43-1AU
1
DKA-1BU
DKP50-1BU
DKP51-1BU
DKP52-1BU
DKP53-1BU
1
DKA-AL
DKP44-1AL
DKP45-1AL
DKP46-1AL
DKP47-1AL
1
DKA-BL
DKP54-1BL
DKP55-1BL
DKP56-1BL
DKP57-1BL
1
DKA-1LU
DKP60-1LU
DKP61-1LU
DKP62-1LU
DKP63-1LU
1
DKA-1KU
DKP70-1KU
DKP71-1KU
DKP72-1KU
DKP73-1KU
1
DKA-1LL
DKP64-1LL
DKP65-1LL
DKP66-1LL
DKP67-1LL
1-X
3-X
11-X
Migrate volumes from parity groups with the following
IDs to another parity group:
2-X
4-X
12-X
Migrate volumes from parity groups with the following
IDs to another parity group:
5-X
13-X
Migrate volumes from parity groups with the following
IDs to another parity group:
6-X
14-X
Migrate volumes from parity groups with the following
IDs to another parity group:
7-X
15-X
Migrate volumes from parity groups with the following
IDs to another parity group:
8-X
16-X
Migrate volumes from parity groups with the following
IDs to another parity group:
9-X
17-X
About Performance Manager Options
Hitachi Universal Storage Platform V/VM Hitachi Performance Manager User’s Guide
2-7
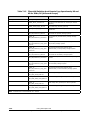
Cluster
Disk Adapter
Disk Processor
Migrating Volumes in USP V Storage System
1
DKA-1KL
DKP74-1KL
Migrate volumes from parity groups with the following
IDs to another parity group:
DKP75-1KL
DKP76-1KL
DKP77-1KL
2
DKA-2MU
DKPC0-2MU
DKPC1-2MU
DKPC2-2MU
DKPC3-2MU
2
DKA-2NU
DKPD0-2NU
DKPD1-2NU
DKPD2-2NU
DKPD3-2NU
2
DKA-2ML
DKPC4-2ML
DKPC5-2ML
DKPC6-2ML
DKPC7-2ML
2
DKA-2NL
DKPD4-2NL
DKPD5-2NL
DKPD6-2NL
DKPD7-2NL
2
DKA-2XU
DKPE0-2XU
DKPE1-2XU
DKPE2-2XU
DKPE3-2XU
2
DKA-2WU
DKPF0-2WU
DKPF1-2WU
DKPF2-2WU
DKPF3-2WU
2
DKA-2XL
DKPE4-2XL
DKPE5-2XL
DKPE6-2XL
DKPE7-2XL
2
DKA-2WL
DKPF4-2WL
DKPF5-2WL
DKPF6-2WL
DKPF7-2WL
10-X
18-X
Migrate volumes from parity groups with the following
IDs to another parity group:
1-X
3-X
11-X
Migrate volumes from parity groups with the following
IDs to another parity group:
2-X
4-X
12-X
Migrate volumes from parity groups with the following
IDs to another parity group:
5-X
13-X
Migrate volumes from parity groups with the following
IDs to another parity group:
6-X
14-X
Migrate volumes from parity groups with the following
IDs to another parity group:
7-X
15-X
Migrate volumes from parity groups with the following
IDs to another parity group:
8-X
16-X
Migrate volumes from parity groups with the following
IDs to another parity group:
9-X
17-X
Migrate volumes from parity groups with the following
IDs to another parity group:
10-X
18-X
Note: The letter "X" is a placeholder for numerical values. For example, "parity group 1-X"
indicates parity groups such as 1-1 and 1-2.
2-8
About Performance Manager Options
Hitachi Universal Storage Platform V/VM Hitachi Performance Manager User’s Guide
Volume Migration cannot estimate DKP usage, and may not provide any
performance improvement for cases in which DKP usage values vary only
slightly or for cases in which overall DRR usage values are relatively high.
Volume Migration is designed for use with obvious cases of high or unbalanced
DKP usage. For information on using Volume Migration, contact the Hitachi
Data Systems Support Center (see Calling the Hitachi Data Systems Support
Center.
DRR Processor Usage Statistics
A data recovery and reconstruction processor (DRR) is a microprocessor
(located on the DKAs) that is used to generate parity data for RAID-5 or RAID6 parity groups. The DRR uses the formula "old data + new data + old parity"
to generate new parity.
If the monitor data shows high DRR usage overall, this can indicate high write
penalty condition. Please consult your Hitachi Data Systems representative
about high write penalty conditions. If the monitor data shows that DRR usage
is not balanced, you should consider relocating volumes using Volume
Migration to balance DRR usage within the storage system.
For information on using Volume Migration, contact the Hitachi Data Systems
Support Center (see Calling the Hitachi Data Systems Support Center.
For details on how to view usage statistics on DRRs, see Viewing Usage
Statistics on Data Recovery and Reconstruction Processors.
Write Pending Rate and Cache Memory Usage Statistics
The write pending rate indicates the ratio of write-pending data to the cache
memory capacity. The Performance Management window displays the
average and the maximum write pending rate for the specified period of time.
When you display monitoring results in a short range, the window also displays
the average and the maximum usage statistics about the cache memory for
the specified period of time. In addition, the window can display a graph that
indicates how the write pending rate or the usage statistics of the cache
memory changed within that period.
For details on how to view the write pending rate and the usage statistics
about the cache memory, see Viewing Write Pending and Cache Memory
Usage Statistics.
About Performance Manager Options
Hitachi Universal Storage Platform V/VM Hitachi Performance Manager User’s Guide
2-9
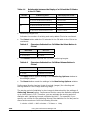
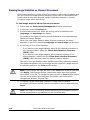
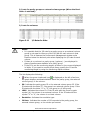
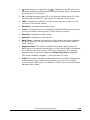
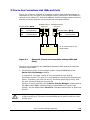
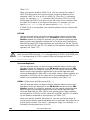
Access Path Usage Statistics
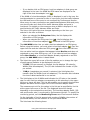
An access path is a path through which data and commands are transferred
within a storage system.
In a storage system, channel adapters control data transfer between hosts and
the cache memory. Disk adapters control data transfer between the cache
memory and hard disk drives. Data transfer does not occur between channel
adapters and disk adapters. Data is transferred via the cache switch (CSW) to
the cache memory.
When hosts issue commands, the commands are transferred via channel
adapters to the shared memory (SM). The content of the shared memory is
checked by disk adapters.
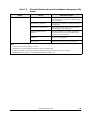
CHA
cache
memory
CHA
CHA
CHA
cache switch (CSW)
shared
memory
CHA: channel adapter
DKA
Figure 2-1
DKA
DKA
DKA
DKA: disk adapter
Access Paths
Performance Monitor tracks and displays the usage rate for the following
access paths.
•
Paths between channel adapters and the cache switch
•
Paths between disk adapters and the cache switch
•
Paths between the cache switch and the cache memory
•
Paths between channel adapters and the shared memory
•
Paths between disk adapters and the shared memory
For details on how to view usage statistics about access paths, see Viewing
Usage Statistics on Access Paths.
2-10
About Performance Manager Options
Hitachi Universal Storage Platform V/VM Hitachi Performance Manager User’s Guide
Hard Disk Drive Workload Statistics
If particular hard disk drives or data are heavily accessed, system performance
might deteriorate. Performance Monitor lets you view statistics about parity
groups and logical devices to help you detect bottlenecks in your system. If
you mapped volumes in an external storage system, Performance Monitor can
also monitor the access workloads of the external volume groups and the
external volumes. Performance Monitor displays a line graph indicating
changes in access workloads, so that you can detect the peak I/O access
times.
You will be unable to view workload statistics that expired a specific storing
period because such statistics are erased from the storage system. The storing
period of statistics is only short range (between 8 hours to 15 days) and that
changes depending on the collecting interval and the number of CUs to be
monitored specified by the user. For details on the storing period of statistics,
see Understanding Statistical Storage Ranges.
Workload information mainly displayed by Performance Monitor is as follows:
•
I/O rate
The I/O rate indicates how many I/Os are made to the hard disk drive in
one second. If the I/O rate is high, the hosts might consume a lot of time
for accessing disks and the response time might be long.
•
Transfer rate
The transfer rate indicates the size of data transferred to the hard disk
drive in one second. If the transfer rate is high, the hosts might consume a
lot of time for accessing disks and the response time might be long.
•
The read hit ratio
For a read I/O, when the requested data is already in cache, the operation
is classified as a read hit. For example, if ten read requests have been
made from hosts to devices in a given time period and the read data was
already on the cache memory three times out of ten, the read hit ratio for
that time period is 30 percent. A higher read hit ratio implies higher
processing speed because fewer data transfers are made between devices
and the cache memory.
•
The write hit ratio
For a write I/O, when the requested data is already in cache, the operation
is classified as a write hit. For example, if ten write requests were made
from hosts to devices in a given time period and the write data was already
on the cache memory three cases out of ten, the write hit ratio for that
time period is 30 percent. A higher write hit ratio implies higher processing
speed because fewer data transfers are made between devices and the
cache memory.
About Performance Manager Options
Hitachi Universal Storage Platform V/VM Hitachi Performance Manager User’s Guide
2-11
Apart from the items listed above, Performance Monitor also displays
additional information about hard disk drive workloads. For details on how to
view workload statistics about hard disk drives, see Monitoring Hard Disk
Drives.
Port Traffic Statistics
Performance Monitor tracks host ports and storage system ports to obtain
statistics about I/O rates and transfer rates at these ports. If you analyze
these I/O rates and transfer rates, you can determine which hosts issue a lot
of I/O requests to the disk and which hosts transfer a lot of data to the disk.
For details on how to view statistics about traffic at ports, see Monitoring
Ports.
You will be unable to view workload statistics that expired a specific storing
period because such statistics are erased from the storage system. The storing
period of statistics is only short range (between 8 hours to 15 days) and that
changes depending on the collecting interval specified by the user. For details
on the storing period of statistics, see Understanding Statistical Storage
Ranges.
Important: Performance Monitor can obtain statistics about traffics of ports
connected to open-system host groups only. The statistics about traffics of
ports connected to mainframe host groups cannot be obtained.
LU Paths Traffic Statistics
Performance Monitor tracks LU paths to obtain statistics about I/O rates and
transfer rates at these LU paths. If you analyze these I/O rates and transfer
rates, you can detect LU paths though which a lot of I/O requests are made to
the disk. You can also determine the LU paths through which a lot of data are
transferred to the disk. For details on how to view workload statistics about LU
paths, see Monitoring LU Paths.
You will be unable to view workload statistics that expired a specific storing
period because such statistics are erased from the storage system. The storing
period of statistics is only short range (between 8 hours to 15 days) and that
changes depending on the collecting interval specified by the user. For details
on the storing period of statistics, see Understanding Statistical Storage
Ranges.
The traffic statistics reported for an LU is aggregated across all LU paths
defined for an LU.
2-12
•
I/O rate is the sum of I/Os across all LU paths defined for an LU.
•
Transfer rate is the total transfer rate across all LU paths defined for an LU.
•
Response Time is the average response time across all LU paths defined
for an LU.
About Performance Manager Options
Hitachi Universal Storage Platform V/VM Hitachi Performance Manager User’s Guide
Traffic between HBAs and Storage System Ports
Host bus adapters (HBAs) are adapters contained in hosts. HBAs, which serve
as ports on hosts, are connected to ports on the storage system.
If Server Priority Manager is enabled, Performance Monitor lets you view
statistics about traffic between HBAs and storage system ports. The traffic
statistics reveals the number of I/O requests that have been made from hosts
and also reveals the size of data transferred between hosts and storage
system ports. For details on how to view traffic statistics about HBAs, see
Viewing HBA Information.
Statistics can be stored for time periods of 8 hours or up to 15 days, and
changes depending on the collecting interval specified. Statistics that have
expired are erased from the storage system. For details on the storing period
of statistics, see Understanding Statistical Storage Ranges.
Overview of Server Priority Manager
When Server Priority Manager is used, I/O operations from hosts requiring
high performance are given higher priority over I/O operations from other
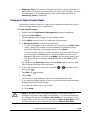
hosts.
Performance of High-Priority Hosts
In an SAN (storage area network) environment, the storage system is usually
connected with a lot of host servers. Some types of the host servers often
require high performance but others might not require as high performance.
For example, production servers usually require high performance. Production
servers, which include database servers and application servers, are used to
perform daily tasks of business organizations. If production servers suffer
lowered performance, productivity in business activities is likely to be
damaged. For this reason, the system administrator needs to maintain
performance of production servers at a higher level.
Computer systems in business organizations often include development
servers as well as production servers. Development servers are used for
developing, testing and debugging business applications. If development
servers suffer lowered performance, it would bring undesirable results to
developers. However, a decline in development server performance would not
bring as much negative impact to the entire organization as a decline in
production server performance. In this sense, production servers should be
given higher priority over development servers.
About Performance Manager Options
Hitachi Universal Storage Platform V/VM Hitachi Performance Manager User’s Guide
2-13
Server Priority Manager allows you to limit the number of I/Os requests from
development servers to the storage system. Server Priority Manager also
allows you to limit the size of data that should be transferred between the
development servers and the storage system. Production servers can expect
reduced response time. Production server performance can be maintained at a
higher level.
Throughout this document, the term upper limit control is used to refer to an
act of limiting performance of low-priority host servers in order to maintain
high-priority host servers at a higher level.
Upper-Limit Control
Upper-limit control can help production servers to perform at higher levels, but
it is not necessarily useful when production servers are not busy.
For example, if the number of I/Os from production servers greatly increases
from 9:00 a.m. to 3:00 p.m. and decreases significantly after 3:00 p.m.,
upper-limit control would suppress performance of development servers even
after 3:00 p.m. Development servers should be free from upper-limit control
when production servers are not busy.
Server Priority Manager provides a function called threshold control. If
threshold control is used, upper limit control is automatically disabled when
traffic between production servers and the storage system decreases to a
certain level. A threshold is a value that indicates the timing at which upper
limit control is disabled. For example, if a threshold of 500 IO/s (500 I/Os per
second) is applied to the entire storage system, development servers are free
from the limit on the I/O rate (i.e. the number of I/Os per second) when the
number of I/Os from all the production servers is below 500 IO/s. If the
number of I/Os from the production servers increases and exceeds 500 IO/s,
upper limit control is restored to limit the number of I/Os from the
development servers again.
The threshold can be used to control the I/O rate (the number of I/Os per
second) or the transfer rate (the size of data transferred per second). For
example, if a threshold of 20 MB/s (20 megabytes per second) is set to a
storage system, the I/O rate limit for development servers is disabled when
the amount of data transferred between the storage system and all the
production servers is below 20 MB/s.
2-14
About Performance Manager Options
Hitachi Universal Storage Platform V/VM Hitachi Performance Manager User’s Guide
Overview of Export Tool
The Export Tool enables you to export monitoring data (i.e., statistics) that
can display in the Performance Management window to text files. The
Export Tool also enables you to export monitoring data on remote copy
operations performed by TrueCopy, TrueCopy for IBM z/OS, Universal
Replicator, and Universal Replicator for IBM z/OS. If you export monitoring
data to text files, you can import the monitoring data into word processor
documents. You can also import the monitoring data into spreadsheet or
database software to analyze the monitoring data.
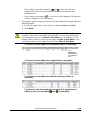
Figure 2-2 is an example of a text file imported into spreadsheet software:
Transfer rates for LUs (Filename: LU_IOPS.csv)
Indicates that the subsystem serial number is 60001.
The word in parentheses is a code that indicates the subsystem type.
Indicates that the data was obtained from 18:57 to 19:01 on March 28,
2007. Sampling rate: 1 indicates that monitoring was performed
every minute (at a one-minute interval).
Indicates monitoring data. If a value is -1, the value indicates
that Performance Monitor failed to obtain the data for some
reason. For detailed information, refer to the troubleshooting
information later in this appendix.
Notes:
•
In this LU_IOPS.csv file, the last four digits of a table column heading (such as 0001 and 0002) indicate an
LUN. For example, the heading CL1-A.00(1A-G00).0001 indicates the port CL1-A, the host group ID 00, the
host group name 1A-G00, and the LUN 0001.
• If you export monitoring data about concatenated parity groups, the resulting CSV file do not contain column
headings for the concatenated parity groups. For example, if you export monitoring data about a
concatenated parity group named 1-3[1-4], you will be unable to find 1-3[1-4] in column headings. To locate
monitoring data about 1-3[1-4], find the 1-3 column or the 1-4 column. Either of these columns contains
monitoring data about 1-3[1-4].
Figure 2-2
Example of a Text File
About Performance Manager Options
Hitachi Universal Storage Platform V/VM Hitachi Performance Manager User’s Guide
2-15
Notes:
When you run the Export Tool, text files are usually compressed in a ZIPformat archive file. To be able to open a text file, you must use decompress
the ZIP file to extract the text files.
Text files are in CSV (comma-separated value) format, in which values are
delimited by commas. Many spreadsheet applications can be used to open
CSV files.
Do not run multiple instances of the Export Tool simultaneously. If you run
multiple instances, the SVP may be overloaded and a timeout error may
occur.
2-16
About Performance Manager Options
Hitachi Universal Storage Platform V/VM Hitachi Performance Manager User’s Guide
Interoperability with Other Products
Performance Monitor
Keep the following in mind while viewing Performance Management
windows.
•
User types
If the user type of your user ID is storage partition administrator, the
functions you can use are limited. For details, see Storage Partition
Administrators Limitations.
•
Maintenance
If the storage system is undergoing maintenance during monitoring, the
monitoring data might contain extremely large values.
•
Powering off the storage system
If the storage system is powered off during monitoring, monitoring stops
while the storage system is powered off. When the storage system is
powered up again, monitoring continues. However, Performance Monitor
cannot display information about the period while the storage system is
powered off. Therefore, the monitoring data immediately after powering on
again might contain extremely large values.
•
•
Viewing the Physical tab
–
You will be able to view usage statistics that have been obtained for the
last three months (i.e., 93 days) in long-range monitoring, and for the
last 15 days in short-range monitoring. You will not be able to view
usage statistics that expired after these storing periods because such
statistics are erased from the storage system.
–
In short range, if I/O workloads between hosts and the storage system
become heavy, the storage system gives higher priority to I/O
processing than monitoring processing, therefore, a part of monitoring
data might be missing. In case that monitoring data are missing
frequently, use the Gathering Interval option in the Monitoring Options
window to change the collection interval longer. For details, see Start
Monitoring and Monitoring Options Window.
–
Short-range monitoring data and long-range monitoring data may have
some margin of error.
Viewing the LDEV, Port-LUN, and WWN tab
–
Monitoring results are stored for the last 8 hours to 15 days depending
on the specified gathering interval. If the storing period has passed
since a monitoring result was obtained, the result is erased from the
storage system and you will not be able to view that monitoring result.
About Performance Manager Options
Hitachi Universal Storage Platform V/VM Hitachi Performance Manager User’s Guide
2-17
•
–
If I/O workloads between hosts and the storage system become heavy,
the storage system gives higher priority to I/O processing than
monitoring processing, therefore, a part of monitoring data might be
missing. In case that monitoring data are missing frequently, use the
Gathering Interval option in the Monitoring Options window to
change the collection interval longer. For details, see Start Monitoring
and Monitoring Options Window.
–
The statistics of monitoring data of pool volumes is included in the
statistics of monitoring data of V-VOLs. For this reason, the pool
volumes are not displayed in LDEV tab.
Viewing the WWN tab
To start monitoring traffic between host bus adapters and storage system
ports, you must make settings before starting monitoring. For details, see
Monitoring All Traffic between HBAs and Ports and Setting Priority for Host
Bus Adapters.
•
•
Displaying monitoring data
–
In lists of the Performance Management window contents, a hyphen
(-) might be displayed in monitoring data columns. It means that the
statistics of that monitoring item cannot be collected.
–
If the SVP is overloaded, more time than the gathering interval allots
might be required for updating the display of monitoring data. In this
case, some portion of monitoring data will not be displayed in the
window. For example, suppose that the gathering interval is 1 minute.
In this case, if the display in the Performance Management window
is updated at 9:00 and the next update occurs at 9:02, the window
(including the graph) does not display the monitoring result for the
period of 9:00 to 9:01. This situation occurs when you use a Storage
Navigator computer, as well as when the SVP is used to perform
maintenance operations for the DKC.
–
After you set Monitoring Switch to Enable, the SVP might be
overloaded for up to 15 minutes if Performance Monitor receives a
couple of data items.
–
After LDEVs are installed or CUs to be monitored are added, the SVP
might be overloaded for up to 15 minutes if Performance Monitor
receives a couple of data items.
Replacing the microprogram
After the microprogram was replaced, the monitoring data is not stored
until a service engineer releases the SVP from Modify mode. Therefore,
inaccurate monitoring data may be displayed temporarily.
Server Priority Manager
•
2-18
User types. If the user type of your user ID is storage partition
administrator, you cannot use Server Priority Manager. For details on the
limitations when using Performance Manager logged in as a storage
partition administrator, see Storage Partition Administrators Limitations.
About Performance Manager Options
Hitachi Universal Storage Platform V/VM Hitachi Performance Manager User’s Guide
•
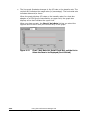
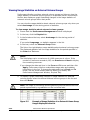
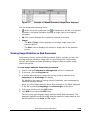
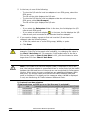
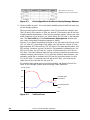
I/O rates and transfer rates. Server Priority Manager runs based on I/O
rates and transfer rates measured by Performance Monitor. Performance
Monitor measures I/O rates and transfer rates every second, and calculates
the average I/O rate and the average transfer rate for every gathering
interval (specified between 1 and 15 minutes) regularly.
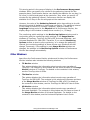
Suppose that 1 minute is specified as the gathering interval and the I/O
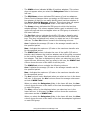
rate at the port 1-A changes as illustrated in Graph 1 in Figure 2-3. When
you use Performance Monitor to display the I/O rate graph for 1A, the line
in the graph indicates changes in the average I/O rate calculated every
minute (refer to Graph 2). If you select the Detail check box in the
Performance Management windows, the graph displays changes in the
maximum, average, and minimum I/O rates in one minute.
Server Priority Manager applies upper limits and thresholds to the average
I/O rate or the average transfer rate calculated every gathering interval.
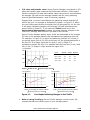
For example, in Figure 2-3 in which the gathering interval is 1 minute, if
you set an upper limit of 150 IO/s to the port 1A, the highest data point in
the line CL1-A in Graph 2 and the line Ave.(1 min) in Graph 3 is
somewhere around 150 IO/s. It is possible that the lines Max (1 min.) and
Min (1 min.) in Graph 3 might exceed the upper limit.
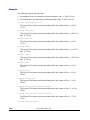
I/O rate(IOPS)
400
Period
300
200
CL1-A
Minimum
Average
Maximum
08:00 - 08:01
100
160
200
08:01 - 08:02
130
180
250
08:02 - 08:03
200
225
250
08:03 - 08:04
200
250
300
100
time
08:00 08:01 08:02 08:03 08:04
Graph 1: Actual I/O rate (measured every second)
I/O rate(IOPS)
I/O rate(IOPS)
400
400
300
300
Max.(1min.)
200
200
Ave.(1min.)
Min.(1min.)
100
100
CL1-A
08:00 08:01 08:02 08:03 08:04
08:00 08:01 08:02 08:03 08:04
time
Graph 2: I/O rate displayed in Performance Monitor
Graph 3: I/O rate displayed in Performance Monitor
(The Detail check box is not selected)
(The Detail check box is selected)
Figure 2-3
•
time
Line Graphs Indicating Changes in Port Traffic
Note on using TrueCopy: Server Priority Manager monitors write I/O
requests issued from initiator ports of your storage system.
About Performance Manager Options
Hitachi Universal Storage Platform V/VM Hitachi Performance Manager User’s Guide
2-19
•
Note on using the remote copy functions: When the remote copy
functions (TrueCopy, TrueCopy for IBM z/OS, Universal Replicator, and
Universal Replicator for IBM z/OS) are used in your environment, Server
Priority Manager monitors write I/O requests issued from initiator ports of
your storage system.
If you specify an RCU target port as a prioritized port, I/O requests from
the initiator port will not be a target of threshold control.
If you specify an RCU target port as a non-prioritized port, I/O requests
from the initiator port will not be a target of upper limit control.
•
Note on the statistics of Initiator/External ports: The initiator ports
and external ports of your storage subsystem are not controlled by Server
Priority Manager. Although you can set Prioritize or Non-Prioritize to
initiator ports and external ports by using Server Priority Manager, the
initiator ports and the external ports become the prioritized ports that are
not under threshold control, regardless of whether the setting of the ports
are Prioritize or Non-Prioritize. If the port attributes are changed from
Initiator/External into Target/RCU Target, the settings by Server Priority
Manager take effect instantly and the ports are subject to threshold or
upper limit control.
The statistics of All Prio. and All Non-Prio. that is indicated in the PortLUN tab of Performance Management windows are sum total of
statistics on Target/RCU Target ports that are controlled by Server Priority
Manager. The statistics of All Prio. and All Non-Prio. does not include the
statistics of Initiator/External ports. Because the statistics of
Initiator/External ports and Target/RCU Target ports are based on different
calculation methods, it is impossible to sum up the statistics of
Initiator/External ports and Target/RCU Target ports.
2-20
About Performance Manager Options
Hitachi Universal Storage Platform V/VM Hitachi Performance Manager User’s Guide
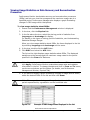
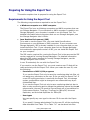
3
Preparing for Performance Manager
Operations
This chapter explains the preparations for performance manager operations.
System Requirements
Storage Partition Administrators Limitations
Preparing for Performance Manager Operations
Hitachi Universal Storage Platform V/VM Hitachi Performance Manager User’s Guide
3-1
System Requirements
To use Performance Manager, you need:
•
USP V/VM storage system
•
Performance Manager software (Server Priority Manager is optional, but
Performance Monitor is required)
•
A Web client computer (intended for use as a Storage Navigator) connected
to USP V/VM via LAN.
To use Performance Manager, you use the Web client computer to log on to
the SVP (Web server). When you are logged on, the Storage Navigator
program, which is a Java application program, will be downloaded to the Web
client computer. You can then perform Performance Monitor operations in the
Storage Navigator window.
For a summary of Web client computer requirements, see the Storage
Navigator User’s Guide.
Performance Manager operations require the Storage Navigator program,
which is downloaded to your WWW client computer. Your WWW client
computer must be connected to the USP V/VM storage system via LAN.
Browser settings are also required on your WWW client computer. For details,
see the Storage Navigator User’s Guide.
Caution: Performance Manager operations (Performance Monitor and Server
Priority Manager) involve the collection of large amounts of monitoring data.
This requires considerable Web client computer memory. It is therefore
recommended that you exit the Storage Navigator program to release system
memory when not conducting Performance Manager operations.
For details on how to install Performance Monitor and Server Priority Manager,
see the Storage Navigator User’s Guide.
3-2
Preparing for Performance Manager Operations
Hitachi Universal Storage Platform V/VM Hitachi Performance Manager User’s Guide
Storage Partition Administrators Limitations
If your user ID is of the storage partition administrator type, you can use only
Performance Monitor and the Export Tool among Performance Manager
programs. Server Priority Manager is not available to storage partition
administrators.
This section explains the permission-driven limitations of Performance Monitor
and the Export Tool.
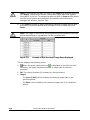
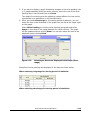
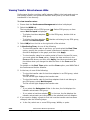
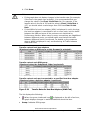
Performance Monitor Limitations
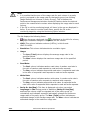
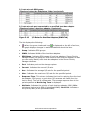
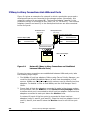
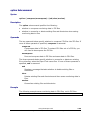
The Performance Monitor functions, which are limited when you logged in as a
storage partition administrator, are shown in Table 3-1. For the window of
Performance Monitor displayed when you logged in as a storage partition
administrator, see Figure 3-1.
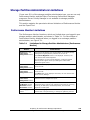
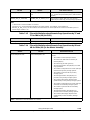
Table 3-1
Limitations for Storage Partition Administrators (Performance
Monitor)
Window
Limited function
Physical tab in the
Performance
Management window
The tree and list display only the information in the SLPR (storage
management logical partition) allocated to the user ID.
The Volume Migration button is not displayed. Therefore, the
user cannot start Volume Migration.
For information on using Volume Migration, contact the Hitachi
Data Systems Support Center (see Calling the Hitachi Data
Systems Support Center.
LDEV tab in the
Performance
Management window
The tree and list display only the information in the SLPR allocated
to the user ID.
Port-LUN tab in the
Performance
Management window
The tree and list display only the information in the SLPR allocated
to the user ID.
WWN tab in the
Performance
Management window
The WWN tab is not displayed. The user cannot view the traffics
between host bus adapters and ports.
TC Monitor window
TCz Monitor window
UR Monitor window
URz Monitor window
These windows are not displayed. The user cannot view the
information about remote copy operations performed by TrueCopy,
TrueCopy for IBM z/OS, Universal Replicator, and Universal
Replicator for IBM z/OS.
Monitoring Options
window
The Monitoring Options windows are not displayed. The user
cannot start or stop monitoring, or change the gathering interval.
The SPM button is not displayed. Therefore, the user cannot start
Server Priority Manager.
Preparing for Performance Manager Operations
Hitachi Universal Storage Platform V/VM Hitachi Performance Manager User’s Guide
3-3
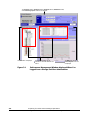
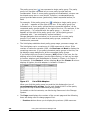
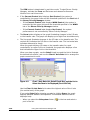
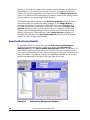
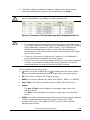
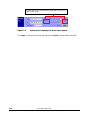
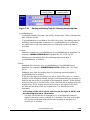
The TC Monitor window, TCz Monitor window, UR Monitor window, URz Monitor window,
and the Monitoring Options window are not displayed.
The WWN tab is not displayed.
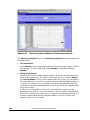
Figure 3-1
3-4
The tree and list display only the
information in the SLPR allocated to the
user ID.
The SPM button and the
Volume Migration button are
not displayed.
Performance Management Window displayed When You
Logged in as a Storage Partition Administrator
Preparing for Performance Manager Operations
Hitachi Universal Storage Platform V/VM Hitachi Performance Manager User’s Guide
Export Tool Limitations
The Export Tool functions which are limited when you logged in as a storage
partition administrator are as follows:
•
Only the monitoring data about SLPR allocated to the user ID can be
exported into files.
•
When a storage partition administrator use the group subcommand with
specifying the PPCG or PPCGWWN operand to export the monitoring data
about SPM groups or the host bus adapters belonging to these SPM groups,
an error will occur in the following conditions:
–
One SPM group contains multiple host bus adapters which are allocated
to different SLPRs.
–
One host bus adapter is connected to multiple ports which exist in
different SLPRs.
•
The monitoring data about remote copy operations performed by TrueCopy,
TrueCopy for IBM z/OS, Universal Replicator, and Universal Replicator for
IBM z/OS cannot be exported.
•
A storage partition administrator cannot use the set subcommand to start
or stop monitoring, or change the gathering interval.
Preparing for Performance Manager Operations
Hitachi Universal Storage Platform V/VM Hitachi Performance Manager User’s Guide
3-5
3-6
Preparing for Performance Manager Operations
Hitachi Universal Storage Platform V/VM Hitachi Performance Manager User’s Guide
4
Using the Performance Manager GUI
This chapter explains performance manager windows.
Using the Performance Monitor Windows
Using the Server Priority Manager Windows
Using the Performance Manager GUI
Hitachi Universal Storage Platform V/VM Hitachi Performance Manager User’s Guide
4-1
Using the Performance Monitor Windows
This chapter describes Performance Management windows and operations.
This chapter explains in the following order: each window of Performance
Monitor, the procedure for starting and stopping monitoring, and various
operations about obtaining and viewing statistics such as resource usage.
Caution: If the user type of your user ID is storage partition administrator,
the functions you can use are limited. For details, see Storage Partition
Administrators Limitations.
Performance Monitor Window
Performance Monitor has the following windows:
•
Performance Management window
This window displays the monitoring results about the storage system
performance collected by Performance Monitor. You can change the
information to be viewed by selecting each tab in the tree. The information
displayed by selecting each tab is as follows:
–
Physical tab
Displays the usage statistics about resources in the storage system.
–
LDEV tab
Displays the statistics about workload on disks.
–
Port-LUN tab
Displays the statistics about traffic at ports and LU paths in the storage
system.
–
WWN tab
Displays the statistics about traffic at path between host bus adapters
and ports.
This section explains the contents of the tabs in the Performance
Management window and the contents of the Monitoring Options window.
4-2
Using the Performance Manager GUI
Hitachi Universal Storage Platform V/VM Hitachi Performance Manager User’s Guide
Performance Management Window, Physical Tab
When you click Go, Performance Manager and then Performance
Management on the menu bar of the Storage Navigator main window,
Performance Monitor starts and the Performance Management window is
active. The Performance Management window includes the Physical tab,
which lets you view usage rates for parity groups, volumes, channel
processors, disk processors, etc. In addition, when you use Universal Volume
Manager to map volumes in an external storage system (storage system other
than USP V/VM) to the internal volumes, the Physical tab also lets you view
usage conditions of volumes in the external storage system (i.e., external
volumes) and the groups of external volumes.
For details on how to use this window, see Monitoring Resources in the
Storage System.
Figure 4-1
Physical Tab of the Performance Management Window
When the Physical tab is active, the Performance Management window
contains the following items:
•
When Monitoring Switch is Enable, Performance Monitor is monitoring
the storage system (Disable indicates that the storage system is not being
monitored).
Using the Performance Manager GUI
Hitachi Universal Storage Platform V/VM Hitachi Performance Manager User’s Guide
4-3
•
Gathering Interval indicates the interval of collecting statistics in short
range monitoring. For example, if the number of the CUs to be monitored
is 64 or less, and 1 min. is displayed and shortrange is selected as the
storing period of statistics, the list and graph in the Physical tab display
the statistics obtained every one minute. In case 65 or more CUs are
monitored, the statistics are displayed every 5, 10 or 15 minutes.
The gathering interval in long range monitoring is fixed to 15 minutes. If
you select longrange as the storing period of statistics, the list and graph
display the statistics obtained every 15 minutes regardless of the value of
Gathering Interval. For details on the storing period of statistics (short
range and long range), see Understanding Statistical Storage Ranges.
•
From the list on the right of Monitoring Data, select a range of statistics
to view in the window: shortrange or longrange.
Figure 4-2
Storing Period of Statistics (Physical Tab)
The storing period of statistics is the range of monitoring data (statistics
collected by monitoring) that can be displayed. You can specify a part of
term within the selected range to narrow the statistics to be displayed in
the list and graph on the Performance Management window.
The differences in selecting shortrange and longrange are described in
Long-Range Storage and Short-Range Storage.
•
Monitoring Term lets you narrow the range of usage statistics that should
be displayed in the window.
Starting and ending times for collecting statistics are displayed on both
sides of the slide bar. Performance Monitor stores the monitoring data
between these times, and you can specify the desired term within this
range as the target of display in lists and graphs.
For example, if you want to view usage statistics within the range of 10:30
July 1 2006 to 22:30 July 31 2006, you set 2006/07/01 10:30 to the From box,
set 2006/07/31 22:30 to the To box, and then click Apply.
To set a date and time in From and To, do either of the following:
4-4
–
Move the slider to the left or to the right.
–
In the text box, select the number that you want to change. Next, click
the upward or downward arrow button.
Using the Performance Manager GUI
Hitachi Universal Storage Platform V/VM Hitachi Performance Manager User’s Guide
When you specify dates and time in From and To, Performance Monitor
calculates the length of the specified period and displays the calculated
length. The length of the period is displayed in days when you select
longrange, and it is displayed in minutes when you select shortrange.
Notes:
From and To are unavailable if the monitoring data (that is, usage
statistics) is not stored in the storage system.
The Real Time option is unavailable when the Physical tab is active.
•
In the Monitoring Data area, the list on the upper right specifies the type
of statistics to be displayed in the window. When the Physical tab is
active, the list contains only one entry (i.e., Usage).
•
The tree lists items such as parity groups, channel adapters (CHAs). The
tree can display the following items.
–
Icon displayed below the Parity Group or External Group folder:
a parity group or an external volume group
–
Icons displayed below the CHA folder:
*
an ESCON channel adapter
*
a FICON channel adapter
*
a Fibre Channel adapter in Standard mode
*
a Fibre Channel adapter in High Speed mode
*
a Fibre Channel adapter in Initiator/External MIX mode
* The channel adapter number and number of ports that displayed on the right side of the
icon are examples.
–
Icons displayed below the DKA folder:
a disk processor (DKP)
a data recovery and reconstruction processor (DRR)
–
Icon displayed below the Access Path Usage folder:
an access path
No icon is displayed below the Cache folder.
The numbers on the right of icons ( ) displayed below the Parity Group
or External Group folder are IDs of parity groups or external volume
groups. The letter "E" at the beginning of an ID indicates that the group is
an external volume group.
A volume existing in an external storage system and mapped to a volume
in the USP V/VM storage system by using Universal Volume Manager is
called an external volume. An external volume group is a quantity of
external volumes grouped together for managing and that do not contain
any parity information, unlike a parity group. However, Performance
Management window treats external volume groups same as parity
groups for convenience.
Using the Performance Manager GUI
Hitachi Universal Storage Platform V/VM Hitachi Performance Manager User’s Guide
4-5
The parity group icon ( ) can represent a single parity group. The parity
group icon can also represent two or more parity groups that are
concatenated. If two or more parity groups are concatenated, volumes can
be striped across two or more drives. Therefore, concatenated parity
groups provide faster access (particularly, faster sequential access) to
data.
For example, if the parity group icon ( ) indicates a single parity group 13, the text 1-3 appears on the right of the icon. If the parity group icon
indicates two or more parity groups that are connected together, all the
connected parity groups appear on the right of the icon. For example, if the
parity group 1-3 is connected with the parity group 1-4, the text 1-3[1-4]
appears on the right of the parity group icon. (All the parity groups
connected with 1-3 are enclosed by square brackets).
Storage Navigator does not allow you to connect two or more parity
groups. If you want to use connected parity groups, contact the
maintenance personnel.
•
The list displays statistics about parity group usage, processor usage, etc.
The list displays up to a maximum of 4,096 resources at a time. If the
number of resources exceeds 4,096, use Previous and Next to display the
remaining resources. If you select connected parity groups in the tree, the
list displays usage statistics for all the connected parity groups.
If you select the Array Control Processor (ACP) folder in the tree, the list
displays a list of disk adapters (see the figure below), so that you are able
to confirm whether each disk adapter is located in Cluster-1 or Cluster-2.
For example, if the Cluster-1 column displays 0 and the Cluster-2 column
displays a hyphen, the disk adapter is located in Cluster-1.
Figure 4-3
List of Disk Adapters
When you click the parity group icon and the list displays the icon of
concatenated parity groups, the list only displays the ID of the parity
group at the top of the concatenated parity groups.
For details on the list contents, see Monitoring Resources in the Storage
System.
•
The Page area displays the number of the current page and the following
items are being used to change pages of list.
–
4-6
Previous button allows you to display the previous 4,096 resources.
Using the Performance Manager GUI
Hitachi Universal Storage Platform V/VM Hitachi Performance Manager User’s Guide
–
N/M list: The N displays the number of the current page. The M
displays total number of pages. Use the list to choose the number of the
page to display.
–
Next button allows you to display the next 4,096 resources.
•
The Volume Migration button starts the Volume Migration if that program
is enabled and longrange is specified for the display range. Volume
Migration lets you optimize hard disk drive performance. For information on
using Volume Migration, contact the Hitachi Data Systems Support Center
(see Calling the Hitachi Data Systems Support Center.
•
The Draw button displays a line graph illustrating changes in usage
statistics. The graph can display up to eight lines simultaneously.
•
The line graph illustrates changes in usage statistics. The vertical axis
indicates the usage rates (in percentage). The horizontal axis indicates
dates and/or times.
If you select connected parity groups in the tree, the graph displays
changes in usage statistics for all the connected parity groups.
When you illustrate a graph of the following information with specifying
shortrange, you can select an item to be displayed in the graph from the
list on the upper-right of the graph:
–
Information of external volume groups or external volumes.
–
Information of cache memory (write pending rates or usage statistics
about cache memory).
In addition, when you display information of external volume groups or
external volumes, you can select the highest value of the Y-axis (the
vertical axis) of the graph at the Chart Y Axis Rate list on the upper left
of the graph.
Figure 4-4 shows how to select an item displayed in the graph and how to
select the highest value of the Y-axis.
Figure 4-4
Selecting an Item Displayed in the Graph and the Highest
Value of the Y-Axis (Physical Tab)
Using the Performance Manager GUI
Hitachi Universal Storage Platform V/VM Hitachi Performance Manager User’s Guide
4-7
If you select an item to be displayed from the list before clicking Draw, the
graph shows the selected item. After drawing, if you select another item
from the list, the graph will be updated without re-clicking Draw.
Depending upon the values of the selected item, arrange the graph by
changing the highest value of the Y-axis.
Long-Range Storage
When longrange is selected, the Performance Management window
displays the statistics collected and stored in long range. The usage statistics
about resources for 3 months (i.e., 93 days) collected every 15 minutes can
be displayed in the window.
When longrange is selected, the Volume Migration button is activated. The
system administrator can start Volume Migration to migrate volumes for
balancing workloads based on the monitoring results displayed in the
Performance Management window. For information on using Volume
Migration, contact the Hitachi Data Systems Support Center (see Calling the
Hitachi Data Systems Support Center.
When longrange is selected:
•
The value displayed at Gathering Interval is ineffective. The gathering
interval is fixed to 15 minutes regardless of the displayed value.
•
You cannot view the statistics of external volume groups and external
volumes, and hyphens (-) appear in the list instead of these values. In this
case, you cannot draw the graph. To view this data, select shortrange.
For details on viewing the usage statistics of external volume groups and
external volumes, see Viewing Usage Statistics on External Volume Groups
and Viewing Usage Statistics on External Volumes in External Volume
Groups.
•
You cannot view the ratio of ShadowImage processing, and so on, to all
processing, and the usage statistics about cache memory. For details on
"the ratio of ShadowImage processing, and so on, to all processing", see
the description about the ShadowImage column in Viewing Usage
Statistics on Volumes in Parity Groups.
Short-Range Storage
When shortrange is selected, the Performance Management window
displays the statistics collected and stored in short range. The usage statistics
about resources are collected with the interval indicated by Gathering
Interval. The storing period of statistics, which is equivalent to the range of
monitoring data that can be displayed, changes between 8 hours and 15 days
depending on the gathering interval.
When shortrange is selected, the Volume Migration button is deactivated.
In addition, estimated usage rates of volumes after migration by Volume
Migration cannot be displayed.
4-8
Using the Performance Manager GUI
Hitachi Universal Storage Platform V/VM Hitachi Performance Manager User’s Guide
The usage statistics for a same term might be slightly different between
selecting shortrange and longrange because the monitoring precision of
these two interval types differs.
For details on the types of storing period of statistics, see Understanding
Statistical Storage Ranges. For details on the relationship between collection
interval and the storing period of the statistics, see Monitoring Options Window.
LDEV Tab of the Performance Monitor Window
When you click Go, Performance Manager and then Performance
Management on the menu bar of the Storage Navigator main window ,
Performance Monitor starts and the Performance Management window is
active. The Performance Management window includes the LDEV tab,
which lets you view statistics about disk access performance. For example, the
window displays the I/O rate (the number of I/Os per second), the transfer
rate (the size of data transferred per second), the average response time for
parity groups and volumes.
For details on how to use this window, see Monitoring Hard Disk Drives.
Figure 4-5
LDEV Tab of the Performance Management Window
When the LDEV tab is active, the Performance Management window
contains the following items:
Using the Performance Manager GUI
Hitachi Universal Storage Platform V/VM Hitachi Performance Manager User’s Guide
4-9
•
When Monitoring Switch is Enable, Performance Monitor is monitoring
the storage system (a Disable setting indicates that the system is not
being monitored).
•
Gathering Interval displays a number between 1 and 15 to indicate how
often data collection is performed. If the number of the CUs to be
monitored is 64 or less, the value between 1 and 15 appears as a gathering
interval by minutes. For example, if 1 min. is displayed, the information
obtained every one minute is displayed in the list and the graph. In case 65
or more CUs are monitored, the statistics are displayed every 5, 10 or 15
minutes.
•
The list on the right of Monitoring Data indicates storing period of
statistics (monitoring data). The statistics displayed in the LDEV tab are
stored only in short range, therefore, shortrange is displayed in this list
and you cannot change it. The range of monitoring data that can be
displayed in the window is between 8 hours and 15 days depending on the
gathering interval.
For details on the types of storing period of statistics, see Understanding
Statistical Storage Ranges.
For details on the relationship between collection interval and the storing
period of the statistics, see Monitoring Options Window.
•
Monitoring Term lets you narrow the range of statistics that should be
displayed in the window.
Starting and ending times for collecting statistics are displayed on both
sides of the slide bar. Performance Monitor stores the monitoring data
between these times, and you can specify the desired term within this
range as statistics for the specified term will be displayed the target of
display in lists and graphs formats.
For example, if you want to view statistics within the range of 10:30 July 1
2006 to 10:30 July 2 2006, you set 2006/07/01 10:30 to the From box, set
2006/07/02 10:30 to the To box, and then click Apply.
To set a date and time in From and To, do either of the following:
–
Move the slider to the left or to the right.
–
In the text box, select the number that you want to change. Next, click
the up or down arrow.
When you specify dates and time in From and To, Performance Monitor
calculates the length (in minutes) of the specified period and displays the
calculated length. When calculating the length in minutes, Performance
Monitor rounds up to the nearest minute.
Notes:
From and To are unavailable if the monitoring data (that is, obtained
statistics) is not stored in the storage system.
The Real Time option is grayed out when the LDEV tab is active.
4-10
Using the Performance Manager GUI
Hitachi Universal Storage Platform V/VM Hitachi Performance Manager User’s Guide
•
In the Monitoring Data area, the list on the upper right of the list
specifies the type of statistics to be displayed in the window. If you want to
view I/O rate, select IOPS (I/Os per second) from the list. If you want to
view transfer rate, select MB/s (megabytes per second) from the list.
•
The tree lists parity groups, external volume groups, and V-VOL groups.
Box folders (for example, Box 1, Box E1, Box V1, and Box X1) are
displayed below the storage system folder. The number at the end of a
Box folder name indicates the number at the beginning of parity group ID,
external volume group ID or V-VOL group ID. For example, if you doubleclick the Box 1 folder, the tree displays a list of parity groups whose IDs
begin with 1 (for example, 1-1 and 1-2). At the right of each ID, the RAID
level appears. When you select a parity group, the list on the right lists
volumes in the parity group.
The IDs of external volume groups are beginning with the letter "E".
Therefore, a folder whose number is beginning with the letter "E", such as
Box E1, contains external volume groups. For example, if you double-click
the Box E1 folder, the tree displays a list of external volume groups whose
IDs begin with E1 (for example, E1-1 and E1-2). The external volume
groups do not have parity in formation, and no RAID level appears at the
right of IDs.
A volume existing in an external storage system and mapped to a volume
in the USP V/VM storage system by using Universal Volume Manager is
called an external volume. An external volume group is a quantity of
external volumes grouped together for managing and that does not contain
any parity information, unlike a parity group. However, Performance
Management window treats external volume groups same as parity
groups for convenience.
When Copy-on-Write Snapshot is used, the IDs of V-VOL groups begin with
the letter "V". When Dynamic Provisioning is used, the IDs of V-VOL groups
begin with the letter "X". Therefore, if a folder number ends with the letter
"V" or "X", such as Box V1 or Box X1, it contains V-VOL groups.
For example, if you double-click the Box V1 folder, the tree displays V1-1,
which is a V-VOL group ID beginning with V1. If you double-click the Box
V2 folder, the tree displays V2-1, which is a V-VOL group ID beginning
with V2. The V-VOL groups do not have parity information, and no RAID
level appears at the right of IDs.
Unlike a parity group, a V-VOL group is a group of virtual volumes and
does not contain any parity information. However, Performance
Management windows treat V-VOL groups the same as parity groups for
convenience.
The parity group icon ( ) can represent a single parity group. The parity
group icon can also represent two or more parity groups that are
connected together. If two or more parity groups are connected together,
volumes can be striped across two or more drives. Therefore, connected
parity groups provide faster access (particularly, faster sequential access)
to data.
Using the Performance Manager GUI
Hitachi Universal Storage Platform V/VM Hitachi Performance Manager User’s Guide
4-11
For example, if the parity group icon ( ) indicates a single parity group 13, the text 1-3 appears on the right of the icon. If the parity group icon
indicates two or more parity groups that are connected together, all the
connected parity groups appear on the right of the icon. For example, if the
parity group 1-3 is connected with the parity group 1-4, the text 1-3[1-4]
appears on the right of the parity group icon. (All the parity groups
connected with 1-3 are enclosed by square brackets).
Notes:
Storage Navigator does not allow you to connect two or more parity
groups. If you want to use connected parity groups, contact the
maintenance personnel.
When the ShadowImage or ShadowImage for IBM z/OS quick restore
operation is being performed, a Storage Navigator window may display
old information (status before the quick restore operation) on volume
(LDEV) configurations.
In this case, wait until the quick restore operation completes, and then
click File, Refresh on the menu bar of the Storage Navigator main
window to update the Storage Navigator window.
•
The list displays statistics about disk access performance (for example, I/O
rate, transfer rate, read hit ratio, write hit ratio, and average response
time). For details on the list contents, see Monitoring Hard Disk Drives.
If you select connected parity groups in the tree, the list displays statistics
about disk access performance for all the connected parity groups.
The list displays up to a maximum of 4,096 resources at a time. If the
number of resources exceeds 4,096, use Previous and Next to display the
remaining resources.
When you select a folder icon such as Box 1 or Box 3, the concatenated
parity group icon is displayed in a list. The only parity group ID displayed
will be that of the group at the top of the concatenated parity groups. The
icon used for concatenated parity groups is the same as a regular parity
group icon. There is no specific icon for concatenated parity groups.
•
•
4-12
The Page area displays the number of the current page and the following
items are being used to change pages of list.
–
Previous button allows you to display the previous 4,096 resources.
–
N/M list: The N displays the number of the current page. The M
displays total number of pages. Use the list to choose the number of the
page to display.
–
Next button allows you to display the next 4,096 resources.
The Draw button displays a line graph illustrating changes in the I/O rate,
the transfer rate, etc. The graph can display up to eight lines
simultaneously.
Using the Performance Manager GUI
Hitachi Universal Storage Platform V/VM Hitachi Performance Manager User’s Guide
•
The line graph illustrates changes in the I/O rate, the transfer rate, etc.
The vertical axis indicates the usage rates (in percentage). The horizontal
axis indicates dates and/or times.
If you select connected parity groups in the tree, the graph illustrates
changes in disk access performance (e.g., the I/O rate and the transfer
rate) for all the connected parity groups.
Before clicking Draw, use the list at the right corner of the list (just below
the list for specifying the type of statistics) to specify the type of
information that will be displayed in the graph. The list to specify the item
to be displayed is shown below.
Figure 4-6
Selecting an Item to be Displayed in the Graph (LDEV
Tab)
The items that can be selected in the list change depending on the type of
statistics you selected. Some items can be selected only when you select
I/O rate (IOPS) or the transfer rate (MB/s). The items you can select in
the list and the corresponding type of statistics are shown in Table 4-1.
Table 4-1
Items You Can Select in the List and the Types of Statistics
(LDEV Tab)
Type of statistics
Item selected in the
list
Meaning
I/O
rate
transfer
rate
IO Rate
The I/O rate. The number of I/O accesses per
second).
9
Read
The number of read accesses per second.
9
Write
The number of write accesses per second.
9
Read Hit
The read hit ratio.
9
9
Write Hit
The write hit ratio.
9
9
Back Trans.
Backend transfer. The number of data transfers
between the cache memory and the hard disk
drive.
9
9
Trans.
The transfer rate. The size of data transferred per
second.
9
9: Can be selected (blank): Cannot be selected
Using the Performance Manager GUI
Hitachi Universal Storage Platform V/VM Hitachi Performance Manager User’s Guide
4-13
When you draw a graph, use the Detail check box to illustrate the desired
information and the Chart Y Axis Rate list to arrange the graph as you
like.
Figure 4-7
Chart Y Axis Rate List and Detail Check Box (LDEV Tab)
Use the Chart Y Axis Rate list to select the highest value of the Y-axis
(the vertical axis) of the graph.
If you select Detail and then click Draw, the graph displays detailed
statistics as explained in Table 4-2. The information in the graph depends
on the item selected in the list on the right.
Table 4-2
Detailed Information that can be Displayed in the Graph (LDEV
Tab)
Select Detail and this Item in the
List
The Graph Contains
IO Rate
- statistics in sequential access mode
Read
- statistics in random access mode
Write
Read Hit
Write Hit
Back Trans.
- statistics in CFW (cache fast write) mode
Note: If the read hit ratio or the write hit ratio is high,
random access mode is used for transferring data instead
of sequential access mode. For example, random access
mode is likely to be used for transferring data to disk areas
to which the Cache Residency Manager function is applied.
- the number of data transfers from the cache memory to
hard disk drives ("Cache to Drive")
- the number of data transfers from hard disk drives to the
cache memory in sequential access mode ("Drive to Cache
Sequential")
- the number of data transfers from hard disk drives to the
cache memory in random access mode ("Drive to Cache
Random")
Trans.
4-14
The graph does not display detailed information.
Using the Performance Manager GUI
Hitachi Universal Storage Platform V/VM Hitachi Performance Manager User’s Guide
Port-LUN Tab of the Performance Monitor Window
When you click Go, Performance Manager and then Performance
Management on the menu bar of the Storage Navigator main window,
Performance Monitor starts and the Performance Management window is
active. The Performance Management window includes the Port-LUN tab,
which lets you view statistics about I/O rates, transfer rates, and average
response time at storage system ports, host groups, LU paths, etc.
Performance Monitor can obtain statistics about traffics of ports connected to
open-system host groups only. The statistics about traffics of ports connected
to mainframe host groups cannot be obtained.
For details on how to use this window, see Monitoring Ports and Monitoring LU
Paths.
Figure 4-8
Port-LUN tab of the Performance Management Window
When the Port-LUN tab is active, the Performance Management window
contains the following items:
•
When Monitoring Switch is Enable, Performance Monitor is monitoring
the storage system (a Disable setting indicates that the system is not
being monitored).
Using the Performance Manager GUI
Hitachi Universal Storage Platform V/VM Hitachi Performance Manager User’s Guide
4-15
•
Gathering Interval indicates that the statistics are collected at the
interval displayed here. If the number of the CUs monitored is 64 or less,
the value between 1 and 15 appears as a gathering interval by minutes.
For example, if 1 min. is displayed, the information obtained every one
minute is displayed in the list and the graph. In case 65 or more CUs are
monitored, the statistics are displayed every 5, 10 or 15 minutes.
•
The list on the right of Monitoring Data indicates storing period of
statistics (monitoring data). The statistics displayed in the Port-LUN tab
are stored only in short range. The range of monitoring data that can be
displayed in the window is between 8 hours and 15 days depending on the
gathering interval.
For details on the types of storing period of statistics, see Understanding
Statistical Storage Ranges.
For details on the relationship between collection interval and the storing
period of the statistics, see Monitoring Options Window.
•
Monitoring Term let you narrow the range of statistics that should be
displayed in the window.
The starting and ending time for collecting statistics is displayed on both
sides of the slide bar. Performance Monitor stores the monitoring data
between these times, and you can specify desired term within this range as
the target to display in lists and graphs.
For example, if you want to view statistics within the range of 10:30 July 1
2007 to 10:30 July 2 2007, you set 2007/07/01 10:30 to the From box, set
2007/07/02 10:30 to the To box, and then click Apply.
To set a date and time in From and To, do either of the following:
–
Move the slider to the left or to the right.
–
In the text box, select the number that you want to change. Next, click
the upward or downward arrow button.
When you specify dates and time in From and To, Performance Monitor
calculates the length (in minutes) of the specified period and displays the
calculated length. When calculating the length in minutes, Performance
Monitor rounds up the fraction.
Note: From and To are unavailable if the monitoring data (that is,
obtained statistics) is not stored in the storage system.
•
4-16
The Real Time option lets you view statistics in real-time mode, where
statistics are updated at a gathering interval you specify between 1 and 15
minutes.
Using the Performance Manager GUI
Hitachi Universal Storage Platform V/VM Hitachi Performance Manager User’s Guide
When you select the Real Time option, use the list to select the number of
recent collections of statistics which should be displayed in the graph. You
can select the number of times from 5 or 90. This setting determines the
range of recent statistics to be displayed in the graph. For example,
suppose the gathering interval is 1 minute. In this case, if you select 90
from the list, the graph displays statistics obtained in the last 90 minutes
(multiplying 1 minute by 90 times).
•
In the Monitoring Data area, the list on the upper right specifies the type
of statistics to be displayed in the window. If you want to view I/O rates,
select IOPS (I/Os per second) from the list. If you want to view transfer
rates, select MB/s (megabytes per second) from the list.
•
The tree contains the Subsystem folder. Below the Subsystem folder are
and ):
ports (such as
This icon indicates the attribute of the stored port is Target, or Initiator/External .
This port icon indicates either of the following:
A Fibre Channel port in Standard mode. LUN security is applied to this port.
If the port name is followed by its fibre address, the port is a Fibre Channel port. For
example, CL1-A(EF) indicates that the CL1-A port is a Fibre Channel port.
This port icon indicates either of the following:
A Fibre Channel port in Standard mode. LUN security is not applied to this port.
A Fibre Channel port in High Speed mode. LUN security is applied to this port.
A Fibre Channel port in High Speed mode. LUN security is not applied to this port.
A Fibre Channel port in Initiator/External MIX mode. LUN security is not applied
to this port.
A Fibre Channel port in Initiator/External MIX mode. LUN security is applied to
this port
When you double-click a port, the host groups ( ) that correspond to that
port are displayed. The host group ID appears on the left of the colon (:).
The host group name appears on the right of the colon.
When you double-click a host group, an item named LUN (
When you select LUN, the list on the right lists LU paths.
) appears.
For details about LUN security, host groups, and LU paths, see the LUN
Manager User's Guide.
•
The list displays statistics (that is, I/O rates, transfer rates, or average
response time). For details on the list contents, see Monitoring Ports and
Monitoring LU Paths.
•
The SPM button starts the Server Priority Manager program product if that
program has been enabled. For details of Server Priority Manager, see
Overview of Server Priority Manager and Server Priority Manager
Operation.
Using the Performance Manager GUI
Hitachi Universal Storage Platform V/VM Hitachi Performance Manager User’s Guide
4-17
The SPM button is deactivated in real-time mode. To start Server Priority
Manager, activate the From and To boxes and release Performance
Monitor from real-time mode.
•
If the Current Control label displays Port Control, the system is
controlled by the upper limits and the threshold specified in the Port tab of
the Server Priority Manager window.
–
If the Current Control label displays WWN Control, the system is
controlled by the upper limits and the threshold specified in the WWN
tab of the Server Priority Manager window.
–
If the Current Control label displays No Control, the system
performance is not controlled by Server Priority Manager.
•
The Draw button displays a line graph illustrating changes in the I/O rate
or the transfer rate. The graph can display up to eight lines simultaneously.
•
The line graph illustrates changes in the I/O rate or the transfer rate. The
vertical axis indicates the I/O rate or the transfer rate. The horizontal axis
indicates dates and/or times.
When the graph displays I/O rates or the transfer rates for a port
controlled by an upper limit or a threshold, the graph also displays a line
that indicates the upper limit or the threshold.
When you draw a graph, use the Detail check box and the list to illustrate
the desired information, and use the Chart Y Axis Rate list to arrange the
graph convenient to work.
Figure 4-9
Chart Y Axis Rate List, Detail Check Box, and the List to
Select the Item to be Displayed (Port-LUN Tab)
Use the Chart Y Axis Rate list to select the highest value of the Y-axis
(the vertical axis) of the graph.
If you select Detail after drawing a graph by clicking Draw, the graph
displays detailed statistics as explained. The detailed statistics can be
displayed only:
–
4-18
When you select the Subsystem folder (
port in the list.
) in the tree and select a
Using the Performance Manager GUI
Hitachi Universal Storage Platform V/VM Hitachi Performance Manager User’s Guide
The graph displays detailed statistics about workloads on the port
selected in the list. For details on the graph, see Viewing Port Workload
Statistics.
–
When you select LUN (
volume) in the list.
)in the tree and select a LUN (an address of a
The graph displays detailed statistics about workloads on the LU paths
selected in the list. The information in the graph depends on the item
selected in the list on the right of the Detail check box. For details on
the graph see Viewing Workload Statistics on LU Paths.
Viewing Port Workload Statistics
Figure 4-10 shows an example of a graph displaying information about
workload of a port. In this example, port CL1-A was selected in the list
before clicking Draw. In this example, 1 minute is specified as the
gathering interval. The graph contents changes depending on the selection
of the Detail check box. The figure shows the following:
–
The workload on the port CL1-A is 200 IO/s at 8:00, and 300 IO/s at
10:00 (refer to the graph on the left).
–
For the period of 7:59 to 8:00, the maximum workload on CL1-A is 300
IO/s. The average workload on CL1-A is 200 IO/s. The minimum
workload on CL1-A is 100 IO/s (refer to the graph on the right).
–
For the period of 9:59 to 10:00, the maximum workload on CL1-A is
400 IO/s. The average workload on CL1-A is 300 IO/s. The minimum
workload on CL1-A is 200 IO/s (refer to the graph on the right).
–
When Detail is deselected, only one line appears in the graph. This line
is equivalent to the line Ave. (1 min), which appears when Detail is
selected.
I/O rate(IOPS)
I/O rate(IOPS)
400
400
CL1-A
300
200
100
100
08:00
10:00
Time
If the Detail check box is deselected
Figure 4-10
Ave. (1 min.)
300
200
Max. (1 min.)
Min. (1 min.)
08:00
10:00
If the Detail check box is selected
Time
Graphs Illustrating Changes in Workloads on a Port
Using the Performance Manager GUI
Hitachi Universal Storage Platform V/VM Hitachi Performance Manager User’s Guide
4-19
Viewing Workload Statistics on LU Paths
When you select LUN ( ) in the tree, select a LUN in the list, click Draw, and
then select Detail, the graph displays detailed statistics about workload on the
LU paths. The detailed statistics that can be displayed differ depending on
items you select in the list, as explained in Table 4-3.
Table 4-3
Detailed Information that can be Displayed in the Graph (PortLUN Tab)
Select Detail and this Item in the
List
The Graph Contains
IO (the number of I/Os per
second)*
- statistics in sequential access mode
Read (the number of read accesses
per second)*
Note: If the read hit ratio or the write hit ratio is high,
random access mode is used for transferring data instead
of sequential access mode. For example, random access
mode is likely to be used for transferring data to disk areas
to which the Cache Residency Manager function is applied.
Write (the number of write
accesses per second)*
- statistics in random access mode
Read Hit (the read hit ratio)
Write Hit (the write hit ratio)
Back Trans. (backend transfer; the
number of I/Os between the cache
memory and hard disk drives)
- the number of data transfers from the cache memory to
hard disk drives ("Cache to Drive")
- the number of data transfers from hard disk drives to the
cache memory in sequential access mode ("Drive to Cache
Seq.")
- the number of data transfers from hard disk drives to the
cache memory in random access mode ("Drive to Cache
Rnd.")
* You can select this item only when I/O rates are displayed.
4-20
Using the Performance Manager GUI
Hitachi Universal Storage Platform V/VM Hitachi Performance Manager User’s Guide
WWN Tab of the Performance Monitor Window
When you click Go, Performance Manager and then Performance
Management on the menu bar of the Storage Navigator main window,
Performance Monitor starts and the Performance Management window is
active. The Performance Management window includes the WWN tab,
where you view statistics (I/O rates, transfer rates, and average response
time) about traffic between host bus adapters in the hosts and ports on the
storage system.
Caution: The WWN tab is unavailable if Server Priority Manager is not
enabled.
A WWN (Worldwide Name) is a 16-digit hexadecimal number used as the
unique identifier for a host bus adapter. Host bus adapters are contained in
hosts and serve as ports for connecting the hosts and the storage system. One
WWN represents one host bus adapter.
For details on how to use this window, see Monitoring Paths between Host Bus
Adapters and Ports.
Figure 4-11
WWN tab of the Performance Management Window
When the WWN tab is active, the Performance Management window
contains the following items:
Using the Performance Manager GUI
Hitachi Universal Storage Platform V/VM Hitachi Performance Manager User’s Guide
4-21
•
When Monitoring Switch is Enable, Performance Monitor is monitoring
the storage system (a Disable setting indicates that the system is not
being monitored).
•
Gathering Interval indicates that the statistics are collected at the
interval displayed here. If the number of the CUs to be monitored is 64 or
less, the value between 1 and 15 appears as a gathering interval by
minutes. For example, if 1 min. is displayed, the information obtained
every one minute is displayed in the list and the graph. In case 65 or more
CUs are monitored, the statistics are displayed every 5, 10 or 15 minutes.
•
The list on the right of Monitoring Data indicates storing period of
statistics (monitoring data). The statistics displayed in the WWN tab are
stored only in short range, therefore, shortrange is displayed in this list
and you cannot change it. The range of monitoring data that can be
displayed in the window is between 8 hours and 15 days depending on the
gathering interval.
For details on the types of storing period of statistics, see Understanding
Statistical Storage Ranges.
For details on the relationship between collection interval and the storing
period of the statistics, see Monitoring Options Window.
•
Monitoring Term let you narrow the range of statistics that should be
displayed in the window.
The starting and ending time for collecting statistics are displayed on both
sides of the slide bar. Performance Monitor stores the monitoring data
between these times, and you can specify the desired term within this
range. Statistics for the specified term will be displayed in list and graph
formats.
For example, if you want to view statistics within the range of 10:30 July 1
2007 to 10:30 July 2 2007, you set 2007/07/01 10:30 to the From box, set
2007/07/02 10:30 to the To box, and then click Apply.
To set a date and time in From and To, do either of the following:
–
Move the slider to the left or to the right.
–
In the text box, select the number that you want to change. Next, click
the upward or downward arrow button.
When you specify dates and time in From and To, Performance Monitor
calculates the length (in minutes) of the specified period and displays the
calculated length. When calculating the length in minutes, Performance
Monitor rounds up the fraction.
Note: From and To are unavailable if the monitoring data (that is,
obtained statistics) is not stored in the storage system.
•
4-22
The Real Time option lets you view statistics in real-time mode, where
statistics are updated at a gathering interval you specify between 1 and 15
minutes.
Using the Performance Manager GUI
Hitachi Universal Storage Platform V/VM Hitachi Performance Manager User’s Guide
When you select the Real Time option, use the list to select the number of
recent collections of statistics which should be displayed in the graph. You
can select the number of times from 5 or 90. This setting determines the
range of recent statistics to be displayed in the graph. For example,
suppose the gathering interval is 1 minute. In this case, if you select 90
from the list, the graph displays statistics obtained in the last 90 minutes
(multiplying 1 minute by 90 times).
•
In the Monitoring Data area, the list on the upper right of the list
specifies the type of statistics to be displayed in the window. If you want to
view I/O rates, select IOPS (I/Os per second) from the list. If you want to
view transfer rates, select MB/s (megabytes per second) from the list.
•
The tree contains the Subsystem folder. Below the Subsystem folder are
SPM groups, which are groups of multiple WWNs. When you double-click an
SPM group ( ), the host bus adapters ( ) belonging to that SPM group
are displayed. The WWN and the SPM name of the host bus adapter are
displayed to the right of the
icon. If you double-click Not Grouped in
the tree, host bus adapters (WWNs) that do not belong to any SPM group
are displayed.
If the WWN of a host bus adapter (HBA) is displayed in red in the tree, the
host bus adapter is connected to two or more ports, but the traffic between
the HBA and some of the ports are not monitored by Performance Monitor.
When many-to-many connections are established between HBAs and ports,
make sure that all the traffic between HBAs and ports is monitored (see
Monitoring All Traffic between HBAs and Ports for instructions).
•
The list displays statistics (that is, I/O rates, transfer rates, or average
response time). For details on the list contents, see Monitoring Paths
between Host Bus Adapters and Ports.
•
The SPM button starts the Server Priority Manager program product if
Server Priority Manager is enabled. For details on Server Priority Manager,
see Overview of Server Priority Manager and Server Priority Manager .
The SPM button is deactivated in real-time mode. To start Server Priority
Manager, activate the From and To boxes and release Performance
Monitor from real-time mode.
•
•
If the Current Control label displays Port Control, the system is
controlled by the upper limits and the threshold specified in the Port tab of
the Server Priority Manager window.
–
If the Current Control label displays WWN Control, the system is
controlled by the upper limits and the threshold specified in the WWN
tab of the Server Priority Manager window.
–
If the Current Control label displays No Control, the system
performance is not controlled by Server Priority Manager.
The Draw button displays a line graph illustrating changes in the I/O rate
or the transfer rate. The graph can display up to eight lines simultaneously.
Using the Performance Manager GUI
Hitachi Universal Storage Platform V/VM Hitachi Performance Manager User’s Guide
4-23
•
The line graph illustrates changes in the I/O rate or the transfer rate. The
vertical axis indicates the usage rates (in percentage). The horizontal axis
indicates dates and/or times.
When the graph displays I/O rates or the transfer rates for a host bus
adapter or an SPM group controlled by an upper limit, the graph also
displays a line that indicates the upper limit.
When you draw a graph, the Chart Y Axis Rate list lets you select the
highest value of the Y-axis (the vertical axis) of the graph.
Figure 4-12
4-24
Chart Y Axis Rate List, Detail Check Box, and the List to
Select the Item to be Displayed (Port-LUN tab)
Using the Performance Manager GUI
Hitachi Universal Storage Platform V/VM Hitachi Performance Manager User’s Guide
Monitoring Options Window
When you click Go, Performance Manager and then Performance
Management on the menu bar of the Storage Navigator main window,
Performance Monitor starts. When you click the Monitoring Options tab, the
Monitoring Options window is displayed. Use it to make settings for
obtaining usage rates about hard disk drives, channel processors, disk
processors, etc.
Note: This note explains the following statistics to be displayed in tabs of
Performance Management windows.
The statistics of LUs that are displayed in the Port-LUN tab.
The statistics of volumes that are displayed in the LDEV tab.
In the above tabs, performance statistics of unused volumes are displayed as
hyphens (-), if the range of monitored CUs does not match the range of CUs
used in the disk storage system or registered as external volumes. In addition,
depending on your disk subsystem configuration, the list may display
performance statistics for some volumes and not display performance statistics
for other volumes.
To correctly display performance statistics, you must specify CUs to be
monitored as follows:
To display performance statistics of a LUSE volume in the Port-LUN tab, you
must specify all volumes that make up the LUSE volume as the monitoring
targets.
To display performance statistics of parity group to be displayed in the LDEV
tab, you must specify all volumes that belong to the parity group as the
monitoring target.
Using the Performance Manager GUI
Hitachi Universal Storage Platform V/VM Hitachi Performance Manager User’s Guide
4-25
Figure 4-13
Monitoring Options Window of Performance Monitor
The Monitoring Switch area in the Monitoring Options window contains the
following items:
•
Current Status
Select Enable to start obtaining statistics from the storage system (that is,
monitoring). To stop monitoring, select Disable. The default setting is
Disable.
•
Gathering Interval
Specify the interval to obtain usage statistics about the storage system for
short range monitoring. This option is activated when you specify Enable
for Current Status. If CUs to be monitored are 64 or less, you can specify
the value between 1 and 15 minutes by minutes, and the default setting is
1 minute. For example, if you specify 1 minute for the gathering interval,
Performance Monitor collect statistics (such as I/O rates and transfer rates)
every one minute.
If CUs to be monitored are 65 or more, the gathering interval can be
specified to the value 5, 10 or 15 minutes (in the 5-minuted interval), and
default is 5 minutes. For example, if you specify the gathering interval to 5
minutes, Performance Monitor gathers statistics (such as I/O rate and
transfer rate) every 5 minutes.
4-26
Using the Performance Manager GUI
Hitachi Universal Storage Platform V/VM Hitachi Performance Manager User’s Guide
This option is effective only for:
–
Statistics displayed in the LDEV, Port-LUN, and WWN tabs
–
Statistics displayed in the Physical tab with selecting shortrange for
the storing period
When viewing the Physical tab with longrange selected for the storing
period, the statistics collected every 15 minutes are displayed regardless of
the value of the Gathering Interval.
The Monitoring Target area in the Monitoring Options window contains the
following items:
•
PG Selection Support
If you click this button, all parity groups are listed in the PG list. If you
click this button when a large-sized configuration is being used, it may take
long time to gather the PG list.
•
PG list:
Indicates the list of IDs of the parity groups that can be monitored. Each
cell displayed in the list is accompanied by an icon . Click PG on the
header to sort the parity groups by ID. If you click the cell for an individual
parity group, the CUs that belong to that parity group are displayed in the
CU table on the right.
•
LDKC list:
Indicates LDKC numbers. To select an LDKC as a monitoring target, click
the LDKC number. All the CUs that belong to that LDKC are displayed.
•
CU table:
The CU table consists of cells representing CUs. Each row consists of 16
cells (CUs). A set of 16 rows represents CUs for one LDKC. The table
header row displays the last digit of each CU number in the form of +n (n
is an integer between 0 and 9, or a letter from A to F).
To select a CU, click a cell to invert its color. To restore the cell to its
original color, click the inverted cell. To select all the (16) CUs of the same
number in the second last digits, click the CU number (00 to F0). By
dragging the cursor over multiple cells, you can select all the cells from the
source to the destination.
For your information, one cell corresponds to one CU. The relation of the
display of a cell to the CU status is shown below:
Using the Performance Manager GUI
Hitachi Universal Storage Platform V/VM Hitachi Performance Manager User’s Guide
4-27
Table 4-4
Relationship between the Display of a Cell and the CU Status
in the CU Table
CU Exists
Yes
No
•
CU Monitoring Status
Letter Displayed in The Cell
CU is being monitored
S: in black
CU is to be released from monitoring
R: in blue italics
CU is not being monitored
None
CU will be monitored when it exist
N: in black
CU is to be released from monitoring
-: Hyphen in black bold
CU will not be monitored when it exist
-: Hyphen in black
Monitoring Target CUs:
Indicates the number of existing and newly added CUs to be monitored.
•
The Select button adds the CU selected in the CU table to the CUs to be
monitored.
Table 4-5
Characters Indicated in a Cell When the Select Button is
Clicked
Before Click
•
After Click
-: Hyphen in black
N: in black italics
R: in blue italics
S: in black
The Release button removes the CU from monitoring targets.
Table 4-6
Characters Indicated in a Cell When Release Button is
Clicked
Before Click
After Click
N: in black
-: Hyphen in black bold
S: in black
R: slanted in blue italics
•
The Apply button applies settings in the Monitoring Options window to
the storage system.
•
The Reset button resets the settings in the Monitoring Options window.
Performance Monitor has two kinds of periods (ranges) for collecting and
storing statistics: short range and long range.
The storing period of statistics in short range is determined by the settings of
Gathering Interval option. Performance Monitor saves the statistics obtained
up to 1440 times in SVP. Therefore, you can estimate the storing period of
statistics with "gathering interval multiplied by 1440". For example, if you
specify one minute for the gathering interval, the statistics for one day can be
stored at the maximum from the following formula:
1 minute x 1440 = 1440 minutes = 24 hours = 1 day
4-28
Using the Performance Manager GUI
Hitachi Universal Storage Platform V/VM Hitachi Performance Manager User’s Guide
This storing period is the range of display in the Performance Management
windows. When you specify one minute for the gathering interval like the
example above, Performance Monitor can display the statistics for one day (i.e.
24 hours) in the list and graph at the maximum. Also, when you specify 15
minutes for the gathering interval, Performance Monitor can display the
statistics for 15 days in the list and graph at the maximum.
However, the value of the Gathering Interval option has nothing to do with
the storing period of statistics in long range monitoring. The gathering interval
in long range is fixed to 15 minutes. Therefore, when you select the
longrange storing period in the Physical tab of Performance Monitor, the
display range in the window is always three months (i.e., 93 days).
The monitoring switch settings in the Monitoring Options window work in
conjunction with the monitoring switch settings in the Usage Monitor
windows of TrueCopy, TrueCopy for IBM z/OS, Universal Replicator, and
Universal Replicator for IBM z/OS. Therefore, if you use the Monitoring
Options window to start or stop monitoring, or to change the gathering
interval, the monitoring settings of these remote copy functions will also
change. Conversely, if the settings in each Usage Monitor window are
changed, the settings in the Monitoring Options window of Performance
Monitor also change automatically.
Other Windows
Apart from the Performance Monitor window and its tabs, the Performance
Monitor interface also includes the following windows:
•
TC Monitor window
This window displays the information about remote copy operation of
TrueCopy. The contents in this window are the same as those of the Usage
Monitor window of TrueCopy. For details on the contents in this window,
see the TrueCopy User's Guide.
•
TCz Monitor window
This window displays the information about remote copy operation of
TrueCopy for IBM z/OS. The contents in this window are the same as those
of the Usage Monitor window of TrueCopy for IBM z/OS. For details on
the contents in this window, see the TrueCopy for IBM z/OS User's Guide.
•
UR Monitor window
This window displays the information about remote copy operation of
Universal Replicator. The contents in this window are the same as those of
the Usage Monitor window of Universal Replicator. For details on the
contents in this window, see the Universal Replicator User's Guide.
Using the Performance Manager GUI
Hitachi Universal Storage Platform V/VM Hitachi Performance Manager User’s Guide
4-29
•
URz Monitor window
This window displays the information about remote copy operation of
Universal Replicator for IBM z/OS. The contents in this window are the
same as those of the Usage Monitor window of Universal Replicator for
IBM z/OS. For details on the contents in this window, see the Universal
Replicator for IBM z/OS User's Guide.
If each remote copy function (TrueCopy, TrueCopy for IBM z/OS, Universal
Replicator, or Universal Replicator for IBM z/OS) is not installed in your
environment, the corresponding tabs (TC Monitor tab, TCz Monitor tab, UR
Monitor tab, or URz Monitor tab) are unavailable.
Using the Server Priority Manager Windows
The first section in this chapter explains Server Priority Manager windows.
The remaining sections explain procedures for monitoring performance and
setting the upper limit and threshold for I/O rates and transfer rates.
If the user type of your user ID is storage partition administrator, you cannot
use Server Priority Manager. For details on the limitations when using
Performance Manager logged in as a storage partition administrator, see
Storage Partition Administrators Limitations.
The Server Priority Manager window has two tabs: Port tab and WWN tab.
If one-to-one connections are established between host bus adapters and
ports, use the Port tab. If many-to-many connections are established between
host bus adapters and ports, use the WWN tab.
This section explains these tabs in the Server Priority Manager window.
Port Tab of the Server Priority Manager Window
The Port tab lets you set the limit on the performance of non-prioritized ports
and set the threshold on the performance of prioritized ports.
For operations in this tab, see Port Tab Operations.
4-30
Using the Performance Manager GUI
Hitachi Universal Storage Platform V/VM Hitachi Performance Manager User’s Guide
Figure 4-14
Port Tab in the Server Priority Manager Window
The Port tab displays the following:
•
Current Control Status can display either Port Control or WWN
Control.
–
If Port Control is displayed, the system is controlled by the upper
limits and threshold specified in the Port tab.
–
If WWN Control is displayed, the system is controlled by the upper
limits and threshold specified in the WWN tab.
–
If No Control is displayed, the system performance is not controlled by
Server Priority Manager.
Tip: If WWN Control is displayed when the Port tab is active, click Apply
to switch control so that Port Control is displayed.
Tip: To return the control status to No Control, specify Prio. for attributes
of all the ports and then click Apply.
•
The list near the upper right corner of the Server Priority Manager
window allows you to narrow ports in the list:
–
If All is selected, all the ports appear in the list.
–
If Prioritize is selected, only the prioritized ports appear in the list.
–
If Non-Prioritize is selected, only the non-prioritized ports appear in
the list.
Using the Performance Manager GUI
Hitachi Universal Storage Platform V/VM Hitachi Performance Manager User’s Guide
4-31
If you change settings of a port, that port remains in the list regardless of
the selection in the list.
•
•
The list near the upper left corner of the Port tab allows you to change the
type of performance statistics to be displayed in the list.
–
If IOPS (I/Os per second) is selected, the list displays I/O rates for
ports. The I/O rate indicates the number of I/Os per second.
–
If MB/s (megabytes per second) is selected, the list displays the
transfer rates for ports. The transfer rate indicates the size of data
transferred via a port in one second.
The list displays a list of ports and indicates the I/O rate or the transfer
rate for each port. This list also enables you to specify the port attributes,
and the threshold and upper limit of the port traffic.
The measurement unit for the values in the list can be specified by the list
above the trees. The port traffic (I/O rate and transfer rate) is monitored
by Performance Monitor. To specify the monitoring period, use the
Monitoring Term area of Performance Monitor.
The list shows the following items:
–
The Port column indicates ports on the storage system.
–
The Ave. column indicates the average I/O rate or the average transfer
rate for the specified period.
–
The Peak column indicates the peak I/O rate or the peak transfer rate
of the ports for the specified period. This value means the top of the
Max. line in the detailed port-traffic graph drawn in the Port-LUN tab of
Performance Monitor. For details, see Viewing I/O Rates for Disks and
Viewing Transfer Rates for Disks.
–
The Attribute column indicates the priority of each port. Prio indicates
a prioritized port. Non-Prio indicates a non-prioritized port.
–
The Threshold columns let you specify the threshold for the I/O rate
and the transfer rate for each prioritized port. Either the IOPS or MB/s
column in the list is activated depending on the selection from the list
above.
The IOPS column lets you specify the threshold for I/O rates. The
MB/s column lets you specify the threshold for transfer rates. To
specify a threshold, double-click a cell to display the cursor in the cell.
If you specify a value in either of the IOPS or MB/s column, the other
column is deactivated. You can specify thresholds for I/O rates and
transfer rates all together for different prioritized ports.
Even if you use the different type of rate for the threshold as that used
for the upper limit values, the threshold control can work for all the
ports.
–
4-32
The Upper columns let you specify the upper limit on the I/O rate and
the transfer rate for each non-prioritized port. Either the IOPS or MB/s
column in the list is activated depending on the selection from the list
above.
Using the Performance Manager GUI
Hitachi Universal Storage Platform V/VM Hitachi Performance Manager User’s Guide
The IOPS column lets you specify the upper limit for I/O rates. The
MB/s column lets you specify the upper limit for transfer rates. To
specify an upper limit, double-click a cell to display the cursor in the
cell. If you specify a value in either of the IOPS or MB/s column, the
other column is deactivated. You can specify upper limit values for I/O
rates and transfer rates all together for different non-prioritized ports.
•
If you select the All Thresholds check box and enter a threshold value in
the text box, the threshold value will be applied to the entire storage
system. If you want to specify the threshold for the I/O rate, select IOPS
from the list on the right of the text box. If you want to specify the
threshold for the transfer rate, select MB/s from the list. For example, if
you specify 128 IOPS in All Thresholds, the upper limits on nonprioritized ports are disabled when the sum of I/O rates for all the
prioritized ports is below 128 IOPS.
Even if you use the different type of rate (IOPS or MB/s) for the threshold
as that used for the upper limit values, the threshold control can work for
all the ports.
•
If you check the Delete ports if CHA is removed check box, Server
Priority Manager will delete, from SVP, the setting information of Server
Priority Manager on ports in channel adapters that have been removed.
When a channel adapter is removed, the port and its settings are removed
from the Server Priority Manager window automatically, but they remain
in SVP. This may cause that the old setting for Server Priority Manager to
be applied to a different channel adapter than the one newly-installed on
the same location.
The Delete ports if CHA is removed check box is available only when the
following Server Priority Manager settings on ports in a removed channel
adapter remains on SVP:
–
The setting of prioritized ports or non-prioritized ports.
–
The setting of prioritized WWNs or non-prioritized WWNs.
•
The Apply button applies the settings in this window to the storage
system.
•
The Reset button restores the last applied settings in the window. When
you click this button, all the changes displayed with the blue text in the
window are canceled.
•
The Initialize button changes the settings in this window as explained
below, and then applies the resulting settings to the storage system:
–
All the ports become prioritized ports.
–
The threshold value for all the ports becomes 0 (zero).
The window will display a hyphen (-) instead of 0 (zero).
–
•
If the All Thresholds checkbox is checked, the check mark disappears.
The Close button closes the Server Priority Manager window.
Using the Performance Manager GUI
Hitachi Universal Storage Platform V/VM Hitachi Performance Manager User’s Guide
4-33
WWN Tab of the Server Priority Manager Window
The WWN tab lets you set the limit on the performance of non-prioritized
WWNs and set the threshold on the performance of prioritized WWNs.
For operations in this tab, see WWN Tab Operations and Grouping Host Bus
Adapters.
Figure 4-15
WWN Tab in the Server Priority Manager Window
The WWN tab displays the following:
•
Current Control Status can display either Port Control or WWN
Control.
–
If Port Control is displayed, the system is controlled by the upper
limits and threshold specified in the Port tab.
–
If WWN Control is displayed, the system is controlled by the upper
limits and threshold specified in the WWN tab.
–
If No Control is displayed, the system performance is not controlled by
Server Priority Manager.
Tip: If Port Control is displayed when the WWN tab is active, click Apply
to switch control so that WWN Control is displayed.
Tip: To return the control status to No Control, specify Prio. for attributes
of all the host bus adapters and then click Apply.
4-34
Using the Performance Manager GUI
Hitachi Universal Storage Platform V/VM Hitachi Performance Manager User’s Guide
•
•
The list near the upper right corner of the Server Priority Manager
window enables you to narrow WWNs (host bus adapters) in the list:
–
If All is selected, all the WWNs appear in the list.
–
If Prioritize is selected, only the prioritized WWNs appear in the list.
–
If Non-Prioritize is selected, only the non-prioritized WWNs appear in
the list.
The upper-left tree lists ports and the host bus adapters connected to these
ports in the storage system.
Ports on the storage system are shown below the Subsystem folder. The
ports are indicated by icons such as
and
.
When you double-click on a port, the tree expands to display two items:
Monitor and Non-Monitor. The host bus adapters that are connected to
the specified port are displayed below Monitor or Non-Monitor.
–
If you double-click Monitor, the host bus adapters ( ) whose traffics
with the specified port are monitored are displayed below Monitor.
–
If you double-click Non-Monitor, the host bus adapters whose traffics
with the specified port are not monitored are displayed below NonMonitor.
The WWN and SPM names of the host bus adapters are displayed on the
right of the host bus adapter icon ( ) below Monitor. WWNs (Worldwide
Name) are 16-digit hexadecimal numbers used to uniquely identify host
bus adapters. SPM names are nicknames assigned by the system
administrator so that they can easily identify each host bus adapter.
Only the WWN is displayed on the right of the host bus adapter icon (
below Non-Monitor.
)
When many-to-many connections are established between host bus
adapters (HBAs) and ports, make sure that all the traffics between HBAs
and ports monitored. Therefore, make sure that all the connected HBAs are
displayed below Monitor. For details on how to move an HBA displayed
below Non-Monitor to below Monitor, see Monitoring All Traffic between
HBAs and Ports.
The list on the right of the tree changes depending on the item you
selected in the tree as follows.
•
–
When you selected a port or Monitor icon, the list displays the
information of host bus adapters that are connected to the ports(s) and
monitored by Performance Monitor.
–
When you selected the Monitor icon or the Subsystem folder, the list
becomes blank.
The lower-left tree lists SPM groups. The tree also lists host bus adapters
(WWNs) in each SPM group:
–
SPM groups ( ), which contain on or more WWNs, are displayed below
the Subsystem folder. For details on the SPM groups, see Grouping
Host Bus Adapters.
Using the Performance Manager GUI
Hitachi Universal Storage Platform V/VM Hitachi Performance Manager User’s Guide
4-35
–
If you double-click an SPM group, host bus adapters in that group are
displayed in the tree. the WWN and SPM name are displayed to the
right of the host bus adapter icon ( ).
If the WWN of a host bus adapter (HBA) is displayed in red in the tree, the
host bus adapter is connected to two or more ports, but the traffic between
the HBA and some of the ports is not monitored by Performance Monitor.
When many-to-many connections are established between HBAs and ports,
you should make sure that all the traffic between HBAs and ports is
monitored. For details on the measures when a WWN is displayed in red,
see Monitoring All Traffic between HBAs and Ports.
The list on the right of the tree changes depending on the item you
selected in the tree as follows:
•
–
When you selected the Subsystem folder, the list displays the
information of SPM groups.
–
When you selected an SPM group icon ( ), the list displays the
information of host bus adapters ( ) contained in that SPM group.
The Add WWN button lets you add a host bus adapter to an SPM group.
Before using this button, you must select a host bus adapter ( ) from the
upper-left tree and also select an SPM group ( ) from the lower-left tree.
You can add a host bus adapter that appears below Monitor and does not
registered on any other SPM group, yet. If you select a host bus adapter
below Non-Monitor or a host bus adapter already registered on an SPM
group, the Add NNW button is deactivated.
•
•
The list at the upper left corner of the list enables you to change the type
of performance statistics to be displayed in the list.
–
If IOPS (I/Os per second) is selected, the list displays I/O rates for
WWNs (host bus adapters). The I/O rate indicates the number of I/Os
per second.
–
If MB/s (megabytes per second) is selected, the list displays the
transfer rates for WWNs (host bus adapters). The transfer rate indicates
the size of data transferred in one second.
The list displays a list of WWNs and indicates the I/O rate or the transfer
rate for each host bus adapter corresponding to the selection in the upperleft tree or lower-left tree. This list also enables you to specify the host bus
adapter attributes and the upper limit of the host bus adapter traffic.
The measurement unit for the values in the list can be specified by the list
at the upper left corner of the list. The displayed items will change
depending on the selected tree and item. The host bus adapter traffic (I/O
rate and transfer rate) is monitored by Performance Monitor. To specify the
monitoring period, use the Monitoring Term area of Performance Monitor.
On the right side of the list appear total number of WWNs, the number of
prioritized WWNs, and the number of non-prioritized WWNs.
The list shows the following items:
4-36
Using the Performance Manager GUI
Hitachi Universal Storage Platform V/VM Hitachi Performance Manager User’s Guide
–
The WWN column indicates WWNs of host bus adapters. This column
does not appear when you select the Subsystem folder in the lowerleft tree.
–
The SPM Name column indicates SPM names of host bus adapters.
Server Priority Manager allows you assign an SPM name to each host
bus adapter so that you can easily identify each host bus adapters in
the Server Priority Manager windows. This column does not appear
when you select the Subsystem folder in the lower-left tree.
–
The Group column indicates the SPM group to which the host bus
adapter belongs. This column appears when a port is selected in the
upper-left tree and does not appear when an SPM group is selected in
the lower-left tree.
–
The Per Port column indicates the traffic (I/O rate or transfer rate)
between the host bus adapter and the port selected in the upper-left
tree. This item is displayed only when you select an icon in the upperleft tree. The Per Port column contains the following columns:
Ave.: Indicates the average I/O rate or the average transfer rate for
the specified period.
Max.: Indicates the maximum I/O rate or the maximum transfer rate
for the specified period.
–
The WWN Total column indicates the sum of the traffic (I/O rate or
transfer rate) between the host bus adapter and all the ports connected
to the host bus adapter. This value means the total traffic of that host
bus adapter. This item is displayed only when you select an icon in the
upper-left tree. Whichever port you select in the tree, the WWN Total
column shows the sum of the traffic to all the ports.
The WWN Port column contains the following columns:
Ave.: Indicates the average I/O rate or the average transfer rate for
the specified period.
Max.: Indicates the maximum I/O rate or the maximum transfer rate
for the specified period.
–
The Ave. column is also displayed when you select an icon in the lowerleft tree. In this case, the Ave. column shows the average value same
as that of WWN Total.
When you select the Subsystem folder in the lower-left tree, the Ave.
column shows the sum of the traffic of the host bus adapters registered
on each SPM group.
–
The Max. column is also displayed when you select an icon in the
lower-left tree. In this case, the Max. column shows the maximum
value same as that of WWN Total.
When you select the Subsystem folder in the lower-left tree, the Max.
column shows the sum of the traffic of the host bus adapters registered
on each SPM group.
Using the Performance Manager GUI
Hitachi Universal Storage Platform V/VM Hitachi Performance Manager User’s Guide
4-37
–
The Attribute column indicates the priority of each WWN. Prio.
indicates a prioritized WWN. Non-Prio. indicates a non-prioritized
WWN. For details on how to change the priority, see Setting Priority for
Host Bus Adapters.
If one host bus adapter connects to multiple ports, the attribute setting
of the host bus adapter is common to all the ports. Therefore, if you
specify a host bus adapter as a prioritized WWN or a non-prioritized
WWN for one port, the setting is applied to all the other connected ports
automatically.
–
The Upper columns let you specify the upper limit on the I/O rate and
the transfer rate for each host bus adapter. Either of the IOPS or MB/s
column in the list is activated depending on the selection from the list
above.
The IOPS column lets you specify the upper limit for I/O rates. The
MB/s column lets you specify the upper limit for transfer rates. To
specify an upper limit, double-click a cell to display the cursor in the
cell.
If you specify a value in either of the IOPS or MB/s column, the other
column is deactivated. You can specify upper limit values for I/O rates
and transfer rates all together for different non-prioritized WWNs.
Notes:
If one host bus adapter connects to multiple ports, the setting of the upper
limit value for a non-prioritized WWN is common to all the ports.
Therefore, if you specify a upper limit value of non-prioritized WWN for
one port, the setting is applied to all the other connected ports
automatically.
You cannot change the upper limit value of a host bus adapter that has
registered on an SPM group. The upper limit value of such a host bus
adapter is defined by the setting of the SPM group to which the host
bus adapter is registered. For details on setting the upper limit value of
an SPM group, see Setting an Upper-Limit Value to HBAs in an SPM
Group.
The Upper columns will not display if an SPM group (
adapter ( )is selected in the lower-left tree.
•
4-38
) or a host bus
If you select the All Thresholds check box and enter a threshold value in
the text box, the threshold value will be applied to the entire storage
system. If you want to specify the threshold for the I/O rate, select IOPS
from the list on the right of the text box. If you want to specify the
threshold for the transfer rate, select MB/s from the list. For example, if
you specify 128 IOPS in All Thresholds, the upper limits on nonprioritized WWNs are disabled when the sum of I/O rates for all the
prioritized WWNs is below 128 IOPS.
Using the Performance Manager GUI
Hitachi Universal Storage Platform V/VM Hitachi Performance Manager User’s Guide
Even if you use the different type of rate (IOPS or MB/s) for the threshold
as that used for the upper limit values of the non-prioritized WWNs, the
threshold control can work for all the WWNs.
In the WWN tab, you cannot specify individual thresholds for each host
bus adapter.
•
If you check the Delete ports if CHA is removed checkbox, Server
Priority Manager will delete, from SVP, the setting information of Server
Priority Manager on ports in channel adapters that have been removed.
When a channel adapter is removed, the port and its settings will disappear
on the Server Priority Manager window automatically, but that remains
in SVP. This may cause that the old setting for Server Priority Manager are
applied to a different channel adapter that is installed on the same location
newly.
The Delete ports if CHA is removed check box is available only when the
following Server Priority Manager settings on ports in a removed channel
adapter remains on SVP:
–
The setting of prioritized ports or non-prioritized ports.
–
The setting of prioritized WWNs or non-prioritized WWNs.
•
The Apply button applies the settings in this window to the storage
system.
•
The Reset button restores the last applied settings in the window. When
you click this button, all the changes displayed with the blue text in the
window are canceled.
•
The Initialize button changes the settings in this window as explained
below, and then applies the resulting settings to the storage system:
•
–
All the host bus adapters become prioritized WWNs.
–
If the All Thresholds checkbox is checked, the check mark disappears.
The Close button closes the Server Priority Manager window.
Using the Performance Manager GUI
Hitachi Universal Storage Platform V/VM Hitachi Performance Manager User’s Guide
4-39
4-40
Using the Performance Manager GUI
Hitachi Universal Storage Platform V/VM Hitachi Performance Manager User’s Guide
5
Performance Monitor Operations
This chapter explains the following performance monitor operations:
Overview of Performance Monitor Operations
Monitoring Resources in the Storage System
Monitoring Hard Disk Drives
Monitoring Ports
Monitoring LU Paths
Viewing HBA Information
Performance Monitor Operations
Hitachi Universal Storage Platform V/VM Hitachi Performance Manager User’s Guide
5-1
Overview of Performance Monitor Operations
This section briefly describes how to use Performance Monitor to monitor the
storage system.
Start Monitoring
To start monitoring the storage system, you start Performance Monitor and
display the Monitoring Options window.
The following statistics appear in the tabs of Performance Management
windows.
•
LU statistics are displayed in the Port-LUN tab.
•
Volume statistics are displayed in the LDEV tab.
In the above tabs, performance statistics of unused volumes are displayed as
hyphens (-), if the range of monitored CUs does not match the range of CUs
used in the disk storage system or registered as external volumes. In addition,
depending on your disk subsystem configuration, the list may display
performance statistics for some volumes and not display performance statistics
for other volumes.
To correctly display performance statistics, you must specify CUs to be
monitored as follows:
5-2
•
To display performance statistics of a LUSE volume in the Port-LUN tab,
you must specify all volumes that make up the LUSE volume as the
monitoring targets.
•
To display performance statistics of parity group to be displayed in the
LDEV tab, you must specify all volumes that belong to the parity group as
the monitoring target.
Performance Monitor Operations
Hitachi Universal Storage Platform V/VM Hitachi Performance Manager User’s Guide
Figure 5-1
Monitoring Options Window of Performance Monitor
To start monitoring, select Enable for the Current Status option in
Monitoring Switch, and specify the Gathering Interval option to set the
interval for collecting information. Next, select or release the CUs to be
monitored in Monitoring Target area. You can specify target CUs either by
choosing PG numbers, LDKC numbers, CU numbers or the cells in the CU table.
For the details on how to select CUs, see Monitoring Options Window. After the
setting is completed, click Apply. Performance Monitor starts to obtain
statistics about the storage system and saves the statistics at the specified
interval.
If the number of CUs to be monitored is 64 or less, you can select a gathering
interval between 1 and 15 minutes. The gathering interval you selected here
determines the storing period of the statistics in short range, which is up to 15
days. For example, if you specify the gathering interval as 1 minute, the
statistics can be stored 1 day, and if you specify it as 15 minutes, the statistics
can be stored 15 days. If the number of the CUs to be monitored is 65 or more,
you can choose the gathering interval from among 5, 10 or 15 minutes. The
gathering interval you selected determines the storing period (between 8
hours and 1 day) of the statistics. In case of 510 CUs, for example, the
statistics can be stored for 8 hours if you specify the gathering interval to 5
minutes, and the statistics can be stored for 1 day if the interval is specified to
15 minutes.
Performance Monitor Operations
Hitachi Universal Storage Platform V/VM Hitachi Performance Manager User’s Guide
5-3
Moreover, the resource usage in the storage system can also be stored in a
long range up to 3 months. In this case, however, the gathering interval is
fixed to 15 minutes regardless of the value set for the Gathering Interval
option. For details on the relationship of collection interval and storing period
of the statistics, see Monitoring Options Window.
The monitoring switch settings in the Monitoring Options window work in
conjunction with the monitoring switch settings in the Usage Monitor
windows of TrueCopy, TrueCopy for IBM z/OS, Universal Replicator, and
Universal Replicator for IBM z/OS. Therefore, if you use the Monitoring
Options window to start or stop monitoring, or to change the gathering
interval, the monitoring settings of these remote copy functions will also
change. Conversely, if the settings in each Usage Monitor window are
changed, the settings in the Monitoring Options window of Performance
Monitor will also change automatically.
View the Monitoring Results
To view the results of monitoring, use the Performance Management
window of Performance Monitor. When you select the Performance
Management tab, the Performance Management window is displayed. In
that window, select a desired tab in the tree left side in the window and the
icons which information you can view are displayed in the tree. Select the icon
with information you want to view and the statistics obtained in the storage
system are displayed in the list on the right side of the tree.
Figure 5-2
5-4
Performance Management Window
Performance Monitor Operations
Hitachi Universal Storage Platform V/VM Hitachi Performance Manager User’s Guide
The information you can view by selecting each tab for the tree is explained
below.
•
Physical tab
Enables you to view usage statistics about resources in the storage system.
•
LDEV tab
Enables you to view statistics about workload on disks.
•
Port-LUN tab
Enables you to view statistics about traffic at ports and LU paths in the
storage system.
•
WWN tab
Enables you to view statistics about traffic at path between host bus
adapters (HBAs) and ports.
Two sliders are displayed on the upper right of the Performance
Management window. To the left and right of the two sliders, dates and times
are displayed. The term between these dates and times is the period in which
statistics are stored. If the date and time on the left is 2007/03/27 16:00 and the
date and time on the right is 2007/03/28 16:00, you can view usage statistics for
the period of 2007/03/27 16:00 to 2007/03/28 16:00.
If you change the dates and times in From and To, you can specify the range
of statistics that should be displayed in the window. For example, if the
window displays statistics for the last one month, you can change the values in
From and To to display the statistics for the last week only or to display the
statistics for the last three days only.
When monitoring ports, LU paths or host bus adapters in the Port-LUN tab or
the WWN tab, you can view the monitoring results in near-real time. To view
the monitoring results in real time, select the Real Time option which is
included in the Monitoring Term area of the Performance Management
window. The information in the window will be updated at the specified
gathering interval (every 1 to 15 minutes). You cannot view the monitoring
results displayed in the Physical tab and the LDEV tab in real time.
Performance Monitor Operations
Hitachi Universal Storage Platform V/VM Hitachi Performance Manager User’s Guide
5-5
Starting and Stopping Storage System Monitoring
To monitor the storage system, start Performance Monitor at first and then
start obtaining statistics. You can also stop the monitoring from Performance
Monitor. Each procedure is explained below.
To start Performance Monitor:
1. Log onto Storage Navigator. The Storage Navigator main window is
displayed.
2. Click Go, Performance Manager and then Performance Management
on the menu bar of the Storage Navigator main window.
The Performance Management window is displayed.
To start monitoring the storage system:
1. Ensure that the Storage Navigator main window is in Modify mode.
The Storage Navigator main window is in Modify mode if the background
color of the
icon is light yellow. If the background color is gray, the
window is in View mode and you must change it to Modify mode by
taking the following steps:
a. Check to see if the background color of the lock icon
is blue.
If the background color is red , you will not be able to switch from
View mode to Modify mode. Wait for a while and click the
button. If
the background color turns blue, you can go to the next step.
b. Click the
icon.
A message appears, asking whether you want to change the mode.
c. Click OK to close the message.
The background color of the icon changes to light yellow ( ). The mode
changes to Modify mode. The background color of the lock icon
becomes red ( ).
Note: Even in View mode, you can operate the Performance
Management window, but you cannot change the settings in the
Monitoring Options window.
2. Start Performance Monitor and select the Monitoring Options tab. The
Monitoring Options window is displayed.
3. In Monitoring Switch, select Enable for the Current Status option.
4. Use the lists in Gathering Interval to specify the interval for obtaining the
statistics.
5. In the Monitoring Target area, click the cells representing the CUs to be
monitored, and then click Select.
6. Click Apply. Performance Monitor starts monitoring the storage system.
5-6
Performance Monitor Operations
Hitachi Universal Storage Platform V/VM Hitachi Performance Manager User’s Guide
Note: When statistics are collected, a heavy workload is likely to be placed
on servers. Therefore, the client processing might slow down.
To stop monitoring the storage system:
1. Start Performance Monitor and select the Monitoring Options tab. The
Monitoring Options window is displayed.
2. In Monitoring Switch, select Disable for the Current Status option. The
Gathering Interval list is unavailable.
3. Click Apply. Performance Monitor stops monitoring the storage system.
Performance Monitor Operations
Hitachi Universal Storage Platform V/VM Hitachi Performance Manager User’s Guide
5-7
Monitoring Resources in the Storage System
This section describes how to view usage statistics about resources in the
storage system.
Before taking the following steps, you need to start monitoring in accordance
with the procedure described in Monitoring Options Window and obtain the
usage statistics.
Viewing Usage Statistics on Parity Groups
Performance Monitor monitors parity groups and lets you view the average
and the maximum usage rate in a specified period. Performance Monitor also
displays a graph illustrating changes in parity group usage within that period.
To view usage statistics about parity groups:
1. Ensure that the Performance Management window is displayed.
2. In the tree, click the Physical tab.
3. In the list above the tree, select the storing period of statistics from
longrange and shortrange for display.
For information on storing period of statistics, see Understanding Statistical
Storage Ranges.
When you view usage statistics about parity groups, the items displayed in
the list by selecting longrange and shortrange are the same.
4. In the tree, select the Parity Group folder.
The list on the right displays usage statistics about parity groups. The
displayed statistics are the average and the maximum usage rates for the
period specified in the From and To boxes.
The list displays up to a maximum of 4,096 resources at a time. If the
number of resources exceeds 4,096, use Previous and Next to display the
remaining resources.
5-8
–
If you change the date and time in the From and To boxes and then
click Apply, Performance Monitor recalculates usage rates and updates
information in the list. To change the date and time in From and To
boxes, use the arrow buttons and the sliders (for details, see
Performance Management Window, Physical Tab).
–
If an exclamation mark (!) is displayed before a usage rate, the
reported parity group usage rate is likely to be inaccurate, because the
configuration has changed (e.g., volumes have been moved by Volume
Migration or ShadowImage, or formatted by Virtual LVI or Open Volume
Management). For information on using Volume Migration, contact the
Hitachi Data Systems Support Center (see Calling the Hitachi Data
Systems Support Centeri.
–
If a plus mark (+) is displayed before a usage rate 0, such as "+0", the
usage rate is not completely 0 but less than 1.
Performance Monitor Operations
Hitachi Universal Storage Platform V/VM Hitachi Performance Manager User’s Guide
5. To display a graph illustrating changes in usage rate for parity groups,
select the desired parity groups in the list and then click Draw.
Note: The range of monitoring and the gathering interval affects the time
period represented by a graduation on the horizontal axis.
Figure 5-3 Example of Parity Group Usage Rates Displayed in the List
Notes:
•
It is possible that the usage rate for a parity group is not equal to the
sum of the usage rate for each volume in that parity group (see Viewing
Usage Statistics on Volumes in Parity Groups). This is because the
Performance Management window rounds off fractions below the
decimal point to the nearest whole number when displaying the usage
rate for each volume.
•
If there is no volume in a parity group, hyphens(-) are displayed in
place of performance statistics on a parity group.
If the CU is not the monitoring target, all items in the row are displayed
in italics. If you want to monitor those items, specify the CU as the
monitoring target by using the Monitoring Option window.
•
The list displays the following items:
•
: When the green checkmark icon
is displayed to the left of a parity
group, the graph illustrates changes in usage rate for the parity group.
•
PG: This column indicates IDs of parity groups.
•
RAID: This column indicates the RAID level (RAID-1, RAID-5, or RAID-6).
•
Drive Type: This column indicates types of HDDs (hard disk drives).
•
Usage:
•
–
The Ave. (Total) column displays the average usage rate in the
specified period.
–
The Max. column displays the maximum usage rate in the specified
period.
CLPR: This column indicates numbers and names of cache logical partitions
(CLPRs) corresponding to each parity group in the format "CLPRnumber:CLPR-name". For details on CLPRs, see the Virtual Partition
Manager User's Guide.
Performance Monitor Operations
Hitachi Universal Storage Platform V/VM Hitachi Performance Manager User’s Guide
5-9
Viewing Usage Statistics on Volumes in Parity Groups
Performance Monitor monitors volumes in parity groups and lets you view the
average and the maximum usage rate in a specified period. Performance
Monitor also displays a graph illustrating changes in volume usage within that
period.
To view usage statistics about volumes in a parity group:
1. Ensure that the Performance Management window is displayed.
2. In the tree, click the Physical tab
3. In the list above the tree, select the storing period of statistics from
longrange and shortrange for display.
For details on the types of storing period of statistics, see Understanding
Statistical Storage Ranges.
When you view usage statistics about volumes, some items displayed in
the list differ depending on the selection of the storing period: longrange
or shortrange. If you want to use Volume Migration to migrate volumes,
select longrange. This enables you to confirm the estimated usage rate of
parity groups after migration. For information on using Volume Migration,
contact the Hitachi Data Systems Support Center (see Calling the Hitachi
Data Systems Support Center.
If you want to examine the ratio of ShadowImage processing, and so on, to
all the processing in the physical drive, select shortrange.
The usage statistics for a same term might be slightly different between
selecting shortrange and longrange because the monitoring precision of
these two interval types differs. Especially, differences in read rates and
write rates between the interval types are larger than other usage statistics.
4. In the tree, double-click the Parity Group folder.
The folder opens and a list of parity groups is displayed below the folder.
5. Select the desired parity group.
The list on the right displays usage statistics about volumes in the specified
parity group. The displayed statistics are the average and the maximum
usage rates for the period specified in the From and To boxes.
5-10
Performance Monitor Operations
Hitachi Universal Storage Platform V/VM Hitachi Performance Manager User’s Guide
Notes:
The list displays up to a maximum of 4,096 resources at a time. If the
number of resources exceeds 4,096, use Previous and Next to display
the remaining resources.
If you change the date and time in the From and To boxes and then click
Apply, Performance Monitor recalculates usage rates and updates
information in the list. To change the date and time in From and To
boxes, use the arrow buttons and the sliders (for details, see
Performance Management Window, Physical Tab).
If an exclamation mark (!) is displayed before a usage rate, the reported
volume usage rate is likely to be inaccurate, because the configuration
has changed (e.g., volumes have been moved by Volume Migration or
ShadowImage, or formatted by Virtual LVI or Open Volume
Management). For information on using Volume Migration, contact the
Hitachi Data Systems Support Center (see Calling the Hitachi Data
Systems Support Center.
If a plus mark (+) is displayed before a usage rate 0, such as "+0", the
usage rate is not completely 0 but less than 1.
6. To display a graph illustrating changes in usage rate for volumes, select the
desired volumes in the list and then click Draw.
Note: The range of monitoring and the gathering interval affects the time
period represented by a graduation on the horizontal axis.
When selecting longrange for storing period of statistics:
When selecting shortrange for storing period of statistics:
Figure 5-4
Examples of Volume Usage Rates Displayed
Performance Monitor Operations
Hitachi Universal Storage Platform V/VM Hitachi Performance Manager User’s Guide
5-11
Note:
• It is possible that the sum of the usage rate for each volume in a parity
group is not equal to the usage rate for that parity group (see Viewing
Usage Statistics on Volumes in Parity Groups). This is because the
Performance Management window rounds off fractions below the decimal
point to the nearest whole number when displaying the usage rate for each
volume.
• If the CU is not the monitoring target, all items in the row are displayed in
italics. If you want to monitor those items, specify the CU as the
monitoring target by using the Monitoring Option window.
The list displays the following items:
•
: When the green checkmark icon
is displayed on the left of a volume,
the graph illustrates changes in usage rate for the volume.
•
LDEV: This column indicates volumes (LDEVs), in this format:
LDKC:CU:LDEV.
•
Emulation: This column indicates device emulation types.
•
Usage:
•
•
•
5-12
–
The Ave. (Total) column displays the average usage rate in the
specified period.
–
The Max. column displays the maximum usage rate in the specified
period.
Read Rate:
–
The Rnd. column indicates random read rates. A random read rate is
the ratio of random read requests to read and write requests.
–
The Seq. column indicates sequential read rates. A sequential read rate
is the ratio of sequential read requests to read and write requests.
Write Rate:
–
The Rnd. column indicates random write rates. A random write rate is
the ratio of random write requests to read and write requests.
–
The Seq. column indicates sequential write rates. A sequential write
rate is the ratio of sequential write requests to read and write requests.
Parity Gr. Use[Exp]: This item is displayed only when you select
longrange for the storing period of statistics. Parity Gr. Use[Exp]
assumes the volume might be migrated out of the parity group (or
uninstalled) and indicates expected (estimated) average and maximum
usage rates of the parity group. The Ave. (Total) column indicates an
estimated change in the average usage rate. The Max. column indicates an
estimated change in the maximum usage rate.
Performance Monitor Operations
Hitachi Universal Storage Platform V/VM Hitachi Performance Manager User’s Guide
For example, if the Ave. (Total) box for the volume 0:01 displays "20 ->
18", the average usage rate of the parity group that the volume belongs to
is 20 percent. If the volume were migrated out of the parity group, the
average usage rate of that group is expected to drop to 18 percent.
•
ShadowImage: This item is displayed only when you select shortrange
for the storing period of statistics. ShadowImage indicates the
percentage of the processing of the following programs to all the
processing of the physical drives, for each volume. This value is found by
dividing access time to physical drives by the following programs by all the
access time to physical drives.
–
ShadowImage for IBM z/OS
–
ShadowImage
–
Compatible FlashCopy
–
Compatible FlashCopy V2
–
Volume Migration (For information on using Volume Migration, contact
the Hitachi Data Systems Support Center (see Calling the Hitachi Data
Systems Support Center.)
–
Copy-on-Write Snapshot
The Ave. (Total) column displays the average percentage of processing of
the above programs in the specified period.
The Max. column displays the maximum percentage of processing of the
above programs in the specified period.
For details on the above programs, see the respective user's guides.
•
CLPR: This column indicates numbers and names of CLPRs corresponding
to each parity group which the volume belongs to, in the format
"CLPR-number:CLPR-name". For details on CLPRs, see the Virtual Partition
Manager User's Guide.
Performance Monitor Operations
Hitachi Universal Storage Platform V/VM Hitachi Performance Manager User’s Guide
5-13
Viewing Usage Statistics on External Volume Groups
Performance Monitor monitors external volume groups and lets you view the
usage statistics of external volume groups in a specified period. Performance
Monitor also displays a graph illustrating changes in the usage statistics of
external volume groups within that period.
You can view the usage statistics about external volume groups only when you
select shortrange for the storing period of statistics.
To view usage statistics about external volume groups:
1. Ensure that the Performance Management window is displayed.
2. In the tree, click the Physical tab.
3. In the list above the tree, select shortrange for the storing period of
statistics.
If you select longrange, no statistics appears in the list.
4. In the tree, select the External Group folder.
The list on the right displays usage statistics about external volume groups.
The displayed statistics are the usage statistics for the period specified in
the From and To boxes.
Notes:
The list displays up to a maximum of 4,096 resources at a time. If the
number of resources exceeds 4,096, use Previous and Next to display
the remaining resources.
If you change the date and time in the From and To boxes and then click
Apply, Performance Monitor recalculates usage rates and updates
information in the list. To change the date and time in From and To
boxes, use the arrow buttons and the sliders (for details, see
Performance Management Window, Physical Tab).
5. To display a graph illustrating changes in usage statistics for external
volume groups, select the desired external volume groups in the list and
then click Draw.
Note: The range of monitoring and the gathering interval affects the time
period represented by a graduation on the horizontal axis.
Figure 5-5
5-14
Example of Usage Statistics of an External Volume Group
Usages Displayed in the List
Performance Monitor Operations
Hitachi Universal Storage Platform V/VM Hitachi Performance Manager User’s Guide
Note: If the CU is not the monitoring target, all items in the row are
displayed in italics. If you want to monitor those items, specify the CU as
the monitoring target by using the Monitoring Option window.
The list displays the following items:
•
: When the green checkmark icon
is displayed on the left of an
external volume group, the graph illustrates changes in usage statistics for
the external volume group.
•
ExG: This column indicates IDs of external volume groups. The letter "E" at
the beginning of IDs indicates the group is an external volume group.
•
Response Time: This column indicates the time for replying from an
external volume group when I/O accesses are made from USP V/VM
storage system to the external volume group. The unit is milliseconds. The
average response time in the period specified at Monitoring Term is
displayed.
•
Trans.: This column indicates the sizes of data transferred between the
storage system and the external volume group in one second.
•
CLPR: This column indicates numbers and names of CLPRs corresponding
to each external volume group in the format "CLPR-number:CLPR-name".
For details on CLPRs, see the Virtual Partition Manager User's Guide.
Performance Monitor Operations
Hitachi Universal Storage Platform V/VM Hitachi Performance Manager User’s Guide
5-15
Viewing Usage Statistics on External Volumes in External Volume
Groups
Performance Monitor monitors external volumes in external volume groups
and lets you view the usage statistics of external volumes. Performance
Monitor also displays a graph illustrating changes in the usage statistics of
external volumes within that period.
You can view the usage statistics about external volumes only when you select
shortrange for the storing period of statistics.
To view usage statistics about external volumes in an external volume
group:
1. Ensure that the Performance Management window is displayed.
2. In the tree, click the Physical tab.
3. In the list above the tree, select shortrange for the storing period of
statistics.
If you select longrange, no statistics appears in the list.
4. In the tree, select the External Group folder.
The folder opens and a list of external volume groups is displayed below
the folder.
5. Select the desired external volume group.
The list on the right displays usage statistics about external volumes in the
specified external volume group. The displayed statistics are the average
and the maximum usage rates for the period specified in the From and To
boxes.
Notes:
The list displays up to a maximum of 4,096 resources at a time. If the
number of resources exceeds 4,096, use Previous and Next to display
the remaining resources.
If you change the date and time in the From and To boxes and then click
Apply, Performance Monitor recalculates usage rates and updates
information in the list. To change the date and time in From and To
boxes, use the arrow buttons and the sliders (for details, see
Performance Management Window, Physical Tab).
6. To display a graph illustrating changes in usage rate for external volumes,
select the desired external volumes in the list and then click Draw.
5-16
Performance Monitor Operations
Hitachi Universal Storage Platform V/VM Hitachi Performance Manager User’s Guide
Note: The range of monitoring and the gathering interval affects the time
period represented by a graduation on the horizontal axis.
Figure 5-6
Example of External Volume Usage Rates Displayed
Note: If the CU is not the monitoring target, all items in the row are
displayed in italics. If you want to monitor those items, specify the CU as
the monitoring target by using the Monitoring Option window.
The list displays the following items:
•
: When the green checkmark icon
is displayed on the left of a external
volume, the graph illustrates changes in usage rate for the external
volume.
•
ExLDEV: This column indicates external volumes, in this format:
LDKC:CU:LDEV. A number ending in # indicates the volume is an external
volume.
•
Emulation: This column indicates device emulation types.
•
Response Time: This column indicates the time for replying from an
external volume when I/O accesses are made from USP V/VM storage
system to the external volume. The unit is milliseconds. The average
response time in the period specified at Monitoring Term is displayed.
•
Trans.: This column indicates the sizes of data transferred between the
storage system and the external volume in one second.
•
CLPR: This column indicates numbers and names of CLPRs corresponding
to each external volume group which the external volume belongs to, in
the format "CLPR-number:CLPR-name". For details on CLPRs, see the
Virtual Partition Manager User's Guide.
Performance Monitor Operations
Hitachi Universal Storage Platform V/VM Hitachi Performance Manager User’s Guide
5-17
Viewing Usage Statistics on Channel Processors
Performance Monitor monitors channel processors in each channel adapter and
lets you view the average and the maximum usage rate in a specified period.
Performance Monitor also displays a graph illustrating changes in channel
processor usage within that period.
To view usage statistics about channel processors:
1. Ensure that the Performance Management window is displayed.
2. In the tree, click the Physical tab.
3. In the list above the tree, select the storing period of statistics from
longrange and shortrange for display.
For details on the types of storing period of statistics, see Understanding
Statistical Storage Ranges.
When you view usage statistics about channel processors, the items
displayed in the list by selecting longrange and shortrange are the same.
4. In the tree, do one of the following:
–
If you want to view usage statistics about all the channel processors in
your storage system, select the Client-Host Interface Processor
(CHIP) folder.
–
If you want to view usage statistics about channel processors in a
channel adapter, double-click the Client-Host Interface Processor
(CHIP) folder and then select the desired channel adapter.
The list on the right displays usage statistics about the channel processors.
The displayed statistics are the average and the maximum usage rates for
the period specified in the From and To boxes.
Note: If you change the date and time in the From and To boxes and then
click Apply, Performance Monitor recalculates usage rates and updates
information in the list. To change the date and time in From and To boxes,
use the arrow buttons and the sliders (for details, see Performance
Management Window, Physical Tab).
5. To display a graph illustrating changes in usage rate for channel
processors, select the desired channel processors in the list and then click
Draw.
Note: The range of monitoring and the gathering interval affects the time
period represented by a graduation on the horizontal axis.
5-18
Performance Monitor Operations
Hitachi Universal Storage Platform V/VM Hitachi Performance Manager User’s Guide
Figure 5-7
Example of Channel Processors Usage Rates Displayed
The list displays the following items:
•
: When the green checkmark icon
is displayed on the left of a channel
processor, the graph illustrates changes in usage rate for the channel
processor.
•
ID: This column displays ID numbers for channel processors.
•
Usage:
–
The Ave. (Total) column displays the average usage rate in the
specified period.
–
The Max. column displays the maximum usage rate in the specified
period.
Viewing Usage Statistics on Disk Processors
Performance Monitor monitors disk processors (DKPs) and lets you view the
average and the maximum usage rate in a specified period. Performance
Monitor also displays a graph illustrating changes in disk processor usage
within that period.
To view usage statistics about disk processors:
1. Ensure that the Performance Management window is displayed.
2. In the tree, click the Physical tab.
3. In the list above the tree, select the storing period of statistics from
longrange and shortrange for display.
For details on the types of storing period of statistics, see Understanding
Statistical Storage Ranges.
When you view usage statistics about disk processors, the items displayed
in the list by selecting longrange and shortrange are the same.
4. In the tree, double-click the ACP folder.
5. Click DKP from below the ACP folder.
The list on the right displays usage statistics about disk processors. The
displayed statistics are the average and the maximum usage rates for the
period specified in the From and To boxes.
Performance Monitor Operations
Hitachi Universal Storage Platform V/VM Hitachi Performance Manager User’s Guide
5-19
Note: If you change the date and time in the From and To boxes and then
click Apply, Performance Monitor recalculates usage rates and updates
information in the list. To change the date and time in From and To boxes,
use the arrow buttons and the sliders (for details, see Performance
Management Window, Physical Tab).
6. If you want to display a graph illustrating changes in usage rate for disk
processors, select the desired disk processors in the list and then click
Draw.
Note: The range of monitoring and the gathering interval affects the time
period represented by a graduation on the horizontal axis.
Figure 5-8
Example of Disk Processor Usage Rates Displayed
The list displays the following items:
5-20
•
: When the green checkmark icon
is displayed on the left of a disk
processor, the graph illustrates changes in usage rate for the disk
processor.
•
ID: This column displays ID numbers for disk processors.
•
Usage:
–
The Ave. (Total) column displays the average usage rate in the
specified period.
–
The Max. column displays the maximum usage rate in the specified
period.
Performance Monitor Operations
Hitachi Universal Storage Platform V/VM Hitachi Performance Manager User’s Guide
Viewing Usage Statistics on Data Recovery and Reconstruction
Processors
Performance Monitor tracks data recovery and reconstruction processors
(DRRs) and lets you view the average and the maximum usage rate in a
specified period. Performance Manager also displays a graph illustrating
changes in DRR usage within that period.
To view usage statistics about DRRs:
1. Ensure that the Performance Management window is displayed.
2. In the tree, click the Physical tab.
3. In the list above the tree, select the storing period of statistics from
longrange and shortrange for display.
For details on the types of storing period of statistics, see Understanding
Statistical Storage Ranges.
When you view usage statistics about DRRs, the items displayed in the list
by selecting longrange and shortrange are the same.
4. In the tree, double-click the ACP folder.
5. Click DRR from below the ACP folder.
The list on the right displays usage statistics about DRRs. The displayed
statistics are the average and the maximum usage rates for the period
specified in the From and To boxes.
Note: If you change the date and time in the From and To boxes and then
click Apply, Performance Monitor recalculates usage rates and updates
information in the list. To change the date and time in From and To boxes,
use the arrow buttons and the sliders (for details, see Performance
Management Window, Physical Tab).
6. If you want to display a graph illustrating changes in usage rate for DRRs,
select the desired DRRs in the list and then click Draw.
Note: The range of monitoring and the gathering interval affects the time
period represented by a graduation on the horizontal axis.
Figure 5-9
Example of DRR Usage Rates Displayed in the List
Performance Monitor Operations
Hitachi Universal Storage Platform V/VM Hitachi Performance Manager User’s Guide
5-21
The list displays the following items:
•
: When the green checkmark icon
is displayed on the left of a DRR,
the graph illustrates changes in usage rate for the DRR.
•
ID: This column displays ID numbers for DRRs.
•
Usage:
–
The Ave. (Total) column displays the average usage rate in the
specified period.
–
The Max. column displays the maximum usage rate in the specified
period.
Viewing Write Pending and Cache Memory Usage Statistics
Performance Monitor lets you view write pending rates. A write pending rate
indicates the ratio of write-pending data to the cache memory capacity.
Performance Monitor displays the average and the maximum write pending
rate in a specified period. When you select shortrange for storing period of
statistics, Performance Monitor also displays the average and the maximum
usage statistics about the cache memory in a specified period. In addition,
Performance Monitor can display a graph illustrating changes in write pending
rate or usage statistics of the cache memory within that period.
To view the write pending rate or usage statistics of the cache memory:
1. Ensure that the Performance Management window is displayed.
2. In the tree, click the Physical tab.
3. In the list above the tree, select the storing period of statistics from
longrange and shortrange for display.
For details on the types of storing period of statistics, see Understanding
Statistical Storage Ranges.
The items displayed in the list are a little different depending on the
selection of the storing period: longrange or shortrange. The write
pending rates are displayed by both selection, but usage statistics of the
cache memory are displayed only when you select shortrange.
4. In the tree, select the Cache folder.
The list on the right displays the write pending rates. If you select
shortrange for the storing period of statistics, the list also displays usage
statistics about the cache memory.
Average and maximum usage rates for the period specified in From and To
are displayed.
If you change the date and time in From and To and then click Apply,
Performance Monitor recalculates the write pending rates and usage
statistics about the cache memory, and updates information in the list. To
change the date and time in From and To, use the arrow buttons and the
sliders (for details, see Performance Management Window, Physical Tab).
5-22
Performance Monitor Operations
Hitachi Universal Storage Platform V/VM Hitachi Performance Manager User’s Guide
5. If you want to display a graph illustrating changes in the write pending rate
or in usage statistics about the cache memory, select the row of the write
pending rate in the list and then click Draw.
The range of monitoring and the gathering interval affects the time period
represented by a graduation on the horizontal axis.
6. When you select shortrange for the storing period of statistics, you can
select the item to be illustrated in the graph from the list at the upper right
on the graph.
Select Write Pending to view the write pending rate graph and select
Usage to view that of the usage statistics for cache memory. The graph
will be updated without clicking Draw. You can also select the item to be
displayed before clicking Draw.
Figure 5-10
Selecting an Item to be Displayed in the Graph (Shortrange)
Examples of write pending rate displayed in the lists are shown below:
When selecting longrange for storing period of statistics:
When selecting shortrange for storing period of statistics:
Performance Monitor Operations
Hitachi Universal Storage Platform V/VM Hitachi Performance Manager User’s Guide
5-23
Figure 5-11
Example of Write Pending Rate and Cache Usage Rate
Displayed
The list displays the following items:
•
: When the green checkmark icon
is displayed on the left of the write
pending rate, the graph illustrates changes in the write pending rate and
usage statistics about the cache memory.
•
CLPR: This column indicates numbers and names of cache logical partitions
(CLPRs) in the format "CLPR-number:CLPR-name". For details on CLPRs,
see the Virtual Partition Manager User's Guide.
•
Usage: This item is displayed only when you select shortrange for the
storing period of statistics.
•
–
The Ave. (Total) column displays the average usage rate of the cache
in the specified period.
–
The Max. column displays the maximum usage rate of the cache in the
specified period.
Write Pending:
–
The Ave. (Total) column displays the average write pending rate for
the specified period.
–
The Moment Max. column displays the maximum write pending rate
for the specified period.
Viewing Usage Statistics on Access Paths
The channel adapters (CHAs) and the disk adapters (DKAs) transfer data to
the cache switch (CSW) and the shared memory (SM) when I/O requests are
issued from hosts to the storage system. In some configurations, DKAs are
called array control processors (ACPs). Also, the cache switch transfers data to
the cache memory.
Performance Monitor audits these data transfer paths and lets you view the
average and the maximum usage rate for the paths in a specified period.
Performance Monitor also displays a graph illustrating changes in path usage
within that period.
To view usage statistics about paths:
1. Ensure that the Performance Management window is displayed.
2. In the tree, click the Physical tab.
5-24
Performance Monitor Operations
Hitachi Universal Storage Platform V/VM Hitachi Performance Manager User’s Guide
3. In the list above the tree, select the storing period of statistics from
longrange and shortrange for display.
For details on the types of storing period of statistics, see Understanding
Statistical Storage Ranges.
When you view usage statistics about paths, the items displayed in the list
by selecting longrange and shortrange are the same.
4. In the tree, double-click the Access Path Usage folder.
5. Do one of the following:
–
To check usage statistics about paths between adapters (CHAs and
DKAs) and the cache switch, select Adapter-CSW, from below the
Access Path Usage folder.
–
To check usage statistics about paths between adapters (CHAs and
DKAs) and the shared memory, select Adapter-SM, from below the
Access Path Usage folder.
–
To check usage statistics about paths between cache switches and the
cache memory, select CSW-Cache, from below the Access Path
Usage folder.
The list on the right in Figure 5-12 displays the average and maximum
usage rate for the specified paths. The displayed statistics are the average
and the maximum usage rates for the period specified in the From and To
boxes.
Note: If you change the date and time in the From and To boxes and then
click Apply, Performance Monitor recalculates usage rates and updates
information in the list. To change the date and time in From and To boxes,
use the arrow buttons and the sliders (for details, see Performance
Management Window, Physical Tab).
6. If you want to display a graph illustrating changes in usage statistics about
paths, select the desired paths in the list and then click Draw.
Note: The range of monitoring and the gathering interval affects the time
period represented by a graduation on the horizontal axis.
Paths between adapters and cache switches:
Paths between adapters and shared memories:
Performance Monitor Operations
Hitachi Universal Storage Platform V/VM Hitachi Performance Manager User’s Guide
5-25
Paths between cache switches and cache memory:
Figure 5-12
Examples of Usage Statistics Displayed in the List
•
: When the green checkmark icon
is displayed on the left of the
access path, the graph illustrates changes in usage rate for the access
path.
•
Adapter: This column indicates adapters.
•
CSW: This column indicates cache switches.
•
SM: This column indicates shared memories.
•
Cache: This column indicates the cache memories.
•
Usage:
–
The Ave. (Total) column displays the average usage rate for the
specified period.
–
The Max. column displays the maximum usage rate for the specified
period.
Monitoring Hard Disk Drives
The LDEV tab of the Performance Management window lets you check
workloads on physical hard disk drives (parity groups) or on volumes. The
LDEV tab displays the I/O rate and the transfer rate. The I/O rate indicates
the number of disk I/Os per second. The transfer rate indicates the size of
data transferred to the disk in one second.
In addition, the LDEV tab displays the read hit ratio and the write hit ratio.
5-26
Performance Monitor Operations
Hitachi Universal Storage Platform V/VM Hitachi Performance Manager User’s Guide
•
For a read I/O, when the requested data is already in cache, the operation
is classified as a read hit.
•
For a write I/O, when the requested data is already in cache, the operation
is classified as a write hit.
This section describes how to view the statistics about disk access
performance. Before taking the following steps, you need to start monitoring
in accordance with the procedure described in Starting and Stopping Storage
System Monitoring and obtain the usage statistics.
Viewing I/O Rates for Disks
Performance Monitor monitors hard disk drives and measures I/O rates (that
is, the number of disk I/Os per second).
To view I/O rates:
1. Ensure that the Performance Management window is displayed.
2. Click the LDEV tab.
The tree displays a list of parity groups and external volume groups.
3. Select IOPS from the list on the right side of the window.
4. In the tree, do one of the following:
–
If you want to view the I/O rate for each parity group and external
volume group, select the Subsystem folder or a Box folder.
The list on the right displays the I/O rate for each group.
Note: If you select the Subsystem folder, the list displays all parity
groups and external volume groups. To narrow the number of groups to be
displayed in the list, select a Box folder. For example, if you select the Box
1 folder, the list displays only the parity groups whose IDs start with "1-".
–
If you want to view the I/O rate for each volume, select the parity
group or external volume group that contains the volumes.
The list on the right displays the I/O rate for each volume in the
selected group.
The displayed statistics are the average and the maximum I/O rates for the
period specified in the From and To boxes.
Performance Monitor Operations
Hitachi Universal Storage Platform V/VM Hitachi Performance Manager User’s Guide
5-27
Notes:
The list displays up to a maximum of 4,096 resources at a time. If the
number of resources exceeds 4,096, use Previous and Next to display
the remaining resources.
If you change the date and time in the From and To boxes and then click
Apply, Performance Monitor recalculates usage rates and updates
information in the list. To change the date and time in From and To
boxes, use the arrow buttons and the sliders (for details, see
Performance Management Window, Physical Tab).
5. To display a graph to find out how the I/O rate has been changed, take the
following steps:
a. In the list, select the parity group(s), the external volume groups, or
the volume(s) that you want.
b. Use the list at the right side of the list to select the type of information
that you want to view in the graph. For details on the information that
can be displayed, see Table 4-1.
c. Click Draw.
A graph appears below the list. The horizontal axis indicates the time.
Caution: If the graph does not display changes in the I/O rate (for
example, if the line in the graph runs vertically), it is recommended that
you change the value in the Chart Y Axis Rate list. For example, if the
largest value in the list is 200 and the value in Chart Y Axis Rate is
100, you should select a value larger than 200 from Chart Y Axis
Rate.
d. To view more detailed information in the graph, use the list to the right
of the list to select the type of information that you want. Next, select
the Detail check box at the lower right of the list and then click Draw.
The detailed graph contents change as described in Table 4-2.
Caution: If more than one parity group or volume is selected in the list,
you cannot select the Detail check box to view detailed information.
I/O rate for parity groups and external volume groups (When the
Subsystem folder is selected):
5-28
Performance Monitor Operations
Hitachi Universal Storage Platform V/VM Hitachi Performance Manager User’s Guide
I/O rate for parity groups or external volume groups (When the Box 1
folder is selected):
I/O rate for volumes:
Figure 5-13
I/O Rates for Disks
Notes:
•
•
•
It is possible that the I/O rate for a parity group or an external volume
group is not equal to the sum of the I/O rate for each volume in that
group. This is because the Performance Management window omits
fractions below the decimal point when displaying the I/O rate for each
volume.
If there is no volume in a parity group, hyphens (-) are displayed in
place of performance statistics on a parity group.
If the CU is not the monitoring target, all items in the row are displayed
in italics. If you want to monitor those items, specify the CU as the
monitoring target by using the Monitoring Option window.
The list displays the following:
•
: When the green checkmark icon
is displayed on the left of an item,
the graph displays workload statistics about the parity group, the external
volume group, or the volume.
•
PG: Indicates the parity group ID or the external volume group ID. If the
ID starts with the letter "E", the group is an external volume group. If the
ID starts with the letter "V" or "X", the group is a V-VOL group.
•
LDEV: Indicates the volume ID. If the ID ends with the pound or gate
symbol (#), the volume is an external volume. If the ID ends with the
symbol "V" or "X", the volume is a virtual volume.
•
Emulation: Indicates the emulation type.
•
IO Rate: Indicates the number of I/O requests to the parity group, the
external volume group, or the volume per second.
Performance Monitor Operations
Hitachi Universal Storage Platform V/VM Hitachi Performance Manager User’s Guide
5-29
•
Read: Indicates the number of read requests to the parity group, the
external volume group, or the volume per second.
•
Write: Indicates the number of write requests to the parity group, the
external volume group, or the volume per second.
•
Read Hit: Indicates the read hit ratio.
•
Write Hit: Indicates the write hit ratio.
•
Back Trans.: Indicates the number of data transfers per second between
the parity group (or the external volume group, or the volume) and the
cache memory.
•
Response Time: This column indicates the time for replying from the
parity group, the external volume group, or the volume when I/O accesses
are made from the host to them. The unit is milliseconds. The average
response time in the period specified at Monitoring Term is displayed.
•
CLPR: This column indicates numbers and names of CLPRs corresponding
to each parity group, external volume group, or volume in the format
"CLPR-number:CLPR-name". For details on CLPRs, see the Virtual Partition
Manager User's Guide.
Viewing Transfer Rates for Disks
Performance Monitor audits hard disk drives and measures transfer rates (that
is, the size of data transferred in one second).
To view transfer rates:
1. Ensure that the Performance Management window is displayed.
2. Click the LDEV tab.
The tree displays a list of parity groups and external volume groups.
3. Select MB/s from the list on the right side of the window.
4. In the tree, do one of the following:
–
5-30
To view the transfer rate for each parity group and external volume
group, select the Subsystem folder or a Box folder.
The list on the right displays the transfer rate for each group.
Performance Monitor Operations
Hitachi Universal Storage Platform V/VM Hitachi Performance Manager User’s Guide
Notes:
• If you select the Subsystem folder, the list displays all parity groups
and external volume groups. To narrow the number of groups to be
displayed in the list, select a Box folder. For example, if you select the
Box 1 folder, the list displays only the parity groups whose IDs start
with "1-".
•
To view the transfer rate for each volume, select the parity group or
external volume group that contains the volumes.
The list on the right displays the transfer rate for each volume in the
selected group.
The displayed statistics are the average and the maximum transfer rates
for the period specified in the From and To boxes.
Notes:
The list displays up to a maximum of 4,096 resources at a time. If the
number of resources exceeds 4,096, use Previous and Next to display
the remaining resources.
If you change the date and time in the From and To boxes and then click
Apply, Performance Monitor recalculates usage rates and updates
information in the list. To change the date and time in From and To
boxes, use the arrow buttons and the sliders (for details, see LDEV Tab
of the Performance Monitor Window).
5. If you want to display a graph to find out how the transfer rate has been
changed, take the following steps:
a. In the list, select the parity group(s), the external volume groups, or
the volume(s) that you want.
b. Use the list on the right to select the type of information that you want
to view in the graph. For details on the information that can be
displayed, see Table 4-1.
c. Click Draw.
A graph appears below the list. The horizontal axis indicates the time.
Caution: If the graph does not display changes in the transfer rate (for
example, if the line in the graph runs vertically), it is recommended that
you change the value in the Chart Y Axis Rate list. For example, if the
largest value in the list is 200 and the value in Chart Y Axis Rate is
100, you should select a value larger than 200 from Chart Y Axis
Rate.
d. If you want to view more detailed information in the graph, use the list
on the right to select the type of information that you want. Next, select
the Detail check box at the lower right of the list and then click Draw.
The detailed graph contents change as described in Table 4-2.
Performance Monitor Operations
Hitachi Universal Storage Platform V/VM Hitachi Performance Manager User’s Guide
5-31
Caution: If more than one parity group or volume is selected in the list,
you cannot select the Detail check box to view detailed information.
Transfer rate for parity groups and external volume groups (When the
Subsystem folder is selected):
Transfer rate for parity groups or external volume groups (When the
Box 1 folder is selected):
Transfer rate for volumes:
Figure 5-14
Transfer Rates for Disks
Notes:
It is possible that the transfer rate for a parity group or an external volume
group is not equal to the sum of the transfer rate for each volume in that
group. This is because the Performance Management window omits
fractions below the decimal point when displaying the transfer rate for each
volume.
If there is no volume in a parity group, hyphens (-) are displayed in place of
performance statistics on a parity group.
If the CU is not the monitoring target, all items in the row are displayed in
italics. If you want to monitor those items, specify the CU as the
monitoring target by using the Monitoring Option window.
The list displays the following:
5-32
Performance Monitor Operations
Hitachi Universal Storage Platform V/VM Hitachi Performance Manager User’s Guide
•
: When the green checkmark icon
is displayed on the left of an item,
the graph displays workload statistics about the parity group, the external
volume group, or the volume.
•
PG: Indicates the parity group ID or the external volume group ID. If the
ID starts with the letter "E", the group is an external volume group.
•
LDEV: Indicates the volume ID. If the ID ends with the symbol "#", the
volume is a an external volume.
•
Emulation: Indicates the emulation type.
•
Trans.: Indicates the size (in megabytes) of data transferred to the parity
group, the external volume group, or the volume per second.
•
Read Hit: Indicates the read hit ratio.
•
Write Hit: Indicates the write hit ratio.
•
Back Trans.: Indicates the number of data transfers per second between
the parity group (or the external volume group, or the volume) and the
cache memory.
•
Response Time: This column indicates the time for replying from the
parity group, the external volume group, or the volume when I/O accesses
are made from the host to them. The unit is milliseconds. The average
response time in the period specified at Monitoring Term is displayed.
This column displays a hyphen (-) if the I/O rate is 0 (zero).
•
CLPR: This column indicates numbers and names of CLPRs corresponding
to each parity group, external volume group, or volume in the format
"CLPR-number:CLPR-name". For details on CLPRs, see the Virtual Partition
Manager User's Guide.
Performance Monitor Operations
Hitachi Universal Storage Platform V/VM Hitachi Performance Manager User’s Guide
5-33
Monitoring Ports
Performance Monitor monitors ports on the storage system and measures I/O
rates (that is, the number of I/Os per second) and transfer rates (that is, the
size of data transferred per second). This section describes how to view I/O
rates and transfer rates of ports on the storage system. Before taking the
following steps, you need to start monitoring in accordance with the procedure
described in Starting and Stopping Storage System Monitoring and obtain the
usage statistics.
Performance Monitor can obtain statistics about traffics of ports connected to
open-system host groups only. The statistics about traffics of ports connected
to mainframe host groups cannot be obtained.
Viewing I/O Rates for Ports
Performance Monitor monitors ports on the storage system and measures I/O
rates (that is, the number of disk I/Os per second).
To view I/O rates:
1. Ensure that the Performance Management window is displayed.
2. Select the Port-LUN tab.
The tree displays a Subsystem folder.
3. Select the Subsystem folder.
The Target folder and the Initiator/External folder are displayed.
4. Select IOPS from the list on the right side of the window.
5. In Monitoring Term, do one of the following:
–
To view the I/O rate in real time, you must select the Real Time option,
specify the number of recent collections of statistics which should be
displayed in the graph, and then click Apply.
–
To view I/O rates for a certain period of time in the last 24 hours, you
must select the From option, change the date and time in the From
and To boxes, and then click Apply. Use the arrow button and the
sliders when you change the date and time in the From and To boxes.
For details on the Real Time option and the From option, see Viewing Port
Workload Statistics.
6. In the tree, select the Target folder, or the Initiator/External folder.
The list on the right displays I/O rates for the ports on the storage system.
If you click the Target folder the tree displays a list of ports on the storage
system. If you click a port icon (for example,
and
), the host groups
( ) corresponding to that port appear.
Tips:
5-34
Performance Monitor Operations
Hitachi Universal Storage Platform V/VM Hitachi Performance Manager User’s Guide
–
If you select a port (for example,
and
) in the tree, the list
displays I/O rates for all the host bus adapters connected to the
selected port=.
–
If you select a host group ( ) in the tree, the list displays I/O rates for
host bus adapters in the host group.
7. To display a graph to find out how the I/O rate has been changed, take the
following steps:
a. In the list, select one or more ports or host bus adapters (WWNs).
b. Click Draw.
Caution: If the graph does not display changes in the I/O rate (for
example, if the line in the graph runs vertically), it is recommended that
you change the value in the Chart Y Axis Rate list. For example, if the
largest value in the list is 200 and the value in Chart Y Axis Rate is 100,
you should select a value larger than 200 from Chart Y Axis Rate.
I/O rate for ports (When the Subsystem folder is selected):
All Prio. indicates
all the prioritized
ports.
All Non-Prio.
indicates all the
non-prioritized
ports
I/O rate for ports (When the Target folder is selected):
I/O rate for ports (When the Initiator/External folder is
selected):
I/O rate for host bus adapters connected to a specified port
(When a port ((for example,
and
) is selected):
Performance Monitor Operations
Hitachi Universal Storage Platform V/VM Hitachi Performance Manager User’s Guide
5-35
I/O rates for host bus adapters in a host group
(When a host group ( )is selected):
Figure 5-15
I/O Rates for Ports
The list displays the following:
•
: When the green checkmark icon
is displayed on the left of an item,
the graph displays changes in workload statistics about the item.
•
Port: Indicates ports on the storage system.
•
WWN: Indicates WWNs of the host bus adapters.
•
SPM Name: Indicates SPM names of the host bus adapters. Server Priority
Manager allows you assign an SPM name to each host bus adapter so that
you can easily identify each host bus adapters in the Server Priority
Manager windows.
•
Nickname: Indicates the nickname for the host bus adapters. LUN
Manager allows you to assign a nickname to each host bus adapter so that
you can easily identify each host bus adapter in the LUN Manager windows.
•
Current: Indicates the current I/O rate.
•
Ave.: Indicates the average I/O rate for the specified period.
•
Peak: Indicates the peak I/O rate of the ports for the specified period. This
value is shown in the list when you select the Subsystem folder in the tree.
If you select a port in the list, click Draw, and select the Detail check box,
the detailed graph of the port I/O rate is drawn. The Peak value means the
top of the Max. line in this graph.
5-36
•
Max.: Indicates the maximum I/O rate for the specified period. This value
is shown in the list when you select a port icon or host group icon in the
tree.
•
Response Time: This column indicates the time for replying from the port
or host bus adapter when I/O accesses are made from the host to them.
The unit is milliseconds. The average response time in the period specified
at Monitoring Term is displayed.
•
Attribute: Indicates the priority of each port. Prio. indicates a prioritized
port. Non-Prio. indicates a non-prioritized port.
Performance Monitor Operations
Hitachi Universal Storage Platform V/VM Hitachi Performance Manager User’s Guide
Note: In the list of Port-LUN tab, two types of aliases appear for host bus
adapters: SPM name and nickname. If you select a port icon in the tree,
SPM names defined by Server Priority Manager appear. If you select a host
group icon in the tree, nicknames defined by LUN Manager appear. We
recommend that you specify the same name for an SPM name and a
nickname for convenience of host bus adapter management.
•
Initiator/External: Indicates the port attribute. Initiator indicates an
initiator port. External indicates an external port. Both of the ports are not
controlled by Server Priority Manager.
Viewing Transfer Rates for Ports
Performance Monitor monitors ports on the storage system and measures
transfer rates (that is, the size of data transferred in one second).
To view transfer rates:
1. Ensure that the Performance Management window is displayed.
2. Select the Port-LUN tab.
The tree displays a Subsystem folder.
3. Select the Subsystem folder.
The Target folder and the Initiator/External folder are displayed.
4. Select MB/s from the list on the right side of the window.
5. In Monitoring Term, do one of the following:
–
To view the transfer rate in real time, you must select the Real Time
option, specify the number of recent collections of statistics which
should be displayed in the graph, and then click Apply.
–
To view transfer rates for a certain period of time in the last 24 hours,
you must select the From option, change the date and time in the
From and To boxes, and then click Apply. Use the arrow button and
the sliders when you change the date and time in the From and To
boxes.
For details on the Real Time option and the From option, see Viewing Port
Workload Statistics.
6. In the tree, select the Target folder, or the Initiator/External folder.
The list on the right displays transfer rates for the ports on the storage
system. If you click the Target folder, the tree displays a list of ports on
the storage system. If you click a port icon (for example,
and
), the
host groups ( ) corresponding to that port appear.
Tips:
Performance Monitor Operations
Hitachi Universal Storage Platform V/VM Hitachi Performance Manager User’s Guide
5-37
–
If you select a port (for example,
and
) in the tree, the list
displays transfer rates for all the host bus adapters connected to the
selected port.
–
If you select a host group ( ) in the tree, the list displays transfer
rates for host bus adapters in the host group.
Note: You cannot view information about host bus adapters if the host
group is not registered in LUN Manager.
7. If you want to display a graph to find out how the transfer rate has been
changed, take the following steps:
a. In the list, select one or more ports or host bus adapters (WWNs).
b. Click Draw.
Caution: If the graph does not display changes in the transfer rate (for
example, if the line in the graph runs vertically), it is recommended that
you change the value in the Chart Y Axis Rate list. For example, if the
largest value in the list is 200 and the value in Chart Y Axis Rate is 100,
you should select a value larger than 200 from Chart Y Axis Rate.
Transfer rate for ports (When the Subsystem folder is selected):
All Prio. indicates all
the prioritized ports.
All Non-Prio. indicates
all the non-prioritized
ports.
Transfer rate for ports (When the Target folder is selected):
I/O rate for ports (When the Initiator/External folder is selected):
5-38
Performance Monitor Operations
Hitachi Universal Storage Platform V/VM Hitachi Performance Manager User’s Guide
Transfer rate for host bus adapters connected to a specified port
and
) is selected):
(When a port ((for example,
Transfer rates for host bus adapters in a host group(When a host
group ( )is selected):
Figure 5-16
Transfer Rates for Ports
The list displays the following:
•
: When the green checkmark icon
is displayed on the left of an item,
the graph displays changes in workload statistics about the item.
•
Port: Indicates ports on the storage system.
•
WWN: Indicates WWNs of the host bus adapters.
•
SPM Name: Indicates SPM names of the host bus adapters. Server Priority
Manager allows you assign an SPM name to each host bus adapter so that
you can easily identify each host bus adapters in the Server Priority
Manager windows.
•
Nickname: Indicates the nickname for the host bus adapters. LUN
Manager allows you to assign a nickname to each host bus adapter so that
you can easily identify each host bus adapter in the LUN Manager windows.
•
Current: Indicates the current transfer rate.
•
Ave.: Indicates the average transfer rate for the specified period.
•
Peak: Indicates the peak transfer rate of the ports for the specified period.
This value is shown in the list when you select the Subsystem folder in the
tree.
If you select a port in the list, click Draw, and select the Detail check box,
the detailed graph of the port transfer rate is drawn. The Peak value
means the top of the Max. line in this graph.
•
Max.: Indicates the maximum transfer rate for the specified period. This
value is shown in the list when you select a port icon or host group icon in
the tree.
Performance Monitor Operations
Hitachi Universal Storage Platform V/VM Hitachi Performance Manager User’s Guide
5-39
•
Response Time: This column indicates the time for replying from the port
or host bus adapter when I/O accesses are made from the host to them.
The unit is milliseconds. The average response time in the period specified
at Monitoring Term is displayed.
This column displays a hyphen (-) if the I/O rate is 0 (zero).
•
Attribute: Indicates the priority of each port. Prio. indicates a prioritized
port. Non-Prio. indicates a non-prioritized port.
Note: In the list of Port-LUN tab, two types of aliases appear for host bus
adapters: SPM name and nickname. If you select a port icon in the tree,
SPM names defined by Server Priority Manager appear. If you select a host
group icon in the tree, nicknames defined by LUN Manager appear. We
recommend that you specify the same name for an SPM name and a
nickname for convenience of host bus adapter management.
•
Initiator/External: Indicates the port attribute. Initiator indicates an
initiator port. External indicates an external port. Both of the ports are not
controlled by Server Priority Manager.
Viewing Details about the I/O and Transfer Rates
To view detailed information about the I/O rate or the transfer rate for a port:
1. From the list at the right side of the window, select the type of statistics to
be displayed.
–
To view I/O rates, select IOPS (I/Os per second) from the list.
–
To view transfer rates, select MB/s (megabytes per second) from the
list.
2. Select the Subsystem folder in the tree.
3. Select a port from the list.
4. Click Draw.
The graph that is not in detail is displayed.
5. Select the Detail check box
The graph contents change as described in Figure 4-10.
5-40
Performance Monitor Operations
Hitachi Universal Storage Platform V/VM Hitachi Performance Manager User’s Guide
Monitoring LU Paths
Performance Monitor monitors LU paths and measures I/O rates (that is, the
number of I/Os per second) and transfer rates (that is, the size of data
transferred per second). This section describes how to view I/O rates and
transfer rates of LU paths on the storage system. Before taking the following
steps, you need to start monitoring in accordance with the procedure
described in Starting and Stopping Storage System Monitoring and obtain the
usage statistics.
The traffic statistics reported for an LU is aggregated across all LU paths
defined for an LU.
•
I/O rate is the sum of I/Os across all LU paths defined for an LU.
•
Transfer rate is the total transfer rate across all LU paths defined for an LU.
•
Response time is the average response time across all LU paths defined
for an LU.
Viewing LU Paths I/O Rates
Performance Monitor monitors LU paths and measures I/O rates (that is, the
number of disk I/Os per second).
To view I/O rates:
1. Ensure that the Performance Management window is displayed.
2. Select the Port-LUN tab.
The tree displays a list of ports on the storage system.
3. Select IOPS from the list on the right side of the window.
4. In Monitoring Term, do one of the following:
–
To view the I/O rate in real time, you must select the Real Time option,
specify the number of recent collections of statistics which should be
displayed in the graph, and then click Apply.
–
To view I/O rates for a certain period of time in the last 24 hours, you
must select the From option, change the date and time in the From
and To boxes, and then click Apply. Use the arrow button and the
sliders when you change the date and time in the From and To boxes.
For details on the Real Time option and the From option, see Viewing Port
Workload Statistics.
5. In the tree, double-click a port (for example,
host group ( ).
The LUN icon (
or
) and then select a
) appears.
6. Select LUN.
The list on the right displays a list of LU paths and I/O rates.
Performance Monitor Operations
Hitachi Universal Storage Platform V/VM Hitachi Performance Manager User’s Guide
5-41
7. If you want to display a graph to find out how the I/O rate has been
changed, take the following steps:
a. In the list, select one or more LUNs.
b. Click Draw.
Note: If the graph does not display changes in the I/O rate (for example, if
the line in the graph runs vertically), it is recommended that you change
the value in the Chart Y Axis Rate list. For example, if the largest value in
the list is 200 and the value in Chart Y Axis Rate is 100, you should
select a value larger than 200 from Chart Y Axis Rate.
8. If you want to view more detailed information in the graph, select the
Detail check box at the lower right of the list. The graph contents change
as described in Table 4-3.
Note: If more than one row is selected in the list, you cannot select the
Detail check box.
Figure 5-17
I/O Rates for LU Paths
Note: If the CU is not the monitoring target, all items in the row are
displayed in italics. If you want to monitor those items, specify the CU as
the monitoring target by using the Monitoring Option window.
The list displays the following:
5-42
•
: When the green checkbox icon
is displayed on the left of an item,
the graph displays changes in workload statistics about the item.
•
LUN: Indicates LUNs (logical unit numbers).
•
LDEV: Indicates IDs of volumes, in the following format: LDKC:CU:LDEV.
An ID ending in # indicates the volume is an external volume. An ID
ending in V or X indicates the volume is a virtual volume.
•
Emulation: Indicates emulation types.
•
Paths: Indicates the number of LU paths (i.e., paths to volumes).
•
Current: Indicates the current I/O rate.
•
Ave.: Indicates the average I/O rate for the specified period.
•
Max.: Indicates the maximum I/O rate for the specified period.
Performance Monitor Operations
Hitachi Universal Storage Platform V/VM Hitachi Performance Manager User’s Guide
•
Response Time: This column indicates the time for replying from the LU
paths when I/O accesses are made from the host to the LU paths. The unit
is milliseconds. The average response time in the period specified at
Monitoring Term is displayed.
Viewing LU Paths Transfer Rates
Performance Monitor monitors LU paths and measures transfer rates (that is,
the size of data transferred in one second).
To view transfer rates:
1. Ensure that the Performance Management window is displayed.
2. Select the Port-LUN tab.
The tree displays a list of ports on the storage system.
3. Select MB/s from the list on the right side of the window.
4. In Monitoring Term, do one of the following:
–
To view the transfer rate in real time, you must select the Real Time
option, specify the number of recent collections of statistics which
should be displayed in the graph, and then click Apply.
–
To view transfer rates for a certain period of time in the last 24 hours,
you must select the From option, change the date and time in the
From and To boxes, and then click Apply. Use the arrow button and
the sliders when you change the date and time in the From and To
boxes.
For details on the Real Time option and the From option, see Port-LUN
Tab of the Performance Monitor Window.
5. In the tree, double-click a port (for example,
host group ( ).
The LUN icon (
or
) and then select a
) appears.
6. Select LUN.
The list on the right displays a list of LU paths and transfer rates.
7. If you want to display a graph to find out how the transfer rate has been
changed, take the following steps:
a. In the list, select one or more LUNs.
b. Click Draw.
Note: If the graph does not display changes in the transfer rate (for
example, if the line in the graph runs vertically), it is recommended that
you change the value in the Chart Y Axis Rate list. For example, if the
largest value in the list is 200 and the value in Chart Y Axis Rate is 100,
you should select a value larger than 200 from Chart Y Axis Rate.
Performance Monitor Operations
Hitachi Universal Storage Platform V/VM Hitachi Performance Manager User’s Guide
5-43
8. If you want to view more detailed information in the graph, select the
Detail check box at the lower right of the list. The graph contents change
as described in Table 4-3.
Note: If more than one row is selected in the list, you cannot select the
Detail check box.
Figure 5-18
Transfer Rates for LU Paths
Note: If the CU is not the monitoring target, all items in the row are
displayed in italics. If you want to monitor those items, specify the CU as
the monitoring target by using the Monitoring Option window.
The list displays the following:
•
: When the green checkmark icon
is displayed on the left of an item,
the graph displays changes in workload statistics about the item.
•
LUN: Indicates LUNs (logical unit numbers).
•
LDEV: Indicates IDs of volumes, in the following format: LDKC:CU:LDEV.
An ID ending in # indicates the volume is an external volume. An ID
ending in V or X indicates the volume is a virtual volume.
•
Emulation: Indicates emulation types.
•
Paths: Indicates the number of LU paths (i.e. paths to volumes).
•
Current: Indicates the current transfer rate.
•
Ave.: Indicates the average transfer rate for the specified period.
•
Max.: Indicates the maximum transfer rate for the specified period.
•
Response Time: This column indicates the time for replying from the LU
paths when I/O accesses are made from the host to the LU paths. The unit
is milliseconds. The average response time in the period specified at
Monitoring Term is displayed.
This column displays a hyphen (-) if the I/O rate is 0 (zero).
5-44
Performance Monitor Operations
Hitachi Universal Storage Platform V/VM Hitachi Performance Manager User’s Guide
Monitoring Paths between Host Bus Adapters and Ports
If Server Priority Manager is enabled, Performance Monitor can be used to
monitor paths between host bus adapters (HBAs) in host servers and ports on
the storage system. HBAs are contained in host servers and serve as ports for
connecting the host servers to the storage system. This section describes how
to view I/O rates and transfer rates between host bus HBAs and ports.
Before taking the steps described in the following sections, you need to do the
following:
1. Perform a Server Priority Manager operation (see Monitoring All Traffic
between HBAs and Ports and Setting Priority for Host Bus Adapters).
2. Start the monitoring by using Performance Monitor in accordance with the
procedure described in Starting and Stopping Storage System Monitoring
and obtain the traffic data between host bus HBAs and ports.
Viewing HBA Information
Viewing I/O Rates between HBAs
Performance Monitor monitors traffic between HBAs in the hosts and ports on
the storage system, and measures I/O rates (that is, the number of disk I/Os
per second).
To view I/O rates:
1. Ensure that the Performance Management window is displayed.
2. Click the WWN tab.
The tree displays a list of SPM groups (
Not Grouped.
). Below that list, an item named
–
To display host bus adapters (
SPM group.
) in the SPM group, double-click an
–
To display host bus adapters (
double-click Not Grouped.
) that do not belong to any SPM group,
3. Select IOPS from the list on the right side of the window.
4. In Monitoring Term, do one of the following:
–
To view the I/O rate in real time, you must select the Real Time option,
specify the number of recent collections of statistics which should be
displayed in the graph, and then click Apply.
–
To view I/O rates for a certain period of time in the last 24 hours, you
must select the From option, change the date and time in the From
and To boxes, and then click Apply. Use the arrow button and the
sliders when you change the date and time in the From and To boxes.
For details on the Real Time option and the From option, see WWN Tab of
the Performance Monitor Window.
Performance Monitor Operations
Hitachi Universal Storage Platform V/VM Hitachi Performance Manager User’s Guide
5-45
5. In the tree, do one of the following:
–
To view the I/O rate for host bus adapters in an SPM group, select the
SPM group.
The list on the right displays the I/O rate.
–
To view the I/O rate for host bus adapters that do not belong to any
SPM group, select Not Grouped.
The list on the right displays the I/O rate.
Tips:
–
If you select the Subsystem folder in the tree, the list displays the I/O
rate at each SPM group.
–
If you select a host bus adapter ( ) in the tree, the list displays the I/O
rate at each port connected to the selected host bus adapter.
6. If you want to display a graph to find out how the I/O rate has been
changed, take the following steps:
a. In the list, select one or more SPM groups, WWNs, or ports.
b. Click Draw.
Caution: If the graph does not display changes in the I/O rate (for
example, if the line in the graph runs vertically), try changing the value in
the Chart Y Axis Rate list. For example, if the largest value in the list is
200 and the value in Chart Y Axis Rate is 100, you should select a value
larger than 200 from Chart Y Axis Rate.
Note: If the WWN of a host bus adapter (HBA) is displayed in red in the
tree, the host bus adapter is connected to two or more ports, but the traffic
between the HBA and some of the ports are not monitored by Performance
Monitor. When many-to-many connections are established between HBAs
and ports, you should make sure that all the traffic between HBAs and
ports is monitored. For details on the measures when a WWN is displayed
in red, see Monitoring All Traffic between HBAs and Ports.
I/O rate at host bus adapters
(Displayed when an SPM group or Not Grouped is selected):
5-46
Performance Monitor Operations
Hitachi Universal Storage Platform V/VM Hitachi Performance Manager User’s Guide
I/O rate at each SPM group
(Displayed when the Subsystem folder is selected):
I/O rate at each port connected to a specified host bus adapter
(Displayed when a host bus adapter is selected):
Figure 5-19
I/O Rates for Host Bus Adapters (WWN Tab)
The list displays the following:
•
: When the green checkmark icon
is displayed on the left of an item,
the graph displays changes in workload statistics about the item.
•
Group: Indicates SPM groups.
•
WWN: Indicates WWNs of the host bus adapters.
•
SPM Name: Indicates SPM names of host bus adapters. Server Priority
Manager allows you assign an SPM name to each host bus adapter so that
you can easily identify each host bus adapters in the Server Priority
Manager windows.
•
Port: Indicates ports on the storage system.
•
Current: Indicates the current I/O rate.
•
Ave.: Indicates the average I/O rate for the specified period.
•
Max.: Indicates the maximum I/O rate for the specified period.
•
Response Time: This column indicates the time for replying from the host
bus adapter, SPM group, or port when I/O accesses are made from the
host to them. The unit is milliseconds. The average response time in the
period specified at Monitoring Term is displayed.
•
Attribute: Indicates the priority of each host bus adapter (HBA). Prio.
indicates a high-priority HBA (a prioritized WWN). Non-Prio. indicates a
low-priority HBA (a non-prioritized WWN).
Performance Monitor Operations
Hitachi Universal Storage Platform V/VM Hitachi Performance Manager User’s Guide
5-47
Viewing Transfer Rates between HBAs
Performance Monitor monitors traffic between HBAs in the hosts and ports on
the storage system, and measures transfer rates (that is, the size of data
transferred in one second).
To view transfer rates:
1. Ensure that the Performance Management window is displayed.
2. Select the WWN tab.
The tree displays a list of SPM groups (
named Not Grouped is displayed.
). Below SPM groups, an item
–
To display host bus adapters (
SPM group.
) in the SPM group, double-click an
–
To display host bus adapters (
double-click Not Grouped.
) that do not belong to any SPM group,
3. Select MB/s from the list on the right side of the window.
4. In Monitoring Term, do one of the following:
–
To view the transfer rate in real time, you must select the Real Time
option, specify the number of recent collections of statistics which
should be displayed in the graph, and then click Apply.
–
To view transfer rates for a certain period of time in the last 24 hours,
you must select the From option, change the date and time in the
From and To boxes, and then click Apply. Use the arrow button and
the sliders when you change the date and time in the From and To
boxes.
For details on the Real Time option and the From option, see WWN Tab of
the Performance Monitor Window.
5. In the tree, do one of the following:
–
To view the transfer rate for host bus adapters in an SPM group, select
the SPM group.
The list on the right displays the transfer rate.
–
To view the transfer rate for host bus adapters that do not belong to
any SPM group, select Not Grouped.
The list on the right displays the transfer rate.
Tips:
–
If you select the Subsystem folder in the tree, the list displays the
transfer rate at each SPM group.
–
If you select a host bus adapter ( ) in the tree, the list displays the
transfer rate at each port connected to the selected host bus adapter.
6. If you want to display a graph to find out how the transfer rate has been
changed, take the following steps:
a. In the list, select one or more SPM groups, WWNs, or ports.
5-48
Performance Monitor Operations
Hitachi Universal Storage Platform V/VM Hitachi Performance Manager User’s Guide
b. Click Draw.
Notes:
•
If the graph does not display changes in the transfer rate (for example,
if the line in the graph runs vertically), it is recommended that you
change the value in the Chart Y Axis Rate list. For example, if the
largest value in the list is 200 and the value in Chart Y Axis Rate is
100, you should select a value larger than 200 from Chart Y Axis
Rate.
•
If the WWN of a host bus adapter (HBA) is displayed in red in the tree,
the host bus adapter is connected to two or more ports, but the traffic
between the HBA and some of the ports are not monitored by
Performance Monitor. When many-to-many connections are established
between HBAs and ports, you should make sure that all the traffic
between HBAs and ports is monitored. For details on the measures
when a WWN is displayed in red, see Monitoring All Traffic between
HBAs and Ports.
Transfer rate at host bus adapters
(Displayed when an SPM group or Not Grouped is selected):
Transfer rate at each SPM group
(Displayed when the Subsystem folder is selected):
Transfer rate at each port connected to a specified host bus adapter
(Displayed when a host bus adapter is selected):
Figure 5-20
Transfer Rates for Host Bus Adapters (WWN Tab)
The list displays the following:
•
: When the green checkmark icon
is displayed on the left of an item,
the graph displays changes in workload statistics about the item.
•
Group: Indicates SPM groups.
Performance Monitor Operations
Hitachi Universal Storage Platform V/VM Hitachi Performance Manager User’s Guide
5-49
•
WWN: Indicates WWNs of host bus adapters.
•
SPM Name: Indicates SPM names of host bus adapters. Server Priority
Manager allows you assign an SPM name to each host bus adapter so that
you can easily identify each host bus adapters in the Server Priority
Manager windows.
•
Port: Indicates ports on the storage system.
•
Current: Indicates the current transfer rate.
•
Ave.: Indicates the average transfer rate for the specified period.
•
Max.: Indicates the maximum transfer rate for the specified period.
•
Response Time: This column indicates the time for replying from the host
bus adapter, SPM group, or port when I/O accesses are made from the
host to them. The unit is milliseconds. The average response time in the
period specified at Monitoring Term is displayed.
This column displays a hyphen (-) if the I/O rate is 0 (zero).
•
5-50
Attribute: Indicates the priority of each host bus adapter (HBA). Prio.
indicates a high-priority HBA (a prioritized WWN). Non-Prio. indicates a
low-priority HBA (a non-prioritized WWN).
Performance Monitor Operations
Hitachi Universal Storage Platform V/VM Hitachi Performance Manager User’s Guide
6
Server Priority Manager Operation
This chapter explains the following server priority manager operations:
Overview of Server Priority Manager Operations
Port Tab Operations
WWN Tab Operations
Server Priority Manager Operation
Hitachi Universal Storage Platform V/VM Hitachi Performance Manager User’s Guide
6-1
Overview of Server Priority Manager Operations
Procedures for using Server Priority Manager depend on connection between
host bus adapters and storage system ports.
If one-to-one connections are established between host bus adapters and
ports, you specify the priority of I/O operations, upper limit value, and
threshold value on each port. Because one port connects to one HBA, you can
define the server priority by the port.
However, if many-to-many connections are established between host bus
adapters and ports, you cannot define the server priority by the port, because
one port can connect to multiple host bus adapters, and also multiple ports
can connect to one host bus adapter. Therefore, in the many-to-many
connection environment, you specify the priority of I/O operations and upper
limit value on each host bus adapter. In this case, you specify one threshold
value for the entire storage system.
If one-to-one connections are established between host bus adapters and
ports, you use the Port tab of the Server Priority Manager window. If
many-to-many connections are established between host bus adapters and
ports, you use the WWN tab of the Server Priority Manager window. This
section explains the operation procedures in each tab.
Note: Host bus adapters (HBAs) are adapters contained in hosts and serve as
host ports for connecting the hosts and the storage system.
6-2
Server Priority Manager Operation
Hitachi Universal Storage Platform V/VM Hitachi Performance Manager User’s Guide
If One-to-One Connections Link HBAs and Ports
Figure 6-1 shows an example of a network in which each host bus adapter is
connected to only one port on the storage system (Henceforth, this network is
referred to as network A). Host bus adapters and the storage system ports are
directly connected and are not connected via hubs and switches.
Production servers
(high priority)
Host bus adapters(HBA)
Development servers
(low priority)
SPM name: wwn01
WWN:
0000000000000001
Host bus adapters(HBA)
SPM name: wwn02
WWN:
0000000000000002
SPM name: wwn03
WWN:
0000000000000003
1A
1C
2A
1A, 1C, and 2A are ports on the
storage system.
Storage system
Figure 6-1
Network A (One-to-one Connections between HBAs and
Ports)
If one-to-one connections are established between HBAs and ports, take the
following major steps:
1. Set priority to ports on the storage system using the Port tab of the
Server Priority Manager window.
In network A, the ports 1A and 1C are connected to high-priority
production servers. The port 2A is connected to a low-priority development
server. Therefore, the ports 1A and 1C should be given high priority, and
the port 2A should be given low priority.
Figure 6-2 shows a portion of the Server Priority Manager window where
the abbreviation Prio. indicates that the associated port is given high
priority, and the abbreviation Non-Prio. indicates that the port is given low
priority.
Note: Throughout this manual, the term prioritized port is used to refer to
a high-priority port. The term non-prioritized port is used to refer to a lowpriority port.
Server Priority Manager Operation
Hitachi Universal Storage Platform V/VM Hitachi Performance Manager User’s Guide
6-3
Prio. indicates a prioritized port.
Non-Prio. indicates a non-prioritized port.
Figure 6-2
Priority Specified in the Server Priority Manager Window
2. Monitor traffic at ports. You must obtain statistics about traffic at each port
on the storage system.
There are two types of traffic statistics: the I/O rate and the transfer rate.
The I/O rate is the number of I/Os per second. The transfer rate is the size
of data transferred between a host and the storage system. When you view
traffic statistics in the window, you select either the I/O rate or the transfer
rate. The Port-LUN tab of the Performance Management window lets
you view a line graph illustrating changes in traffic.
Figure 6-3 is a graph illustrating changes in the I/O rate for the three ports
(1A, 1C, and 2A). According to the graph, the I/O rate for 1A and 1C was
approximately 400 IO/s at first. The I/O rate for 2A was approximately 100
IO/s at first. However, as the I/O rate for 2A gradually increased from 100
IO/s to 200 IO/s, the I/O rate for 1A and 1C decreased from 400 IO/s to
200 IO/s. This fact indicates that the high-priority production servers have
suffered lowered performance. If you were the network administrator, you
probably would like to maintain the I/O rate for prioritized ports (1A and
1C) at 400 IO/s. To maintain the I/O rate at 400 IO/s, you must set an
upper limit to the I/O rate for the port 2A.
For detailed information about monitoring traffic, see Setting Priority for
Ports on the Storage System and Analyzing Traffic Statistics.
I/O rate (IO/s)
400
300
prioritized ports
(1A and1C)
200
non-prioritized port
100
(2A)
time
Figure 6-3
6-4
Traffic at Ports
Server Priority Manager Operation
Hitachi Universal Storage Platform V/VM Hitachi Performance Manager User’s Guide
3. Set an upper limit to traffic at the non-prioritized port. To prevent decline
in I/O rates at prioritized ports, you set upper limit values to the I/O rate
for non-prioritized ports.
When you set an upper limit for the first time, it is recommended that the
upper limit be approximately 90 percent of the peak traffic. In network A,
the peak I/O rate for the non-prioritized port (2A) is 200 IO/s. So, the
recommended upper limit for 2A is 180 IO/s.
For details on how to set an upper limit, see Setting Priority for Ports on
the Storage System.
4. Check the result of applying upper limit values. After applying upper limit
values, you must measure traffic at ports. You must view traffic statistics
for prioritized ports 1A and 1C to check whether the host performance is
improved to a desirable level.
In network A, the desirable I/O rate for ports 1A and 1C is 400 IO/s. If the
I/O rate reaches 400 IO/s, production server performance has reached to a
desirable level. If production server performance is not improved to a
desirable level, you can change the upper limit to a smaller value and then
apply the new upper limit to the storage system. In network A, if the upper
limit is set to 180 IO/s but the I/O rate for 1A and 1C is still below 400
IO/s, the administrator needs to change the upper limit until the I/O rate
reaches 400 IO/s.
5. If necessary, apply a threshold. If you want to use threshold control, set
threshold values in the Port tab in the Server Priority Manager window.
You can set threshold values in either of the following ways:
–
Set one threshold to each prioritized port
In network A, if you set a threshold of 200 IO/s to the port 1A and set a
threshold of 100 IO/s to the port 1C, the upper limit on the nonprioritized port (2A) is disabled when either of the following conditions
is satisfied:
–
•
the I/O rate for the port 1A is 200 IO/s or lower
•
the I/O rate for the port 1C is 100 IO/s or lower
Set only one threshold to the entire storage system
In network A, if you set a threshold of 500 IO/s to the storage system,
the upper limit on the non-prioritized port (2A) is disabled when the
sum of the I/O rates for all prioritized ports (1A and 1C) goes below 500
IO/s.
For details on how to set a threshold, see Upper-Limit Control.
Server Priority Manager Operation
Hitachi Universal Storage Platform V/VM Hitachi Performance Manager User’s Guide
6-5
If Many-to-Many Connections Link HBAs and Ports
Figure 6-4 gives an example of a network in which a production server and a
development server are connected to the storage system (Henceforth, this
network is referred to as network B). The host bus adapter (wwn01) in the
production server is connected to four ports (1A, 1C, 2A and 2C). The host bus
adapters (wwn02 and wwn03) in the development server are also connected
to the four ports.
Production server
(high priority)
Development server
(low priority)
Host bus adapter (HBA)
Host bus adapter (HBA)
SPM name: wwn02
WWN:
0000000000000002
SPM name: wwn01
WWN:
0000000000000001
SPM name: wwn03
WWN:
0000000000000003
Fibre Channel switch
1A 1C 2A 2C
CHA
CHA
CHA: channel adapter
Storage system
Figure 6-4
Network B (Many-to-Many Connections are Established
between HBAs and Ports)
If many-to-many connections are established between HBAs and ports, take
the following major steps:
1. Find WWNs of host bus adapters. Before using Server Priority Manager, you
must find the WWN (Worldwide Name) of each host bus adapter in host
servers. WWNs are 16-digit hexadecimal numbers used to identify host bus
adapters. For details on how to find WWNs, see the LUN Manager User's
Guide.
2. Ensure that all host bus adapters connected to ports in the storage system
are monitored. Use the WWN tab of the Server Priority Manager window
to define which port is connected to which host bus adapter. Place host bus
adapters connected to each port below the Monitor icons.
In network B, each of the four ports is connected to three host bus
adapters (wwn01, wwn02, and wwn03). Place the host bus adapter icons of
wwn01, wwn02, and wwn03 below the Monitor icons for all the four port
icons.
6-6
Server Priority Manager Operation
Hitachi Universal Storage Platform V/VM Hitachi Performance Manager User’s Guide
The resulting definitions on the window are as follows:
Figure 6-5
Specifying Host Bus Adapters to be Monitored
For more detailed instruction, see Setting Priority for Ports on the Storage
System.
Server Priority Manager is unable to monitor and control the performance
of hosts whose host bus adapters are placed below the Non-Monitor icon.
3. Set priority to host bus adapters using the WWN tab of the Server
Priority Manager window.
In network B, the production server is given high priority and the
development server is given low priority. If your network is configured as
in Figure 6-4, you must give high priority to wwn01 and also give low
priority to wwn02 and wwn03.
To give priority to the three host bus adapters, take the following steps:
a. In the WWN tab, select one of the four ports that the HBAs are
connected to (i.e. ports 1A, 1C, 2A, and 2C).
b. Set Prio. to wwn01. Also, set Non-Prio. to wwn02 and wwn03.
Figure 6-6
Priority Specified in the Server Priority Manager Window
Server Priority Manager Operation
Hitachi Universal Storage Platform V/VM Hitachi Performance Manager User’s Guide
6-7
Note: Throughout this manual, the term prioritized WWN to refers to a
high-priority host bus adapter (for example, wwn01). The term nonprioritized port refers to a low-priority host bus adapter (for example,
wwn02 and wwn03).
4. Monitor traffic between host bus adapter and ports. You must obtain
statistics about traffic between host bus adapter and ports.
There are two types of traffic statistics: the I/O rate and the transfer rate.
The I/O rate is the number of I/Os per second. The transfer rate is the size
of data transferred between a host and the storage system. When you view
traffic statistics in the window, you select either the I/O rate or the transfer
rate.
If your network is configured as network B, you must do the following:
–
Measure traffic between the port 1A and the three host bus adapters
(wwn01, wwn02 and wwn03.
–
Measure traffic between the port 1C and the three host bus adapters
(wwn01, wwn02 and wwn03.
–
Measure traffic between the port 2A and the three host bus adapters
(wwn01, wwn02 and wwn03.
–
Measure traffic between the port 2C and the three host bus adapters
(wwn01, wwn02 and wwn03.
Figure 6-7 illustrates a graph that describes the I/O rate at the paths
between each port and the host bus adapters. According to the graph, the
I/O rate at the path between 1A and the prioritized WWN (wwn01) was
approximately 400 IO/s at first. The I/O rate at the path between 1A and
the non-prioritized WWNs (wwn02 and wwn03) was approximately 100
IO/s at first. However, as the I/O rate for non-prioritized WWNs (wwn02
and wwn03) gradually increased from 100 IO/s to 200 IO/s, the I/O rate
for the prioritized WWN (wwn01) decreased from 400 IO/s to 200 IO/s.
This indicates that the high-priority production server has degraded. If you
were the network administrator, you probably would like to maintain the
I/O rate for the prioritized WWN (wwn01) at 400 IO/s.
For more information about monitoring traffic, see Setting Priority for Host
Bus Adapters and Analyzing Traffic Statistics.
6-8
Server Priority Manager Operation
Hitachi Universal Storage Platform V/VM Hitachi Performance Manager User’s Guide
I/O rate (IO/s)
400
300
prioritized WWN
(wwn01)
200
non-prioritized WWN
100
(wwn02 and wwn03)
time
Figure 6-7
Traffic at Ports
5. Set an upper limit to traffic between ports and the non-prioritized WWN to
prevent decline in I/O rates at prioritized WWNs.
When you set an upper limit for the first time, the upper limit should be
approximately 90 percent of the peak traffic level.
In network B, the peak I/O rate at the paths between port 1A and the nonprioritized WWNs (wwn02 and wwn03) is 200 IO/s. The peak I/O rate at
the paths between port 1C and the non-prioritized WWNs is also 200 IO/s.
The peak I/O rate at the paths between port 2A and the non-prioritized
WWNs is also 200 IO/s. The peak I/O rate at the paths between port 2C
and the non-prioritized WWNs is also 200 IO/s. So, the recommended
upper limit for the non-prioritized WWNs is 720 IO/s (= 200 × 4 × 0.90).
If your network is configured as in Figure 6-4, you must do the following in
this order:
a. In the WWN tab, select one of the four ports that the HBAs are
connected to (i.e. ports 1A, 1C, 2A, and 2C).
b. Set an upper limit to the non-prioritized WWNs (wwn02 and wwn03).
Figure 6-8 is the result of setting the upper limit of 720 IO/s to the paths
between 1A and the non-prioritized WWNs. For details on how to set an
upper limit, see Setting Priority for Ports on the Storage System.
Figure 6-8
Setting Upper Limits
Server Priority Manager Operation
Hitachi Universal Storage Platform V/VM Hitachi Performance Manager User’s Guide
6-9
6. Check the result of applying upper limit values. After applying upper limit
values, you must measure traffic at ports. View traffic statistics for the
prioritized WWN to check whether the host performance is improved to a
desirable level.
In network B, the desirable I/O rate for the prioritized WWN is 400 IO/s. If
the I/O rate reaches 400 IO/s, production server performance has reached
to a desirable level. If production server performance is not improved to a
desirable level, you can change the upper limit to a smaller value and then
apply the new upper limit to the storage system. In network B, if the upper
limit is set to 720 IO/s but the I/O rate for wwn01 is still below 400 IO/s,
the administrator needs to change the upper limit until the I/O rate reaches
400 IO/s.
If an upper limit of the non-prioritized WWN is set to zero or nearly zero,
I/O performance might be lowered. If I/O performance is lowered, the host
cannot be connected to the storage system in some cases.
7. If necessary, apply a threshold. If you want to use threshold control, set a
threshold in the WWN tab in the Server Priority Manager window.
In the WWN tab, you can specify only one threshold for the entire storage
system, regardless of the number of prioritized WWNs. For example, if
there are three prioritized WWNs in the network and the threshold is 100
IO/s, the upper limit on the non-prioritized WWNs is disabled when the
sum of the I/O rates for all prioritized WWNs goes below 100 IO/s.
For details on how to set a threshold, see Setting a Threshold.
Caution: If you enter zero (0) in a cell to disable the upper limit, the cell
displays a hyphen (-) and the threshold for the prioritized port becomes
ineffective. If the thresholds of all the prioritized ports are ineffective,
threshold control will not be performed but upper limit control will be
performed. If you set thresholds for multiple prioritized ports and the I/O
rate or transfer rate becomes below the threshold at one of the prioritized
ports, threshold control takes effect and the upper limits of the nonprioritized ports are disabled. The following table shows the relationship
between the thresholds and the upper limits.
6-10
Server Priority Manager Operation
Hitachi Universal Storage Platform V/VM Hitachi Performance Manager User’s Guide
Table 6-1
Threshold
Settings
Threshold Is Set
to The Prioritized
WWN
Relationship between the Thresholds of the Prioritized WWN
and the Upper Limits of the Non-prioritized WWN
A Number Other Than Zero Is Set to
The Upper Limit of The Non-prioritized
WWN
When thresholds are set to multiple
prioritized WWNs, depending on the
transfer rate, the following controls
are executed.
Zero Is Set to The Upper Limit of The
Non-prioritized WWN
The threshold control of the prioritized
WWN is not executed.
If I/O rate or transfer rate exceeds the
threshold in any prioritized WWN,
upper limits of all the nonprioritized WWNs take effect.
If I/O rate or transfer rate goes below
the threshold in any prioritized
WWN, upper limits of all the nonprioritized WWNs do not take
effect.
Threshold Is Not
Set to The
Prioritized WWN
The specified upper limit always takes
effect.
Starting Server Priority Manager
To start Server Priority Manager, take the following steps.
To start Server Priority Manager:
1. Ensure that the Storage Navigator main window is in Modify mode (i.e.,
with the background color of the pen tip icon
showing light yellow). If
the background color is gray , the window is in View mode and you must
change it to Modify mode by taking the following steps:
a. Verify whether the background color of the lock icon
is blue.
If the background color is red , you will not be able to switch from
View mode to Modify mode. Wait for a while and click the
button.
When the background color turns blue, you can go to the next step.
b. Select the
(pen tip) icon.
A prompt asks whether you want to change the mode.
c. Select OK to close the message.
The background color of the icon changes to light yellow ( ). The mode
changes to Modify mode. The background color of the lock icon becomes
red ( ).
2. Ensure that the WWN tab or the Port-LUN tab is active in the
Performance Management window.
3. Ensure that the Real Time option is cleared.
You cannot start Server Priority Manager in real-time mode.
Server Priority Manager Operation
Hitachi Universal Storage Platform V/VM Hitachi Performance Manager User’s Guide
6-11
4. Click SPM.
The Server Priority Manager window is displayed.
6-12
–
Use the Port tab if one-to-one connection is established between host
bus adapters and storage system ports. For details on operations in the
Port tab, see Port Tab Operations.
–
Use the WWN tab if many-to-many connection is established between
host bus adapters and storage system ports. For details on operations
in the WWN tab, see WWN Tab Operations.
Server Priority Manager Operation
Hitachi Universal Storage Platform V/VM Hitachi Performance Manager User’s Guide
Port Tab Operations
If one-to-one connections are established between host bus adapters (HBAs)
and storage system ports, use the Port tab in the Server Priority Manager
window to do the following:
•
Analyze traffic statistics
•
Measure traffic between host bus adapters and storage system ports
•
Set priority to ports on the storage system
•
Set an upper limit to traffic at each non-prioritized port
•
Set a threshold to the storage system or to each prioritized port, if
necessary
If one-to-one connections are established between host bus adapters and
ports, you should specify the priority of I/O operations on each port. You can
specify the upper limit values on the non-prioritized ports, and if necessary,
you can also specify the threshold values on the prioritized ports. Moreover,
you can use one threshold value applied for the entire storage system.
For details on the system configuration of one-to-one connections between
host bus adapters and ports, see If One-to-One Connections Link HBAs and
Ports. This section explains operation procedures you can perform for ports
and the entire storage system.
Analyzing Traffic Statistics
The traffic statistics reveal the number of I/Os that have been made via ports.
The traffic statistics also reveal the amount of data that have been transferred
via ports. You must analyze the traffic statistics to determine upper limit
values that should be applied to I/O rates or transfer rates for non-prioritized
ports.
The following is the procedure for using the Server Priority Manager window
to analyze traffic statistics. You can also use the Performance Management
window to analyze traffic statistics. Performance Monitor can display a line
graph that indicates changes in traffic (For details, see Viewing I/O Rates for
Ports and Viewing Transfer Rates for Ports).
To analyze traffic statistics:
1. Start Server Priority Manager.
The Server Priority Manager window is displayed.
2. Select the Port tab.
3. Select All from the list at the top right corner of the window.
4. Do one of the following:
Server Priority Manager Operation
Hitachi Universal Storage Platform V/VM Hitachi Performance Manager User’s Guide
6-13
–
To analyze I/O rates, select IOPS from the list at the upper left corner
of the list.
–
To analyze transfer rates, select MB/s from the list at the upper left
corner of the list.
The list displays traffic statistics (i.e. the average and peak I/O rates or
transfer rates) of the ports.
5. Analyze the information in the list and then determine upper limit values
that should be applied to non-prioritized ports. If necessary, determine
threshold values that should be applied to prioritized ports. For details on
the upper limit values and threshold values, see If One-to-One Connections
Link HBAs and Ports.
Setting Priority for Ports on the Storage System
If one-to-one connection is established between HBAs and ports, you need to
measure traffic between high-priority HBAs and prioritized ports. You also
need to measure traffic between low-priority HBAs and non-prioritized ports.
Prioritized ports are ports on which the processing has high priority and nonprioritized ports are ports on which the processing has low priority. Specify a
port that connects to a high-priority host bus adapter as a prioritized port.
Specify a port that connects to a low-priority host bus adapter as a nonprioritized port.
To set priority to ports on the storage system:
1. Start Server Priority Manager.
The Server Priority Manager window is displayed.
2. Ensure that the Port tab is displayed.
3. Select All from the list at the top right corner of the window.
4. Right-click a high-priority port and then select Non-Prio ->> Prio from
the pop-up menu. If there is more than one high-priority port, repeat this
operation.
The Attribute column displays Prio.
5. Right-click a low-priority port and then select Prio ->> Non-Prio from the
pop-up menu. If there is more than one low-priority port, repeat this
operation.
The Attribute column displays Non-Prio.
You must set upper limit values for the Non-prio. specified ports. For
detail about the setting of upper limit values, see Setting Upper-Limit
Values to Traffic at Non-prioritized Ports.
6. Click Apply.
The settings on the window are applied to the storage system.
6-14
Server Priority Manager Operation
Hitachi Universal Storage Platform V/VM Hitachi Performance Manager User’s Guide
After priority has been set, you can implement the procedure for measuring
traffic (I/O rates and transfer rates) (see Starting and Stopping Storage
System Monitoring)
Setting Upper-Limit Values to Traffic at Non-prioritized Ports
After you analyze traffic statistics, you must set upper limit values to I/O rates
or transfer rates for non-prioritized ports. Upper limit values for I/O rates are
used to suppress the number of I/Os from the low priority host servers and
thus provide better performance for high-priority host servers. Upper limit
values for transfer rates are used to suppress the amount of data that should
be transferred between the storage system and the low priority ports, and
thus provide better performance for high-priority host servers.
To limit the I/O rate or transfer rate of a non-prioritized port:
1. Start Server Priority Manager. The Server Priority Manager window is
displayed.
2. Select the Port tab.
3. Do one of the following:
–
To limit the I/O rate for the non-prioritized port, select IOPS from the
list at the upper left corner of the list.
–
To limit the transfer rate for the non-prioritized port, select MB/s from
the list at the upper left corner of the list.
4. Locate the non-prioritized port in the list.
Notes:
The Attribute column of the list indicates whether ports are prioritized or
non-prioritized.
If you cannot find any non-prioritized port in the list, check the list at the
top right corner of the window. If the list displays Prioritize, select All
or Non-Prioritize from the list.
5. Do one of the following:
–
To limit the I/O rate for the non-prioritized port, double-click the
desired cell in the IOPS column in Upper. Next, enter the upper limit
value in the cell.
–
To limit the transfer rate for the non-prioritized port, double-click the
desired cell in the MB/s column in Upper. Next, enter the upper limit
value in the cell.
In the list, either of IOPS or MB/s column is activated depending on the
rate selected at step 3 above. You can use either of them to specify the
upper limit value for one port. You can specify different types of rates
(IOPS or MB/s) for the upper limit values of different non-prioritized ports.
The upper limit value that you entered is displayed in blue.
Server Priority Manager Operation
Hitachi Universal Storage Platform V/VM Hitachi Performance Manager User’s Guide
6-15
6. Click Apply. The settings in the window are applied to the storage system.
The upper limit value that you entered turns black.
If an upper limit of the non-prioritized WWN is set to zero or nearly zero, I/O
performance might be lowered. If I/O performance is lowered, the host cannot
be connected to the storage system in some cases.
Setting a Threshold
If threshold control is used, upper limit control is automatically disabled when
traffic between production servers and the storage system is reduced to a
specified level. For details, see Upper-Limit Control and If One-to-One
Connections Link HBAs and Ports.
If one-to-one connections are established between HBAs and ports, you can
set the threshold value by the following two ways:
•
Set a threshold value for each prioritized port
•
Set one threshold value for the entire storage system
The procedures for these operations are explained below.
To set threshold values to traffic at prioritized ports:
1. Start Server Priority Manager. The Server Priority Manager window is
displayed.
2. Select the Port tab.
3. To set a threshold value for each prioritized port, select the type of rates
for the threshold value from the list at the upper lest corner of the list.
–
To use the I/O rates for the threshold value, select IOPS.
–
To use the transfer rates for the threshold value, select MB/s.
Note: If you want to set one threshold value for the entire storage system,
this step is unnecessary.
4. Do one of the following:
–
6-16
To set a threshold to each prioritized port, locate the desired prioritized
port, which is indicated by Prio. in the Attribute column. Next, doubleclick the cell in the IOPS or MB/s column in Threshold, and then
enter the threshold value. In the list, either of IOPS or MB/s column is
activated depending on the rate selected at step 3 above. Repeat this
operation to set the thresholds for all the prioritized ports. You can use
different types of rates (IOPS or MB/s) for thresholds of different
prioritized ports.
Server Priority Manager Operation
Hitachi Universal Storage Platform V/VM Hitachi Performance Manager User’s Guide
Caution: If you enter zero (0) in a cell to disable the upper limit, the cell
displays a hyphen (-) and the threshold for the prioritized port becomes
ineffective. If the thresholds of all the prioritized ports are ineffective,
threshold control will not be performed but upper limit control will be
performed. If you set thresholds for multiple prioritized ports and the I/O
rate or transfer rate becomes below the threshold at one of the prioritized
port, threshold control works in the entire storage system and the upper
limits of the non-prioritized ports are disabled. The following table shows
the relationship between the thresholds and the upper limits.
Table 6-2
Thresholds
Settings
Threshold Is Set
to The Prioritized
port
Relationship between the Thresholds of the Prioritized Port
and the Upper Limits of the Non-prioritized Port
A Number Other Than Zero Is Set to The
Upper Limit of The Non-prioritized port
When thresholds are set to multiple
prioritized ports, depending on the
transfer rate, following controls are
executed.
Zero Is Set to The Upper Limit of The
Non-prioritized port
The threshold control of the prioritized
port is not executed.
If I/O rate or transfer rate exceeds the
threshold in any prioritized port,
upper limits of all the non-prioritized
ports take effect.
If I/O rate or transfer rate goes below
the threshold in any prioritized port,
upper limits of all the non-prioritized
ports do not take effect.
Threshold Is Not
Set to The
Prioritized port
–
The specified upper limit always takes
effect.
To set one threshold to the entire storage system, select the All
Thresholds check box. Next, select IOPS or MB/s from the list of
right side in All Thresholds and enter the threshold value in the text
box. Even if the types of rates for upper limit values and the threshold
are different, the threshold control can work for all the non-prioritized
ports.
5. Click Apply. The settings in the window are applied to the storage system.
WWN Tab Operations
If many-to-many connections are established between host bus adapters
(HBAs) and storage system ports, you use the WWN tab in the Server
Priority Manager window to do the following:
•
Make all the traffics between host bus adapters and ports monitored
•
Analyze traffic statistics
•
Measure traffic between host bus adapters and storage system ports
Server Priority Manager Operation
Hitachi Universal Storage Platform V/VM Hitachi Performance Manager User’s Guide
6-17
•
Set priority to host bus adapters
•
Set an upper limit on traffic at non-prioritized WWNs
•
Set a threshold, if necessary
If many-to-many connections are established between host bus adapters and
ports, you should specify the priority of I/O operations on each host bus
adapter. You can specify the upper limit values on the non-prioritized WWNs.
If necessary, you can set one threshold value applied for the entire storage
system. When many-to-many connections are established between host bus
adapters and ports, you cannot set individual thresholds for prioritized WWNs.
For the system configuration of many-to-many connections between host bus
adapters and ports, see If Many-to-Many Connections Link HBAs and Ports.
For details on the system configuration of many-to-many connections between
host bus adapters and ports, see If Many-to-Many Connections Link HBAs and
Ports. This section explains operation procedures you can perform for host bus
adapters and the entire storage system.
Monitoring All Traffic between HBAs and Ports
When many-to-many connections are established between host bus adapters
(HBAs) and ports, you should make sure that all the traffic between HBAs and
ports is monitored.
To make all the traffics between host bus adapters and ports monitored:
1. Start Server Priority Manager.
The Server Priority Manager window is displayed.
2. Ensure that the WWN tab is displayed.
The two trees are displayed in the left side of the WWN tab. The upper-left
tree lists ports in the storage system.
3. Select All from the list at the top right corner of the window.
4. In the upper-left tree, double-click a port.
5. Double-click Non-Monitor below the specified port.
If there are any host bus adapters whose traffics with the specified port are
not monitored, those host bus adapters are displayed below Non-Monitor.
6. Right-click Monitor and then select Add WWN from the pop-up menu.
The Add WWN window is displayed. This window lets you add a WWN of a
host bus adapter to Monitor.
7. In the Add WWN window, specify the WWN and the SPM name.
6-18
Server Priority Manager Operation
Hitachi Universal Storage Platform V/VM Hitachi Performance Manager User’s Guide
Expand the WWN list to show the WWNs of the host bus adapters that are
connected to the port but are not monitored. These host bus adapters are
the same as that displayed in step 5. From that list, select a WWN and
specify the SPM name. You can specify up to 16 characters for an SPM
name.
Note: Hitachi Data Systems recommends that you specify the same names
for the SPM names and the nicknames of the host bus adapters for
convenience of host bus adapter management. Nicknames are aliases of
host bus adapters defined by LUN Manager. In the Port-LUN tab of
Performance Monitor, not only SPM names but also nicknames are
displayed as the aliases of host bus adapters (WWNs) in the list. Therefore,
if you specify both the same aliases, the management of the host bus
adapters is easier.
8. Click OK. The selected WWN (of the host bus adapter) is moved from NonMonitor to Monitor.
Note: If the specified host bus adapter is also connected to other ports,
after clicking OK, a message appears asking whether to change the
settings of that host bus adapter for other ports, too. Make the same
setting for all the ports.
9. Repeat step 6 to 8 to move all the host bus adapters displayed below NonMonitor to below Monitor.
Note: If you disconnect a host that has been connected via a cable to your
storage system or change the port to the another port of the host, the
WWN for the host will remain in the WWN list of the WWN tab. If you want
to delete the WWN from the WWN list, you can delete the WWN by using
LUN Manager. For detail information of the deleting old WWNs from the
WWN list, see the LUN Manager User's Guide.
10. Click Apply in the Server Priority Manager window. The settings on the
window are applied to the storage system.
Note: If you are using Windows, you can drag and drop the desired WWNs
from Non-Monitor to Monitor. When you drop a WWN to Monitor, the
Add WWN window is displayed in which you can specify the SPM name
only.
Server Priority Manager Operation
Hitachi Universal Storage Platform V/VM Hitachi Performance Manager User’s Guide
6-19
Figure 6-9
Add WWN Window
If you add a port or host bus adapter to the storage system after the settings
above, the traffics about connections to the newly added port or host bus
adapter will not be monitored. In this case, follow the procedure above again
to make all the traffics between host bus adapters and ports monitored.
Up to 32 host bus adapters (WWNs) can be monitored for one port. If more
than 32 host bus adapters are connected to one port, the traffics about some
host bus adapters will be obliged to be excluded from the monitoring target.
Consider the intended use of each host and move the host bus adapters which
you think not necessary to be monitored to Non-Monitor by the following
steps.
To exclude traffic between a host bus adapter and a port from the monitoring
target:
1. Start Server Priority Manager and ensure that the WWN tab is displayed.
2. Select All from the list at the top right corner of the window.
3. In the upper-left tree, double-click a port to which more than 32 host bus
adapters are connected.
4. Double-click Monitor below the specified port.
5. Right-click the WWN of a host bus adapter you want to exclude from the
monitoring target and then select Delete WWN from the pop-up menu.
If you are using Windows, you can drag and drop the desired WWNs from
Monitor to Non-Monitor.
6-20
Server Priority Manager Operation
Hitachi Universal Storage Platform V/VM Hitachi Performance Manager User’s Guide
Notes:
If the selected host bus adapter is connected to multiple ports, when you
select the host bus adapter and select the Delete WWN pop-up menu, a
message will appear that asks you whether to move the host bus adapter
from Monitor to Non-Monitor below all other ports, too.
If the selected host bus adapter is contained in an SPM group, a message
will appear that tell you to delete the host bus adapter from the SPM group
on ahead. You cannot move a host bus adapter which is contained in an
SPM group from Monitor to Non-Monitor. For details on how to delete a
host bus adapter from an SPM group, see Deleting an HBA from an SPM
Group.
6. Click OK for the confirmation message that asks you whether to delete the
host bus adapter.
The deleted host bus adapter (WWN) is moved from Monitor to
Non-Monitor.
7. Click Apply in the Server Priority Manager window.
The settings on the window are applied to the storage system.
Analyzing Traffic Statistics
The traffic statistics reveal the number of I/Os that have been made via ports
from HBAs. They also reveal the amount of data that have been transferred
between ports and HBAs. You must analyze the traffic statistics to determine
upper limit values that should be applied to I/O rates or transfer rates for lowpriority HBAs.
The following is the procedure for using the Server Priority Manager window
to analyze traffic statistics. You can also use the Performance Management
window to analyze traffic statistics. Performance Monitor can display a line
graph that indicates changes in traffic (For details, see Viewing I/O Rates for
Disks and Viewing Transfer Rates for Disks).
To analyze traffic statistics:
1. Start Server Priority Manager.
The Server Priority Manager window is displayed.
2. Select the WWN tab.
3. Select All from the list at the top right corner of the window.
4. Do one of the following:
–
To analyze I/O rates, select IOPS from the list at the upper left corner.
–
To analyze transfer rates, select MB/s from the list at the upper left
corner of the list.
Server Priority Manager Operation
Hitachi Universal Storage Platform V/VM Hitachi Performance Manager User’s Guide
6-21
5. Below the Subsystem folder in the upper-left tree, click the icon of the
port whose traffic statistics you want to collect.
The list displays traffic statistics (I/O rates or transfer rates) about the host
bus adapters that connect to the selected port.
The following two types of traffic are shown. The traffic has attributes
including the average and maximum values.
–
Traffic between the host bus adapter and the selected port (shown in
Per Port)
–
Sum of the traffic between the host bus adapter and all the ports
connected to the host bus adapter (shown in WWN Total)
Notes:
The traffic statistics only about the host bus adapters below Monitor
appear in the list.
The WWN Total traffic statistics will also be displayed in the list when you
click an icon in the lower-left tree. If you click the Subsystem folder in
the lower-left tree, the sum of the traffic of the host bus adapters
registered on each SPM group is displayed. For details on SPM groups,
see Grouping Host Bus Adapters.
6. Analyze the information in the list and then determine upper limit values
that should be applied to non-prioritized WWNs. If necessary, determine
threshold values that should be applied to prioritized WWNs. For details,
see If Many-to-Many Connections Link HBAs and Ports.
Setting Priority for Host Bus Adapters
If many-to-many connection is established between host bus adapters (HBAs)
and ports, you need to define the priority of WWNs, measure traffic between
each HBA and the port that the HBA is connected to, and analyze the traffics.
The host bus adapters (HBAs) are divided into two types: Prioritized WWNs
and non-prioritized WWNs. Prioritized WWNs are the host bus adapters that
are used for the high-priority processing, and non-prioritized WWNs are the
host bus adapters that are used for the low-priority processing. Specify a host
bus adapter existed in a server, on which the high-priority processing is
performed, as a prioritized WWNs. Specify a host bus adapter existed in a
server, on which the low-priority processing is performed, as a non-prioritized
WWNs.
To set priority to host bus adapters:
1. Start Server Priority Manager.
The Server Priority Manager window is displayed.
2. Select the WWN tab.
3. Select All from the list at the top right corner of the window.
6-22
Server Priority Manager Operation
Hitachi Universal Storage Platform V/VM Hitachi Performance Manager User’s Guide
4. In the upper-left tree, double-click a port.
5. Double-click Monitor, which is displayed below the specified port.
6. Check to see if all the WWNs of the host bus adapters to be controlled by
using Server Priority Manager appear below Monitor.
If some of the WWNs are missing, use the procedure in Monitoring All
Traffic between HBAs and Ports to move all WWNs to below Monitor.
7. Click Monitor to display the information of the host bus adapters that are
monitored in the list on the right of the tree.
8. Right-click a host bus adapter (WWN) in the list and then select Non-Prio
->> Prio from the pop-up menu.
The Attribute column of the selected WWN in the list displays Prio. If you
want to specify more than one prioritized WWN, repeat this operation.
Note: You cannot change the priority of a WWN which is contained in an
SPM group. For details on how to change the attribute of a WWN contained
in an SPM group, see Switching Priority of an SPM Group.
9. Right-click a host bus adapter (WWN) in the list and then select Prio ->>
Non-Prio from the pop-up menu.
The Attribute column of the selected WWN in the list displays Non-Prio.
If you want to specify more than one non-prioritized WWN, repeat this
operation.
Note: You cannot change the priority of a WWN which is contained in an
SPM group. For details on how to change the attribute of a WWN contained
in an SPM group, see Switching Priority of an SPM Group.
You must set upper limit values for the Non-prio. specified ports. For
details, see Setting Upper-Limit Values for Non-Prioritized WWNs.
10. Repeat steps 4 to 9 for ports (except for the port selected in step 9).
If one host bus adapter is connected to multiple ports and you specify the
priority of the host bus adapter for one port, the specified priority will be
also applied to the host bus adapter settings for other connected ports
automatically.
11. Click Apply in the Server Priority Manager window.
The settings on the window are applied to the storage system.
Follow the instructions in Starting and Stopping Storage System Monitoring to
measure traffic (i.e.. I/O rates and transfer rates).
Server Priority Manager Operation
Hitachi Universal Storage Platform V/VM Hitachi Performance Manager User’s Guide
6-23
Setting Upper-Limit Values for Non-Prioritized WWNs
After you analyze traffic statistics about prioritized WWNs and non-prioritized
WWNs, you must set upper limit values to I/O rates or transfer rates for nonprioritized WWNs. Upper limit values for I/O rates are used to suppress the
number of I/Os from the low priority host servers and thus provide better
performance for high-priority host servers. Upper limit values for transfer rates
are used to suppress the amount of data that should be transferred between
the storage system and the low priority ports, thus providing better
performance for high-priority host servers.
Tip: To set the same upper limit value to more than one non-prioritized WWN,
use an SPM group. For details on SPM groups, see Grouping Host Bus
Adapters.
To limit the I/O rate or transfer rate of a non-prioritized WWN:
1. Start Server Priority Manager.
The Server Priority Manager window is displayed.
2. Ensure that the WWN tab is displayed.
3. Do one of the following:
–
To limit the I/O rate of the non-prioritized WWN, select IOPS from the
list at the upper left corner.
–
To limit the transfer rate of the non-prioritized WWN, select MB/s from
the list at the upper left corner.
4. In the upper-left tree, click the icon of the port whose traffic you want to
limit below the Subsystem folder.
The information about the host bus adapters which connect to the selected
port is displayed in the list.
5. Locate the non-prioritized WWN in the list.
Notes:
The Attribute column of the list indicates whether WWNs are prioritized or
non-prioritized. The Attribute column of a non-prioritized WWN
displays Non-Prio.
If you cannot find any non-prioritized WWN in the list, check the list at the
top right corner of the window. If the list displays Prioritize, select All
or Non-Prioritize.
6. Do one of the following:
–
6-24
To limit the I/O rate of the non-prioritized WWN, double-click the
desired cell in the IOPS column in Upper. Next, enter the upper limit
value in the cell.
Server Priority Manager Operation
Hitachi Universal Storage Platform V/VM Hitachi Performance Manager User’s Guide
–
To limit the transfer rate of the non-prioritized WWN, double-click the
desired cell in the MB/s column in Upper. Next, enter the upper limit
value in the cell.
In the list, either of the IOPS cells or MB/s cells are activated depending
on the rate you specified in step 3. You can specify the limit value by using
either of the I/O rate or transfer rate for each host bus adapter. The upper
limit value that you entered is displayed in blue. It is allowed that you
specify upper limit values by using the I/O rate for some host bus adapters
and specify them by using the transfer rate for the other host bus adapters.
Notes:
You cannot specify or change the upper limit value of a host bus adapter
which is contained in an SPM group. The upper limit value of such a
host bus adapter is defined by the SPM group settings. For details on
how to specify an upper limit value for an SPM group, see Setting an
Upper-Limit Value to HBAs in an SPM Group.
If one host bus adapter is connected to multiple ports and you specify an
upper limit value of the host bus adapter for one port, the specified
upper limit value will be applied to the host bus adapter settings for
other connected ports automatically.
7. Click Apply.
The settings in the window are applied to the storage system. The upper
limit value that you entered turns black.
Setting a Threshold
If threshold control is used, upper limit control is automatically disabled when
traffic between production servers and the storage system is reduced to a
specified level. For details, see Upper-Limit Control and If Many-to-Many
Connections Link HBAs and Ports.
If many-to-many connections are established between host bus adapters and
storage system ports, you can set one threshold value for the entire storage
system. In this environment, you cannot set individual threshold values for
each prioritized WWN.
To set a threshold value:
1. Start Server Priority Manager.
The Server Priority Manager window is displayed.
2. Select the WWN tab.
3. Select the All Thresholds check box.
Server Priority Manager Operation
Hitachi Universal Storage Platform V/VM Hitachi Performance Manager User’s Guide
6-25
4. Select IOPS or MB/s from the All Thresholds list, and do one of the
following:
–
To specify the threshold value by using the I/O rate, select IOPS from
the list below the check box.
–
To specify the threshold value by using the transfer rate, select MB/s
from the list below the check box.
Even if the types of rates differ between the upper limit values and the
threshold value, the threshold control is effective for all the non-prioritized
WWNs.
5. Enter the threshold in the text box of All Thresholds.
6. Click Apply.
The settings in the window are applied to the storage system.
Changing the SPM Name of a Host Bus Adapter
The Server Priority Manager window allows you to assign an SPM name to a
host bus adapter (HBA). Although you can identify HBAs by WWNs (Worldwide
Names), you will be able to identify HBAs more easily if you assign SPM
names. WWNs are 16-digit hexadecimal numbers and cannot be changed.
However, SPM names should not necessarily be 16-digit hexadecimal numbers
and can be changed.
The following is the procedure for changing an already assigned SPM name.
For details on how to assign an SPM name, see Monitoring All Traffic between
HBAs and Ports.
To change an SPM name:
1. Start Server Priority Manager.
The Server Priority Manager window is displayed.
2. Ensure that the WWN tab is displayed.
3. In the upper-left tree, select a host bus adapter (
and then right-click the selection.
) from below Monitor
4. From the pop-up menu, select Change WWN and SPM Name.
The Change WWN and SPM Name window is displayed.
5. Enter a new SPM name in the SPM Name box and then select OK. You can
use up to 16 characters for an SPM name.
6. In the Server Priority Manager window, click Apply.
The settings in the window are applied to the storage system.
6-26
Server Priority Manager Operation
Hitachi Universal Storage Platform V/VM Hitachi Performance Manager User’s Guide
Figure 6-10
Change WWN and SPM Name Window
Replacing a Host Bus Adapter
If a host bus adapter fails, you will need to replace the adapter with a new
one. After you finish replacement, you will need to delete the old host bus
adapter from the Server Priority Manager window and then register the new
host bus adapter.
When you add a new host bus adapter rather than replacing an old one, the
WWN of the added host bus adapter is automatically displayed below NonMonitor for the connected port in the list.
Follow the procedure below to remove the old adapter and register a new
adapter quickly and easily.
To register a new host bus adapter after replacement:
1. Start Server Priority Manager.
The Server Priority Manager window is displayed.
2. Select the WWN tab.
3. In the upper-left tree, select the old host bus adapter (
Monitor and then right-click the selection.
) from below
4. From the pop-up menu, select Change WWN and SPM Name.
The Change WWN and SPM Name window is displayed.
5. Enter the WWN of the new host bus adapter in the WWN combo box.
You can select the WWN of the newly connected host bus adapter in the
WWN combo box. If you are using Windows, you can drag the WWN of the
new host bus adapter displayed below Non-Monitor and drop it to
Monitor.
6. If necessary, enter a new SPM name in the SPM Name box. You can use
up to 16 characters for an SPM name.
7. Select OK to close the Change WWN and SPM Name window.
8. In the Server Priority Manager window, click Apply.
The settings in the window are applied to the storage system.
Server Priority Manager Operation
Hitachi Universal Storage Platform V/VM Hitachi Performance Manager User’s Guide
6-27
Grouping Host Bus Adapters
Server Priority Manager allows you to create an SPM group to contain multiple
host bus adapters. All the host bus adapters (HBAs) in one SPM group must be
of the same priority. Prioritized WWNs (i.e. high-priority HBAs) and
non-prioritized WWNs (i.e. low-priority HBAs) cannot be mixed in the same
group.
You can use an SPM group to switch priority of multiple HBAs from prioritized
to non-prioritized, or vice versa. You can also use an SPM group to set the
same upper limit value to all the HBAs in the group.
Containing Multiple HBAs in an SPM Group
A host bus adapter can be contained in only one SPM group. To create an SPM
group and contain multiple host bus adapters in the group, take the following
steps:
To contain multiple HBAs in an SPM group:
1. Start Server Priority Manager.
The Server Priority Manager window is displayed.
2. Select the WWN tab.
3. In the lower-left tree, select and right-click the Subsystem folder.
4. From the pop-up menu, select Add New SPM Group.
5. In the Add New SPM Group window, enter the name of the SPM group
and then select OK.
An SPM group is created. An SPM group icon (
tree.
) is added to the lower-left
6. Select an HBA
from the upper-left tree and select an SPM group from
the lower-left tree. Next, click Add WWN.
Repeat this operation until all the desired HBAs are added to the SPM
group.
Notes:
Select a host bus adapter from below Monitor. You cannot add HBAs from
below Non-Monitor to SPM groups.
When you select a host bus adapter which is already contained in some
SPM group from the upper-left tree, the Add WWN button is not
activated. Select a host bus adapter which is not contained in any SPM
groups.
Windows users can add a host bus adapter to an SPM group by dragging
the host bus adapter to the SPM group.
7. Click Apply.
6-28
Server Priority Manager Operation
Hitachi Universal Storage Platform V/VM Hitachi Performance Manager User’s Guide
The settings in the window are applied to the storage system.
Figure 6-11
Add New SPM Group Window
Deleting an HBA from an SPM Group
To delete a host bus adapter from the SPM group, take the following steps.
1. Start Server Priority Manager.
The Server Priority Manager window is displayed.
2. Select the WWN tab.
3. In the lower-left tree, double-click the SPM group (
host bus adapter to be deleted.
) that contains the
4. Below the SPM icon, right-click the icon the host bus adapter (
to delete.
) you want
5. Select Delete WWN from the pop-up menu.
The selected host bus adapter icon is deleted from the tree.
6. Click Apply.
The settings on the window are applied to the storage system.
Switching Priority of an SPM Group
All the host bus adapters (HBAs) in one SPM group must be of the same
priority. Prioritized WWNs (i.e. high-priority HBAs) and non-prioritized WWNs
(i.e. low-priority HBAs) cannot be mixed in one SPM group.
You can use an SPM group to switch priority of multiple HBAs from prioritized
to non-prioritized, or vice versa.
To switch priority:
1. Start Server Priority Manager.
The Server Priority Manager window is displayed.
2. Select the WWN tab.
3. In the lower-left tree, select and right-click an SPM group (
).
4. Do one of the following:
–
To switch priority from prioritized to non-prioritized, select Prio ->>
Non-Prio from the pop-up menu.
Server Priority Manager Operation
Hitachi Universal Storage Platform V/VM Hitachi Performance Manager User’s Guide
6-29
–
To switch priority from non-prioritized to prioritized, select Non-Prio >> Prio from the pop-up menu.
5. Click Apply.
The settings in the window are applied to the storage system.
Setting an Upper-Limit Value to HBAs in an SPM Group
If all the host bus adapters in an SPM group are non-prioritized WWNs (i.e.
low-priority HBAs), you can set an upper limit value to HBA performance (i.e.
I/O rate or transfer rate). You can assign one upper limit value for one SPM
group.
For example, suppose that the upper limit value 100 IOPS is assigned to an
SPM group consisting of four host bus adapters. If the sum of the I/O rate of
the four HBAs reaches 100 IOPS, Server Priority Manager controls the system
so that the sum of the I/O rates will not exceed 100 IOPS.
To set an upper limit value to HBAs in an SPM group:
1. Start Server Priority Manager.
The Server Priority Manager window is displayed.
2. Select the WWN tab.
3. In the lower-left tree, select and right-click the Subsystem folder or an SPM
group ( ).
4. If you selected the Subsystem folder, take the following steps:
a. Select IOPS or MB/s from the list at the upper-left corner of the list.
Select IOPS if you want to assign an upper limit to the I/O rate. Select
MB/s if you want to assign an upper limit to the transfer rate.
b. To assign an upper limit to the I/O rate, enter the upper limit value in
the IOPS column of the list.
To assign an upper limit to the transfer rate, enter the upper limit value
in the MB/s column of the list.
Tips: If you cannot see the IOPS or MB/s column, scroll the list to the
left. The column is located at the right side of the list.
If you selected an SPM group (
), take the following steps:
a. Right-click the selected SPM group and then select Change Upper
Limit from the pop-up menu.
The Change Upper Limit window is displayed.
b. To assign an upper limit to the I/O rate, enter the upper limit value and
then select IOPS from the list. Next, select OK.
To assign an upper limit to the transfer rate, enter the upper limit value
and then select MB/s from the list. Next, select OK.
6-30
Server Priority Manager Operation
Hitachi Universal Storage Platform V/VM Hitachi Performance Manager User’s Guide
5. In the Server Priority Manager window, click Apply.
The settings in the window are applied to the storage system.
Figure 6-12
Change Upper Limit Window
Note: To confirm an upper limit value specified for each SPM group, select the
Subsystem folder in the lower-left tree of the WWN tab. The SPM groups are
displayed in the list and you can confirm each upper limit value.
Renaming an SPM Group
To rename an SPM group, take the following steps.
1. Start Server Priority Manager.
The Server Priority Manager window is displayed.
2. Select the WWN tab.
3. In the lower-left tree, select and right-click an SPM group (
).
4. Select Rename SPM Group from the pop-up menu.
The Rename SPM Group window is displayed.
5. Enter the new name and select OK.
6. In the Server Priority Manager window, click Apply.
The settings in the window are applied to the storage system.
Figure 6-13
Rename SPM Group Window
Deleting an SPM Group
If you want to delete an SPM group, take the following steps:
To delete an SPM group:
Server Priority Manager Operation
Hitachi Universal Storage Platform V/VM Hitachi Performance Manager User’s Guide
6-31
1. Start Server Priority Manager.
The Server Priority Manager window is displayed.
2. Select the WWN tab.
3. In the lower-left tree, select and right-click an SPM group (
).
4. Select Delete SPM Group from the pop-up menu.
5. In the Server Priority Manager window, click Apply.
The settings in the window are applied to the storage system.
6-32
Server Priority Manager Operation
Hitachi Universal Storage Platform V/VM Hitachi Performance Manager User’s Guide
7
Using the Export Tool
This chapter explains using the Export Tool.
Files to be Exported
Preparing for Using the Export Tool
Using the Export Tool
Command Reference
Using the Export Tool
Hitachi Universal Storage Platform V/VM Hitachi Performance Manager User’s Guide
7-1
Files to be Exported
The Export Tool allows you to save monitoring data appearing in the
Performance Management window into files. The Export Tool also allows
you to save monitoring data about remote copy operations into files. The
Export Tool usually compresses monitoring data in compressed (ZIP) files. To
use a text editor or spreadsheet software to view or edit the monitoring data,
you usually need to decompress the ZIP files to extract CSV files. However, if
you want the Export Tool to save monitoring data in CSV files instead of ZIP
files, you can force the Export Tool to do so.
Table 7-1 shows the correspondence between the Performance Monitor
windows and the monitoring data that can be saved by the Export Tool. For
details on the ZIP files and CSV files that are saved, refer to the tables
indicated in the See column.
Table 7-1
Performance Management Windows and Monitoring Data
Saved by the Export Tool
Window
Monitoring Data
See
Physical tab in the
Performance
Management Window
Statistics about resource usage and write pending rates
Table 7-2
LDEV tab in the
Performance
Management window
Statistics about parity groups, external volume groups, or VVOL groups
Table 7-3
Statistics about volumes in parity groups, in external volume
groups, or in V-VOL groups
Table 7-4
Port-LUN tab in the
Performance
Management window
Statistics about ports
Table 7-5
Statistics about host bus adapters connected to ports
Table 7-6
Statistics about volumes(LUs)
Table 7-7
WWN tab in the
Performance
Management window
Statistics about SPM groups
Table 7-8
Statistics about host bus adapters belonging to SPM groups
Table 7-9
TC Monitor window
and
TCz Monitor window
Statistics about remote copy operations by TrueCopy and
TrueCopy for IBM z/OS (in the whole volume)
Table 7-10
Statistics about remote copy operations by TrueCopy and
TrueCopy for IBM z/OS (for each volume (LU))
Table 7-11
Statistics about remote copy operations by TrueCopy and
TrueCopy for IBM z/OS (at volumes controlled by a particular
CU)
UR Monitor window
and
URz Monitor window
7-2
Table 7-12
Statistics about remote copy operations by TrueCopy and
TrueCopy for IBM z/OS (At CLPR)
Table 7-13
Statistics about remote copy operations by Universal Replicator
and Universal Replicator for IBM z/OS (in the whole volume)
Table 7-14
Statistics about remote copy operations by Universal Replicator
and Universal Replicator for IBM z/OS (at journal groups)
Table 7-15
Using the Export Tool
Hitachi Universal Storage Platform V/VM Hitachi Performance Manager User’s Guide
Window
Monitoring Data
See
Statistics about remote copy operations by Universal Replicator
and Universal Replicator for IBM z/OS (for each volume (LU))
Statistics about remote copy operations by Universal Replicator
and Universal Replicator for IBM z/OS (at volumes controlled
by a particular CU)
Table 7-2
ZIP File
PhyPG_dat.ZIP
PhyLDEV_dat.ZIP
PhyExG_dat.ZIP
PhyExLDEV_dat.ZIP
PhyProc_dat.ZIP
PhyCSW_dat.ZIP
Table 7-16
Table 7-17
Files with Statistics about Resource Usage and Write Pending
Rates
CSV File
Data Saved in the File
PHY_Long_PG.csv
Usage rates for parity groups in long range
PHY_Short_PG.csv
Usage rates for parity groups in short range
PHY_Long_LDEV_x-y.csv
Usage rates for volumes in a parity group in long
range
PHY_Short_LDEV_x-y.csv
Usage rates for volumes in a parity group in
short range
PHY_Short_LDEV_SI_x-y.csv
Usage rates for ShadowImage volumes in a
parity group in short range
PHY_ExG_Response.csv
Average response time (milliseconds) for
external volume groups
PHY_ExG_Trans.csv
Amount of transferred data for external volume
groups (KB/sec)
PHY_ExLDEV_Response_x-y.csv
Average response time (milliseconds) for
volumes in an external volume group
PHY_ExLDEV_Trans_x-y.csv
Amount of data transferred for volumes in an
external volume group (KB/sec)
PHY_Long_CHP.csv
Usage rates for channel processors in long range
PHY_Short_CHP.csv
Usage rates for channel processors in short
range
PHY_Long_DKP.csv
Usage rates for disk processors in long range
PHY_Short_DKP.csv
Usage rates for disk processors in short range
PHY_Long_DRR.csv
Usage rates for DRRs (data recovery and
reconstruction processors) in long range
PHY_Short_DRR.csv
Usage rates for DRRs (data recovery and
reconstruction processors) in short range
PHY_Long_MPA_CSW.csv
Usage rates for access paths between channel
adapters and cache memories in long range
Usage rates for access paths between disk
adapters and cache memories in long range
Using the Export Tool
Hitachi Universal Storage Platform V/VM Hitachi Performance Manager User’s Guide
7-3
ZIP File
CSV File
PHY_Short_MPA_CSW.csv
Data Saved in the File
Usage rates for access paths between channel
adapters and cache memories in short range
Usage rates for access paths between disk
adapters and cache memories in short range
PHY_Long_MPA_SMA.csv
Usage rates for access paths between channel
adapters and the shared memory in long range
Usage rates for access paths between disk
adapters and the shared memory in long range
PHY_Short_MPA_SMA.csv
Usage rates for access paths between channel
adapters and the shared memory in short range
Usage rates for access paths between disk
adapters and the shared memory in short range
PHY_Long_CSW_CMA.csv
Usage rates for access paths between cache
switches and cache memories in long range
PHY_Short_CSW_CMA.csv
Usage rates for access paths between cache
switches and cache memories in short range
PHY_Long_Write_Pending_Rate
.csv
Write pending rates in long range
PHY_Short_Write_Pending_Rat
e.csv
Write pending rates in short range
PHY_Short_Cache_Usage_Rate.
csv
Usage rates for cache memory
Notes:
1 millisecond is one-thousandth of 1 second.
The letters "x-y" in CSV filenames indicate a parity group or external volume group.
Both long range and short range statistics are stored for resource usage and write pending rates.
Table 7-3
ZIP File
PG_dat.ZIP
7-4
Files with Statistics about Parity Groups, External Volume
Groups or V-VOL Groups
CSV File
Data Saved in the File
PG_IOPS.csv
The number of read and write operations per
second
PG_TransRate.csv
The size of data transferred per second (KB/sec)
PG_Read_IOPS.csv
The number of read operations per second
PG_Seq_Read_IOPS.csv
The number of sequential read operations per
second
PG_Rnd_Read_IOPS.csv
The number of random read operations per
second
PG_CFW_Read_IOPS.csv
The number of read operations in "cache-fastwrite" mode per second
PG_Write_IOPS.csv
The number of write operations per second
PG_Seq_Write_IOPS.csv
The number of sequential write operations per
second
PG_Rnd_Write_IOPS.csv
The number of random write operations per
second
Using the Export Tool
Hitachi Universal Storage Platform V/VM Hitachi Performance Manager User’s Guide
ZIP File
CSV File
Data Saved in the File
PG_CFW_Write_IOPS.csv
The number of write operations in "cache-fastwrite" mode per second
PG_Read_Hit.csv
The read hit ratio
PG_Seq_Read_Hit.csv
The read hit ratio in sequential access mode
PG_Rnd_Read_Hit.csv
The read hit ratio in random access mode
PG_CFW_Read_Hit.csv
The read hit ratio in "cache-fast-write" mode
PG_Write_Hit.csv
The write hit ratio
PG_Seq_Write_Hit.csv
The write hit ratio in sequential access mode
PG_Rnd_Write_Hit.csv
The write hit ratio in random access mode
PG_CFW_Write_Hit.csv
The write hit ratio in "cache-fast-write" mode
PG_BackTrans.csv
The number of data transfer operations between
cache memories and hard disk drives (i.e., parity
groups, external volume groups, or V-VOL
groups) per second
PG_C2D_Trans.csv
The number of data transfer operations from
cache memories and hard disk drives (i.e., parity
groups, external volume groups, or V-VOL
groups)
PG_D2CS_Trans.csv
The number of data transfer operations from
hard disk drives (i.e., parity groups, external
volume groups, or V-VOL groups) to cache
memories in sequential access mode
PG_D2CR_Trans.csv
The number of data transfer operations from
hard disk drives (i.e., parity groups, external
volume groups, or V-VOL groups) to cache
memories in random access mode
PG_Response.csv
The average response time (microsecond) at
parity groups, external volume groups, or V-VOL
groups
Note: 1 microsecond is one-millionth of 1 second.
Table 7-4
ZIP File
Files with Statistics about Volumes in Parity / External Volume
Groups, or in V-VOL Groups
CSV File
Data Saved in the File
LDEV_IOPS.ZIP
LDEV_IOPS_x-y.csv
The number of read and write operations per
second
LDEV_TransRate.ZIP
LDEV_TransRate_x-y.csv
The size of data transferred per second (KB/sec)
LDEV_Read_IOPS.ZIP
LDEV_Read_IOPS_x-y.csv
The number of read operations per second
LDEV_Seq_Read_IOPS.ZIP
LDEV_Seq_Read_IOPS_x-y.csv
The number of sequential read operations per
second
LDEV_Rnd_Read_IOPS.ZIP
LDEV_Rnd_Read_IOPS_x-y.csv
The number of random read operations per
second
LDEV_CFW_Read_IOPS.ZIP
LDEV_CFW_Read_IOPS_x-y.csv
The number of read operations in "cache-fastwrite" mode per second
LDEV_Write_IOPS.ZIP
LDEV_Write_IOPS_x-y.csv
The number of write operations per second
Using the Export Tool
Hitachi Universal Storage Platform V/VM Hitachi Performance Manager User’s Guide
7-5
ZIP File
CSV File
Data Saved in the File
LDEV_Seq_Write_IOPS.ZIP
LDEV_Seq_Write_IOPS_x-y.csv
The number of sequential write operations per
second
LDEV_Rnd_Write_IOPS.ZIP
LDEV_Rnd_Write_IOPS_x-y.csv
The number of random write operations per
second
LDEV_CFW_Write_IOPS.ZIP
LDEV_CFW_Write_IOPS_xy.csv
The number of write operations in "cache-fastwrite" mode per second
LDEV_Read_Hit.ZIP
LDEV_Read_Hit_x-y.csv
The read hit ratio
LDEV_Seq_Read_Hit.ZIP
LDEV_Seq_Read_Hit_x-y.csv
The read hit ratio in sequential access mode
LDEV_Rnd_Read_Hit.ZIP
LDEV_Rnd_Read_Hit_x-y.csv
The read hit ratio in random access mode
LDEV_CFW_Read_Hit.ZIP
LDEV_CFW_Read_Hit_x-y.csv
The read hit ratio in "cache-fast-write" mode
LDEV_Write_Hit.ZIP
LDEV_Write_Hit_x-y.csv
The write hit ratio
LDEV_Seq_Write_Hit.ZIP
LDEV_Seq_Write_Hit_x-y.csv
The write hit ratio in sequential access mode
LDEV_Rnd_Write_Hit.ZIP
LDEV_Rnd_Write_Hit_x-y.csv
The write hit ratio in random access mode
LDEV_CFW_Write_Hit.ZIP
LDEV_CFW_Write_Hit_x-y.csv
The write hit ratio in "cache-fast-write" mode
LDEV_BackTrans.ZIP
LDEV_BackTrans_x-y.csv
The number of data transfer operations between
cache memories and hard disk drives (i.e.,
volumes) per second
LDEV_C2D_Trans.ZIP
LDEV_C2D_Trans_x-y.csv
The number of data transfer operations from
cache memories and hard disk drives (i.e.,
volumes)
LDEV_D2CS_Trans.ZIP
LDEV_D2CS_Trans_x-y.csv
The number of data transfer operations from
hard disk drives (i.e., volumes) to cache
memories in sequential access mode
LDEV_D2CR_Trans.ZIP
LDEV_D2CR_Trans_x-y.csv
The number of data transfer operations from
hard disk drives (i.e., volumes) to cache
memories in random access mode
LDEV_Response.ZIP
LDEV_Response_x-y.csv
The average response time (microseconds) at
volumes
Notes:
1 microsecond is one-millionth of 1 second.
The letters "x-y" in CSV filenames indicate a parity group. For example, if the filename is LDEV_IOPS_1-2.csv, the
file contains the I/O rate for each volume in the parity group 1-2.
7-6
Using the Export Tool
Hitachi Universal Storage Platform V/VM Hitachi Performance Manager User’s Guide
Table 7-5
Files with Statistics about Ports
ZIP File
Port_dat.ZIP
CSV File
Data Saved in the File
Port_IOPS.csv
The number of read and write operations per
second at ports
Port_KBPS.csv
The size of data transferred per second at ports
(KB/sec)
Port_Response.csv
The average response time (microseconds) at
ports
Port_Initiator_IOPS.csv
The number of read and write operations per
second at Initiator/External ports
Port_Initiator_KBPS.csv
The size of data transferred per second at
Initiator/External ports (KB/sec)
Port_Initiator_Response.csv
The average response time (microseconds) at
Initiator/External ports
Note: * 1 microsecond is one-millionth of 1 second.
Table 7-6
Files with Statistics about Host Bus Adapters Connected to
Ports
ZIP File
PortWWN_dat.ZIP
CSV File
Data Saved in the File
PortWWN_xx_IOPS.csv
The I/O rate (that is, the number of read and
write operations per second) for HBAs that are
connected to a port
PortWWN_xx_KBPS.csv
The size of data transferred per second (KB/sec)
between a port and the HBAs connected to that
port
PortWWN_xx_Response.csv
The average response time (microseconds)
between a port and the HBAs connected to that
port
Notes:
1 microsecond is one-millionth of 1 second.
The letters "xx" in CSV filenames indicate a port name. For example, if the filename is PortWWN_1A_IOPS.csv, the
file contains the I/O rate for each host bus adapter connected to the CL1-A port.
If files are exported to a Windows computer, CSV filenames may end with numbers (for example,
PortWWN_1A_IOPS-1.csv and PortWWN_1a_IOPS-2.csv).
Using the Export Tool
Hitachi Universal Storage Platform V/VM Hitachi Performance Manager User’s Guide
7-7
Table 7-7
ZIP File
LU_dat.ZIP
Files with Statistics about Volumes (LUs)
CSV File
Data Saved in the File
LU_IOPS.csv
The number of read and write operations per
second
LU_TransRate.csv
The size of data transferred per second (KB/sec)
LU_Seq_Read_IOPS.csv
The number of sequential read operations per
second
LU_Rnd_Read_IOPS.csv
The number of random read operations per
second
LU_Seq_Write_IOPS.csv
The number of sequential write operations per
second
LU_Rnd_Write_IOPS.csv
The number of random write operations per
second
LU_Seq_Read_Hit.csv
The read hit ratio in sequential access mode
LU_Rnd_Read_Hit.csv
The read hit ratio in random access mode
LU_Seq_Write_Hit.csv
The write hit ratio in sequential access mode
LU_Rnd_Write_Hit.csv
The write hit ratio in random access mode
LU_C2D_Trans.csv
The number of data transfer operations from
cache memories and hard disk drives (i.e., LUs)
LU_D2CS_Trans.csv
The number of data transfer operations from
hard disk drives (i.e., LUs) to cache memories in
sequential access mode
LU_D2CR_Trans.csv
The number of data transfer operations from
hard disk drives (i.e., LUs) to cache memories in
random access mode
LU_Response.csv
The average response time (microseconds) at
volumes (LUs)
Note: 1 microsecond is one-millionth of 1 second.
Table 7-8
ZIP File
PPCG_dat.ZIP
Files with Statistics about SPM Groups
CSV File
Data Saved in the File
PPCG_IOPS.csv
The number of read and write operations per
second
PPCG_KBPS.csv
The size of data transferred per second (KB/sec)
PPCG_Response.csv
The average response time (microseconds) at
SPM groups
Note: 1 microsecond is one-millionth of 1 second.
7-8
Using the Export Tool
Hitachi Universal Storage Platform V/VM Hitachi Performance Manager User’s Guide
Table 7-9
Files with Statistics about Host Bus Adapters Belonging to SPM
Groups
ZIP File
PPCGWWN_dat.ZIP
CSV File
Data Saved in the File
PPCGWWN_xx_IOPS.csv
The I/O rate (that is, the number of read and
write operations per second) for HBAs belonging
to an SPM group
PPCGWWN_xx_KBPS.csv
The transfer rate (KB/sec) for HBAs belonging to
an SPM group
PPCGWWN_xx_Response.csv
The average response time (microseconds) for
HBAs belonging to an SPM group
PPCGWWN_NotGrouped_
IOPS.csv
The I/O rate (that is, the number of read and
write operations per second) for HBAs that do
not belong to any SPM group
PPCGWWN_NotGrouped_
KBPS.csv
The transfer rate (KB/sec) for HBAs that do not
belong to any SPM group
PPCGWWN_NotGrouped_
Response.csv
The average response time (microseconds), for
HBAs that do not belong to any SPM group
Notes:
1 microsecond is one-millionth of 1 second.
The letters "xx" in CSV filenames indicate the name of an SPM group.
If files are exported to a Windows computer, CSV filenames may end with numbers (for example,
PPCGWWN_mygroup_IOPS-1.csv and PPCGWWN_MyGroup_IOPS-2.csv).
Using the Export Tool
Hitachi Universal Storage Platform V/VM Hitachi Performance Manager User’s Guide
7-9
Table 7-10
ZIP File
RemoteCopy_dat.ZIP
Files with Statistics about Remote Copy Operations by TC and
TC for IBM z/OS (In the Whole Volumes)
CSV File
RemoteCopy.csv
Data Saved in the File
The following data in the whole volumes are
saved:
The usage rate for sidefile cache
The total number of remote I/Os (read and
write operations). The total number of remote
write I/Os.
The number of errors that occur during
remote I/O
The number of initial copy remote I/Os. The
average transfer rate (KB/sec) for initial copy
remote I/Os.
The average response time (milliseconds) for
initial copy. The number of update copy
remote I/Os. The average transfer rate
(KB/sec) for update copy remote I/Os.
The average response time (milliseconds) for
update copy
The number of restore copy remote I/Os
The number of hits of restore copy remote
I/Os
The number of asynchronous update copy
remote I/Os
The number of asynchronous recordsets
The average transfer rate (KB/sec) for
asynchronous update copy remote I/Os
The average response time (milliseconds) for
asynchronous update copy
The number of scheduled recordsets
The number of recordsets that do not arrive
during the schedule
The number of remaining recordsets when the
schedule is completed
The number of job activations of consistency
manager
The percentage of completion of copy
operations (i.e., number of synchronized pairs
/ total number of pairs)
The number of tracks that have not yet been
copied by the initial copy or resync copy
operation
Note: 1 millisecond is one-thousandth of 1 second.
Table 7-11
ZIP File
RCLU_dat.ZIP
7-10
Files with Statistics about Remote Copy Operations by TC and
TC for IBM z/OS (for each Volume (LU))
CSV File
RCLU_All_RIO.csv
Data Saved in the File
The total number of remote I/Os (read and write
operations)
Using the Export Tool
Hitachi Universal Storage Platform V/VM Hitachi Performance Manager User’s Guide
ZIP File
CSV File
Data Saved in the File
RCLU_All_Read.csv
The total number of remote read I/Os
RCLU_All_Write.csv
The total number of remote write I/Os
RCLU_RIO_Error.csv
The number of errors that occur during remote
I/O
RCLU_Initial_Copy_RIO.csv
The number of initial copy remote I/Os
RCLU_Initial_Copy_Hit.csv
The number of hits of initial copy remote I/Os
RCLU_Initial_Copy_Transfer.csv
The average transfer rate (KB/sec) for initial
copy remote I/Os
RCLU_Initial_Copy_Response.cs
v
The average response time (milliseconds) for the
initial copy of each volume (LU)
RCLU_Migration_Copy_RIO.csv
The number of migration copy remote I/Os
RCLU_Migration_Copy_Hit.csv
The number of hits of migration copy remote
I/Os
RCLU_Update_Copy_RIO.csv
The number of update copy remote I/Os
RCLU_Update_Copy_Hit.csv
The number of hits of update copy remote I/Os
RCLU_Update_Copy_Transfer.c
sv
The average transfer rate (KB/sec) for update
copy remote I/Os
RCLU_Update_Copy_Response.
csv
The average response time (milliseconds) for the
update copy of each volume (LU)
RCLU_Restore_Copy_RIO.csv
The number of restore copy remote I/Os
RCLU_Restore_Copy_Hit.csv
The number of hits of restore copy remote I/Os
RCLU_Asynchronous_RIO.csv
The number of asynchronous update copy
remote I/Os
RCLU_Recordset.csv
The number of asynchronous recordsets
RCLU_Asynchronous_Copy_Tra
nsfer.csv
The average transfer rate (KB/sec) for
asynchronous update copy remote I/Os
RCLU_Asynchronous_Copy_Res
ponse.csv
The average response time (milliseconds) for the
asynchronous update copy of each volume (LU)
RCLU_Scheduling_Recordset.cs
v
The number of scheduled recordsets
RCLU_Scheduling_Miss_Record
set.csv
The number of recordsets that do not arrive
during the schedule
RCLU_Remained_Recordset.csv
The number of remaining recordsets when the
schedule is completed
RCLU_Scheduling_Attempt.csv
The number of job activations of consistency
manager
RCLU_Pair_Synchronized.csv
The percentage of completion of copy operations
(i.e., number of synchronized pairs / total
number of pairs)
RCLU_Out_of_Tracks.csv
The number of tracks that have not yet been
copied by the initial copy or resync copy
operation
Note: 1 millisecond is one-thousandth of 1 second.
Using the Export Tool
Hitachi Universal Storage Platform V/VM Hitachi Performance Manager User’s Guide
7-11
Table 7-12
ZIP File
Files with Statistics about Remote Copy Operations by TC and
TC for IBM z/OS (At Volumes Controlled by a Particular CU)
CSV File
Data Saved in the File
RCLDEV_All_RIO.ZIP
RCLDEV_All_RIO_xx.csv
The total number of remote I/Os (read and write
operations)
RCLDEV_All_Read.ZIP
RCLDEV_All_Read_xx.csv
The total number of remote read I/Os
RCLDEV_All_Write.ZIP
RCLDEV_All_Write_xx.csv
The total number of remote write I/Os
RCLDEV_RIO_Error.ZIP
RCLDEV_RIO_Error_xx.csv
The number of errors that occur during remote I/O
RCLDEV_Initial_Copy_RIO.ZIP
RCLDEV_Initial_Copy_RIO_xx.
csv
The number of initial copy remote I/Os
RCLDEV_Initial_Copy_Hit.ZIP
RCLDEV_Initial_Copy_Hit_xx.c
sv
The number of hits of initial copy remote I/Os
RCLDEV_Initial_Copy_Transfer
.ZIP
RCLDEV_Initial_Copy_Transfer
_xx.csv
The average transfer rate (KB/sec) for initial copy
remote I/Os
RCLDEV_Initial_Copy_Respons
e.ZIP
RCLDEV_Initial_Copy_Respons
e_xx.csv
The average response time (milliseconds) for
initial copy at volumes
RCLDEV_Migration_Copy_RIO.
ZIP
RCLDEV_Migration_Copy_RIO_
xx.csv
The number of migration copy remote I/Os
RCLDEV_Migration_Copy_Hit.Z
IP
RCLDEV_Migration_Copy_Hit_
xx.csv
The number of hits of migration copy remote I/Os
RCLDEV_Update_Copy_RIO.ZI
P
RCLDEV_Update_Copy_RIO_xx
.csv
The number of update copy remote I/Os
RCLDEV_Update_Copy_Hit.ZIP
RCLDEV_Update_Copy_Hit_xx.
csv
The number of hits of update copy remote I/Os
RCLDEV_Update_Copy_Transfe
r.ZIP
RCLDEV_Update_Copy_Transfe
r_xx.csv
The average transfer rate (KB/sec) for update
copy remote I/Os
RCLDEV_Update_Copy_Respon
se.ZIP
RCLDEV_Update_Copy_Respon
se_xx.csv
The average response time (milliseconds) for the
update copy at volumes
RCLDEV_Restore_Copy_RIO.ZI
P
RCLDEV_Restore_Copy_RIO_x
x.csv
The number of restore copy remote I/Os
RCLDEV_Restore_Copy_Hit.ZI
P
RCLDEV_Restore_Copy_Hit_xx
.csv
The number of hits of restore copy remote I/Os
RCLDEV_Asynchronous_RIO.ZI
P
RCLDEV_Asynchronous_RIO_x
x.csv
The number of asynchronous update copy remote
I/Os
RCLDEV_Recordset.ZIP
RCLDEV_Recordset_xx.csv
The number of asynchronous recordsets
RCLDEV_Asynchronous_Copy_
Transfer.ZIP
RCLDEV_Asynchronous_Copy_
Transfer_xx.csv
The average transfer rate (KB/sec) for
asynchronous update copy remote I/Os
RCLDEV_Asynchronous_Copy_
Response.ZIP
RCLDEV_Asynchronous_Copy_
Response_xx.csv
The average response time (milliseconds) for the
asynchronous update copy at volumes
RCLDEV_Scheduling_Recordset
.ZIP
RCLDEV_Scheduling_Recordset
_xx.csv
The number of scheduled recordsets
RCLDEV_Scheduling_Miss_Rec
ordset.ZIP
RCLDEV_Scheduling_Miss_Rec
ordset_xx.csv
The number of recordsets that do not arrive during
the schedule
RCLDEV_Remained_Recordset.
ZIP
RCLDEV_Remained_Recordset
_xx.csv
The number of remaining recordsets when the
schedule is completed
RCLDEV_Scheduling_Attempt.
ZIP
RCLDEV_Scheduling_Attempt_
xx.csv
The number of job activations of consistency
manager
7-12
Using the Export Tool
Hitachi Universal Storage Platform V/VM Hitachi Performance Manager User’s Guide
ZIP File
CSV File
Data Saved in the File
RCLDEV_Pair_Synchronized.ZI
P
RCLDEV_Pair_Synchronized_xx
.csv
The percentage of completion of copy operations
(i.e., number of synchronized pairs / total number
of pairs)
RCLDEV_Out_of_Tracks.ZIP
RCLDEV_Out_of_Tracks_xx.cs
v
The number of tracks that have not yet been
copied by the initial copy or Resync copy operation
Note:
1 millisecond is one-thousandth of 1 second.
The letters "xx" in CSV filenames indicate a CU image number. For example, if the filename is
RCLDEV_All_RIO_10.csv, the file contains the total number of remote I/Os of the volumes controlled by the CU
whose image number is 10.
Table 7-13
ZIP File
RCCLPR_dat.ZIP
Table 7-14
ZIP File
UniversalReplicator.ZIP
Files with Statistics about Remote Copy Operations by TC and
TC for IBM z/OS (At CLPR)
CSV File
RCCLPR_SideFile.csv
Data Saved in the File
Sidefile usage rate (percent) per CLPR
Files with Statistics about Remote Copy Operations by UR and
UR for IBM z/OS (In the Whole Volumes)
CSV File
UniversalReplicator.csv
Data Saved in the File
The following data in the whole volumes are
saved:
The number of write I/Os per second.
The amount of data that are written per
second (KB/sec)
The initial copy hit rate (percent)
The average transfer rate (KB/sec) for initial
copy operations
The number of asynchronous remote I/Os per
second at the primary storage system
The number of journals at the primary
storage system
The average transfer rate (KB/sec) for
journals in the primary storage system
The remote I/O average response time
(milliseconds) on the primary storage system
The number of asynchronous remote I/Os per
second at the secondary storage system
The number of journals at the secondary
storage system
The average transfer rate (KB/sec) for
journals in the secondary storage system
The remote I/O average response time
(milliseconds) on the secondary storage
system
Note: 1 millisecond is one-thousandth of 1 second.
Using the Export Tool
Hitachi Universal Storage Platform V/VM Hitachi Performance Manager User’s Guide
7-13
Table 7-15
ZIP File
URJNL_dat.ZIP
Files with Statistics about Remote Copy Operations by UR and
UR for IBM z/OS (At Journal Groups)
CSV File
Data Saved in the File
URJNL_Write_Record.csv
The number of write I/Os per second
URJNL_Write_Transfer.csv
The amount of data that are written per second
(KB/sec)
URJNL_Initial_Copy_Hit.csv
The initial copy hit rate (percent)
URJNL_Initial_Copy_Transfer.c
sv
The average transfer rate (KB/sec) for initial copy
operations
URJNL_MJNL_Asynchronous_RIO.csv
The number of asynchronous remote I/Os per
second at the primary storage system
URJNL_MJNL_Asynchronous_Journal.cs
v
The number of journals at the primary storage
system
URJNL_MJNL_Asynchronous_Copy_Tran
sfer.csv
The average transfer rate (KB/sec) for journals in
the primary storage system
URJNL_MJNL_Asynchronous_Copy_Res
ponse.csv
The remote I/O average response time
(milliseconds) on the primary storage system
URJNL_RJNL_Asynchronous_RIO.csv
The number of asynchronous remote I/Os per
second at the secondary storage system
URJNL_RJNL_Asynchronous_Journal.cs
v
The number of journals at the secondary storage
system
URJNL_RJNL_Asynchronous_Copy_Tran
sfer.csv
The average transfer rate (KB/sec) for journals in
the secondary storage system
URJNL_RJNL_Asynchronous_Copy_Res
ponse.csv
The remote I/O average response time
(milliseconds) on the secondary storage system
URJNL_MJNL_Data_Used_Rate.csv
Data usage rate (percent) for master journals
URJNL_MJNL_Meta_Data_Used_Rate.cs
v
Metadata usage rate (percent) for master journals
URJNL_RJNL_Data_Used_Rate.csv
Data usage rate (percent) for restore journals
URJNL_RJNL_Meta_Data_Used_Rate.cs
v
Metadata usage rate (percent) for restore journals
Note: 1 millisecond is one-thousandth of 1 second.
7-14
Using the Export Tool
Hitachi Universal Storage Platform V/VM Hitachi Performance Manager User’s Guide
Table 7-16
ZIP File
URLU_dat.ZIP
Table 7-17
ZIP File
Files with Statistics about Remote Copy Operations by UR and
UR for IBM z/OS (For Each Volume (LU))
CSV File
Data Saved in the File
URLU_Read_Record.csv
The number of read I/Os per second
URLU_Read_Hit.csv
The number of read hit records per second
URLU_Write_Record.csv
The number of write I/Os per second
URLU_Write_Hit.csv
The number of write hit records per second
URLU_Read_Transfer.csv
The amount of data that are read per second
(KB/sec)
URLU_Write_Transfer.csv
The amount of data that are written per second
(KB/sec)
URLU_Initial_Copy_Hit.csv
The initial copy hit rate (percent)
URLU_Initial_Copy_Transfer.cs
v
The average transfer rate (KB/sec) for initial copy
operations
Files with Statistics about Remote Copy Operations by UR and
UR for IBM z/OS (At Volumes Controlled by a Particular CU)
CSV File
Data Saved in the File
URLDEV_Read_Record.ZIP
URLDEV_Read_Record_xx.csv
The number of read I/Os per second
URLDEV_Read_Hit.ZIP
URLDEV_Read_Hit_xx.csv
The number of read hit records per second
URLDEV_Write_Record.ZIP
URLDEV_Write_Record_xx.csv
The number of write I/Os per second
URLDEV_Write_Hit.ZIP
URLDEV_Write_Hit_xx.csv
The number of write hit records per second
URLDEV_Read_Transfer.ZIP
URLDEV_Read_Transfer_xx.csv
The amount of data that are read per second
(KB/sec)
URLDEV_Write_Transfer.ZIP
URLDEV_Write_Transfer_xx.csv
The amount of data that are written per second
(KB/sec)
URLDEV_Initial_Copy_Hit.ZIP
URLDEV_Initial_Copy_Hit_xx.csv
The initial copy hit rate (percent)
URLDEV_Initial_Copy_Transfer
.ZIP
URLDEV_Initial_Copy_Transfer_
xx.csv
The average transfer rate (KB/sec) for initial
copy operations
Note: The letters "xx" in CSV filenames indicate a CU image number. For example, if the filename is
URLDEV_Read_Record_10.csv, the file contains the number of read I/Os (per second) of the volumes controlled by the
CU whose image number is 10.
Using the Export Tool
Hitachi Universal Storage Platform V/VM Hitachi Performance Manager User’s Guide
7-15
Preparing for Using the Export Tool
This section explains how to prepare for using the Export Tool.
Requirements for Using the Export Tool
The following components are required to use the Export Tool:
•
a Windows computer or a UNIX computer
The Export Tool runs on Windows computers and UNIX computers that can
run Storage Navigator. If your Windows or UNIX computer is unable to run
Storage Navigator, your computer is unable to run the Export Tool. For
detailed information about computers that can run Storage Navigator, see
the Storage Navigator User’s Guide.
•
Java Runtime Environment (JRE)
To be able to use the Export Tool, you must install Java Runtime
Environment on your Windows or UNIX computer. If your computer runs
Storage Navigator, JRE is already installed on your computer and you can
install the Export Tool. If your computer does not run Storage Navigator
but contains an appropriate version of JRE, you can install the Export Tool
on your computer.
The JRE version required for running the Export Tool is the same as the JRE
version required for running Storage Navigator. For detailed information
about the JRE version required for running Storage Navigator, see the
Storage Navigator User’s Guide.
A user ID exclusively for use with the Export Tool
If you want to use the Export Tool, you must create a user ID that will be
used exclusively with the Export Tool. When you create the user ID, note
the following:
–
Permissions of USP V/VM programs
If you use the Export Tool only to save the monitoring data into files, do
not assign any permission to the user ID for use with the Export Tool. If
a user ID having permission is used with the Export Tool, the storage
system configuration might be changed in an unfavorable way by an
unidentified user.
If you use the Export Tool not only to save monitoring data but also to
start or stop monitoring and to change the gathering interval by the set
subcommand, the user ID needs to have at least one of permissions for
Performance Monitor, TrueCopy, TrueCopy for IBM z/OS, Universal
Replicator, and Universal Replicator for IBM z/OS.
–
User types
You can specify any user type for the user ID for use with the Export
Tool.
If you specify "storage administrator" for the user ID, all the monitoring
data described from Table 7-2 to Table 7-17 can be saved into files.
7-16
Using the Export Tool
Hitachi Universal Storage Platform V/VM Hitachi Performance Manager User’s Guide
If you specify "storage partition administrator" for the user ID, the
monitoring data that can be saved and the functions of the Export Tool
are limited. For details, see Using the Export Tool.
For detailed information about how to create a user ID, see the Storage
Navigator User’s Guide.
•
The Export Tool program
The Export Tool is contained in CD-ROM Disc 2, which is named Host PP.
For detailed information about how to install the Export Tool on a Windows
computer, see Installing the Export Tool on a Windows Computer. For
detailed information about how to install the Export Tool on a UNIX
computer, see Installing the Export Tool on a UNIX Computer.
Installing the Export Tool on a Windows Computer
To install the Export Tool on a Windows computer:
1. Create a directory on your Windows computer. In later steps, you will
install the Export Tool on the new directory.
2. Insert the Export Tool installation media into the CD-ROM drive.
3. Locate the self-extracting file export.EXE in the directory
\program\monitor\win_nt in your CD-ROM disc, and then copy
export.EXE to the new directory that you created earlier.
4. Double-click export.EXE on your computer. The Export Tool is installed.
Also, a new directory named export is created.
Notes:
The export directory contains a couple of files, which include
runUnix.bat. It is recommended that you delete runUnix.bat because
this file is no longer needed.
The Export Tool program is a Java class file and is located in the
export\lib directory.
Using the Export Tool
Hitachi Universal Storage Platform V/VM Hitachi Performance Manager User’s Guide
7-17
Installing the Export Tool on a UNIX Computer
To install the Export Tool on a UNIX computer:
1. Create a directory on your UNIX computer. In later steps, you will install
the Export Tool on the new directory.
2. Mount the Export Tool installation media.
3. Do one of the following:
–
If you are using Solaris, locate the archive file export.tar in the
directory /program/monitor/solaris in your CD-ROM disc, and then
copy export.tar to the new directory that you created earlier.
–
If you are using HP-UX, locate the archive file export.tar in the
directory /program/monitor/HP-UX in your CD-ROM disc, and then
copy export.tar to the new directory that you created earlier.
4. Decompress export.tar on your computer. The Export Tool is installed. Also,
a new directory named export is created.
Notes:
The export directory contains a couple of files, which include runWin.bat.
It is recommended that you delete runWin.bat because this file is no
longer needed.
The Export Tool program is a Java class file and is located in the
export/lib directory.
7-18
Using the Export Tool
Hitachi Universal Storage Platform V/VM Hitachi Performance Manager User’s Guide
Using the Export Tool
To be able to export monitoring data, you must prepare a command file and a
batch file. This section explains how to prepare a command file and a batch file,
and then explains how to run the Export Tool.
•
Preparing a command file
•
Preparing a batch file
•
Running the Export Tool
Preparing a Command File
To be able to run the Export Tool, you must write scripts for exporting
monitoring data. When writing scripts, you need to write several
subcommands in a command file. When you run the Export Tool, the
subcommands in the command file execute sequentially and then the
monitoring data are saved in files.
Figure 7-1 gives an example of a command file:
svpip 158.214.135.57
login expusr passwd
show
group PhyPG Long
; Specifies IP address of SVP
; Logs user into SVP
; Outputs storing period to standard output
; Specifies type of data to be exported and type of
; storing period
group RemoteCopy
; Specifies type of data to be exported
short-range 200610010850:200610010910
; Specifies term of data to be exported for data stored
; in short range
long-range 200609301430:200610011430
; Specifies term of data to be exported for data stored
; in long range
outpath out
; Specifies directory in which files will be saved
option compress
; Specifies whether to compress files
apply
; Executes processing for saving monitoring data in files
Figure 7-1
Example of a Command File
In the above scripts, the semicolon (;) indicates the beginning of a comment.
Characters from a semicolon to the end of the line are regarded as a comment.
The scripts in this command file are explained as follows:
•
svpip 158.214.135.57
This script specifies that you are logging into the SVP whose IP address is
158.214.135.57. You must log into the SVP when using the Export Tool.
The svpip subcommand specifies the IP address of the SVP. You must
include the svpip subcommand in your command file. For detailed
information about the svpip subcommand, see svpip Subcommand.
•
login expusr passwd
Using the Export Tool
Hitachi Universal Storage Platform V/VM Hitachi Performance Manager User’s Guide
7-19
This script specifies that you use the user ID expusr and the password
passwd to log into the SVP.
The login subcommand logs the specified user into the SVP. You must
include the login subcommand in your command file. For detailed
information about the login subcommand, see login Subcommand.
Caution: When you write the login subcommand in your command file,
you must specify a user ID that should be used exclusively for running the
Export Tool. See Requirements for Using the Export Tool for reference.
•
show
The show subcommand checks the SVP to find the period of monitoring
data stored in the SVP and the data collection interval (that is called
"gathering interval" in Performance Monitor), and then outputs them to the
standard output (for example, the command prompt) and the log file.
Performance Monitor collects statistics by the two types of storing periods:
in short range and in long range. The show subcommand displays the
storing periods and the gathering intervals for these two types of
monitoring data.
The following is an example of information that the show subcommand
outputs:
Short Range
Long Range
From: 2006/10/01 01:00
From: 2006/09/01 00:00
-
To: 2006/10/01 15:00
To: 2006/10/01 15:00
Interval: 1min.
Interval: 15min.
Short Range indicates the storing period and gathering interval of the
monitoring data stored in short range. Long Range indicates those of the
monitoring data stored in long range. In the above example, the
monitoring data in short range is stored every 1 minute in the term of
1:00-15:00 on Oct. 1, 2006. Also, the monitoring data in long range is
stored every 15 minutes in the term of Sep. 1, 2006, 0:00 through Oct. 1,
2006, 15:00. When you run the Export Tool, you can export monitoring
data within these periods into files.
All the monitoring items are stored in short range, but a part of monitoring
items is stored in both the short range and long range. For details on
monitoring items that can be stored in long range, see long-range
Subcommand.
The use of the show subcommand is not mandatory, but it is recommended
that you include the show subcommand in your command file. If an error
occurs when you run the Export Tool, you might be able to find the error
cause by checking the log file for information issued by the show
subcommand. For detailed information about the show subcommand, see
show Subcommand.
•
7-20
group PhyPG Long and group RemoteCopy
Using the Export Tool
Hitachi Universal Storage Platform V/VM Hitachi Performance Manager User’s Guide
The group subcommand specifies the type of data that you want to export.
Specify a operand following group to define the type of data to be exported.
Basically, monitoring data stored in short range is exported. But you can
direct to export monitoring data stored in long range when you specify
some of the operands.
The script group PhyPG Long in Figure 7-1 specifies to export usage
statistics about parity groups in long range. Also, the script
group RemoteCopy specifies to export statistics about remote copy
operations by TrueCopy and TrueCopy for IBM z/OS in short range. You can
describe multiple lines of the group subcommand to export multiple
monitoring items at the same time.
For detailed information about the group subcommand, see group
Subcommand.
•
short-range 200610010850:200610010910 and
long-range 200609301430:200610011430
The short-range and long-range subcommands specify the term of
monitoring data to be exported. Use these subcommands when you want
to narrow the export-target term within the stored data. You can specify
both the short-range and long-range subcommands at the same time. The
difference between these subcommands is as follows:
–
The short-range subcommand is valid for monitoring data in short
range. You can use this subcommand to narrow the export-target term
for all the monitoring items you can specify by the group subcommand.
Specify a term within "Short Range From XXX To XXX" which is output
by the show subcommand.
–
The long-range subcommand is valid for monitoring data in long range.
You can use this subcommand only when you specify the PhyPG,
PhyLDEV, PhyProc, or PhyCSW operand with the Long option in the group
subcommand. (The items that can be saved by these operands are the
monitoring data displayed in the Physical tab of the Performance
Management window with selecting long-range.)
Specify a term within "Long Range From XXX To XXX" which is output
by the show subcommand.
In Figure 7-1, the script short-range 200610010850:200610010910 specifies
the term 8:50-9:10 on Oct. 1, 2006. This script is applied to the
group RemoteCopy subcommand in this example. When you run the Export
Tool, it will export the statistics about remote copy operations by TrueCopy
and TrueCopy for IBM z/OS in the term specified by the short-range
subcommand.
Also, in Figure 7-1, the script long-range 200609301430:200610011430
specifies the term from Sep. 30, 2006, 14:30 to Oct. 1, 2006, 14:30. This
script is applied to the group PhyPG Long subcommand in this example.
When you run the Export Tool, it will export the usage statistics about
parity groups in the term specified by the long-range subcommand.
Using the Export Tool
Hitachi Universal Storage Platform V/VM Hitachi Performance Manager User’s Guide
7-21
If you run the Export Tool without specifying the short-range or longrange subcommand, the monitoring data in the whole storing period (data
in the period displayed by the show subcommand) will be exported.
•
–
For detailed information about the short-range subcommand, see
short-range Subcommand.
–
For detailed information about the long-range subcommand, see longrange Subcommand.
outpath out
This script specifies that files should be saved in the directory named out in
the current directory.
The outpath subcommand specifies the directory in which files should be
saved. For detailed information about the outpath subcommand, see
outpath Subcommand.
•
option compress
This script specifies that the Export Tool should compress monitoring data
in ZIP files.
The option subcommand specifies whether to save files in ZIP format or in
CSV format. For detailed information about the option subcommand, see
option Subcommand.
•
apply
The apply subcommand saves monitoring data in files. For detailed
information about the apply command, see apply Subcommand.
When you install the Export Tool, the file command.txt will be stored in the
export directory. The command.txt file contains sample scripts for your
command file. It is recommended that you customize scripts in command.txt
according to your needs. For detailed information about subcommand syntax,
see Command Reference.
Preparing a Batch File
To run the Export Tool, you need a batch file. The Export Tool starts and saves
monitoring data in files when you execute the batch file.
The installation directory for the Export Tool (that is, the export directory)
contains two batch files: runWin.bat and runUnix.bat. If your computer runs
Windows, use runWin.bat. If your computer runs UNIX, use runUnix.bat.
Figure 7-2 illustrates scripts in runWin.bat and runUnix.bat. These batch files
include a command line that executes a Java command. When you execute
your batch file, the Java command executes subcommands specified in your
command file and then saves monitoring data in files.
Batch file for Windows computers (runWin.bat)
7-22
Using the Export Tool
Hitachi Universal Storage Platform V/VM Hitachi Performance Manager User’s Guide
Java -classpath "./lib/JSanExport.jar;./lib/JSanRmiServerSx.jar" -Xmx536870912 Dmd.command=command.txt -Dmd.logpath=log sanproject.getmondat.RJMdMain pause Batch file for UNIX computers (runUnix.bat)
#! /bin/sh Java -classpath "./lib/JSanExport.jar:./lib/JSanRmiServerSx.jar" -Xmx536870912 Dmd.command=command.txt -Dmd.logpath=log sanproject.getmondat.RJMdMain Figure 7-2
Scripts in Batch Files
In the above scripts, the " " symbol indicates the end of a command line.
If the computer running the Export Tool communicates directly with the SVP,
you usually do not need to change scripts in runWin.bat and runUnix.bat.
However, you might need to edit the Java command script in your text editor
in some occasions, for example:
•
if the name of your command file is not command.txt
•
if you moved your command file to a different directory
•
if you do not want to save log files in the "log" directory
•
if you want to name log files as you like
If the computer that runs the Export Tool communicates with the SVP via a
proxy host, you need to edit the Java command script in your text editor.
When editing the Java command script, you need to specify the host name (or
the IP address) and the port number of the proxy host. For example, if the
host name is Jupiter and the port number is 8080, the resulting command
script as shown in Figure 7-3:
Batch file for Windows computers (runWin.bat)
Java -classpath "./lib/JSanExport.jar;./lib/JSanRmiServerSx.jar" -Dhttp.proxyHost=Jupiter
-Dhttp.proxyPort=8080 -Xmx536870912 -Dmd.command=command.txt -Dmd.logpath=log
sanproject.getmondat.RJMdMain pause Batch file for UNIX computers (runUnix.bat)
#! /bin/sh Java -classpath "./lib/JSanExport.jar:./lib/JSanRmiServerSx.jar" -Dhttp.proxyHost=Jupiter
-Dhttp.proxyPort=8080 -Xmx536870912 -Dmd.command=command.txt -Dmd.logpath=log
sanproject.getmondat.RJMdMain Figure 7-3
Scripts in Batch Files (When Specifying the Host Name of a
Proxy Host)
In the above scripts, the " " symbol indicates the end of a command line.
If the IP address of the proxy host is 158.211.122.124 and the port number is
8080, the resulting command script is as follows:
Batch file for Windows computers (runWin.bat)
Java -classpath "./lib/JSanExport.jar;./lib/JSanRmiServerSx.jar" -Dhttp.proxyHost=158.211.122.124
Using the Export Tool
Hitachi Universal Storage Platform V/VM Hitachi Performance Manager User’s Guide
7-23
-Dhttp.proxyPort=8080 -Xmx536870912 -Dmd.command=command.txt -Dmd.logpath=log
sanproject.getmondat.RJMdMain pause Batch file for UNIX computers (runUnix.bat)
#! /bin/sh Java -classpath "./lib/JSanExport.jar:./lib/JSanRmiServerSx.jar" -Dhttp.proxyHost=158.211.122.124
-Dhttp.proxyPort=8080 -Xmx536870912 -Dmd.command=command.txt -Dmd.logpath=log
sanproject.getmondat.RJMdMain Figure 7-4
Scripts in Batch Files (When Specifying the IP Address of a
Proxy Host)
In the above scripts, the " " symbol indicates the end of a command line.
For detailed information about syntax of the Java command, see Java
Command for Exporting Data In Files.
Running the Export Tool
To run the Export Tool and save monitoring data in files, you need to execute
your batch file. To execute your batch file, you need to enter the name of the
batch file at the command prompt and then press the <Enter> key. If you are
using a Windows computer, you can double-click the batch file to execute the
batch file.
c:\WINDOWS> cd c:\export
c:\export> runWin.bat
Figure 7-5
Å Go to the directory containing runWin.bat
Å Execute runWin.bat
Example of Executing a Batch File (on a Windows Computer)
When the Export Tool starts exporting monitoring data, dots (...) are issued to
the standard output (for example, the command prompt). The dots increment
as export processing continues. If an internal error occurs, the exclamation
mark (!) is issued to the standard output and the Export Tool attempts to
restart exporting data. If the export processing restarts, dots reappear and
increment until export processing finishes.
7-24
Using the Export Tool
Hitachi Universal Storage Platform V/VM Hitachi Performance Manager User’s Guide
[ 2] svpip 158.214.135.57
Å Displays the currently-running subcommand
[ 3] login User = expusr, Passwd = [****************]
Å Displays the currently-running
subcommand
:
:
[ 6] group Port
Å Displays the currently-running subcommand
:
:
[20] apply
Å Displays the currently-running subcommand
Start gathering port data
Å Indicates that the export processing starts
Target = 16, Total = 16
+----+----+----+----+----+----+----+----+----+----+
...........................!
Å Indicates that an error occurs during the export
processing
.................................
Å Dots appear and increment as the export
processing continues
End gathering port data
Å Indicates that the export processing ends
successfully
Figure 7-6
Example of Command Prompt Outputs from Export Tool
When the Export Tool finishes successfully, monitoring data are usually
compressed in ZIP-format archive files. If you want to obtain CSV files, you
need to decompress ZIP files and extract CSV files out of the ZIP files. If the
operating system on your computer does not include a feature for
decompressing ZIP files, you need to obtain software for decompressing files.
For a complete list of files to be saved by the Export Tool, see Using the Export
Tool.
When an internal error occurs during export processing, the exclamation mark
(!) appears to signal the error. If this happens, the Export Tool will make up to
three more attempts at processing.
If export processing does not finish through three retries or if an internal error
occurs other than those in Table 7-18, the Export Tool does not retry the
processing. In this case, you need to quit the command prompt and then run
the Export Tool again.
You can change the maximum number of retries by using the retry
subcommand. For detailed information about the retry subcommand, see
retry Subcommand.
Table 7-18
Error Message ID
Errors for Which Export Tool Retries Processing
Cause of Error
0001 4001
An error occurred during SVP processing.
0001 5400
Since the SVP is busy, the monitoring data cannot be obtained.
0001 5508
An administrator is changing a system environment file.
0002 2016
Array is refreshing, or the settings by the user are registered.
0002 5510
The storage system is in internal process, or some other user is changing
configuration.
Using the Export Tool
Hitachi Universal Storage Platform V/VM Hitachi Performance Manager User’s Guide
7-25
Error Message ID
Cause of Error
0002 6502
Now processing.
0002 9000
Another user has lock.
0003 2016
A service engineer is accessing the storage system in Modify mode.
0003 2033
The SVP is not ready yet, or an internal processing is being executed.
0003 3006
An error occurred during SVP processing.
0405 8003
The storage system status is invalid.
5205 2003
An internal process is being executed, or maintenance is in progress.
5205 2033
The SVP is now updating the statistics data.
5305 2033
The SVP is now updating the statistics data.
5305 8002
The storage system status is invalid.
If you specify the nocompress operand for the option subcommand, the Export
Tool saves files in CSV format instead of ZIP format (For detailed information,
see option Subcommand). When files are saved in CSV format instead of ZIP
format, the file saving process could take longer and the resulting files could
be larger.
Files saved by the Export Tool are often very large. The total file size for all the
files can be as large as approximately 2 GB. For this reason, the exporting
process might take a lot of time. If you want to export statistics spanning a
long period of time, it is recommended that you run the Export Tool multiple
times for different periods, rather than run only once to export the entire time
span as a single large file. For example, if you want to export statistics
spanning 24 hours, run the tool eight times to export statistics in three hour
increments.
7-26
Using the Export Tool
Hitachi Universal Storage Platform V/VM Hitachi Performance Manager User’s Guide
Table 7-19
Operand for the
Group
Subcommand
Estimate of Time Required for Exporting Files
Estimated Time
Remarks
Port
5 minutes
This estimate assumes that the Export Tool should save
statistics about 128 ports within a 24-hour period.
PortWWN
5 minutes
This estimate assumes that the Export Tool should save
statistics about 128 ports within a 24-hour period.
PPCG
5 minutes
This estimate assumes:
There are eight SPM groups, and eight WWNs are registered
on each SPM group.
There is a WWN that is not registered on any SPM group.
The Export Tool should save statistics about SPM groups and
WWNs described above within a 24-hour period.
LDEV
60 minutes
This estimate assumes:
The Export Tool should save statistics about 8,192 volumes
within a 24-hour period.
The Export Tool is used eight times. Each time the Export Tool
is used, the tool obtains statistics within a 3-hour period.
LU
60 minutes
This estimate assumes:
The Export Tool should save statistics about 12,288 LUs
within a 24-hour period.
The Export Tool is used eight times. Each time the Export Tool
is used, the tool obtains statistics within a 3-hour period.
Whenever the Export Tool runs, the Export Tool creates a new log file on your
computer. Therefore, if you run the Export Tool repeatedly, the size of free
space on your computer will be reduced. To secure free space on your
computer, you are strongly recommended to delete log files regularly. For
information about the directory containing log files, see Java Command for
Exporting Data In Files.
For information about how to solve errors with the Export Tool, see Overview
of Export Tool.
The Export Tool returns a termination code when the Export Tool finishes.
Using the Export Tool
Hitachi Universal Storage Platform V/VM Hitachi Performance Manager User’s Guide
7-27
Table 7-20
Termination Codes Returned by the Export Tool
Termination
Code
Meaning
0
The Export Tool finished successfully.
1
An error occurred when the set subcommand (see set subcommand) executed,
because an attempt to switch to Modify mode failed. Some other user might have
been logged on in Modify mode.
2
An error occurred due to some reason unrelated to system option modes (i.e., View
mode and Modify mode)
3
An error occurred due to more than one reason. One of the reasons is that an attempt
to switch to Modify mode failed when the set subcommand (see set subcommand)
executed. Some other user might have been logged on in Modify mode.
4
The user ID has none of permissions for Performance Monitor, TrueCopy, TrueCopy
for IBM z/OS, Universal Replicator, and Universal Replicator for IBM z/OS.
If you want to use a reference to a termination code in your batch file, do the
following:
•
To use such a reference in a Windows batch file, write %errorlevel% in
the batch file.
•
To use such a reference in a UNIX Bourne shell script, write %? in the shell
script.
•
To use such a reference in a UNIX C shell script, write %status in the shell
script.
A reference to a termination code is used in the following example of a
Windows batch file. If this batch file executes and the Export Tool returns the
termination code 1 or 3, the command prompt displays a message that
indicates the set subcommand fails.
Java -classpath "./lib/JSanExport.jar;./lib/JSanRmiServerSx.jar" -Xmx536870912 Dmd.command=command.txt -Dmd.logpath=log sanproject.getmondat.RJMdMain if %errorlevel%==1 echo THE SET SUBCOMMAND FAILED if %errorlevel%==3 echo THE SET SUBCOMMAND FAILED pause Figure 7-7
Example of a Batch File Including References to Termination
Codes
Note: The " " symbol indicates the end of a command line.
7-28
Using the Export Tool
Hitachi Universal Storage Platform V/VM Hitachi Performance Manager User’s Guide
Command Reference
This section provides the syntax of the subcommands that you can write in
your command file and the Java command that should be used in your batch
file. Table 7-21 lists the subcommands explained in this section. The Java
command is explained in Java Command for Exporting Data In Files.
Table 7-21
Subcommand
Subcommand List
Function
See
svpip
Specifies the IP address of the SVP to be logged in.
svpip Subcommand
retry
Makes settings on retries of export processing.
retry Subcommand
login
Logs the specified user into the SVP.
login Subcommand
show
Checks the SVP to find the period of monitoring data stored
in the SVP and the data collection interval (that is called
"gathering interval"), and then outputs them to the standard
output and the log file.
show Subcommand
group
Specifies the type of data that you want to export.
group Subcommand
short-range
Specifies the term of monitoring data to be exported for
short-range monitoring data.
short-range
Subcommand
long-range
Specifies the term of monitoring data to be exported for
long-range monitoring data.
long-range
Subcommand
outpath
Specifies the directory in which files should be saved.
outpath Subcommand
option
Specifies whether to save files in ZIP format or in CSV
format.
option Subcommand
apply
Saves monitoring data in files.
apply Subcommand
set
Starts or ends monitoring the storage system, and also
specifies the gathering interval in short range monitoring.
set subcommand
help
Displays the online help for subcommands.
set subcommand
Using the Export Tool
Hitachi Universal Storage Platform V/VM Hitachi Performance Manager User’s Guide
7-29
Command Syntax
This section explains the syntax of subcommands that you can write in your
command file. This section also explains the syntax of the Java command that
should be used in your batch file.
•
Conventions used in this section
This section uses the following symbols and typefaces to explain syntax:
U
Indicates a space.
bold
Indicates characters that you must type as they are.
italics
Indicates a type of an operand. You do not need to type characters in
italics as they are.
[ ]
Indicates one or more operands that can be omitted.
If two or more operands are enclosed by these square brackets and are
delimited by vertical bars (|), you can select one of the operands.
{ }
Indicates that you must select one operand from the operands enclosed
by the braces. Two or more operands are enclosed by the braces and
are delimited by vertical bars (|).
...
Indicates that a previously used operand can be repeated.
Table 7-22
Syntax Descriptions
Syntax
connectUip-address
destinationU[directory]
The Syntax Indicates that You Can Write the Following Script
connect 123.01.22.33
destination
destination c:\temp
compressU[yes|no]
compress
compress yes
compress no
answerU{yes|no}
answer yes
answer no
portsU[name][U...]
ports
ports port-1
ports port-1 port-2
7-30
Using the Export Tool
Hitachi Universal Storage Platform V/VM Hitachi Performance Manager User’s Guide
•
Notes on writing script in the command file
When you write a script in your command file, be aware of the following:
–
Ensure that only one subcommand is used in one line.
–
Empty lines in any command file will be ignored.
–
Use a semicolon (;) if you want to insert a comment in your command
file. If you enter a semicolon in one line, the remaining characters in
that line will be regarded as a comment.
;;;;;;; ;;;;;;;;;;;;;;;;;;;;;;;;;;;;;;;;
;;;
COMMAND FILE: command.txt
;;;;
;;;;;;;;;; ;;;;;;;;;;;;;;;;;;;;;;;;;;;;;
svpip 158.214.135.57
; IP address of SVP
login expusr "passwd"
; Log onto SVP
Figure 7-8
•
Examples of Comments
Viewing the Online Help for subcommands
You can display the online Help to view the syntax of subcommands when
you are working at the command prompt. To be able to view the online
Help, you must use the help subcommand of the Export Tool. For detailed
information about how to use the help subcommand, see help
Subcommand.
Using the Export Tool
Hitachi Universal Storage Platform V/VM Hitachi Performance Manager User’s Guide
7-31
svpip Subcommand
Syntax
svpipU{ip-address|host-name}
Description
The svpip subcommand specifies the IP address or the host name of the SVP.
Operands
ip-address
Specifies the IP address of the SVP. If the SVP is managed with IPv6
(Internet Protocol Version 6), you must specify the ip-address operand to
match the format of IPv6. If the Export Tool runs on Windows XP, the
interface identifier (for example, "%5") must be added to the end of the
specified IP address.
host-name
Specifies the host name of the SVP.
If the host name includes any character that is neither an alphanumeric nor
a period, the host name must be enclosed by double quotation marks (").
Example
The following example specifies the IP address of the SVP as 158.214.127.170.
svpip 158.214.127.170
7-32
Using the Export Tool
Hitachi Universal Storage Platform V/VM Hitachi Performance Manager User’s Guide
retry Subcommand
Syntax
retryU[time=m]U[count=n]
Description
The retry subcommand makes settings on retries of export processing.
When an internal error occurs during export processing, the Export Tool stops
processing and then retries export processing. By default, the Export Tool can
retry processing up to three times, but you can change the maximum number
of retries by using the retry subcommand.
By default, the interval between one retry and the next retry is two minutes.
You can change the interval by using the retry subcommand.
The retry subcommand must execute before the login subcommand executes.
Operands
time=m
Specifies the interval between retries in minutes.
m is a value within the range of 1 to 59.
If this operand is omitted, the interval between retries is two minutes.
count=n
Specifies the maximum number of retries.
If n is 0, the number of retries is unlimited.
If this operand is omitted, the maximum number of retries is 3.
Example
If the following command file is used, the interval between retries is five
minutes and the maximum number of retries is 10.
svpip 158.214.135.57
retry time=5 count=10
login expusr passwd
show
group Port
short-range 200604010850:200604010910
outpath out
option compress
apply
Using the Export Tool
Hitachi Universal Storage Platform V/VM Hitachi Performance Manager User’s Guide
7-33
login Subcommand
Syntax
loginUuseridUpassword
Description
The login subcommand uses a user ID and a password to log the specified
user in the SVP.
The svpip subcommand must execute before the login subcommand executes.
The login subcommand fails if monitoring data does not exist in the SVP.
Operands
userid
Specifies the user ID for the SVP.
If the user ID includes any non-alphanumeric character, the user ID must
be enclosed by double quotation marks (").
Be sure to specify a user ID that should be used exclusively with the Export
Tool. For detailed information, see Requirements for Using the Export Tool.
password
Specifies the password of the user.
If the password includes any non-alphanumeric character, the password ID
must be enclosed by double quotation marks (").
Example
This example logs the user expusr into the SVP whose IP address is
158.214.127.170. The password is pswd.
svpip 158.214.127.170
login expuser pswd
7-34
Using the Export Tool
Hitachi Universal Storage Platform V/VM Hitachi Performance Manager User’s Guide
show Subcommand
Syntax
show
Description
The show subcommand outputs the following information to the standard
output (for example, to the command prompt):
–
the period during which monitoring data was collected onto the SVP
(storing period)
–
the interval at which the monitoring data was collected (gathering
interval).
Performance Monitor collects statistics by the two types of storing periods: in
short range and in long range. In short-range monitoring, the monitoring data
between 8 hours and 15 days is stored in the SVP, and in long-range
monitoring, the monitoring data up to three months is stored in the SVP. For
details on the two storing periods, see Understanding Statistical Storage
Ranges.
The show subcommand displays the storing period and the gathering interval
for these two types of monitoring data: in short range and in long range. For
example, the show subcommand outputs the following information:
Short Range
Long Range
From: 2006/10/01 01:00
From: 2006/09/01 00:00
-
To: 2006/10/01 15:00
To: 2006/10/01 15:00
Interval: 1min.
Interval: 15min.
Short Range indicates the storing period and gathering interval of the
monitoring data stored in short range. Long Range indicates those of the
monitoring data stored in long range. When you run the Export Tool, you can
export the monitoring data within these periods into files. If you use the
short-range or long-range subcommand additionally, you can narrow the
term of data to be exported (see short-range Subcommand or long-range
Subcommand).
From indicates the starting time for collecting monitoring data. To indicates the
ending time for collecting monitoring data.
Interval indicates the interval at which the monitoring data was collected
(gathering interval). For example, Interval 15min. indicates that monitoring
data was collected at 15-minute intervals.
Storing periods output by the show subcommand is the same as the
information displayed in the Monitoring Term area of the Performance
Management window.
Using the Export Tool
Hitachi Universal Storage Platform V/VM Hitachi Performance Manager User’s Guide
7-35
The show subcommand outputs the period from May 2, 2006, 03:12
to May 3, 2006, 03:12.
Figure 7-9
Information output by the show subcommand
The login command must execute before the show subcommand executes.
7-36
Using the Export Tool
Hitachi Universal Storage Platform V/VM Hitachi Performance Manager User’s Guide
group Subcommand
Syntax
groupU{PhyPGU[Short|Long]U[[parity-group-id]:[parity-group-id]][U…]|
PhyLDEVU[Short|Long]U[[parity-group-id]:[parity-group-id]][U…]|
PhyExGU[[exg-id]:[exg-id]][U…]|
PhyExLDEVU[[exg-id]:[exg-id]][U…]|
PhyProcU[Short|Long]|
PhyCSWU[Short|Long]|
PGU[[parity-group-id|V-VOL-group-id|exg-id]:
[parity-group-id|V-VOL-group-id |exg-id]][U…]|
LDEVU[[parity-group-id|V-VOL-group-id|exg-id]:
[parity-group-id|V-VOL-group-id|exg-id]][U…]|
PortU[[port-name]:[port-name]][U…]|
PortWWNU[[port-name]:[port-name]][U…]|
LUU[[port-name.host-group-id]:[port-name.host-group-id]][U…]|
PPCGU[[SPM-group-name]:[SPM-group-name]][U…]|
PPCGWWNU[[SPM-group-name]:[SPM-group-name]][U…]|
RemoteCopyU|
RCLUU[[port-name.host-group-id]:[port-name.host-group-id]][U…]|
RCLDEVU[[CU-id]:[CU-id]][U…]|
RCCLPR |
UniversalReplicatorU|
URJNLU[[JNL-group-id]:[JNL-group-id]][U…]|
URLUU[[port-name.host-group-id]:[port-name.host-group-id]][U…]|
URLDEVU[[CU-id]:[CU-id]][U…]
}
Description
The group subcommand specifies the type of monitoring data that you want
to export. This command uses an operand (such as PhyPG and PhyLDEV
above) to specify a type of monitoring data.
Table 7-23 shows the monitoring data that can be saved into files by each
operand, and the saved ZIP files. For details on the monitoring data saved in
these files, refer to the tables indicated in the See column.
Table 7-23
Operand
PhyPG
PhyLDEV
Operands of the group Subcommand and Saved Monitoring
Data
Window of
Performance
Monitor
Physical tab in
the
Performance
Management
Monitoring Data Saved in
the File
Saved ZIP File
Usage statistics about parity
groups
PhyPG_dat.ZIP (*1)
Usage statistics about
volumes
PhyLDEV_dat.ZIP
(*1)
Using the Export Tool
Hitachi Universal Storage Platform V/VM Hitachi Performance Manager User’s Guide
See
Table 7-2
7-37
Operand
Window of
Performance
Monitor
Monitoring Data Saved in
the File
window
Saved ZIP File
See
Usage conditions about
external volume groups
PhyExG_dat.ZIP
PhyExLDEV
Usage conditions about
external volumes
PhyExLDEV_dat.ZIP
PhyProc
Usage statistics about
channel processors, disk
processors, and data
recovery and reconstruction
processors
PhyProc_dat.ZIP
(*1)
PhyCSW
Usage statistics about
access paths, write pending
rate, and cache
PhyCSW_dat.ZIP
(*1)
LDEV tab in the
Performance
Management
window
Statistics about parity
groups, external volume
groups, or V-VOL groups
PG_dat.ZIP
Table 7-3
Statistics about volumes in
parity groups, in external
volume groups, or in V-VOL
groups
LDEV_XXXXX.ZIP
(*2)
Table 7-4
Port-LUN tab in
the
Performance
Management
window
Statistics about ports
Port_dat.ZIP
PhyExG
PG
LDEV
Port
PortWWN
LU
Table 7-5
Statistics about host bus
adapters connected to ports
PortWWN_dat.ZIP
Statistics about LUs
LU_dat.ZIP
Table 7-6
Table 7-7
WWN tab in the
Performance
Management
window
Statistics about SPM groups
PPCG_dat.ZIP
Statistics about host bus
adapters belonging to SPM
groups
PPCGWWN_dat.ZIP
TC Monitor
window and
TCz Monitor
window
Statistics about remote
copy operations by
TrueCopy and TrueCopy for
IBM z/OS (in complete
volumes)
RemoteCopy_dat.ZI
P
Table 7-10
RCLU
Statistics about remote
copy operations by
TrueCopy and TrueCopy for
IBM z/OS (for each volume
(LU))
RCLU_dat.ZIP
Table 7-11
RCLDEV
Statistics about remote
copy operations by
TrueCopy and TrueCopy for
IBM z/OS (for volumes
controlled by a particular
CU)
RCLDEV_XXXXX.ZIP
(*3)
Statistics about remote
copy operations by
TrueCopy and TrueCopy for
IBM z/OS (at CLPR)
RCCLPR_dat.ZIP
PPCG
PPCGWWN
RemoteCop
y
RCCLPR
7-38
Table 7-8
Table 7-9
Using the Export Tool
Hitachi Universal Storage Platform V/VM Hitachi Performance Manager User’s Guide
Table 7-12
Table 7-13
Operand
UniversalRe
plicator
Window of
Performance
Monitor
UR Monitor
window and
URz Monitor
window
Monitoring Data Saved in
the File
Saved ZIP File
See
Statistics about remote
copy operations by
Universal Replicator and
Universal Replicator for IBM
z/OS (for entire volumes)
UniversalReplicator.
ZIP
Table 7-14
URJNL
Statistics about remote
copy operations by
Universal Replicator and
Universal Replicator for IBM
z/OS (for journal groups)
URJNL_dat.ZIP
Table 7-15
URLU
Statistics about remote
copy operations by
Universal Replicator and
Universal Replicator for IBM
z/OS (for each volume (LU))
URLU_dat.ZIP
Statistics about remote
copy operations by
Universal Replicator and
Universal Replicator for IBM
z/OS (for volumes
controlled by a particular
CU)
URLDEV_XXXXX.ZIP
(*4)
URLDEV
Table 7-16
Table 7-17
Notes:
*1: When you specify the PhyPG, PhyLDEV, PhyProc, or PhyCSW operand, you can select the
storing period of the monitoring data to be exported from short range or long range. When you specify
other operands, the monitoring data in short range is exported.
*2: A ZIP file whose name begins with
LDEV_.
*3: A ZIP file whose name begins with
RCLDEV_.
*4: A ZIP file whose name begins with
URLDEV_.
You can use the group subcommand more than one time in a command file.
For example, you can write the following script:
group PortWWN CL1-A:CL1-B
group PPCG spmg01:spmg02
group RemoteCopy
If an operand is used more than one time in a command file, the last operand
takes effect. In the example below, the first group subcommand does not
take effect, but the second group subcommand takes effect:
group PortWWN CL1-A:CL1-B
group PortWWN CL2-A:CL2-B
Using the Export Tool
Hitachi Universal Storage Platform V/VM Hitachi Performance Manager User’s Guide
7-39
Operands
PhyPGU[Short|Long]U[[parity-group-id]:[parity-group-id]][U…]
Use this operand when you want to export statistics about parity group
usage rates, which are displayed in the Physical tab of the Performance
Management window. When statistics are exported to a ZIP file, the file
name will be PhyPG_dat.ZIP. For details on the statistics exported by this
operand, see Table 7-2.
You can use the Short or Long option to select the storing period of the
monitoring data to be exported. If you specify Short, the exported file will
contain statistics in a short range for up to 15 days. If you specify Long,
the exported file will contain statistics in a long range for up to three
months (i.e., up to 93 days). If neither Short nor Long is specified,
statistics in both the short and long range are exported.
When you specify variables parity-group-id, you can narrow the range of
parity groups whose monitoring data are to be exported. parity-group-id is
a parity group ID. The colon (:) indicates a range. For example, 1-1:1-5
indicates parity groups from 1-1 to 1-5.
Ensure that the parity-group-id value on the left of the colon is smaller
than the parity-group-id value on the right of the colon. For example, you
can specify PhyPG 1-1:1-5, but you cannot specify PhyPG 1-5:1-1. Also,
you can specify PhyPG 1-5:2-1, but you cannot specify PhyPG 2-1:1-5.
If parity-group-id is not specified, the monitoring data of all the parity
groups will be exported.
PhyLDEVU[Short|Long]U[[parity-group-id]:[parity-group-id]][U…]
Use this operand when you want to export statistics about volume usage
rates, which are displayed in the Physical tab of the Performance
Management window. When statistics are exported to a ZIP file, the file
name will be PhyLDEV_dat.ZIP. For details on the statistics exported by
this operand, see Table 7-2.
You can use the Short or Long option to select the storing period of the
monitoring data to be exported. If you specify Short, the exported file will
contain statistics in short range for up to 15 days. If you specify Long, the
exported file will contain statistics in long range for up to three months (i.e.,
up to 93 days). If neither Short nor Long is specified, statistics in both the
short and long range are exported.
When you specify variables parity-group-id, you can narrow the range of
parity groups whose monitoring data are to be exported. parity-group-id is
a parity group ID. The colon (:) indicates a range. For example, 1-1:1-5
indicates parity groups from 1-1 to 1-5.
Ensure that the parity-group-id value on the left of the colon is smaller
than the parity-group-id value on the right of the colon. For example, you
can specify PhyLDEV 1-1:1-5, but you cannot specify PhyLDEV 1-5:1-1.
Also, you can specify PhyLDEV 1-5:2-1, but you cannot specify
PhyLDEV 2-1:1-5.
7-40
Using the Export Tool
Hitachi Universal Storage Platform V/VM Hitachi Performance Manager User’s Guide
If parity-group-id is not specified, the monitoring data of all the volumes
will be exported.
PhyExGU[[exg-id]:[exg-id]][U…]
Use this operand when you want to export statistics about external volume
groups, which are displayed in the Physical tab of the Performance
Management window. When statistics are exported to a ZIP file, the file
name will be PhyExG_dat.ZIP. For details on the statistics exported by this
operand, see Table 7-2.
When you specify variables exg-id, you can narrow the range of external
volume groups whose monitoring data are to be exported. exg-id is an ID
of an external volume group. The colon (:) indicates a range. For example,
E1-1:E1-5 indicates external volume groups from E1-1 to E1-5.
Ensure that the exg-id value on the left of the colon is smaller than the
exg-id value on the right of the colon. For example, you can specify
PhyExG E1-1:E1-5, but you cannot specify PhyExG E1-5:E1-1. Also, you can
specify PhyExG E1-5:E2-1, but you cannot specify PhyExG E2-1:E1-5.
If exg-id is not specified, the monitoring data of all the external volume
groups will be exported.
PhyExLDEVU[[exg-id]:[exg-id]][U…]
Use this operand when you want to export statistics about volumes in
external volume groups, which are displayed in the Physical tab of the
Performance Management window. When statistics are exported to a
ZIP file, the file name will be PhyExLDEV_dat.ZIP. For details on the
statistics exported by this operand, see Table 7-2.
When you specify variables exg-id, you can narrow the range of external
volume groups whose monitoring data are to be exported. exg-id is an ID
of an external volume group. The colon (:) indicates a range. For example,
E1-1:E1-5 indicates external volume groups from E1-1 to E1-5.
Ensure that the exg-id value on the left of the colon is smaller than the
exg-id value on the right of the colon. For example, you can specify
PhyExLDEV E1-1:E1-5, but you cannot specify PhyExLDEV E1-5:E1-1. Also,
you can specify PhyExLDEV E1-5:E2-1, but you cannot specify
PhyExLDEV E2-1:E1-5.
If exg-id is not specified, the monitoring data of all the external volumes
will be exported.
PhyProcU[Short|Long]
Use this operand when you want to export the following statistics, which
are displayed in the Physical tab of the Performance Management
window:
–
Usage rates of channel processors
–
Usage rates of disk processors
–
Usage rates of DRRs (data recovery and reconstruction processors)
Using the Export Tool
Hitachi Universal Storage Platform V/VM Hitachi Performance Manager User’s Guide
7-41
When statistics are exported to a ZIP file, the file name will be
PhyProc_dat.ZIP. For details on the statistics exported by this operand, see
Table 7-2.
You can use the Short or Long option to select the storing period of the
monitoring data to be exported. If you specify Short, the exported file will
contain statistics in short range for up to 15 days. If you specify Long, the
exported file will contain statistics in long range for up to three months (i.e.,
up to 93 days). If neither Short nor Long is specified, statistics in both the
short and long range are exported.
PhyCSWU[Short|Long]
Use this operand when you want to export the following statistics, which
are displayed in the Physical tab of the Performance Management
window:
–
Usage rates of access paths between channel adapters and cache
memories
–
Usage rates of access paths between disk adapters and cache memories
–
Usage rates of access paths between channel adapters and the shared
memory
–
Usage rates of access paths between disk adapters and the shared
memory
–
Usage rates of access paths between cache switches and cache
memories
–
Write pending rates
When statistics are exported to a ZIP file, the file name will be
PhyCSW_dat.ZIP. For details on the statistics exported by this operand, see
Table 7-2.
You can use the Short or Long option to select the storing period of the
monitoring data to be exported. If you specify Short, the exported file will
contain statistics in short range for up to 15 days. If you specify Long, the
exported file will contain statistics in long range for up to three months (i.e.,
up to 93 days). If neither Short nor Long is specified, statistics in both the
short and long range are exported.
7-42
Using the Export Tool
Hitachi Universal Storage Platform V/VM Hitachi Performance Manager User’s Guide
PGU[[parity-group-id|V-VOL-group-id|exg-id]:
[parity-group-id|V-VOL-group-id|exg-id]][U…]
Use this operand when you want to export statistics about parity groups,
external volume groups, or V-VOL groups which are displayed in the LDEV
tab of the Performance Management window. When statistics are
exported to a ZIP file, the file name will be PG_dat.ZIP. For details on the
statistics exported by this operand, see Table 7-3.
When you specify variables parity-group-id, exg-id, or V-VOL-group-id, you
can narrow the range of parity groups, external volume groups, or V-VOL
groups, whose monitoring data are to be exported. parity-group-id is a
parity group ID. exg-id is an ID of an external volume group. V-VOL-groupid is V-VOL group ID. The colon (:) indicates a range. For example, 1-1:1-5
indicates parity groups from 1-1 to 1-5. E1-1:E1-5 indicates external
volume groups from E1-1 to E1-5. V1-1:V5-1 indicates V-VOL groups from
V1-1 to V5-1. X1-1:X5-1 indicates V-VOL groups from X1-1 to X5-1.
Ensure that the parity-group-id, exg-id, or V-VOL-group-id value on the left
of the colon is smaller than the parity-group-id, exg-id, or V-VOL-group-id
value on the right of the colon. For example, you can specify PG 1-1:1-5,
but you cannot specify PG 1-5:1-1. Also, you can specify PG 1-5:2-1, but
you cannot specify PG 2-1:1-5.
If neither of parity-group-id, exg-id, nor V-VOL-group-id is specified, the
monitoring data of all the parity groups, external volume groups, and VVOL group will be exported.
LDEVU[[parity-group-id|V-VOL-group-id|exg-id]:
[parity-group-id|V-VOL-group-id|exg-id]][U…]
Use this operand when you want to export statistics about volumes, which
are displayed in the LDEV tab of the Performance Management window.
When statistics are exported to a ZIP file, multiple ZIP files whose names
are beginning with LDEV_ will be output. For details on the statistics
exported by this operand, see
Using the Export Tool
Hitachi Universal Storage Platform V/VM Hitachi Performance Manager User’s Guide
7-43
Table 7-5.
When you specify variables parity-group-id, exg-id, or V-VOL-group-id, you
can narrow the range of parity groups, external volume groups, or V-VOL
groups, whose monitoring data are to be exported. parity-group-id is a
parity group ID. exg-id is an ID of an external volume group. V-VOL-groupid is V-VOL group ID. The colon (:) indicates a range. For example, 1-1:1-5
indicates parity groups from 1-1 to 1-5. E1-1:E1-5 indicates external
volume groups from E1-1 to E1-5. V1-1:V5-1 indicates V-VOL groups from
V1-1 to V5-1. X1-1:X5-1 indicates V-VOL groups from X1-1 to X5-1.
Ensure that the parity-group-id, exg-id, or V-VOL-group-id value on the left
of the colon is smaller than the parity-group-id, exg-id, or V-VOL-group-id
value on the right of the colon. For example, you can specify LDEV 1-1:1-5,
but you cannot specify LDEV 1-5:1-1. Also, you can specify LDEV 1-5:2-1,
but you cannot specify LDEV 2-1:1-5.
If neither of parity-group-id, exg-id, nor V-VOL-group-id is specified, the
monitoring data of all the volumes (including external volumes and V-VOL
groups) will be exported.
PortU[[port-name]:[port-name]][U…]
Use this operand when you want to export port statistics, which are
displayed in the Port-LUN tab of the Performance Management window.
When statistics are exported in a ZIP file, the file name will be Port_dat.ZIP.
For details on the statistics exported by this operand, see
7-44
Using the Export Tool
Hitachi Universal Storage Platform V/VM Hitachi Performance Manager User’s Guide
Table 7-5.
When you specify variables port-name, you can narrow the range of ports
whose monitoring data are to be exported. port-name is a port name. The
colon (:) indicates a range. For example, CL3-a:CL3-c indicates ports from
CL3-a to CL3-c.
Ensure that the port-name value on the left of the colon is smaller than the
port-name value on the right of the colon. The smallest port-name value is
CL1-A and the largest port-name value is CL4-r. The following formula
illustrates which value is smaller than which value:
CL1-A < CL1-B < … < CL2-A < CL2-B < … < CL3-a < CL3-b < … < CL4a < … < CL4-r
For example, you can specify Port CL1-C:CL2-A, but you cannot specify
Port CL2-A:CL1-C. Also, you can specify Port CL3-a:CL3-c, but you cannot
specify Port CL3-c:CL3-a.
If port-name is not specified, the monitoring data of all the ports will be
exported.
PortWWNU[[port-name]:[port-name]][U…]
Use this operand when you want to export statistics about host bus
adapters (WWNs) connected to ports, which are displayed in the Port-LUN
tab of the Performance Management window. When statistics are
exported in a ZIP file, the file name will be PortWWN_dat.ZIP. For details
on the statistics exported by this operand, see Table 7-6.
When you specify variables port-name, you can narrow the range of ports
whose monitoring data are to be exported. port-name is a port name. The
colon (:) indicates a range. For example, CL3-a:CL3-c indicates ports from
CL3-a to CL3-c.
Ensure that the port-name value on the left of the colon is smaller than the
port-name value on the right of the colon. The smallest port-name value is
CL1-A and the largest port-name value is CL4-r. The following formula
illustrates which value is smaller than which value:
CL1-A < CL1-B < … < CL2-A < CL2-B < … < CL3-a < CL3-b < … < CL4a < … < CL4-r
For example, you can specify PortWWN CL1-C:CL2-A, but you cannot specify
PortWWN CL2-A:CL1-C. Also, you can specify PortWWN CL3-a:CL3-c, but you
cannot specify PortWWN CL3-c:CL3-a.
If port-name is not specified, the monitoring data of all the host bus
adapters will be exported.
LUU[[port-name.host-group-id]:[port-name.host-group-id]][U…]
Use this operand when you want to export statistics about LU paths, which
are displayed in the Port-LUN tab of the Performance Management
window. When statistics are exported in a ZIP file, the file name will be
LU_dat.ZIP. For details on the statistics exported by this operand, see
Using the Export Tool
Hitachi Universal Storage Platform V/VM Hitachi Performance Manager User’s Guide
7-45
Table 7-7.
When you specify variables port-name.host-group-id, you can narrow the
range of LU paths whose monitoring data are to be exported. port-name is
a port name. host-group-id is the ID of a host group (that is, a host
storage domain). The host group (host storage domain) ID must be a
hexadecimal numeral. The colon (:) indicates a range. For example,
CL1-C.01:CL1-C.03 indicates the range from the host group #01 of the
CL1-C port to the host group #03 of the CL1-C port.
Ensure that the value on the left of the colon is smaller than the value on
the right of the colon. The smallest port-name value is CL1-A and the
largest port-name value is CL4-r. The following formula illustrates which
port-name value is smaller than which port-name value:
CL1-A < CL1-B < … < CL2-A < CL2-B < … < CL3-a < CL3-b < … < CL4a < … < CL4-r
For example, you can specify LU CL1-C.01:CL2-A.01, but you cannot
specify LU CL2-A.01:CL1-C.01. Also, you can specify
LU CL1-C.01:CL1-C.03, but you cannot specify LU CL1-C.03:CL1-C.01.
If port-name.host-group-id is not specified, the monitoring data of all the
LU paths will be exported.
PPCGU[[SPM-group-name]:[SPM-group-name]][U…]
Use this operand when you want to export statistics about SPM groups,
which are displayed in the WWN tab of the Performance Management
window. When statistics are exported in a ZIP file, the file name will be
PPCG_dat.ZIP. For details on the statistics exported by this operand, see
Table 7-8.
When you specify variables SPM-group-name, you can narrow the range of
SPM groups whose monitoring data are to be exported. SPM-group-name is
the name of an SPM group. If the name includes any non-alphanumeric
character, the name must be enclosed by double quotation marks ("). The
colon (:) indicates a range. For example, Grp01:Grp03 indicates a range of
SPM groups from Grp01 to Grp03.
Ensure that the SPM-group-name value on the left of the colon is smaller
than the SPM-group-name value on the right of the colon. Numerals are
smaller than letters and lowercase letters are smaller than uppercase
letters. In the following formulae, values are arranged so that smaller
values are on the left and larger values are on the right:
–
0 < 1 < 2 < …< 9 < a < b < …< z < A < B < … < Z
–
cygnus < raid < Cancer < Pisces < RAID < RAID5
Regardless of whether you specify or omit SPM group names, the exported
CSV files contain statistics about host bus adapters that do not belong to
any SPM groups. The exported CSV files use the heading named Not
Grouped to indicate statistics about these host bus adapters.
If SPM-group-name is not specified, the monitoring data of all the SPM
groups will be exported.
7-46
Using the Export Tool
Hitachi Universal Storage Platform V/VM Hitachi Performance Manager User’s Guide
PPCGWWNU[[SPM-group-name]:[SPM-group-name]][U…]
Use this operand when you want to export statistics about host bus
adapters (WWNs) belonging to SPM groups, which are displayed in the
WWN tab of the Performance Management window. When statistics are
exported in a ZIP file, the file name will be PPCGWWN_dat.ZIP. For details
on the statistics exported by this operand, see
Using the Export Tool
Hitachi Universal Storage Platform V/VM Hitachi Performance Manager User’s Guide
7-47
Table 7-9.
When you specify variables SPM-group-name, you can narrow the range of
SPM groups whose monitoring data are to be exported. SPM-group-name is
the name of an SPM group. If the name includes any non-alphanumeric
character, the name must be enclosed by double quotation marks ("). The
colon (:) indicates a range. For example, Grp01:Grp03 indicates a range of
SPM groups from Grp01 to Grp03.
Ensure that the SPM-group-name value on the left of the colon is smaller
than the SPM-group-name value on the right of the colon. Numerals are
smaller than letters and lowercase letters are smaller than uppercase
letters. In the following formulae, values are arranged so that smaller
values are on the left and larger values are on the right:
–
0 < 1 < 2 < …< 9 < a < b < …< z < A < B < … < Z
–
cygnus < raid < Cancer < Pisces < RAID < RAID5
If SPM-group-name is not specified, the monitoring data of all the host bus
adapters will be exported.
RemoteCopy
Use this operand when you want to export statistics about remote copy
operations which are displayed in the TC Monitor window and the TCz
Monitor window. By using this operand, you can export monitoring data
about remote copy operations performed by TrueCopy and TrueCopy for
IBM z/OS in the whole volumes. When statistics are exported to a ZIP file,
the file name will be RemoteCopy_dat.ZIP. For details on the statistics
exported by this operand, see Table 7-10.
RCLUU[[port-name.host-group-id]:[port-name.host-group-id]][U…]
Use this operand when you want to export statistics about remote copy
operations which are displayed in the TC Monitor window and the TCz
Monitor window. By using this operand, you can export monitoring data
about remote copy operations performed by TrueCopy and TrueCopy for
IBM z/OS at each volume (LU). When statistics are exported to a ZIP file,
the file name will be RCLU_dat.ZIP. For details on the statistics exported by
this operand, see Table 7-11.
When you specify variables port-name.host-group-id, you can narrow the
range of LU paths whose monitoring data are to be exported. port-name is
a port name. host-group-id is the ID of a host group. The host group ID
must be a hexadecimal numeral. The colon (:) indicates a range. For
example, CL1-C.01:CL1-C.03 indicates the range from the host group #01
of the CL1-C port to the host group #03 of the CL1-C port.
Ensure that the value on the left of the colon is smaller than the value on
the right of the colon. The smallest port-name value is CL1-A and the
largest port-name value is CL4-r. The following formula illustrates which
port-name value is smaller than which port-name value:
CL1-A < CL1-B < … < CL2-A < CL2-B < … < CL3-a < CL3-b < … < CL4a < … < CL4-r
7-48
Using the Export Tool
Hitachi Universal Storage Platform V/VM Hitachi Performance Manager User’s Guide
For example, you can specify RCLU CL1-C.01:CL2-A.01, but you cannot
specify RCLU CL2-A.01:CL1-C.01. Also, you can specify
RCLU CL1-C.01:CL1-C.03, but you cannot specify RCLU CL1-C.03:CL1-C.01.
If port-name.host-group-id is not specified, the monitoring data of all the
volumes (LUs) will be exported.
RCLDEVU[[LDKC-CU-id]:[LDKC-CU-id]][U…]|
Use this operand when you want to export statistics about remote copy
operations which are displayed in the TC Monitor window and the TCz
Monitor window. By using this operand, you can export monitoring data
about remote copy operations performed by TrueCopy and TrueCopy for
IBM z/OS at volumes controlled by each CU. When statistics are exported
to a ZIP file, multiple ZIP files whose names are beginning with RCLDEV_
will be output. For details on the statistics exported by this operand, see
Using the Export Tool
Hitachi Universal Storage Platform V/VM Hitachi Performance Manager User’s Guide
7-49
Table 7-12.
When you specify variables LDKC-CU-id, you can narrow the range of
LDKC:CUs that control the volumes whose monitoring data are to be
exported. LDKC-CU-id is an ID of a LDKC:CU. The colon (:) indicates a
range. For example, 000:105 indicates LDKC:CUs from 00:00 to 01:05.
Ensure that the LDKC-CU-id value on the left of the colon is smaller than
the LDKC-CU-id value on the right of the colon. For example, you can
specify RCLDEV 000:105, but you cannot specify RCLDEV 105:000.
If LDKC-CU-id is not specified, the monitoring data of all the volumes will
be exported.
RCCLPR
Use this operand when you want to export statistics about remote copy
operations which are displayed in the TC Monitor window and the TCz
Monitor window. By using this operand, you can export monitoring data
about remote copy operations performed by TrueCopy and TrueCopy for
IBM z/OS at each CLPR. When statistics are exported to a ZIP file, the file
name will be RCCLPR_dat.ZIP. For details on the statistics exported by this
operand, see Table 7-13.
Note: Monitoring data are grouped by SLPR, and are exported per CLPR. If
there are two SLPRs that are SLPR0 (corresponding to CLPR0, and CLPR2) and
SLPR1 (corresponding to CLPR1), those CLPRs are arranged as follows:
CLPR0,CLPR2,CLPR1.
UniversalReplicator
Use this operand when you want to export statistics about remote copy
operations which are displayed in the UR Monitor window and the URz
Monitor window. By using this operand, you can export monitoring data
about remote copy operations performed by Universal Replicator and
Universal Replicator for IBM z/OS in the whole volume. When statistics are
exported to a ZIP file, the file name will be UniversalReplicator.ZIP. For
details on the statistics exported by this operand, see Table 7-14.
URJNLU[[JNL-group-id]:[JNL-group-id]][U…]
Use this operand when you want to export statistics about remote copy
operations which are displayed in the UR Monitor window and the URz
Monitor window. By using this operand, you can export monitoring data
about remote copy operations performed by Universal Replicator and
Universal Replicator for IBM z/OS at each journal group. When statistics
are exported to a ZIP file, the file name will be URJNL_dat.ZIP. For details
on the statistics exported by this operand, see Table 7-15.
When you specify variables JNL-group-id, you can narrow the range of
journal groups whose monitoring data are to be exported. JNL-group-id is a
journal group number. The colon (:) indicates a range. For example, 00:05
indicates journal groups from 00 to 05.
7-50
Using the Export Tool
Hitachi Universal Storage Platform V/VM Hitachi Performance Manager User’s Guide
Ensure that the JNL-group-id value on the left of the colon is smaller than
the JNL-group-id value on the right of the colon. For example, you can
specify URJNL 00:05, but you cannot specify URJNL 05:00.
If JNL-group-id is not specified, the monitoring data of all the journal
volumes will be exported.
URLUU[[port-name.host-group-id]:[port-name.host-group-id]][U…]
Use this operand when you want to export statistics about remote copy
operations which are displayed in the UR Monitor window and the URz
Monitor window. By using this operand, you can export monitoring data
about remote copy operations performed by Universal Replicator and
Universal Replicator for IBM z/OS at each volume(LU). When statistics are
exported to a ZIP file, the file name will be URLU_dat.ZIP. For details on
the statistics exported by this operand, see
Using the Export Tool
Hitachi Universal Storage Platform V/VM Hitachi Performance Manager User’s Guide
7-51
Table 7-16.
When you specify variables port-name.host-group-id, you can narrow the
range of LU paths whose monitoring data are to be exported. port-name is
a port name. host-group-id is the ID of a host group. The host group ID
must be a hexadecimal numeral. The colon (:) indicates a range. For
example, CL1-C.01:CL1-C.03 indicates the range from the host group #01
of the CL1-C port to the host group #03 of the CL1-C port.
Ensure that the value on the left of the colon is smaller than the value on
the right of the colon. The smallest port-name value is CL1-A and the
largest port-name value is CL4-r. The following formula illustrates which
port-name value is smaller than which port-name value:
CL1-A < CL1-B < … < CL2-A < CL2-B < … < CL3-a < CL3-b < … < CL4a < … < CL4-r
For example, you can specify URLU CL1-C.01:CL2-A.01, but you cannot
specify URLU CL2-A.01:CL1-C.01. Also, you can specify
URLU CL1-C.01:CL1-C.03, but you cannot specify URLU CL1-C.03:CL1-C.01.
If port-name.host-group-id is not specified, the monitoring data of all the
volumes (LUs) will be exported.
URLDEVU[[LDKC-CU-id]:[LDKC-CU-id]][U…]
Use this operand when you want to export statistics about remote copy
operations which are displayed in the UR Monitor window and the URz
Monitor window. By using this operand, you can export monitoring data
about remote copy operations performed by Universal Replicator and
Universal Replicator for IBM z/OS at volumes controlled by each CU. When
statistics are exported to a ZIP file, multiple ZIP files whose names are
beginning with URLDEV_ will be output. For details on the statistics exported
by this operand, see Table 7-17.
When you specify variables LDKC-CU-id, you can narrow the range of
LDKC:CUs that control the volumes whose monitoring data are to be
exported. LDKC-CU-id is an ID of a LDKC:CU. The colon (:) indicates a
range. For example, 000:105 indicates LDKC:CUs from 00:00 to 01:05.
Ensure that the LDKC-CU-id value on the left of the colon is smaller than
the LDKC-CU-id value on the right of the colon. For example, you can
specify URLDEV 000:105, but you cannot specify URLDEV 105:000.
If LDKC-CU-id is not specified, the monitoring data of all the volumes will
be exported.
Examples
The following example exports statistics about host bus adapters and SPM
groups:
group PortWWN
group PPCG
7-52
Using the Export Tool
Hitachi Universal Storage Platform V/VM Hitachi Performance Manager User’s Guide
The following example exports statistics about three ports (CL1-A, CL1-B, and
CL1-C):
group Port CL1-A:CL1-C
The following example exports statistics about six ports (CL1-A to CL1-C, and
CL2-A to CL2-C)
group Port CL1-A:CL1-C CL2-A:CL2-C
The following example exports statistics about the parity group 1-3:
group PG 1-3:1-3
The following example exports statistics about the parity group 1-3 and other
parity groups whose ID is larger than 1-3 (for example, 1-4 and 1-5):
group PG 1-3:
The following example exports statistics about the external volume groups E11 to E1-5:
group PG E1-1:E1-5
The following example exports statistics about the parity group 1-3 and other
parity groups whose ID is smaller than 1-3 (for example, 1-1 and 1-2):
group LDEV:1-3
The following example exports statistics about LU paths for the host group
(host storage domain) ID 01 for the port CL1-A:
group LU CL1-A.01:CL1-A.01
Using the Export Tool
Hitachi Universal Storage Platform V/VM Hitachi Performance Manager User’s Guide
7-53
short-range Subcommand
Syntax
short-rangeU[[yyyyMMddhhmm][{+|-}hhmm]:[yyyyMMddhhmm][{+|}hhmm]]
Description
The short-range subcommand enables you to specify a term of monitoring
data to be exported into files. Use this subcommand when you want to narrow
the export-target term within the stored data.
The short-range subcommand is valid for monitoring data in short range. The
monitoring data in short range is the contents displayed in the following
windows:
•
The Performance Management window with selecting short-range as the
storing period
•
The TC Monitor and TCz Monitor windows
•
The UR Monitor and URz Monitor windows
All the monitoring items are stored in short range. Therefore, you can use the
short-range subcommand whichever operand you specify to the group
subcommand. If you run the Export Tool without specifying the short-range
subcommand, the data stored in the whole monitoring term will be exported.
The login subcommand must execute before the short-range subcommand
executes.
Operands
The value on the left of the colon (:) specifies the starting time of the period.
The value on the right of the colon specifies the ending time of the period.
Specify the term within "Short Range From XXX To XXX" which is output by
the show subcommand.
If no value is specified on the left of the colon, the starting time for collecting
monitoring data is assumed. If no value is specified on the right of the colon,
the ending time for collecting monitoring data is assumed. The starting and
ending times for colleting monitoring data are displayed in the Monitoring
Term area in the Performance Management window.
7-54
Using the Export Tool
Hitachi Universal Storage Platform V/VM Hitachi Performance Manager User’s Guide
Starting time for
collecting statistics
Figure 7-10
Ending time for
collecting statistics
Starting and Ending Time for Collecting Monitoring Data
yyyyMMddhhmm
yyyyMMdd indicates the year, the month, and the day. hhmm indicates the
hour and the minute.
If yyyyMMddhhmm is omitted on the left of the colon, the starting time for
collecting monitoring data is assumed. If yyyyMMddhhmm is omitted on
the right of the colon, the ending time for collecting monitoring data is
assumed.
+hhmm
Adds time (hhmm) to yyyyMMddhhmm if yyyyMMddhhmm is specified. For
example, 200601230000+0130 indicates Jan. 23, 2006. 01:30.
Adds time to the starting time for collecting monitoring data, if
yyyyMMddhhmm is omitted.
-hhmm
Subtracts time (hhmm) from yyyyMMddhhmm if yyyyMMddhhmm is
specified. For example, 200601230000-0130 indicates Jan. 22, 2006.
22:30.
Subtracts time from the ending time for collecting monitoring data, if
yyyyMMddhhmm is omitted.
If the last two digit of the time on the left or right of the colon (:) is not a
multiple of the sampling interval, the time will automatically be changed so
that the last two digits is a multiple of the sampling interval. If this change
occurs to the time on the left of the colon, the time will be smaller than the
original time. If this change occurs to the time on the right of the colon,
the time will be larger than the original time. The following are the
examples:
–
If the time on the left is 10:15, the time on the right is 20:30, and
the sampling interval is 10 minutes:
The time on the left will be changed to 10:10 because the last two
digits of the time is not a multiple of 10 minutes. The time on the right
will remain unchanged because the last two digits of the time is a
multiple of 10 minutes.
Using the Export Tool
Hitachi Universal Storage Platform V/VM Hitachi Performance Manager User’s Guide
7-55
–
If the time on the left is 10:15, the time on the right is 20:30, and
the sampling interval is 7 minutes:
The time on the left will be changed to 10:14 because the last two
digits of the time is not a multiple of 7 minutes. The time on the right
will be changed to 20:35 because of the same reason.
Examples
The examples below assume that:
•
the starting time for collecting monitoring data is Jan. 1, 2006, 00:00,
•
the ending time for collecting monitoring data is Jan. 2, 2006, 00:00.
short-range 200601010930:200601011730
The Export Tool saves monitoring data within the range of Jan. 1, 9:3017:30.
short-range 200601010930:
The Export Tool saves monitoring data within the range of Jan. 1, 9:30 to
Jan. 2, 00:00.
shortrange:200601011730
The Export Tool saves monitoring data within the range of Jan. 1, 0:0017:30.
short-range +0001:
The Export Tool saves monitoring data within the range of Jan. 1, 0:01 to
Jan. 2, 00:00.
short-range -0001:
The Export Tool saves monitoring data within the range of Jan. 1, 23:59 to
Jan. 2, 00:00.
shortrange:+0001
The Export Tool saves monitoring data within the range of Jan. 1, 0:0000:01.
shortrange:-0001
The Export Tool saves monitoring data within the range of Jan. 1, 0:0023:59.
short-range +0101:-0101
The Export Tool saves monitoring data within the range of Jan. 1, 1:0122:59.
short-range 200601010900+0130:200601011700-0130
The Export Tool saves monitoring data within the range of Jan. 1, 10:3015:30.
7-56
Using the Export Tool
Hitachi Universal Storage Platform V/VM Hitachi Performance Manager User’s Guide
short-range 200601010900-0130:200601011700+0130
The Export Tool saves monitoring data within the range of Jan. 1, 7:3018:30.
short-range 200601010900-0130:
The Export Tool saves monitoring data within the range of Jan. 1, 7:30 to
Jan. 2, 00:00.
Using the Export Tool
Hitachi Universal Storage Platform V/VM Hitachi Performance Manager User’s Guide
7-57
long-range Subcommand
Syntax
long-rangeU[[yyyyMMddhhmm][{+|-}ddhhmm]:[yyyyMMddhhmm][{+|}ddhhmm]]
Description
The long-range subcommand enables you to specify a term of monitoring
data to be exported into files. Use this subcommand when you want to narrow
the export-target term within the stored data.
The long-range subcommand is valid for monitoring data in long range. The
monitoring data in long range is the contents displayed in the Physical tab of
the Performance Management window with selecting long-range as the
storing period. The monitoring items whose data can be stored in long range
are limited. Table 7-24 shows the monitoring items to which the long-range
subcommand can be applied, and also shows the operands to export those
monitoring items.
Table 7-24
Monitoring Items To Which the long-range Subcommand Can
be Applied
Monitoring Data
Operands of the group subcommand
Usage statistics about parity groups
PhyPG Long
Usage statistics about volumes
PhyLDEV Long
Usage statistics about channel processors, disk processors,
and data recovery and reconstruction processors
PhyProc Long
Usage statistics about access paths and write pending rate
PhyCSW Long
If you run the Export Tool without specifying the long-range subcommand,
the data stored in the whole monitoring term will be exported.
The login subcommand must execute before the long-range subcommand
executes.
Operands
The value on the left of the colon (:) specifies the starting time of the period.
The value on the right of the colon specifies the ending time of the period.
Specify the term within "Long Range From XXX To XXX" which is output by
the show subcommand.
7-58
Using the Export Tool
Hitachi Universal Storage Platform V/VM Hitachi Performance Manager User’s Guide
If no value is specified on the left of the colon, the starting time for collecting
monitoring data is assumed. If no value is specified on the right of the colon,
the ending time for collecting monitoring data is assumed. The starting and
ending times for colleting monitoring data are displayed in the Monitoring
Term area in the Performance Management window.
Starting time for
collecting statistics
Figure 7-11
Ending time for
collecting statistics
Starting and Ending Time for Collecting Monitoring Data
yyyyMMddhhmm
yyyyMMdd indicates the year, the month, and the day. hhmm indicates the
hour and the minute.
If yyyyMMddhhmm is omitted on the left of the colon, the starting time for
collecting monitoring data is assumed. If yyyyMMddhhmm is omitted on
the right of the colon, the ending time for collecting monitoring data is
assumed.
+ddhhmm
Adds time (ddhhmm) to yyyyMMddhhmm if yyyyMMddhhmm is specified.
For example, 200601120000+010130 indicates Jan. 13, 2006. 01:30.
Adds time to the starting time for collecting monitoring data, if
yyyyMMddhhmm is omitted.
-ddhhmm
Subtracts time (ddhhmm) from yyyyMMddhhmm if yyyyMMddhhmm is
specified. For example, 200601120000-010130 indicates Jan. 10, 2006.
22:30.
Subtracts time from the ending time for collecting monitoring data, if
yyyyMMddhhmm is omitted.
Ensure that mm is 00, 15, 30, or 45. If you do not specify mm in this way,
the value on the left of the colon (:) will be rounded down to one of the
four values. Also, the value on the right of the colon will be rounded up to
one of the four values. For example, if you specify
200601010013:200601010048, the specified value is regarded as
200601010000:200601010100.
Using the Export Tool
Hitachi Universal Storage Platform V/VM Hitachi Performance Manager User’s Guide
7-59
Examples
The examples below assume that:
•
the starting time for collecting monitoring data is Jan. 1, 2006, 00:00,
•
the ending time for collecting monitoring data is Jan. 2, 2006, 00:00.
long-range 200601010930:200601011730
The Export Tool saves monitoring data within the range of Jan. 1, 9:3017:30.
long-range 200601010930:
The Export Tool saves monitoring data within the range of Jan. 1, 9:30 to
Jan. 2, 00:00.
longrange:200601011730
The Export Tool saves monitoring data within the range of Jan. 1, 0:0017:30.
long-range +000015:
The Export Tool saves monitoring data within the range of Jan. 1, 0:15 to
Jan. 2, 00:00.
long-range -000015:
The Export Tool saves monitoring data within the range of Jan. 1, 23:45 to
Jan. 2, 00:00.
longrange:+000015
The Export Tool saves monitoring data within the range of Jan. 1, 0:0000:15.
longrange:-000015
The Export Tool saves monitoring data within the range of Jan. 1, 0:0023:45.
long-range +000115:-000115
The Export Tool saves monitoring data within the range of Jan. 1, 1:1522:45.
long-range 200601010900+000130:200601011700-000130
The Export Tool saves monitoring data within the range of Jan. 1, 10:3015:30.
long-range 200601010900-000130:200601011700+000130
The Export Tool saves monitoring data within the range of Jan. 1, 7:3018:30.
long-range 200601010900-000130:
7-60
Using the Export Tool
Hitachi Universal Storage Platform V/VM Hitachi Performance Manager User’s Guide
The Export Tool saves monitoring data within the range of Jan. 1, 7:30 to
Jan. 2, 00:00.
Using the Export Tool
Hitachi Universal Storage Platform V/VM Hitachi Performance Manager User’s Guide
7-61
outpath Subcommand
Syntax
outpathU[path]
Description
The outpath subcommand specifies the directory to which monitoring data
will be exported.
Operands
path
Specifies the directory in which files will be saved.
If the directory includes any non-alphanumeric character, the directory
must be enclosed by double quotation marks ("). If you want to specify a
back slash (\) in the character string enclosed by double quotation marks,
repeat the back slash twice such as \\.
If the specified directory does not exist, this subcommand creates a
directory that has the specified name.
If this operand is omitted, the current directory is assumed.
Examples
The following example saves files in the directory C:\Project\out in a
Windows computer:
outpath "C:\\Project\\out"
The following example saves files in the out directory in the current directory:
outpath out
7-62
Using the Export Tool
Hitachi Universal Storage Platform V/VM Hitachi Performance Manager User’s Guide
option Subcommand
Syntax
optionU[compress|nocompress]U[ask|clear|noclear]
Description
The option subcommand specifies the following:
•
whether to compress monitoring data in ZIP files
•
whether to overwrite or delete existing files and directories when saving
monitoring data in files
Operands
The two operands below specify whether to compress CSV files into ZIP files. If
none of these operands is specified, compress is assumed:
compress
Compresses data in ZIP files. To extract CSV files out of a ZIP file, you
will need to decompress the ZIP file.
nocompress
Does not compress data in ZIP files and saves data in CSV files.
The three operands below specify whether to overwrite or delete an existing
file or directory when the Export Tool saves files. If none of these operands is
specified, ask is assumed:
ask
Displays a message that asks whether to delete existing files or
directories.
clear
Deletes existing files and directories and then saves monitoring data in
files.
noclear
Overwrites existing files and directories.
Example
The following example saves monitoring data in CSV files, not in ZIP files:
option nocompress
Using the Export Tool
Hitachi Universal Storage Platform V/VM Hitachi Performance Manager User’s Guide
7-63
apply Subcommand
Syntax
apply
Description
The apply subcommand saves monitoring data specified by the group
subcommand into files.
The login subcommand must execute before the apply subcommand executes.
The apply subcommand does nothing if the group subcommand executes.
The settings made by the group subcommand will be reset when the apply
subcommand finishes.
set subcommand
Syntax
setU[switch={m|off}]
Description
The set subcommand starts or ends monitoring the storage system (i.e.,
starts or ends collecting performance statistics). The set subcommand also
specifies the gathering interval (interval of collecting statistics) in short range
monitoring.
If you want to use the set subcommand, you must use the login subcommand
(see login Subcommand) to log on to the SVP. Ensure that the set
subcommand executes immediately before the Export Tool finishes.
Executing the set subcommand generates an error in the following conditions:
•
Some other user is being logged onto the SVP in Modify mode.
•
Maintenance operations are being performed at the SVP.
If an error occurs, do the following:
7-64
•
Ensure that all the users who are logged onto the SVP are not in Modify
mode. If any user is logged on in Modify mode, ask the user to switch to
View mode.
•
Wait until maintenance operations finish at the SVP, so that the set
subcommand can execute.
Using the Export Tool
Hitachi Universal Storage Platform V/VM Hitachi Performance Manager User’s Guide
Notes:
• Your batch files can include script that should execute when an error
occurs. For information about writing such a script in your batch file, refer
to Notes in Running the Export Tool.
• When the set subcommand starts or ends the monitoring or changes the
gathering interval after the Performance Management window is started,
the contents displayed in the Performance Management window does
not change automatically in conjunction with the set subcommand
operation. To display the current monitoring status in the Performance
Management window, click File, and then Refresh on the menu bar of
the Storage Navigator main window.
• If you change the specified gathering interval during a monitoring, the
previously gathered monitoring data will be deleted.
Operands
switch={m|off}
To start monitoring, specify the gathering interval (interval of collecting
statistics) of monitoring data at m. Specify a value between 1 and 15 in
minutes. m is the gathering interval in short range monitoring by
Performance Monitor. The gathering interval in long range is fixed to 15
minutes.
To end monitoring, specify off.
If this operand is omitted, the set subcommand does not make settings for
starting or ending monitoring.
Examples
The following command file saves port statistics and then ends monitoring
ports:
svpip 158.214.135.57
login expusr passwd
show
group Port
short-range 200604010850:200604010910
apply
set switch=off
The following command file starts monitoring remote copy operations. The
sampling time interval is 10 minutes:
svpip 158.214.135.57
login expusr passwd
set switch=10
Using the Export Tool
Hitachi Universal Storage Platform V/VM Hitachi Performance Manager User’s Guide
7-65
help Subcommand
Syntax
help
Description
The help subcommand displays the online help for subcommands.
If you want to view the online help, It is recommended that you create a batch
file and a command file that are exclusively used for displaying the online help.
For detailed information, refer to Example below.
Example
In this example, a command file (cmdHelp.txt) and a batch file (runHelp.bat)
are created in the C:\export directory in a Windows computer:
•
Command file (c:\export\cmdHelp.txt):
help
•
Batch file (c:\export\runHelp.bat):
Java -classpath "./lib/JSanExport.jar;./lib/JSanRmiServerSx.jar" -Xmx536870912 Dmd.command=cmdHelp.txt
-Dmd.logpath=log sanproject.getmondat.RJMdMain pause In the above script, the " " symbol in this batch file example indicates the end
of a command line.
In this example, you must do one of the following to view the online Help:
•
Double-click runHelp.bat with the mouse.
•
Go to the c:\export directory at the command prompt, enter runHelp or
runHelp.bat and then press the <Enter> key.
Java Command for Exporting Data In Files
Syntax
JavaU-classpathUclass-pathUpropertyparametersUsanproject.getmondat.RJMdMain
Description
This Java command starts the Export Tool.
To start the Export Tool, you must write this Java command in your batch file
and then run the batch file.
7-66
Using the Export Tool
Hitachi Universal Storage Platform V/VM Hitachi Performance Manager User’s Guide
Operands
class-path
Specifies the path to the class file of the Export Tool.
The path must be enclosed in double quotation marks (").
property-parameters
You can specify the following parameters. At least you must specify Dmd.command.
–
-Dhttp.proxyHost=host-name-of-proxy-host, or
-Dhttp.proxyHost=IP-address-of-proxy-host
Specifies the host name or the IP address of a proxy host. You must
specify this parameter if the computer that runs the Export Tool
communicates with the SVP via a proxy host.
–
-Dhttp.proxyPort=port-number-of-proxy-host
Specifies the port number of a proxy host. You must specify this
parameter if the computer that runs the Export Tool communicates with
the SVP via a proxy host.
–
-Xmxmemory-size(bytes)
Specifies the size of memory to be used by JRE when the Export Tool is
being executed. You must specify this parameter. The memory size
must be 536870912, as shown in the Example later in this section. If an
installed memory size is smaller than the recommended memory size of
Storage Navigator PC, you must install more memory, before executing
the Export Tool.
If an installed memory size is larger than the recommended memory
size of Storage Navigator PC, you can specify a memory size larger than
as shown in the Example. However, to prevent lowering of execution
speed, you do not set oversized memory size.
–
-Dmd.command=path-to-command-file
Specifies the path to the command file
–
-Dmd.logpath=path-to-log-file
Specifies the path to log files. A log file will be created whenever the
Export Tool executes.
If this parameter is omitted, log files will be saved in the current
directory.
–
-Dmd.logfile=name-of-log-file
Specifies the name of the log file.
If this parameter is omitted, log files are named
exportMMddHHmmss.log. MMddHHmmss indicates when the Export
Tool executed. For example, the log file export0101091010.log
contains log information about Export Tool execution at Jan. 1,
09:10:10.
Using the Export Tool
Hitachi Universal Storage Platform V/VM Hitachi Performance Manager User’s Guide
7-67
Examples
The following example assumes that the computer running the Export Tool
communicates with the SVP via a proxy host. In this example, the host name
of the proxy host is Jupiter, and the port name of the proxy host is 8080:
Java -classpath "./lib/JSanExport.jar;./lib/JSanRmiServerSx.jar" -Dhttp.proxyHost=Jupiter
-Dhttp.proxyPort=8080 -Xmx536870912 -Dmd.command=command.txt -Dmd.logpath=log
sanproject.getmondat.RJMdMain In the following example, a log file named export.log will be created in the
log directory below the current directory when the Export Tool executes:
Java -classpath "./lib/JSanExport.jar;./lib/JSanRmiServerSx.jar" -Xmx536870912 Dmd.command=command.txt
-Dmd.logfile=export.log -Dmd.logpath=log sanproject.getmondat.RJMdMain In the above script, the " " symbol indicates the end of a command line.
7-68
Using the Export Tool
Hitachi Universal Storage Platform V/VM Hitachi Performance Manager User’s Guide
Causes of Invalid Monitoring Data
If the value of monitoring data in CSV files is less than 0 (zero), consider the
following causes:
Table 7-25
Causes of Invalid Monitoring Data
Invalid Values of
Monitoring Data
The monitoring data in the
CSV file includes "-1".
The monitoring data in the
CSV file includes "-3".
Probable Causes
The value "-1" indicates that Performance Monitor failed to obtain
monitoring data. Probable reasons are:
Performance Monitor attempted to obtain statistics when an
operation for rebooting the disk array is in progress.
Performance Monitor attempted to obtain statistics when a heavy
workload is imposed on the disk array.
There is no volume in a parity group.
Just after the CUs to be monitored were added, the Export Tool failed
to save files that contain monitoring data for all volumes or journal
volumes used by remote copy software (i.e., TrueCopy, TrueCopy for
z/OS, Universal Replicator, or Universal Replicator for z/OS). For
details about the files, see Table 7-10, Table 7-14, and Table 7-15.
If Disable is selected to stop monitoring in Monitoring Switch on
the Monitoring Options window and longrange is specified as the
gathering interval, the monitoring data for the period when
Performance Monitor stops monitoring is "-1".
If you added the CU during monitoring, specified longrange as the
gathering interval, and collected monitoring data, the value
"-1" is displayed as the monitoring data before the CU was added.
The value "-3" indicates that Performance Monitor failed to obtain
monitoring data for the following reason:
If IOPS is 0 (zero), the Response Time that is included in the
monitoring data for LUs, LDEVs, ports, WWNs, or external volumes is "3". Because IOPS is 0 (zero), the average response time becomes
invalid.
The monitoring data in the
CSV file includes "-4".
The value "-4" indicates that Performance Monitor failed to obtain
monitoring data for the following reason:
If the period for the monitoring data that is specified with the Export
Tool does not match the collecting period for monitoring data, the
Export Tool cannot collect the monitoring data. If data of SVP is updated
while the monitoring data is being collected, the collected monitoring
data near the collection start time is "-4".
Using the Export Tool
Hitachi Universal Storage Platform V/VM Hitachi Performance Manager User’s Guide
7-69
Invalid Values of
Monitoring Data
Probable Causes
The monitoring data in the
CSV file includes "-5".
When the CU number is not the monitoring target, Performance Monitor
cannot obtain monitoring data from the CU.
If the PG, LDEV, LU, RCLU, RCLDEV, URLU, or URLDEV operand is
specified, the value of the monitoring data is "-5". To solve this
problem, specify the CU as the monitoring target by using the
Monitoring Options window of Performance Monitor (not by using the
Export Tool). For details on specifying the CU as the monitoring target,
see Monitoring Options Window, and Table 4-4.
If the RemoteCopy, UniversalReplicator, or URJNL operand is specified,
the value "-5" is not output in the monitoring data though the CU
number is not the monitoring target. In this case, data on monitored
CUs are summed up and output into the CSV file.
7-70
Using the Export Tool
Hitachi Universal Storage Platform V/VM Hitachi Performance Manager User’s Guide
8
Troubleshooting
This chapter gives troubleshooting information on Performance Monitor, Server
Priority Manager, and Export Tool. For troubleshooting information on Storage
Navigator, see the Storage Navigator User’s Guide and Storage Navigator
Messages.
Troubleshooting Performance Monitor
Troubleshooting Server Priority Manager
Troubleshooting the Export Tool
Calling the Hitachi Data Systems Support Center
Troubleshooting
Hitachi Universal Storage Platform V/VM Hitachi Performance Manager User’s Guide
8-1
Troubleshooting Performance Monitor
•
When the WWN of a host bus adapter is displayed in red in the tree of the
WWN tab:
The host bus adapter (HBA) whose WWN is displayed in red is connected to
two or more ports, but the traffic between the HBA and some of the ports
are not monitored by Performance Monitor. When many-to-many
connections are established between HBAs and ports, you should make
sure that all the traffic between HBAs and ports is monitored. For details on
the measures, see Monitoring All Traffic between HBAs and Ports.
•
When a part of monitoring data is missing:
While displaying Performance Monitor in short range, if I/O workloads
between hosts and the storage system become heavy, the storage system
gives higher priority to I/O processing than monitoring processing. If you
notice that frequently monitoring data is missing, use the Gathering
Interval option located in the Monitoring Options window to change to a
longer collection interval. For details, see Start Monitoring and Monitoring
Options Window.
Note: The display of the LDEV tab, Port-LUN tab, and WWN tab is fixed
to in short range.
•
Although Monitoring Switch is set to Enable, the monitoring data is not
updated:
Because the time setting of SVP is changed, the monitoring data might not
be updated. Set Monitoring Switch to Disable, and set Monitoring
Switch to Enable again.
8-2
Troubleshooting
Hitachi Universal Storage Platform V/VM Hitachi Performance Manager User’s Guide
Troubleshooting Server Priority Manager
When the WWN of a host bus adapter is displayed in red in the lower-left tree
of the WWN tab, the host bus adapter (HBA) whose WWN is displayed in red
is connected to two or more ports, but the traffic between the HBA and some
of the ports are not monitored by Performance Monitor. When many-to-many
connections are established between HBAs and ports, make sure that all the
traffic between HBAs and ports is monitored. For details on the measures, see
Monitoring All Traffic between HBAs and Ports.
Troubleshooting the Export Tool
Table 8-1 explains possible problems with the Export Tool and probable
solutions to the problems.
Table 8-1
Troubleshooting the Export Tool
Possible Problems
You cannot run the batch
file.
Probable Causes and Recommended Action
The path to the Java Virtual Machine (Java.exe) might not be defined
in the PATH environment variable. If this is true, you must add that
path to the PATH environment variable. For information about how to
add a path to the environment variable, refer to the documentation
for your operating system.
An incorrect version of Java Runtime Environment (JRE) might be
installed on your computer. To check the JRE version, enter the
following command at the Windows command prompt or the UNIX
console window:
Java
-version
If the version is incorrect, install the correct version of JRE.
The Export Tool stops and
the processing does not
continue.
The command prompt
window was displaying
progress of the export
processing, but the
window stopped displaying
progress before the
processing stopped. The
progress information does
not seem to be updated
anymore.
The command prompt window might be in pause mode.
The command prompt window will be in pause mode if you click
the command prompt window when the Export Tool is running.
To cancel pause mode, you need to activate the command prompt
window and then press the <ESC> key.
If a timeout of RMI occurs during pause mode, the login will be
canceled and an error will occur when you cancel pause mode
after the timeout. The error message ID will be (0001 4011).
If a memory size is not specified in a batch file, the Out Of Memory
Error occurs in JRE, the Export Tool might stop and the processing
might not continue. Confirm whether the specified memory size is
correct or not.
Troubleshooting
Hitachi Universal Storage Platform V/VM Hitachi Performance Manager User’s Guide
8-3
Possible Problems
An error occurs and the
processing stops.
Probable Causes and Recommended Action
If the error message ID is (0001 4011), the user is forcibly logged off
and the processing stops because the Export Tool did not issue any
request to the SVP. The computer running the Export Tool could be
slow. Confirm whether you are using a computer that is not
supported, or whether the computer is slow. Run the Export Tool
again. If the error persists, contact the maintenance personnel.
If the error message ID is (0002 5510), probable error causes and
solutions are:
An internal processing is being performed in the disk array.
Alternatively, another user is changing configurations. Wait for a
while and then run the Export Tool again.
Maintenance operations are being performed on the disk array. Wait
until the maintenance operations finish and then run the Export
Tool again.
If the error message ID is none of the above, see Table 8-2.
The monitoring data in the
CSV file includes "-1".
For details on invalid monitoring data, see Causes of Invalid
Monitoring Data.
When the Export Tool
terminated abnormally due
to error, the row of Check
License is shown as
UnmarshalException in
the log file.
It might be unsuitable combination of DKCMAIN/SVP program version
and Export Tool version. Confirm whether versions of these programs
are correct.
When a CSV file is opened,
the parity group ID and
volume ID are displayed
as following:
To display a CSV file correctly, you need to perform following
operations:
The parity group IDs are
displayed as dates
The volume IDs are
displayed with a
decimal point
1. Start Microsoft® Excel.
2. On the menu bar, select Data, Import External Data, and
Import Text File, and specify a CSV file to import.
The Text Import Wizard - Step 1 of 3 dialog box is displayed
3. In the Text Import Wizard - Step 1 of 3 dialog box, click Next.
Text Import Wizard - Step 2 of 3 dialog box is displayed
4. In the Text Import Wizard - Step 2 of 3 dialog box, check only
Comma in the Delimiter area, and click Next.
The Text Import Wizard - Step 3 of 3 dialog box is displayed
5. In the Text Import Wizard - Step 3 of 3 dialog box, select all
columns of Date preview, and check Text in the Column data
format area on the upper right of this dialog box.
6. Click Finish.
The imported CSV file is displayed.
When you executed the
Export Tool with many
volumes specified, the
Export Tool terminated
abnormally while gathering
monitoring data.
Because too many volumes are specified, a timeout error might have
occurred due to a heavy workload imposed on the computer where
the Export Tool was running. The error message ID is (0001 4011).
Specify fewer volumes. It is recommended that the number of
volumes to be specified is 16,384 or less.
If an error occurs when you run the Export Tool, error messages are issued to
the standard output (for example, the command prompt) and the log file.
Table 8-2 lists the Export Tool messages and recommended actions against
errors.
8-4
Troubleshooting
Hitachi Universal Storage Platform V/VM Hitachi Performance Manager User’s Guide
Table 8-2
Messages Issued by the Export Tool
Possible Problems
Probable Causes and Recommended Action
Connection to the server has not
been established.
Connection to the server has not been established. Use the
login subcommand.
Execution stops.
Execution stops. Remove errors.
Illegal character: "character"
An illegal character is used. Use legal characters.
Invalid length: token
The length is invalid. Specify a value that has a correct
length.
Invalid range: range
The specified range is invalid. Specify the correct range.
Invalid value: "value"
The specified value is invalid. Specify a correct value.
Login failed
1. An attempt to log into the SVP failed. Probable causes
are:
2. An incorrect operand is used for the svpip subcommand.
3. An incorrect operand is used for the login subcommand.
4. The specified user ID is used by another person, and the
person is being logged in.
5. Two users are currently displaying the Performance
Management window.
Two users are currently executing the Export Tool.
Note: If the error cause is step 4 or 5 above, Do one of
the following:
ask one of the users to display another window.
ask one of the users to log off.
wait for one of the users to quit the Export Tool.
Missing command file
The command file is not specified. Specify the name of the
command file correctly.
Missing group name
No operand is specified in the group subcommand. Specify
operands for the subcommand.
Missing host name
No host name is specified. Specify a host name.
Missing output directory
No directory is specified for saving files. Specify the
directory for saving files.
Missing password
The Export Tool cannot find the user ID, which is used to log
into the SVP. Specify the password.
Missing svpip
The svpip subcommand is not used. Use the svpip
command.
Missing time range
Specify the time range.
Missing user ID
The Export Tool cannot find the user ID, which is used to log
into the SVP. Specify the user ID.
Out of range: range
The value is outside the range.
If the short-range subcommand or the long-range
subcommand is used, specify a value within the range from
the monitoring start time to the monitoring end time.
If the set subcommand is used with the switch operand,
specify a value within the range of 1 to 15.
Troubleshooting
Hitachi Universal Storage Platform V/VM Hitachi Performance Manager User’s Guide
8-5
Possible Problems
Permission Denied.
Probable Causes and Recommended Action
The user ID does not have the required permission.
The user ID needs to have at least one of permissions for
Performance Monitor, TrueCopy, TrueCopy for IBM z/OS,
Universal Replicator, and Universal Replicator for IBM z/OS.
RMI server error (part-code, errornumber)
An error occurs at the RMI server. For detailed information,
see the Storage Navigator Messages.
Unable to display help message
The Export Tool cannot display the online help due to a
system error.
Unable to get serial number
The Export Tool cannot obtain the serial number due to a
system error.
Unable to get time range for
monitoring
The SVP does not contain monitoring data.
Unable to read command file: file
The Export Tool cannot read the command file. Specify the
name of the command file correctly.
Unable to use the command:
command
The specified subcommand is unavailable because you
logged in as a storage partition administrator.
Unable to use the group name:
operand
The specified operand of the group subcommand is
unavailable because you logged in as a storage partition
administrator.
Unknown host: host
The Export Tool cannot resolve the host name. Specify the
correct host name.
Unsupported command: command
The Export Tool does not support the specified command.
Specify a correct command.
Unsupported operand: operand
The specified operand is not supported. Correct the specified
operand.
Unsupported option: option
The specified option is not supported. Correct the specified
option.
Some file exists in path.
What do you do?
clear(c)/update(u)/stop(p)
You selected "action". Is it OK?
(y/n)
Files exist in path.
If you want to clear the files, press the <c> key.
If you want to overwrite the files, press the <u> key.
If you want to stop the operation, press the <p> key.
When you press a key, a message appears and asks
whether to perform the specified action.
To perform the specified action, press the <y> key.
To cancel the specified action, press the <n> key.
Specify the following subcommand
before login subcommand: retry
The retry subcommand is written in an incorrect position in
the command file.
Write the retry subcommand before the login subcommand.
8-6
Troubleshooting
Hitachi Universal Storage Platform V/VM Hitachi Performance Manager User’s Guide
Possible Problems
Start gathering group data
Target = xxx, Total = yyy
End gathering group data
Probable Causes and Recommended Action
The Export Tool starts collecting data specified by the group
subcommand.
The number of targets is xxx and the total number is yyy
(refer to Note below).
The Export Tool ends collecting data.
Note: For example, suppose that the storage system
contains 100 parity groups and the command file contains
the following command line:
group PG 1-1:1-2
The Export Tool displays the message "Target=2,
Total=100", which means that the group subcommand
specifies two parity groups and that the total number of
parity groups in the storage system is 100.
Syntax error: "line"
A syntax error is detected in a command line in your
command file. Check the command line for the syntax error
and then correct the script.
Note: Some operands must be enclosed by double
quotation marks ("). Check the command line to find
whether double quotation marks are missing.
Troubleshooting
Hitachi Universal Storage Platform V/VM Hitachi Performance Manager User’s Guide
8-7
Calling the Hitachi Data Systems Support Center
If you need to call the Hitachi Data Systems Support Center, please provide as
much information about the problem as possible, including:
•
The circumstances surrounding the error or failure.
•
The exact content of any error messages displayed on the host system(s).
•
The Volume Retention Manager (or other) error code(s) displayed by the
Storage Navigator computer.
•
The USP V/VM Storage Navigator configuration information saved on
diskette using the FD Dump Tool (see the Storage Navigator User’s Guide).
•
The remote service information messages (R-SIMs) logged on the Storage
Navigator computer and the reference codes and severity levels of the
recent R-SIMs.
The Hitachi Data Systems customer support staff is available 24 hours/day,
seven days a week. If you need technical support, please call:
8-8
•
United States: (800) 446-0744
•
Outside the United States: (858) 547-4526
Troubleshooting
Hitachi Universal Storage Platform V/VM Hitachi Performance Manager User’s Guide
Acronyms and Abbreviations
ACP
array control processor
CCI
CHA
CHP
CLPR
CSW
CU
CV
command control interface
channel adapter
channel processor
cache logical partition
cache switch
control unit (logical control unit)
customized volume
DASD
DFW
DKA
DKCMAIN
DKP
DRR
direct-access storage device
DASD fast write
disk adapter
Disk Controller Main
disk processor
data recovery and reconstruction
ESCON®
Enterprise System Connection (IBM trademark for optical channels)
GB
gigabyte (see Convention for Storage Capacity Values)
HBA
HDD
host bus adapter
hard disk drive
JRE
Java Runtime Environment
KB
kilobyte (see Convention for Storage Capacity Values)
LAN
LDEV
LDKC
LU
LUN
LUSE
local-area network
logical device
logical disk controller
logical unit
logical unit number
LU size expansion
MB
megabyte (see Convention for Storage Capacity Values)
NSC
NVS
network storage controller
nonvolatile storage
PB
petabyte (see Convention for Storage Capacity Values)
Acronyms and Abbreviations
Acronyms-1
Hitachi Universal Storage Platform V/VM Hitachi Performance Manager User’s Guide
PC
PDEV
PSUE
PSUS
P-VOL
personal computer
physical device
pair suspended-error
pair suspended-split
primary volume
RAID
redundant array of independent disks
SIM
service information message
SLPR
SM
SMPL
SPM
S-VOL
SVP
storage management logical partition
shared memory
simplex
Server Priority Manager
secondary volume
service processor
TB
TC
TCz
terabyte (see Convention for Storage Capacity Values)
TrueCopy
TrueCopy for IBM z/OS
UR
USP
Universal Replicator
Universal Storage Platform
VLL
V-VOL
Virtual LVI/LUN
virtual volume (Snapshot Image)
WWN
world-wide name
Acronyms-2
Acronyms and Abbreviations
Hitachi Universal Storage Platform V/VM Hitachi Performance Manager User’s Guide
Index
prioritized WWN, 6-8, 6-22
production server, 2-13
A
access path, 2-10
R
read hit ratio, 2-11, 5-26
real-time mode, 4-16
C
CHA. --- Refer to channel adapter
channel adapter, 2-6
channel processor, 2-6
CHP. --- Refer to channel processor
S
SPM group, 6-28
SPM name, 5-36, 5-39, 5-47, 5-50
D
data recovery and reconstruction processor, 2-9
development server, 2-13
disk adapter, 2-6
disk processor, 2-6
DKA. --- Refer to disk adapter
DKP. --- Refer to disk processor
DRR. --- Refer to data recovery and reconstruction
processor
T
threshold, 2-14
threshold control, 2-14
transfer rate, 2-11, 2-12, 5-26, 6-4
U
upper limit control, 2-14
W
H
write hit rate, 2-11
write hit ratio, 5-26
write pending rate, 2-9
HBA. --- Refer to host bus adapter
host bus adapter, 2-13, 4-21, 5-45, 6-2
I
I/O rate, 2-11, 2-12, 5-26, 6-4
N
nickname, 5-36, 5-39
non- prioritized port, 6-14
non-prioritized port, 6-3
non-prioritized WWN, 6-8, 6-22
P
parity group, 2-4
Performance Manager
system requirements, 3-2
prioritized port, 6-3, 6-14
Index
Index-1
Hitachi Universal Storage Platform V/VM Hitachi Performance Manager User’s Guide
Index-2
Index
Hitachi Universal Storage Platform V/VM Hitachi Performance Manager User’s Guide
Hitachi Universal Storage Platform V/VM Hitachi Performance Manager User’s Guide
Hitachi Data Systems
Corporate Headquarters
750 Central Expressway
Santa Clara, California 95050-2627
U.S.A.
Phone: 1 408 970 1000
www.hds.com
[email protected]
Asia Pacific and Americas
750 Central Expressway
Santa Clara, California 95050-2627
U.S.A.
Phone: 1 408 970 1000
[email protected]
Europe Headquarters
Sefton Park
Stoke Poges
Buckinghamshire SL2 4HD
United Kingdom
Phone: + 44 (0)1753 618000
[email protected]
MK-96RD617-08