1
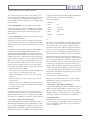
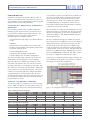
SQL Server 2000 iSCSI Snap Server™
18000 Characterization
Prepared for SNAP Appliance by Interlink Group, INC
February 16, 2005
Interlink Group, LLC
98 Inverness Drive East, Suite 150
Englewood, CO 80112
Phone: 303-542-7100
Toll Free: 888-533-1307
http://www.interlinkgroup.com
SQL SERVER 2000 ISCSI SNAP SERVER™ 18000 CHARACTERIZATION
Contents
1. INTRODUCTION .......................................................................................................................................................3
1.1 Document Overview ............................................................................................................................................3
1.2 Audience ................................................................................................................................................................3
2. SOLUTION OVERVIEW ............................................................................................................................................3
2.1 Statement of the Problem ....................................................................................................................................3
2.2 Solution Description ............................................................................................................................................3
2.3 Approach ...............................................................................................................................................................4
3. TESTING METHODOLOGY.....................................................................................................................................4
3.1 Tool Selection ........................................................................................................................................................4
3.2 Lab Configuration ................................................................................................................................................5
3.3 Read and Write Test Approach ............................................................................................................................5
3.3.1 Test Scripts .......................................................................................................................................................6
3.3.2 Test Procedure .................................................................................................................................................6
3.4 Resiliency Test Approach......................................................................................................................................7
3.4.1 Test Procedure .................................................................................................................................................7
4. TEST CASES AND RESULTS .....................................................................................................................................7
4.1 Read & Write Tests................................................................................................................................................8
4.1.1 Baseline Test – Database & Logs on Internal Direct Attached Drive.........................................................8
4.1.2 Test 1 – Logs & Database on Mirrored iSCSI Disks ....................................................................................8
4.1.3 Test 2 – Database on iSCSI Disks & Logs on Internal Direct Attached Drive ..........................................9
4.1.4 Test Results Comparison ................................................................................................................................9
4.2 Resiliency Tests .....................................................................................................................................................12
4.2.1 General Comments.......................................................................................................................................12
5. RECOMMENDED ARCHITECTURE....................................................................................................................12
5.1 Conceptual Design...............................................................................................................................................12
5.2 System Requirements...........................................................................................................................................13
5.3 Configuration Details ..........................................................................................................................................13
5.3.1 Dedicate Storage Backbone..........................................................................................................................13
5.3.2 Install iSCSI TOE Card.................................................................................................................................13
5.3. Database Architecture .....................................................................................................................................14
5.3.4 Optimize Cache.............................................................................................................................................14
5.3.5 Installation and Volume Creation Procedures ...........................................................................................14
5.3.6 iSCSI Initiator Startup Procedures ..............................................................................................................14
5.4 iSCSI Protocol .....................................................................................................................................................14
5.5 Microsoft Windows iSCSI Initiator Service .....................................................................................................15
6. CONCLUSION...........................................................................................................................................................15
2
SQL SERVER 2000 ISCSI SNAP SERVER™ 18000 CHARACTERIZATION
Introduction
Adaptec is the worldwide volume leader in network attached
storage (NAS) products, offering its customers the successful
Snap Server family of Network Attached Storage servers. These
NAS solutions combine the most reliable and cost-effective
technologies with industry-leading ease of integration. Adaptec
is actively developing new features and capabilities that extend
the traditional NAS appliances into an iSCSI target that supports both block and file needs. By combining these new iSCSI
capabilities with industry-leading ease of integration, Adaptec
strongly believes there are significant opportunities to target
applications within the enterprise that require block-level services. In order to target and sell to these enterprise customers,
Adaptec has positioned its storage appliance in terms of an
overall solution.
The introduction of low-cost, high-performance storage
devices provides new opportunities for enterprise IT to use
storage in innovative ways that were previously cost-prohibitive or not technically feasible. One such opportunity is to
leverage iSCSI devices for use in database applications. Unlike
previous NAS devices that were file based, iSCSI brings blocklevel access and high performance to a lower-cost storage
medium. This presents a compelling reason for IT to evaluate
the potential for iSCSI as primary storage for database applications.
1.1 Document Overview
This document is intended to provide Adaptec with hard data
from lab testing as to how the Adaptec iSCSI device compares
against direct attached local SCSI disk storage in Microsoft®
SQL Server™ 2000 applications.
Interlink has provided this information within this document
in the following format:
• Solution Overview – A general understanding of the benefits and issues associated with using NAS devices as
Microsoft® SQL Server™ 2000 primary storage.
• Testing Methodology – How Interlink approached a generalized performance characterization of Microsoft® SQL
Server™ 2000.
• Test Results – A review of all test results with interpretation
of findings.
• Recommended Architecture - Defines a high-level architecture based on testing results along with recommendations
for extending this architecture in an Exchange production
environment.
• Conclusion – A summary of findings and recommendations.
1.2 Audience
This document assumes the reader has a moderate understanding of networking and server environment technology
terms and acronyms. The intended audience is Adaptec customers, IT managerial and technical personnel.
2. Solution Overview
This section briefly describes the technical problem that the
solution addresses, as well as a general overview of how Interlink approached the generalized performance testing of the
Adaptec Snap Server iSCSI device in a Microsoft® SQL Server™ 2000 environment.
2.1 Statement of the Problem
If one were to ask the question, “is this storage device suitable
for use as Microsoft® SQL Server™ 2000 primary storage?” the
answer would have to be “it depends”. There are infinite ways
that Microsoft® SQL Server™ 2000 can be used to address
common business problems today. Each usage case will have
its own associated performance requirements that might
embrace or preclude the use of one storage method over
another. Enterprises considering the use of new, lower-cost
network attached storage devices with the iSCSI protocol with
Microsoft® SQL Server™ 2000 need to be assured of the performance characteristics in this database environment. When
evaluating potential storage solutions for a Microsoft® SQL
Server™ 2000 environment, the following attributes should be
taken into consideration:
• Performance – Does the solution meet the performance
requirements for the particular application of Microsoft®
SQL Server™ 2000?
• Availability – Does the solution have the necessary architecture to ensure adequate failure protection such as built in
redundancy of components, data striping, etc.?
• Recoverability – In the event of a failure or corruption, can
data be quickly recovered?
• Flexibility – Does the solution offer flexibility in terms of
adding capacity, modifying storage allocation, accommodating multiple different RAID sets, etc.?
• Manageability – Can the device be easily managed and
administered without complex knowledge requirements?
2.2 Solution Description
The Snap Server iSCSI solution is an attractive alternative to
other storage scenarios for the following reasons:
• Adaptability – The use of network attached storage can
help IT reduce isolated server-centric disk storage that
results in “islands of information”. Administrators can
quickly modify space allocation based on changing business
requirements without having to perform complex and risky
data backup and restoration. Storage administrators can
allocate a single device for multiple usage scenarios (e.g.
3
SQL SERVER 2000 ISCSI SNAP SERVER™ 18000 CHARACTERIZATION
file-level access for file and print, or block-level access for
database and messaging applications).
• High Capacity vs. Cost – Adaptec offers terabytes of capacity at reasonable price points that create opportunities for
storage optimization and centralization in organizations
that were previously unable to afford such solutions.
• Rapid Recovery – Adaptec has bundled industry-known
software products with its offerings for rapid data recovery.
Its support for industry standards in file access (NFS and
CFS) and emerging block-level access (iSCSI) also eliminates having to resort to expensive proprietary recovery
mechanism and allows the use of third-party solutions.
• Existing Infrastructure – iSCSI architecture leverages existing network infrastructure technology that is well understood in most organizations and does not require investment in alternative storage infrastructures, such as Fibre
Channel.
2.3 Approach
As stated above, the difficulty in characterizing performance
for Microsoft® SQL Server™ 2000 is the myriad of ways in
which it can be deployed. It would be a daunting task to state
definitively that a storage device would perform in a certain
way in a unique scenario. However, it is reasonable to perform
specific and defined testing scenarios that would give a potential user of an iSCSI storage device a general idea of how that
device would perform over direct attached storage (DAS). At a
very generic level, most applications of Microsoft® SQL Server™ 2000 can be placed into three very broad categories:
• Simple Data Model: In this category, Microsoft® SQL Server™ 2000 is used as a simple repository for data. High performance is not usually essential, as the transaction count is
relatively low. Reads and writes to databases tend to be
more sequential in nature. Examples of applications that
would use SQL in this manner might be SharePoint Portal
Server or Microsoft Operations Manager.
• Transactional: This category is more performance-dependent in that a transactional application makes frequent reads
and writes. Data reads and writes are highly random rather
than sequential. Usually transactional applications require
high availability, robust I/O performance, and rapid recoverability. On line business and e-Business applications
would utilize this model.
• OLAP: Microsoft® SQL Server™ 2000 is increasingly being
used for Online Analytical Processing, which primarily
involves aggregating large amounts of diverse data. OLAP
can involve millions of data items with complex relationships. NAS devices lend themselves to this model in that a
point in time “snapshot” of a production database can be
made and analysis run against that “near-time” data without impacting performance on the production systems.
Interlink’s choice of testing tools reflect a model that encompasses the first two models, as they are probably more representative to typical use scenarios where an iSCSI Snap Appliance device would be deployed. Interlink test scenarios included database sizes of 1, 10, and 100 gigabytes in various configurations. Resiliency of configurations was also tested to simulate component failures and how the Snap Server would handle the failures.
It is important to note that Interlink’s testing of the Snap Server exercised a very limited scenario so that performance characteristics could be generally identified in comparison to local
SCSI disk. Due to the large numbers of variables that could
impact performance, Interlink and Adaptec make no guarantee
or claim that similar performance would be achieved in a production environment. As they say in the car commercials,
“your actual mileage may vary”.
3. Testing Methodology
This section describes the lab configuration, read and write
testing approach, and the resiliency testing approach Interlink
used to characterize performance of the Snap Server™ 18000
with Microsoft SQL Server 2000.
3.1 Tool Selection
For benchmarking Microsoft SQL performance, Interlink felt
that it was important to use tools that actually stressed and
tested a live Microsoft® SQL Server™ 2000 environment.
Microsoft has developed some testing tools available that provide “synthetic testing” that simulates Microsoft® SQL Server™
2000 I/O without actually using the Microsoft® SQL Server™
2000 application. Similarly, benchmarks can be found using
the IOMETER tool that was originally developed by Intel.
Although this tool provides good generic I/O comparative
measurements, it does not exercise Microsoft® SQL Server™
2000 to obtain its data, and that data must be extrapolated to
predict Microsoft® SQL Server™ 2000 performance characteristics. Interlink felt that using a tool that did not perform actual Microsoft® SQL Server™ 2000 operations invalidated the
testing. After evaluating Microsoft-provided tools like SQLIO
and SQLIOStress that performed synthetic testing, Interlink
decided to use testing tools that performed actual tests on real
Microsoft® SQL Server™ 2000 databases. These tools included:
• DBGen – To better understand read performance, Interlink
focused on disk throughput. Interlink leveraged the
Microsoft® SQL Server™ 2000 Resource Kit “DBGen” tool
to generate random data for a 1GB database (3.5 million
row table), a 10GB database (35 million row table), and a
100GB database (350 million row table).
• SQL Scripts – With the data randomly created for the three
databases, the first test used a basic SQL select statement to
test disk throughput as read operations. Since the databases
4
SQL SERVER 2000 ISCSI SNAP SERVER™ 18000 CHARACTERIZATION
did not have any indexes created on the columns, all read
operations were complete table scans and provided a good
measure of disk throughput. To test write performance
under heavy conditions and understand drive performance
and throughput to the Snap Server™ 18000, Interlink used
DTS to copy in bulk a 3.5 million row, 35 million row, and
350 million row tables for each test configuration.
• Perfmon Counters – Interlink used the built-in “Performance Monitor” utility in Windows Server 2003 to monitor, log, and average various system performance counters
including CPU parameters, physical disk performance, network performance, and Microsoft® SQL Server™ 2000 performance.
ed this configuration and built two new RAID sets:
• One RAID 1 set was created on the first two disks for the
transaction logs for the Test 1 configuration.
• One RAID 5 set was created using the remaining six 250GB
disks to hold the databases for Tests 1 and 2 configurations.
For all tests, Microsoft best practices were followed by separating transaction logs (sequential data access) and database files
(random data access) onto different physical drives. Table 1
lists the logical drive letter allocation, the RAID level, the number of drives, and the purpose of each drive.
Figure 1 illustrates the Interlink test lab hardware configuration.
Section 3.3 further describes how Interlink used these tools to
characterize the Snap Server™ 18000 with Microsoft® SQL
Server™ 2000.
3.2 Lab Configuration
Interlink built the test server (ILGTEST3) with Windows Server
2003 Enterprise Edition in a workgroup configuration.
Microsoft® SQL Server™ 2000 Enterprise Edition was installed
and configured using defaults for the Microsoft® SQL Server™
2000 application file locations. For the baseline test, Interlink
configured two internal drives in RAID 1 for the OS and
Microsoft® SQL Server™ 2000 installation. The other two internal drives were configured in RAID 1 for the transaction logs of
the baseline and Test 2 configuration tests. Interlink configured
the remaining eight external expansion chassis drives in RAID 5
for the database files for the baseline configuration tests.
Then, Interlink installed the Snap Server™ 18000 (SNAP900148)
in the test lab and configured it for the same workgroup as test
server. The Snap Server™ 18000 was shipped with eight
250GB disks in a default RAID 5 configuration. Interlink delet-
Figure 1 –Test Lab Environment
Table 2 lists the servers and devices used within the test lab
environment, platform/OS/software, TCP/IP address, and a
description of the function performed.
3.3 Read and Write Test Approach
Using the test scripts in section 3.3.1, Interlink benchmarked
(e.g. baseline configuration) the read and write performance
characteristics of a 1GB, 10GB, and 100GB database placed on
Table 1 – Logical Drive Letter Allocation
Logical Drive Letter
Physical Location
RAID Level
Purpose
Number of Drives
Test Scenario
L
Internal SCSI
Raid 1
Transaction Logs
2
Baseline, Test 2
G
External SCSI Chassis
Raid 5
Database
8
Baseline
H
Snap Server iSCSI Attached
Raid 1
Transaction Logs
2
Test 1
I
Snap Server iSCSI Attached
Raid 5
Database
6
Tests 1, Test 2
Table 2 – Lab Servers and Devices
Server Name
Platform/OS/Software
TCP/IP Address
Description/Function
ILGTESTS3
• Compaq DL380
• Windows Server 2003 Enterprise Edition
• Microsoft® SQL Server™ 2000 Enterprise Edition, SP3a
10.202.2.5
10.200.2.5
• Workgroup Server
• Microsoft® SQL Server™ 2000 Database Server
SNAP900148
• Snap Server™ 18000 device
• GuardianOS™ v3.2.019
10.200.2.4
• NAS device
• SMC gigabit, 5-port switch
192.168.1.2
(management port)
• 10/100/1000 Ethernet Network Switch
Note: The Snap Server™ 18000 device only supports RAID levels 0, 1, and 5.
5
SQL SERVER 2000 ISCSI SNAP SERVER™ 18000 CHARACTERIZATION
the “L” drive (transaction log) and “G” drive (database) running on locally attached SCSI storage and compare those numbers to two separate test configurations leveraging the Snap
Server™ 18000. The two specific Snap Server™ 18000 configurations included:
1. Test 1 Configuration - Logs & Database on iSCSI Disks:
Using the test scripts in section 3.2, Interlink tested read and
write performance characteristics of a 1GB, 10GB, and 100GB
database placed on the “H” drive (transaction log) and “I”
drive (database).
2. Test 2 Configuration - Database on iSCSI Disks & Logs on
Internal Direct Attached Drive:
Using the test scripts in section 3.2, Interlink tested read and
write performance characteristics of a 1GB, 10GB, and 100GB
database placed on the “L” drive (transaction log) and “I” drive
(database).
Interlink then used the Database Generator sample (DBGen)
available in the \ToolsAndSamples\DBGen folder on the
Microsoft® SQL Server™ 2000 Resource Kit CD to generate
1GB, 10GB, and 100GB databases for read and write tests. The
Database Generator is a sample ODBC-based tool designed to
populate tables in a database with a set of sample data. DBGen
allows you to choose the type of data distribution you prefer
from a list of available distributions. The source code for the
Database Generator sample is included as a compressed file
named Dbgen.zip. Database Generator requires the following:
• Microsoft® SQL Server™ 2000.
• A file compression program that supports ZIP compressed
files, in order to access the sample source code.
• Microsoft Visual Basic® 6.0, to access the source code for
Dbgen.exe.
• Microsoft Visual C++® 6.0, to access the source code for
Dbgencom.exe.
• Microsoft® SQL Server™ 2000 security is required to log on
when you use the tool; Microsoft Windows NT® Integrated
security is not supported.
3.3.1 Test Scripts
Interlink created and ran the exact same read and write test
scripts against the nine databases to compare the baseline configuration with each of the two test configurations leveraging
the Snap Server™ 18000. The two specific test scripts included:
1. Test Script 1 – Read (Select) Performance
To better understand read performance, Interlink focused on
disk throughput. Interlink developed a 1GB database (3.5 million row table), a 10GB database (35 million row table), and a
100GB database (350 million row table). Interlink leveraged
the Microsoft® SQL Server™ 2000 Resource Kit “DBGen” tool
to generate random data for the three databases. Interlink created a table using a script provided with DBGen:
Create table examples (
c_uniqueint,
c_zdist
int,
c_edist
char(255),
c_udist
varchar(80),
c_ndist
float,
c_domain
varchar(40)
)
Go
This script created a table that is six columns wide with varying data types. Next, Interlink launched the DBGen application and specified the server name, the database name, the
login name, and password. DBGen requires that the number
of rows to create be specified prior to randomly generating
data in each of the six columns. For example, Interlink specified that DBGen create 3.5 million rows for the 1GB database.
With the data randomly created for the three databases, the
first test used a basic SQL select statement to test disk throughput as read operations for the test databases. Since the databases did not have any indexes created on the columns, all read
operations were complete table scans and provided a good
measure of disk throughput. Interlink also stopped and started Microsoft® SQL Server™ 2000 before each select statement
to ensure that SQL caching did not influence the performance
characteristics. Interlink used the following query to test and
measure read performance:
Select c_unique, c_udist from examples
This query returned all rows for the two columns specified.
Interlink chose columns of varying data types to get a good
mixture of data select types.
2. Test Script 2 – Write (Insert) Performance
Using DTS, Interlink copied in bulk a 3.5 million row table, 35
million row table, and 350 million row table to each test scenario, to test drive throughput to the Snap Server™ 18000.
Interlink decided to use this method to test write performance
under heavy conditions to understand drive performance.
3.3.2 Test Procedure
Interlink ran each test in a very precise and consistent manner
to ensure accuracy and comparable results across each test size
and test configuration. Table 3 lists the steps performed for
each test configuration.
6
SQL SERVER 2000 ISCSI SNAP SERVER™ 18000 CHARACTERIZATION
3.4 Resiliency Test Approach
In order to attain consistent results for comparison, Interlink
introduced a uniform set of faults to the baseline configuration
and the Test 1 configuration using the Snap Server™ 18000.
Prior to executing each fault test on each of the test configurations, Interlink started a 1GB DTS write operation and then a
customized performance monitor to gather metrics.
each factor, and the order in which they were introduced.
Interlink waited for a period of time after the completion of
each factor tested in order for the system to normalize.
4. Test Cases and Results
This section describes the read and write test cases and testing
results Interlink used to characterize performance of the Snap
Server™ 18000 with Microsoft® SQL Server™ 2000.
3.4.1 Test Procedure
Table 4 illustrates the resiliency factors tested, a description of
Table 3 – Test Steps
Step
Description
Procedure
Comments
Open performance monitor and
configure counters.
Under Performance Logs and Alerts, create a new
Log Settings under Counter Logs. Save these log
settings to be used for all tests.
Once created, the same log settings will be used for every test.
1
2
Execute Test Script 2 (Write) to
appropriate database.
Using Microsoft® SQL Server™ 2000 Enterprise
Manager, use DTS to import data to appropriate
database.
Saved table in the destination database will be called examples.
Start Performance Counter.
Right mouse click on the saved log settings and
choose start.
Interlink started the perfmon after the test script was executed
to ensure no 0 values would occur in the test data.
Right mouse click on saved log settings and choose
stop.
Using Windows Explorer, rename the file to
DTSBaseline’DBSize’.blg to ensure the proper perfmon file corresponds to the appropriate test.
Interlink stopped the perfmon log immediately after the test
script ended to ensure no 0 values would occur in the test data.
5
When test script ends, stop performance monitor.
Rename Performance monitor log
file to DTSBaseline’DBSize’.blg.
6
Stop and Start Microsoft® SQL
Server™ 2000.
Using Services, stop and start the MSSQLServer
service.
Interlink performed this step to ensure that SQL caching did not
influence test results.
Execute Test Script 1 (Read) to
appropriate database.
Using Microsoft® SQL Server™ 2000 Query Analyzer, This is a select statement on the targeted table (e.g. 1GB, 10GB
run ‘Select c_unique, c_udist from examples’.
or 100GB) containing test data. The result is that all rows in
the table are selected and the columns returned are c_unique
and c_udist.
Right mouse click on the saved log settings and
Interlink started the perfmon after the test script was executed
choose Start
to ensure no 0 values would occur in the test data.
3
4
7
8
Start Performance Counter.
9
When test script ends, stop performance monitor.
Right mouse click on saved log settings and choose
stop.
Interlink stopped the perfmon log immediately after the test
script ended to ensure no 0 values would occur in the test data.
10
Rename Performance monitor log
file to ReadBaseline’DBSize’.blg.
11
Stop and Start Microsoft® SQL
Server™ 2000.
Using Windows Explorer, rename the file to
ReaadBaseline’DBSize’.blg to ensure the proper perfmon file corresponds to the appropriate test.
Using Services, stop and start the SQLServer service. Interlink performed this step to ensure that SQL caching did not
influence test results.
Table 4 – Resiliency Factors Tested
Test
1
Resiliency Factors Tested (or introduced faults)
Description of Factors Tested
Remove one hard drive from the database drive set, and
re-introduce failed drive during SQL operation
Remove one hard drive from the transaction log drive set,
and introduce failed drive during SQL operation
This will introduce a degraded disk performance condition. After a little time, introduce the
failed drive back into the array to let the system rebuild the array during the SQL operation.
This will introduce a degraded disk performance condition. After a little time, introduce the
failed drive back into the array to let the system rebuild the array during the SQL operation.
3
Unplug one network cable from the Snap Server™ 18000
system, while the database testing is in process
This will reduce the network bandwidth available for database operations and is used to simulate a failed network interface card (NIC). When complete, repair the network cable by plugging
the cable back in to the Snap Server™ 18000 system head unit. This will restore the network
subsystems to pre-test condition.
4
Unplug one network cable from the Snap Server™ 18000
system, while the disk set is in the rebuild process
This will reduce the network bandwidth available for disk rebuild operations and is used to
simulate a failed network interface card (NIC) in iSCSI scenarios. When complete, repair the
network cable by plugging the cable back in to the Snap Server™ 18000 system head unit.
This will restore the disk subsystems to pre-test condition.
5
Power off Snap Server™ 18000 and baseline external SCSI This will fracture the communications between the Snap Server™ 18000 system, and the
enclosure, unexpectedly during database testing
external SCSI storage, with the host system and affecting disk operations.
2
7
SQL SERVER 2000 ISCSI SNAP SERVER™ 18000 CHARACTERIZATION
4.1 Read & Write Tests
Interlink used the built in “Performance Monitor” utility in
Windows Server 2003 to monitor, log and average various system performance counters including CPU parameters, physical
disk performance, and network performance.
4.1.1 Baseline Test – Database & Logs on Internal Direct
Attached Drive
Prior to Adaptec scenario testing, a baseline configuration
matching a typical customer scenario was tested in order to
provide a known condition against which to measure. The
configuration used to represent a typical customer’s
Microsoft® SQL Server™ 2000 is as follows:
• Compaq Proliant DL 380, dual processor Pentium III, Server class
• 1GB RAM
• Integrated non-accelerated RAID card for internet disk,
hardware-accelerated RAID card with battery backed cache
for external expansion chassis
• Dedicated OS/Application drive
• Dedicated log drive in a RAID 1 configuration
• Dedicated database drive in a RAID 5 configuration
The setup for baseline testing consisted of the creation of 2
RAID volumes on the ILGTESTS3 server and installing
Microsoft® SQL Server™ 2000 along with the latest service
pack (SP3a). The default C: drive was used only to host the
operating system and to run the application executables. The
first volume was created using two internal disks configured in
a Raid 1 (mirrored) set for the transaction logs. The second
volume was created using eight drives configured in a Raid 5
(stripped with parity) set for the database files. The drives
were logically assigned the L drive for the transaction logs, and
the G drive for the database files. Table 5 below lists the baseline performance test results.
A second disk set comprised of six hard drives in a RAID 5 set
was created to hold the database. Both disk sets had a single
volume created on them. An iSCSI volume was associated
with each respective volume. The test Microsoft® SQL Server™ 2000, ILGTESTS3, was configured to attach to the two
iSCSI volumes using the Microsoft iSCSI initiator component
so that they are presented as local disk.
Once the volumes are configured on the ILGTESTS3 server, the
transaction log drive was assigned the “H” drive letter, and the
data drive was assigned the “I” drive letter. Interlink then created the three databases (1GB, 10GB, and 100GB) using these
drive letters for this test.
The Test 1 configuration attempted to simulate the performance of the Snap Server™ 18000 device when it was configured
similar to the local server. The transaction log files and database files are all stored on the Snap Server™ 18000’s storage
system, in comparison to the transaction log files and databases being all “local” to the server on SCSI. The disks within the
Snap Server™ 18000 are running at 7200 RPM, they are not as
fast as the 10,000 RPM Wide-Ultra SCSI disks. Table 6 (below)
lists the Test 1 configuration performance test results.
Using our top 3 performance indicators, Figure 2 illustrates the
percent difference for all database sizes in the Test 1 configuration compared to the baseline configuration.
4.1.2 Test 1 – Logs & Database on iSCSI Disks
To create this scenario, two volumes were created on the Snap
Server™ 18000. One disk set was created with two drives configured in a RAID 1 mirrored set to hold the transaction logs.
Figure 2 – Test 1 Configuration Performance Test Results
Table 5 – Baseline Performance Test Results
LG Write Bytes/Sec
DB Write
Bytes/Sec
DB Read
Bytes/Sec
Avg. Disk Read
Queue Length
Avg. Disk Write
Queue Length
% Processor Time
Read
% Processor Time
Write
1GB Base
487446.422
8179131.174
22248813.04
0.61
28.58
54.39
86.22
10GB Base
290776.324
7526451.27
22920794.11
0.61
1.53
60.49
89.38
100GB Base
320404.18
7991059.35
15543701.09
1.52
37.83
60.43
84.12
Test Performed
Table 6 – Test 1 Performance Test Results
LG Write Bytes/Sec
DB Write
Bytes/Sec
DB Read
Bytes/Sec
Avg. Disk Read
Queue Length
Avg. Disk Write
Queue Length
% Processor Time
Read
% Processor Time
Write
1GB Test 1
418537.963
7723526.997
15717719.11
0.31
8.64
61.56
88.67
10GB Test 1
273422.348
6635551.485
17650823.83
0.51
7.66
61.59
86.73
100GB Test 1
279209.936
7087308.909
11703422.65
0.28
16.35
59.28
84.98
Test Performed
8
SQL SERVER 2000 ISCSI SNAP SERVER™ 18000 CHARACTERIZATION
Figure 3 – Test 2 Configuration Performance Test Results
4.1.3 Test 2 – Database on iSCSI Disks & Logs on Internal
Direct Attached Drive
To create this scenario, Interlink placed the transaction logs for
these databases on the locally attached “L” drive, and placed
the database files on the “I” drive. This design splits the database between locally attached storage for the transaction logs
and the Snap Server for the database files. Interlink wanted to
test this scenario to see if this configuration would offer any
performance benefits by having transaction logs on local disk.
The Test 2 configuration attempted to present a more normalized, yet more optimized, configuration by placing the transaction logs on the fastest drives within the server and the database on the most expandable system (Snap Server™ 18000).
Interlink initially assumed that this configuration would perform slightly better than Test 1, but still not equal to the baseline because of the placement of the transaction logs on local
storage. The test data does support the theory showing faster
log write bytes/sec, whereas the database read bytes/sec were
basically equal. Table 7 (Below) lists the Test 2 configuration
performance test results.
Again using our top three performance indicators, Figure 3
illustrates the percent difference for all database sizes in the
Test 2 configuration compared to the baseline configuration.
In a Microsoft® SQL Server™ 2000 database, a transaction
must first be successfully written to the log before it will be
committed to the database. It does this for performance reasons. Writes to a transaction log are sequential, and thus, very
fast. If writes were to pass straight to the database first, they
would be very slow, as they would be contending with random
reads already occurring on the database. In this particular scenario, all writes to the transaction log must first pass through
the hardware RAID card to be written to the transaction log,
then down through the stack to the iSCSI redirector, and finally to the RAID card within the Snap Server™ 18000 to be written finally to the database.
4.1.4 Test Results Comparison
The six charts shown in Figure 4 on the next two pages illustrates the 1GB, 10GB, and 100GB performance characteristics
of the two Snap Server™ 18000 test configurations to the baseline configuration. In order to understand disk throughput,
Interlink captured database write bytes per second, database
read bytes per second, and log write bytes per second. Interlink
discovered two similarities from the performance test results.
1. The baseline configuration tests were faster than the two
Snap Server™ 18000 test configurations, and
2. The two Snap Server™ 18000 test configurations performance database read results were basically equal with
improvements in the Test 2 scenario for database writes
Table 7 – Test 2 Performance Test Results
LG Write Bytes/Sec
DB Write
Bytes/Sec
DB Read
Bytes/Sec
Avg. Disk Read
Queue Length
Avg. Disk Write
Queue Length
% Processor Time
Read
% Processor Time
Write
1GB Test 2
486914.464
7752401.874
18867012.02
0.50
33.44
61.06
88.97
10GB Test 2
313329.314
7588861.439
17787942.92
0.48
13.19
62.34
87.36
100GB Test 2
293437.398
7385352.749
12230381.73
0.27
9.44
57.79
86.21
Test Performed
9
SQL SERVER 2000 ISCSI SNAP SERVER™ 18000 CHARACTERIZATION
Figure 4 – 1GB, 10GB, and 100GB Performance Test Results
SQL SERVER 2000 ISCSI SNAP SERVER™ 18000 CHARACTERIZATION
11
SQL SERVER 2000 ISCSI SNAP SERVER™ 18000 CHARACTERIZATION
Interlink did expect the baseline configuration to outperform
the two Snap Server™ 18000 test configurations since the SCSI
interface and interconnect are faster than 1000Base-T Ethernet, and the SCSI Ultra-Wide drives are faster than the ATA
drives in the Snap Server. However, some Test 2 performance
metrics were very close and some slightly better than the baseline tests.
Interlink also expected that Test 2 would outperform Test 1.
The performance data shows that in fact Test 2 did outperform
Test 1 in regards to log write bytes per second, whereas the
database read operations were basically equal. Because of the
test results, the optimum choice would be keeping transaction
logs on the fastest disks available, while moving the larger and
growing database data files to the more flexible and more inexpensive iSCSI storage.
Interlink did expect the network connectivity between the
server and the Snap Server™ 18000 to be a bottleneck of this
system. One performance counter, Network Output Queue
Length, was observed on the NIC. This counter measured data
being queued on the NIC that needed to be sent over the network and was present during the database write operations.
This does indicate that network bandwidth and latencies were
indeed a bottleneck of this design.
The speed difference is definitely noticeable, but when you factor the price difference between the two storage options, as
well as the ability to grow the Snap Server™ 18000 very easily
among multiple servers, it is easy to justify the investment in
the Snap Server™ 18000.
4.2 Resiliency Tests
The results of the resiliency testing are summarized in this section. The results are compared to the baseline and expressed
as a Pass or Fail, and the description.
4.2.1 General Comments
Adaptec has taken many great steps to increase the reliability
and usability of their Enterprise products. The Snap Server™
18000 boasts dual processors and dual power supplies, both of
which are improvements over its predecessor. The Snap Server™ 18000 has a very functional internal layout with four hotswappable CPU fans and five hot-swappable chassis fans. One
great feature that is new to Adaptec products is the addition of
a LCD screen on the Snap Server™ 18000. The screen displays
the boot up procedures during reboots and displays the server
name and IP address when the server is operational.
5. Recommended Architecture
This section describes the conceptual design, system requirements, and configuration details Interlink recommends when
integrating the Snap Server™ 18000 with Microsoft® SQL
Server™ 2000 to extend the life of an existing database server.
5.1 Conceptual Design
The flexible, inexpensive, and simplistic nature of the Snap
Server™ 18000 allows for a quick and easy deployment of a
Network Attached Storage (NAS) combined with the Internet
SCSI (iSCSI) protocol to allow volumes from the NAS device
to be mounted to the Microsoft® SQL Server™ 2000 server(s)
as a local volume. Once mounted as a local volume, it can be
Table 8 – Resiliency Test Results
Test
Baseline
Snap Appliance,
Test 1 Configuration
1
Pass
Pass
For Test 1 configuration, when a drive was removed, the Snap Server™ 18000 operated as expected. The array
was degraded and the SQL operation continued. When a drive was re-inserted, and a repair process was initiated manually to synchronize the array back to a healthy state, the SQL operation continued and the repair
process seemed to wait until drive I/O operations were limited before beginning the repair process.
2
Pass
Pass
For Test 1 configuration, when a drive was removed, the Snap Server™ 18000 operated as expected. The array
was degraded and the SQL operation continued. When a drive was re-inserted, and a repair process was initiated manually to synchronize the array back to a healthy state, the SQL operation continued and the repair
process seemed to wait until drive I/O operations were limited before beginning the repair process.
3
N/A
Pass
For Test 1 configuration, the SQL Operation continued during the degraded network connection state.
4
N/A
Pass
For Test 1 configuration, the rebuild process continued while the network was in a degraded state. There were
no write operations occurring during this time from the failures on Test 1 configuration.
5
Pass
Pass
Catastrophic Failure for both configurations is expected. For baseline, the DTS Write operations halted and
Microsoft® SQL Server™ 2000 marked the database as suspect. Windows Explorer does not list the SCSI
mapped drives. Now that Microsoft® SQL Server™ 2000 has marked the database as suspect, the hardware
must be repaired and powered on. Interlink had to restart the server as the logical drive letter would not reappear. The Compaq Array controller initiated a RAID re-sync process on all RAID disks in the system. By
rebooting, Microsoft® SQL Server™ 2000 was thus restarted, which cleared the database’s suspect status. No
database corruption was seen.
Comments
For the Snap Server™ 18000, the DTS Write operations halted and Microsoft® SQL Server™ 2000 marked the
database as suspect. Windows Explorer does not list the Snap Appliance iSCSI mapped drives. Now that
Microsoft® SQL Server™ 2000 has marked the database as suspect, the hardware must be repaired and powered on. The logical drive letters re-appeared without a system reboot. The Snap Appliance initiated a RAID resync process on all RAID disks in the system. Microsoft® SQL Server™ 2000 had to be Restarted to clear the
database’s status as Suspect. No database corruption was seen.
12
SQL SERVER 2000 ISCSI SNAP SERVER™ 18000 CHARACTERIZATION
assigned a drive letter. Create databases on this new drive letter
as if the storage was connected locally. The design below illustrates a single Microsoft® SQL Server™ 2000 design with the
Snap Server™ 18000 on a private network.
Figure 5 - Conceptual Design
Note: Additional servers can be implemented by connecting the server to
the public network and also to the private network to use storage provided
by the Adaptec iSCSI Appliance. This allows storage consolidation onto
the Snap Server™ 18000 for other servers, while retaining the dedicated
private network.
5.2 System Requirements
The Microsoft® SQL Server™ 2000 configuration for this Conceptual Design requires:
• Microsoft Windows 2003 Server or Microsoft Windows
2000 Service Pack 4 with the Microsoft iSCSI Initiator
installed. Version 1.06 of the Microsoft iSCSI Initiator is
the recommended level to run for iSCSI connectivity.
• Microsoft® SQL Server™ 2000.
• A 1000 switched network segment to connect the server to
the Snap Appliance solely for the iSCSI protocol.
• Snap Server™ 18000 with iSCSI support; currently the
GuardianOS™ v3.2.019 is the minimum recommended
level of the Operating System (OS) to run for iSCSI connectivity.
5.3 Configuration Details
The following section outlines several recommendations and
high-level implementation procedures to help make implementation an iSCSI solution easy, and a success.
5.3.1 Dedicate Storage Backbone
Figure 5 illustrates a simple single server architecture using a
dedicated network switch for connectivity between the server
and the Snap Server™ 18000. While a NAS device can be
implemented on a public network, connecting a Microsoft®
SQL Server™ 2000 server(s) to the NAS over the public network could result in network performance issues and unsatis-
factory Microsoft® SQL Server™ 2000 performance. Interlink
recommends that customers treat iSCSI attached storage similar to Fibre Channel attached storage and create a dedicated
“storage backbone” of Gigabit copper to isolate the traffic. We
make this recommendation for three reasons:
1. Isolating this traffic will help to keep all the other traffic on
the public network from interfering with Microsoft® SQL
Server™ 2000 performance.
2. An organization’s public network may not have implemented 1000Mbps gigabit copper connections in its switch hardware. The Snap Server™ 18000 comes standard with two
built-in 10/100/1000Mbps gigabit copper connectors.
Utilizing Adaptec’s fastest available connection speed will
help ensure that undesirable Microsoft® SQL Server™ 2000
performance is not introduced while implementing or
migrating to the Snap Server™ 18000 for consolidated
Microsoft® SQL Server™ 2000 database storage.
3. The NIC (Network Interface Card) in the Microsoft® SQL
Server™ 2000 may be busy enough already. Introducing
more network traffic on an already busy NIC may introduce unsatisfactory client server performance. The goal
here is to ensure the highest throughput possible between
the server and the iSCSI storage on the Snap Server™
18000.
5.3.2 Install iSCSI TOE Card
Interlink also recommends that customers purchase an iSCSI
TOE (TCP/IP Offload Engines) card for database servers that
will have iSCSI attached storage. This will keep the server’s
CPU utilization from increasing when moving to this solution,
especially for database applications where the server’s CPU utilization may already be a point of concern. Software-based
iSCSI initiators like Microsoft’s freely downloadable iSCSI
Software Initiator do work over standard NICs, however they
require the server’s CPU to process the incoming and outgoing
network stack tasks of the iSCSI protocol’s packets. A TOE
card will take care of this processing, and thus, relieve the server’s CPU of this task. A TOE card will not improve network
performance above its rated capacity, however. Realistically, a
TOE card and a standard 1000Mbps NIC will only send data as
fast as the network will allow, which is 1000Mbps or 100Mbps
depending on the speed of the network devices used in the
architecture. Adaptec has certified some TOE cards and they
are listed at:
http://www.snapappliance.com/page.cfm?name=iscsi_initiators&nav=technav
Microsoft’s iSCSI Software Initiator can be downloaded at:
http://www.microsoft.com/windowsserversystem/storage/technologies/iscsi/default.mspx
13
SQL SERVER 2000 ISCSI SNAP SERVER™ 18000 CHARACTERIZATION
5.3.3 Database Architecture
Based on the performance characterization tests and the
resiliency tests, Interlink recommends placing the database
transaction log files on the fastest disks possible, preferably
these would be dedicated, internal disks in the server, and the
database data files on the Snap Server™ 18000. Servers today
come with integrated Ultra320 SCSI array controllers with
support for 10,000 and 15,000 RPM Ultra320 SCSI drives.
Purchasing two of these drives in the server and dedicating
them to the database transaction log files (or keeping the
transaction log files where they are currently in an existing
server), will help ensure a good transition to storing database
data files on iSCSI attached Adaptec storage solutions. The
Snap Server™ 18000 uses Serial-ATA (SATA) drives running at
7,200 RPM while transferring data to the SQL server over the
10/100/1000 Ethernet network.
5.3.4 Optimize Cache
Knowing that this solution will introduce a slower disk system,
extra thought and preparation should be done to optimize
caching. By implementing this solution, a real cost savings is
realized, and some of these savings can be spent on some more
Random Access Memory (RAM) for the Microsoft® SQL Server™ 2000. If the Standard version of Microsoft® SQL Server™
2000 is being run, increase the memory to at least 3GB. This
will provide Microsoft® SQL Server™ 2000 with 2GB of memory with 1GB left for the OS. Be sure to configure Microsoft®
SQL Server™ 2000 to use the maximum amount of memory.
If the Enterprise version of Microsoft® SQL Server™ 2000 is
being run, add as much memory as desired, and be sure to
enable AWE (Address Windowing Extensions) in Microsoft®
SQL Server™ 2000. More information about AWE can be
found in Microsoft® SQL Server™ 2000 Books Online. If there
is more than 4GB of RAM, consider upgrading to Windows
Server 2003 Enterprise Edition as it supports up to 32GB of
RAM while Windows 2003 Server only supports up to 4GB of
RAM. Also, when there is more than 4GB of RAM, adding
Physical Address Extension (PAE) to the boot.ini is required to
see the additional RAM. All processors based on the IA-32
architecture that begin with the Intel Pentium Pro, support 36bit physical addressing mode known as PAE. PAE allows up to
8GB of physical memory on Windows 2000 Advanced Server
and up to 32GB of physical memory on Windows 2000 Datacenter Server and Windows 2003 Server Enterprise Edition.
5.3.5 Installation and Volume Creation Procedures
Server™ 18000
3. Install iSCSI Initiator on Microsoft® SQL Server™ 2000 and
configure the Snap Server™ 18000 as iSCSI target
4. Using the iSCSI Initiator, log onto the appropriate iSCSI
volumes
5. Format and assign a drive letters to the mounted volumes
6. Create database using the new drive letters
7. Add new databases to existing backup jobs
5.3.6 iSCSI Initiator Startup Procedures
iSCSI volumes are mounted later in the Windows boot process.
Without special steps being taken, Microsoft® SQL Server™
2000 can start before the iSCSI volumes are mounted and
databases that reside on the Snap Server™ 18000 will be in suspect mode within Microsoft® SQL Server™ 2000. To ensure
that Microsoft® SQL Server™ 2000 does not start before all
iSCSI volumes are mounted, follow these steps:
1. When logging onto the appropriate iSCSI volumes in the
Microsoft iSCSI Initiator Properties program, choose
“Automatically restore this connection when the system
reboots”, thereby making this a persistent target.
2. Set the MSSQLServer service dependent on the Microsoft
iSCSI Initiator service.
3. Set the Bind Volumes option in the Microsoft iSCSI Initiator
Properties on the Initiator Settings tab.
5.4 iSCSI Protocol
Microsoft® SQL Server™ 2000 requires that databases be created on disk volumes, using drive letter assignments in Disk
Management. iSCSI allows Snap Server™ 18000 iSCSI-formatted volumes to appear to the operating system as a local disk
volume.
iSCSI is the implementation of SCSI commands wrapped in
TCP/IP packets. TCP handles flow control and ensures reliable
transmission of data while IP is responsible for the routing of
the packets to the destination device. iSCSI then contains the
SCSI commands, such as the destination file target, and the
actual data. The iSCSI protocol provides an end-to-end protocol for transporting commands and block-level data down
through the host initiator layers and up through the stack layers of the target storage devices. This communication is fully
bidirectional, as shown in Figure 6, where the arrows indicate
the communication path between the initiator and the target
by means of the network.
Detailed installation and configuration instructions are beyond
the scope of this document. High-level installation and configuration steps are provided to give the reader a general idea of
how the solution is deployed. The following steps are required
to install the solution:
1. Install and configure the Snap Server™ 18000
2. Create RAID sets, volumes, and iSCSI volumes on the Snap
14
SQL SERVER 2000 ISCSI SNAP SERVER™ 18000 CHARACTERIZATION
Initiator
Target
Application
Logical Unit
SCSI
SCSI
iSCSI protocol
iSCSI Protocol
TCP/IP
TCP /IP
Ethernet
Ethernet
Network
Figure 6 - iSCSI Protocol Stack Layers
The initiator (usually a server) makes the application requests.
These are converted (by the SCSI class driver) to SCSI commands, which are transported in command description blocks
(CDBs). At the iSCSI protocol layer, the SCSI CDBs (under
control of the iSCSI device driver) are packaged in a protocol
data unit (PDU) which now carries additional information,
including the Logical Unit Number (LUN) of the destination
device. The PDU is passed on to TCP/IP. TCP encapsulates the
PDU and passes it to IP, which adds the routing address of the
final device destination. Finally, the network layer (typically
Ethernet) adds information and sends the packet across the
physical network to the target storage device.
5.5 Microsoft Windows iSCSI Initiator Service
The initiator service enables the host computer system to discover target storage devices on the storage area network and to
determine whether or not it has access to those devices. The
iSCSI Naming Services (iSNS) client—the code required to
interact with the iSNS server—is built directly into the initiator service, enabling the initiator service to maintain a list of
targets reported via the iSNS server as changes are made to
iSCSI volumes on the Snap Server™ 18000.
their own DAS. For customers who want to migrate to a consolidated storage environment to overcome the inflexibility
and maintenance issues of DAS, SAN was the answer. While
SAN’s are the most redundant and the fastest storage available,
they are also the most costly and the most complicated to
implement. This was all before iSCSI however.
iSCSI-based NAS bring to market a third option. To implement a Microsoft® SQL Server™ 2000 with a NAS using iSCSI
is very easy, flexible, inexpensive, and allows the organization
to move to a consolidated storage approach. The downside to
implementing iSCSI is performance. All data packets have to
travel over the network, which for most organizations is Ethernet. Further improvements to Ethernet in the future will help.
However, the performance numbers from the tests were good
as compared to DAS (difference drive throughput on a 3.5 million row select between the DAS and a iSCSI solution was
3.23MB/s), and may prove suitable for many organizations.
This is especially true, for organizations that are trying to
reduce TCO in their storage strategy or cannot afford the large
upfront and ongoing maintenance expense of a SAN solution.
There has been a lot of energy and excitement about iSCSI,
and it appears that iSCSI is finally coming to fruition after a
few slow years of development. Microsoft released its software
iSCSI initiator in June 2003. A few months later, Microsoft
awarded its iSCSI Designed for Windows logo to several vendors, some with iSCSI initiators and some with iSCSI targets.
Adaptec has been awarded the Designed for Windows logo on
several of their products, making them ideal for storing
Microsoft® SQL Server™ 2000 data.
Interlink’s testing validates that the Adaptec Snap Server iSCSI
device is a viable alternative as a storage solution in Microsoft®
SQL Server™ 2000 environments. Is it time for you to evaluate
iSCSI for your storage needs? For those companies that might
still be looking to replace older DAS storage, or have avoided
moving to SAN technology due to high cost and complexity,
Snap Server iSCSI devices should definitely be considered.
6. Conclusion
Initially, Network Attached Storage (NAS) were used for filebased storage that could be shared with Windows clients, Unix
clients, and Apple Macintosh clients easily and cost-effectively.
At that time, there were two popular storage choices for
Microsoft® SQL Server™ 2000 database storage: 1) Direct
Attached Storage (DAS) using SCSI- based server integrated
RAID array controllers or PCI RAID array controllers with
SCSI-based storage enclosures or, 2) Storage Area Network
(SAN) using Fibre Channel. To implement DAS for
Microsoft® SQL Server™ 2000 storage is relatively easy, moderately priced, performs well, but is very inflexible and can be a
maintenance challenge when there are many servers each with
P/N 666766-011 Printed in USA. 02/05 3702_1.1
15