1
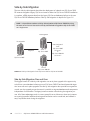
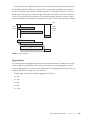
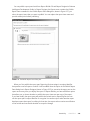
application that can connect to Analysis Services directly can use the PowerPivot Web Service. You
simply use the SharePoint URL for the workbook instead of an Analysis Services server name in the
connection string of the provider. For example, if you have a workbook named Bike Sales.xlsx in
the PowerPivot Gallery located at http://<servername>/PowerPivot Gallery, the SharePoint URL to
use as an Analysis Services data source is http://<servername>/PowerPivot Gallery/Bike Sales.xlsx.
The PowerPivot Management Dashboard
PowerPivot for SharePoint includes several tools for configuring the service application and
for monitoring usage in a management dashboard. All management tools are accessible to
farm and service administrators in Central Administration. The easiest way to access settings
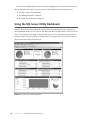
related to PowerPoint for SharePoint is to use the PowerPivot Management Dashboard.
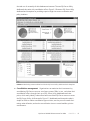
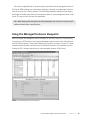
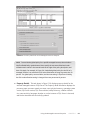
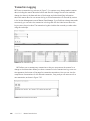
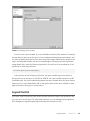
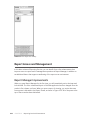
The PowerPivot Management Dashboard displays data for one service application at a time.
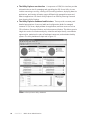
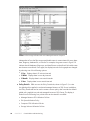
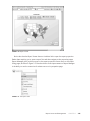
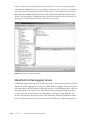
In this dashboard, you can see a collection of Web parts and PowerPivot reports that display data
that is collected daily from multiple sources. One of the Web parts displays a chart showing CPU
and memory usage over time to help you determine whether the server is running at maximum
capacity or whether it is underutilized. Another Web part shows trending of query response times,
which you can use to determine whether queries are responding within configurable thresholds.
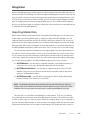
The dashboard page includes links to the PowerPivot reports that provide the source data for
these Web parts. These reports consist of data from an internal reporting database that in turn
collects data from the PowerPivot database, SharePoint usage log data, and other sources. You
can build new reports using this internal reporting database as a source, but you cannot change it.
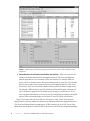
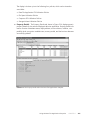
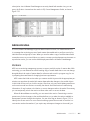
In addition to giving you information about the state of the server, the dashboard also
provides insight into the usage of published workbooks. An interactive chart allows you to
monitor which workbooks users access most frequently and which workbooks have recent
activity. You can view this information at the daily or weekly level.
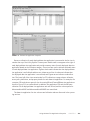
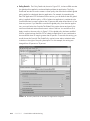
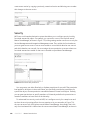
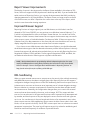
One section of the dashboard provides information about data refresh activity, providing a
single location from which you can verify whether data refreshes are occurring as scheduled.
One Web part in this section lists recent activity for data refresh jobs by workbook and also
includes the job duration. Another Web part lists the workbooks for which the data refresh
job fails, and displays the data refresh error message as a tooltip.
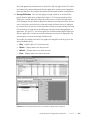
The dashboard is also extensible. It includes a link to add new items, which you can use to
add more workbooks to access from the dashboard page. For example, you can create a new
PowerPivot workbook by using the Usage workbook as a data source, and then upload your
workbook to the same document library.
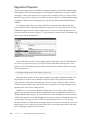
Last, the dashboard page includes links to pages in Central Administration that you can
use to check or reconfigure the settings for PowerPivot. One link takes you to the service
settings page, where you can schedule database timeouts, data refresh hours, and query response time thresholds. You can use another link to review timer job settings for data refresh,
dashboard processing, PowerPivot configuration, and the health statistics collector. A third
link takes you to the settings page for usage log collection.
206 CHAPTER 10
Self-Service Analysis with PowerPivot