1
Sun Java System Web Server 7.0
Update 1 Performance Tuning,
Sizing, and Scaling Guide
Sun Microsystems, Inc.
4150 Network Circle
Santa Clara, CA 95054
U.S.A.
Part No: 820–1067
Copyright 2007 Sun Microsystems, Inc.
4150 Network Circle, Santa Clara, CA 95054 U.S.A.
All rights reserved.
Sun Microsystems, Inc. has intellectual property rights relating to technology embodied in the product that is described in this document. In particular, and without
limitation, these intellectual property rights may include one or more U.S. patents or pending patent applications in the U.S. and in other countries.
U.S. Government Rights – Commercial software. Government users are subject to the Sun Microsystems, Inc. standard license agreement and applicable provisions
of the FAR and its supplements.
This distribution may include materials developed by third parties.
Parts of the product may be derived from Berkeley BSD systems, licensed from the University of California. UNIX is a registered trademark in the U.S. and other
countries, exclusively licensed through X/Open Company, Ltd.
Sun, Sun Microsystems, the Sun logo, the Solaris logo, the Java Coffee Cup logo, docs.sun.com, JavaServer Pages, JSP, JVM, JDBC, Java HotSpot, Java, and Solaris are
trademarks or registered trademarks of Sun Microsystems, Inc. in the U.S. and other countries. All SPARC trademarks are used under license and are trademarks or
registered trademarks of SPARC International, Inc. in the U.S. and other countries. Products bearing SPARC trademarks are based upon an architecture developed
by Sun Microsystems, Inc. Netscape is a trademark or registered trademark of Netscape Communications Corporation in the United States and other countries.
The OPEN LOOK and SunTM Graphical User Interface was developed by Sun Microsystems, Inc. for its users and licensees. Sun acknowledges the pioneering efforts
of Xerox in researching and developing the concept of visual or graphical user interfaces for the computer industry. Sun holds a non-exclusive license from Xerox to
the Xerox Graphical User Interface, which license also covers Sun's licensees who implement OPEN LOOK GUIs and otherwise comply with Sun's written license
agreements.
Products covered by and information contained in this publication are controlled by U.S. Export Control laws and may be subject to the export or import laws in
other countries. Nuclear, missile, chemical or biological weapons or nuclear maritime end uses or end users, whether direct or indirect, are strictly prohibited. Export
or reexport to countries subject to U.S. embargo or to entities identified on U.S. export exclusion lists, including, but not limited to, the denied persons and specially
designated nationals lists is strictly prohibited.
DOCUMENTATION IS PROVIDED “AS IS” AND ALL EXPRESS OR IMPLIED CONDITIONS, REPRESENTATIONS AND WARRANTIES, INCLUDING ANY
IMPLIED WARRANTY OF MERCHANTABILITY, FITNESS FOR A PARTICULAR PURPOSE OR NON-INFRINGEMENT, ARE DISCLAIMED, EXCEPT TO
THE EXTENT THAT SUCH DISCLAIMERS ARE HELD TO BE LEGALLY INVALID.
Copyright 2007 Sun Microsystems, Inc.
4150 Network Circle, Santa Clara, CA 95054 U.S.A.
Tous droits réservés.
Sun Microsystems, Inc. détient les droits de propriété intellectuelle relatifs à la technologie incorporée dans le produit qui est décrit dans ce document. En particulier,
et ce sans limitation, ces droits de propriété intellectuelle peuvent inclure un ou plusieurs brevets américains ou des applications de brevet en attente aux Etats-Unis
et dans d'autres pays.
Cette distribution peut comprendre des composants développés par des tierces personnes.
Certaines composants de ce produit peuvent être dérivées du logiciel Berkeley BSD, licenciés par l'Université de Californie. UNIX est une marque déposée aux
Etats-Unis et dans d'autres pays; elle est licenciée exclusivement par X/Open Company, Ltd.
Sun, Sun Microsystems, le logo Sun, le logo Solaris, le logo Java Coffee Cup, docs.sun.com, JavaServer Pages, JSP, JVM, JDBC, Java HotSpot, Java et Solaris sont des
marques de fabrique ou des marques déposées de Sun Microsystems, Inc. aux Etats-Unis et dans d'autres pays. Toutes les marques SPARC sont utilisées sous licence
et sont des marques de fabrique ou des marques déposées de SPARC International, Inc. aux Etats-Unis et dans d'autres pays. Les produits portant les marques SPARC
sont basés sur une architecture développée par Sun Microsystems, Inc. Netscape est une marque de Netscape Communications Corporation aux Etats-Unis et dans
d'autres pays.
L'interface d'utilisation graphique OPEN LOOK et Sun a été développée par Sun Microsystems, Inc. pour ses utilisateurs et licenciés. Sun reconnaît les efforts de
pionniers de Xerox pour la recherche et le développement du concept des interfaces d'utilisation visuelle ou graphique pour l'industrie de l'informatique. Sun détient
une licence non exclusive de Xerox sur l'interface d'utilisation graphique Xerox, cette licence couvrant également les licenciés de Sun qui mettent en place l'interface
d'utilisation graphique OPEN LOOK et qui, en outre, se conforment aux licences écrites de Sun.
Les produits qui font l'objet de cette publication et les informations qu'il contient sont régis par la legislation américaine en matière de contrôle des exportations et
peuvent être soumis au droit d'autres pays dans le domaine des exportations et importations. Les utilisations finales, ou utilisateurs finaux, pour des armes nucléaires,
des missiles, des armes chimiques ou biologiques ou pour le nucléaire maritime, directement ou indirectement, sont strictement interdites. Les exportations ou
réexportations vers des pays sous embargo des Etats-Unis, ou vers des entités figurant sur les listes d'exclusion d'exportation américaines, y compris, mais de manière
non exclusive, la liste de personnes qui font objet d'un ordre de ne pas participer, d'une façon directe ou indirecte, aux exportations des produits ou des services qui
sont régis par la legislation américaine en matière de contrôle des exportations et la liste de ressortissants spécifiquement designés, sont rigoureusement interdites.
LA DOCUMENTATION EST FOURNIE "EN L'ETAT" ET TOUTES AUTRES CONDITIONS, DECLARATIONS ET GARANTIES EXPRESSES OU TACITES
SONT FORMELLEMENT EXCLUES, DANS LA MESURE AUTORISEE PAR LA LOI APPLICABLE, Y COMPRIS NOTAMMENT TOUTE GARANTIE
IMPLICITE RELATIVE A LA QUALITE MARCHANDE, A L'APTITUDE A UNE UTILISATION PARTICULIERE OU A L'ABSENCE DE CONTREFACON.
071005@18741
Contents
Preface ...................................................................................................................................................11
1
Performance and Monitoring Overview .......................................................................................... 19
Performance Issues .............................................................................................................................. 19
Configuration ...................................................................................................................................... 20
Virtual Servers ..................................................................................................................................... 20
Server Farms ......................................................................................................................................... 21
64–Bit Servers ...................................................................................................................................... 21
SSL Performance .................................................................................................................................. 21
Monitoring Server Performance ........................................................................................................ 22
About Statistics ............................................................................................................................. 23
Monitoring Current Activity Using the Admin Console ........................................................ 25
▼ To Monitor Statistics from the Admin Console ............................................................... 25
Monitoring Current Activity Using the CLI ............................................................................. 26
▼ To Monitor Statistics from the CLI .................................................................................... 26
Monitoring Current Activity Using stats.xml .......................................................................... 29
▼ To Enable the stats-xml URI from the Admin Console ................................................... 29
▼ To Enable the stats-xml URI from the CLI ........................................................................ 30
▼ To Limit the stats-xml Statistics Displayed in the URI .................................................... 30
▼ To View stats-xml Output from the CLI ............................................................................ 31
Monitoring Current Activity Using perfdump ........................................................................ 31
▼ To Enable the perfdump URI from the Admin Console ................................................. 31
▼ To Enable the perfdump URI from the CLI ...................................................................... 32
▼ To View the perfdump Data from the CLI ........................................................................ 33
Monitoring Current Activity Using the Java ES Monitoring Console ................................... 37
3
Contents
2
Tuning Sun Java System Web Server ................................................................................................ 39
General Tuning Tips ........................................................................................................................... 39
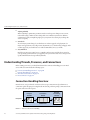
Understanding Threads, Processes, and Connections ................................................................... 40
Connection-Handling Overview ............................................................................................... 40
Custom Thread Pools .................................................................................................................. 42
The Native Thread Pool ............................................................................................................... 43
Process Modes .............................................................................................................................. 44
Mapping Web Server 6.1 Tuning Parameters to Web Server 7.0 ................................................... 46
Using Monitoring Data to Tune Your Server .................................................................................. 48
Connection Queue Information ................................................................................................ 49
HTTP Listener (Listen Socket) Information ............................................................................ 51
Keep-Alive Information .............................................................................................................. 53
Session Creation (Thread) Information .................................................................................... 57
File Cache Information (Static Content) .................................................................................. 59
Thread Pool Information ............................................................................................................ 65
DNS Cache Information ............................................................................................................. 68
Java Virtual Machine (JVM) Information ................................................................................ 70
Web Application Information .................................................................................................... 71
▼ To Access Web Application Statistics From the Admin Console ................................... 71
JDBC Resource Information ...................................................................................................... 72
Tuning the ACL User Cache .............................................................................................................. 77
Tuning Java Web Application Performance .................................................................................... 78
Using Precompiled JSPs .............................................................................................................. 78
Using Servlet/JSP Caching .......................................................................................................... 79
Configuring the Java Security Manager ..................................................................................... 79
Configuring Class Reloading ...................................................................................................... 79
Avoiding Directories in the Classpath ....................................................................................... 80
Configuring the Web Application’s Session Settings ............................................................... 80
Tuning CGI Stub Processes (UNIX/Linux) ..................................................................................... 81
Using find-pathinfo-forward ............................................................................................................. 82
Using nostat ......................................................................................................................................... 82
Using Busy Functions ......................................................................................................................... 83
3
4
Common Performance Problems ......................................................................................................85
check-acl Server Application Functions ........................................................................................... 85
Sun Java System Web Server 7.0 Update 1 Performance Tuning, Sizing, and Scaling Guide •
Contents
Low-Memory Situations ..................................................................................................................... 86
Too Few Threads ................................................................................................................................. 86
Cache Not Utilized .............................................................................................................................. 87
Keep-Alive Connections Flushed ...................................................................................................... 87
Log File Modes ..................................................................................................................................... 88
4
Platform-Specific Issues and Tips ..................................................................................................... 89
Solaris Platform-Specific Issues ......................................................................................................... 89
Files Open in a Single Process (File Descriptor Limits) ........................................................... 89
Failure to Connect to HTTP Server ........................................................................................... 90
Connection Refused Errors ........................................................................................................ 91
Tuning TCP Buffering ................................................................................................................. 91
Using the Solaris Network Cache and Accelerator (SNCA) ................................................... 91
▼ To Enable SNCA to Work With Web Server .................................................................... 92
Solaris File System Tuning ................................................................................................................. 93
High File System Page-In Rate .................................................................................................... 93
Reduce File System Housekeeping ............................................................................................. 93
Long Service Times on Busy Disks or Volumes ....................................................................... 93
Solaris Platform-Specific Performance Monitoring ........................................................................ 94
Short-Term System Monitoring ................................................................................................ 94
Long-Term System Monitoring ................................................................................................. 95
“Intelligent” Monitoring ............................................................................................................. 95
Solaris 10 Platform-Specific Tuning Information ........................................................................... 95
Tuning Solaris for Performance Benchmarking .............................................................................. 96
Tuning UltraSPARC T1–Based Systems for Performance Benchmarking .................................. 97
Tuning Operating System and TCP Settings ............................................................................ 97
Disk Configuration ...................................................................................................................... 98
Network Configuration ............................................................................................................... 98
Web Server Start Options ........................................................................................................... 99
5
Sizing and Scaling Your Server ........................................................................................................ 101
64-Bit Server ....................................................................................................................................... 101
Processors ........................................................................................................................................... 101
Memory .............................................................................................................................................. 102
Drive Space ......................................................................................................................................... 102
5
Contents
Networking ........................................................................................................................................ 102
6
Scalability Studies .............................................................................................................................103
Study Goals ......................................................................................................................................... 103
Study Conclusion .............................................................................................................................. 104
Hardware ............................................................................................................................................ 104
Software .............................................................................................................................................. 105
Configuration and Tuning ............................................................................................................... 105
Network Configuration ............................................................................................................. 106
Web Server Tuning .................................................................................................................... 107
Performance Tests and Results ........................................................................................................ 108
Static Content Test ..................................................................................................................... 108
Dynamic Content Test: Servlet ................................................................................................ 110
Dynamic Content Test: C CGI ................................................................................................. 111
Dynamic Content Test: Perl CGI ............................................................................................. 113
Dynamic Content Test: NSAPI ................................................................................................ 114
PHP Scalability Tests ................................................................................................................. 115
SSL Performance Test: Static Content ..................................................................................... 118
SSL Performance Test: Perl CGI ............................................................................................... 119
SSL Performance Test: C CGI ................................................................................................... 120
SSL Performance Test: NSAPI .................................................................................................. 121
E-Commerce Web Application Test ....................................................................................... 122
Index ................................................................................................................................................... 127
6
Sun Java System Web Server 7.0 Update 1 Performance Tuning, Sizing, and Scaling Guide •
Tables
TABLE 1–1
Methods of Monitoring Performance ..................................................................... 22
TABLE 2–1
Parameter Mapping to server.xml ........................................................................ 46
TABLE 2–2
Connection Queue Statistics .................................................................................... 50
TABLE 2–3
Keep-Alive Statistics .................................................................................................. 53
TABLE 2–4
File Cache Statistics ................................................................................................... 60
TABLE 2–5
Thread Pools Statistics .............................................................................................. 66
TABLE 2–6
DNS Cache Statistics ................................................................................................. 69
TABLE 2–7
Java Virtual Machine (JVM) Statistics .................................................................... 70
TABLE 2–8
Web Application Statistics ....................................................................................... 72
TABLE 2–9
JDBC Resource Statistics .......................................................................................... 73
TABLE 4–1
Tuning Solaris for Performance Benchmarking .................................................... 96
TABLE 4–2
Tuning 64–bit Systems for Performance Benchmarking ..................................... 97
TABLE 6–1
Web Server Tuning Settings ................................................................................... 107
TABLE 6–2
SSL Session Cache Tuning Settings ....................................................................... 107
TABLE 6–3
File Cache Configuration ....................................................................................... 109
TABLE 6–4
Static Content Scalability ........................................................................................ 109
TABLE 6–5
JVM Tuning Settings ............................................................................................... 110
TABLE 6–6
Dynamic Content Test: Servlet Scalability ........................................................... 111
TABLE 6–7
CGI Tuning Settings ............................................................................................... 112
TABLE 6–8
Dynamic Content Test: C CGI Scalability ............................................................ 112
TABLE 6–9
CGI Tuning Settings ............................................................................................... 113
TABLE 6–10
Dynamic Content Test: Perl CGI Scalability ........................................................ 113
TABLE 6–11
Dynamic Content Test: NSAPI Scalability ........................................................... 114
TABLE 6–12
Tuning Settings for FastCGI Plug-in Test ............................................................ 116
TABLE 6–13
PHP Scalability with Fast CGI ................................................................................ 116
TABLE 6–14
NSAPI Plug-in Configuration for PHP ................................................................ 117
TABLE 6–15
PHP Scalability with NSAPI ................................................................................... 118
TABLE 6–16
SSL Performance Test: Static Content Scalability ................................................ 119
7
Tables
TABLE 6–17
TABLE 6–18
TABLE 6–19
TABLE 6–20
TABLE 6–21
8
SSL Performance Test: Perl CGI Scalability ......................................................... 120
SSL Performance Test: C CGI Scalability ............................................................. 121
SSL Performance Test: NSAPI Scalability ............................................................ 122
Performance Test Pass Criteria .............................................................................. 124
E-Commerce Web Application Scalability .......................................................... 125
Sun Java System Web Server 7.0 Update 1 Performance Tuning, Sizing, and Scaling Guide •
Figures
FIGURE 2–1
Web Server Connection Handling .......................................................................... 40
9
10
Preface
This guide discusses adjustments you can make that may improve the performance of Sun Java
System Web Server (henceforth known as Web Server). The guide provides tuning, scaling, and
sizing tips and suggestions; possible solutions to common performance problems; and data
from scalability studies. It also addresses miscellaneous configuration and platform-specific
issues.
Who Should Use This Book
This guide is intended for advanced administrators only. Be sure to read this guide and other
relevant server documentation before making any changes. Be very careful when tuning your
server, and always back up your configuration files before making any changes.
Before You Read This Book
Web Server can be installed as a stand-alone product or as a component of Sun JavaTM
Enterprise System (Java ES), a software infrastructure that supports enterprise applications
distributed across a network or Internet environment. If you are installing Web Server as a
component of Java ES, you should be familiar with the system documentation at
http://docs.sun.com/coll/1286.3.
Web Server Documentation Set
The Web Server documentation set describes how to install and administer the Web Server.
You can access the Web Server documentation at http://docs.sun.com/coll/1653.1. For an
introduction to Web Server , refer to the books in the order in which they are listed in the
following table.
11
Preface
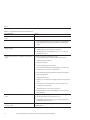
TABLE P–1
Books in the Web Server Documentation Set
Documentation Title
Contents
Sun Java System Web Server 7.0 Update 1 Documentation
Center
Web Server documentation topics organized by tasks and subject
Sun Java System Web Server 7.0 Update 1 Release Notes
■
■
Sun Java System Web Server 7.0 Update 1 Installation and
Migration Guide
Performing installation and migration tasks:
Installing Web Server and its various components,
■
■
Sun Java System Web Server 7.0 Update 1 Administrator’s
Guide
Sun Java System Web Server 7.0 Update 1 Developer’s
Guide
12
Migrating data from Sun ONE Web Server 6.0 or 6.1 to Sun Java
System Web Server 7.0
Performing the following administration tasks:
Using the Administration GUI and command-line interface
■
■
Configuring server preferences
■
Using server instances
■
Monitoring and logging server activity
■
Using certificates and public key cryptography to secure the server
■
Configuring access control to secure the server
■
Using Java Platform Enterprise Edition (Java EE) security features
■
Deploying applications
■
Managing virtual servers
■
Defining server workload and sizing the system to meet performance
needs
■
Searching the contents and attributes of server documents, and
creating a text search interface
■
Configuring the server for content compression
■
Configuring the server for web publishing and content authoring
using WebDAV
Using programming technologies and APIs to do the following:
Extend and modify Sun Java System Web Server
■
■
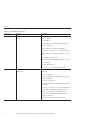
Sun Java System Web Server 7.0 Update 1 NSAPI
Developer’s Guide
Late-breaking information about the software and documentation
Supported platforms and patch requirements for installing Web
Server
Dynamically generate content in response to client requests and
modify the content of the server
Creating custom Netscape Server Application Programmer’s Interface
(NSAPI) plug-ins
Sun Java System Web Server 7.0 Update 1 Performance Tuning, Sizing, and Scaling Guide •
Preface
TABLE P–1
Books in the Web Server Documentation Set
(Continued)
Documentation Title
Contents
Sun Java System Web Server 7.0 Update 1 Developer’s
Guide to Java Web Applications
Implementing Java Servlets and JavaServer PagesTM (JSPTM) technology in
Sun Java System Web Server
Sun Java System Web Server 7.0 Update 1 Administrator’s
Configuration File Reference
Editing configuration files
Sun Java System Web Server 7.0 Update 1 Performance
Tuning, Sizing, and Scaling Guide
Tuning Sun Java System Web Server to optimize performance
Sun Java System Web Server 7.0 Update 1 Troubleshooting
Guide
Troubleshooting Web Server
Related Books
The URL for all documentation about Sun Java Enterprise System (Java ES) and its components
is http://docs.sun.com/coll/1286.3.
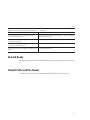
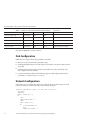
Default Paths and File Names
The following table describes the default paths and file names that are used in this book.
13
Preface
TABLE P–2
Default Paths and File Names
Placeholder
Description
Default Value
install-dir
Represents the base installation directory for Web Sun Java Enterprise System (Java ES) installations on the
Server
SolarisTM platform:
/opt/SUNWwbsvr7
Java ES installations on the Linux and HP-UX platform:
/opt/sun/webserver/
Java ES installations on the Windows platform:
system-drive:\Program Files\Sun\JavaES5\WebServer7
Other Solaris, Linux, and HP-UX installations, non-root
user:
home-directory/sun/webserver7
Other Solaris, Linux, and HP-UX installations, root user:
/sun/webserver7
Windows, all installations:
system-drive:\Program Files\Sun\WebServer7
instance-dir
Directory that contains the instance-specific
subdirectories.
For Java ES installations, the default location for instances
on Solaris:
/var/opt/SUNWwbsvr7
For Java ES installations, the default location for instances
on Linux and HP-UX:
/var/opt/sun/webserver7
For Java ES installations, the default location for instance
on Windows:
system-drive:\Program Files\Sun\JavaES5\WebServer7
For stand-alone installations, the default location for
instance on Solaris, Linux, and HP-UX:install-dir
For stand-alone installations, the default location for
instance on Windows:
system-drive:\Program Files\sun\WebServer7
14
Sun Java System Web Server 7.0 Update 1 Performance Tuning, Sizing, and Scaling Guide •
Preface
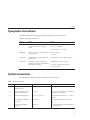
Typographic Conventions
The following table describes the typographic changes that are used in this book.
TABLE P–3
Typographic Conventions
Typeface
Meaning
Example
AaBbCc123
The names of commands, files, and
directories, and onscreen computer
output
Edit your .login file.
Use ls -a to list all files.
machine_name% you have mail.
What you type, contrasted with onscreen
computer output
machine_name% su
AaBbCc123
A placeholder to be replaced with a real
name or value
The command to remove a file is rm filename.
AaBbCc123
Book titles, new terms, and terms to be
emphasized (note that some emphasized
items appear bold online)
Read Chapter 6 in the User's Guide.
AaBbCc123
Password:
A cache is a copy that is stored locally.
Do not save the file.
Symbol Conventions
The following table explains symbols that might be used in this book.
TABLE P–4
Symbol Conventions
Symbol
Description
Example
Meaning
[]
Contains optional arguments and
command options.
ls [-l]
The -l option is not required.
{|}
Contains a set of choices for a
required command option.
-d {y|n}
The -d option requires that you use either the y
argument or the n argument.
${ }
Indicates a variable reference.
${com.sun.javaRoot}
References the value of the com.sun.javaRoot
variable.
-
Joins simultaneous multiple
keystrokes.
Control-A
Press the Control key while you press the A
key.
+
Joins consecutive multiple
keystrokes.
Ctrl+A+N
Press the Control key, release it, and then press
the subsequent keys.
15
Preface
TABLE P–4
Symbol Conventions
(Continued)
Symbol
Description
Example
Meaning
→
Indicates menu item selection in a
graphical user interface.
File → New → Templates
From the File menu, choose New. From the
New submenu, choose Templates.
Documentation, Support, and Training
The Sun web site provides information about the following additional resources:
■
■
■
Documentation (http://www.sun.com/documentation/)
Support (http://www.sun.com/support/)
Training (http://www.sun.com/training/)
Searching Sun Product Documentation
Besides searching Sun product documentation from the docs.sun.com web site, you can use a
search engine by typing the following syntax in the search field:
search-term site:docs.sun.com
For example, to search for “Web Server,” type the following:
Web Server site:docs.sun.com
To include other Sun web sites in your search (for example, java.sun.com, www.sun.com, and
developers.sun.com), use “sun.com” in place of “docs.sun.com” in the search field.
Third-Party Web Site References
Third-party URLs are referenced in this document and provide additional, related information.
Note – Sun is not responsible for the availability of third-party web sites mentioned in this
document. Sun does not endorse and is not responsible or liable for any content, advertising,
products, or other materials that are available on or through such sites or resources. Sun will not
be responsible or liable for any actual or alleged damage or loss caused or alleged to be caused by
or in connection with use of or reliance on any such content, goods, or services that are available
on or through such sites or resources.
16
Sun Java System Web Server 7.0 Update 1 Performance Tuning, Sizing, and Scaling Guide •
Preface
Sun Welcomes Your Comments
Sun is interested in improving its documentation and welcomes your comments and
suggestions. To share your comments, go to http://docs.sun.com and click Send Comments.
In the online form, provide the full document title and part number. The part number is a
7-digit or 9-digit number that can be found on the book's title page or in the document's URL.
For example, the part number of this book is 819-2635.
17
18
1
C H A P T E R
1
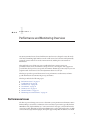
Performance and Monitoring Overview
Sun Java System Web Server (henceforth known as Web Server) is designed to meet the needs
of the most demanding, high-traffic sites in the world. It can serve both static and dynamically
generated content. Web Server can also run in SSL mode, enabling the secure transfer of
information.
This guide helps you to define your server workload and size a system to meet your
performance needs. Your environment is unique, however, so the impacts of the suggestions
provided here also depend on your specific environment. Ultimately you must rely on your own
judgement and observations to select the adjustments that are best for you.
This chapter provides a general discussion of server performance considerations, and more
specific information about monitoring server performance.
This chapter includes the following topics:
■
■
■
■
■
■
■
“Performance Issues” on page 19
“Configuration” on page 20
“Virtual Servers” on page 20
“Server Farms” on page 21
“64–Bit Servers” on page 21
“SSL Performance” on page 21
“Monitoring Server Performance” on page 22
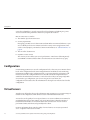
Performance Issues
The first step toward sizing your server is to determine your requirements. Performance means
different things to users than to webmasters. Users want fast response times (typically less than
100 milliseconds), high availability (no “connection refused” messages), and as much interface
control as possible. Webmasters and system administrators, on the other hand, want to see high
connection rates, high data throughput, and uptime approaching 100%. In addition, for virtual
19
Configuration
servers the goal might be to provide a targeted level of performance at different price points.
You need to define what performance means for your particular situation.
Here are some areas to consider:
■
The number of peak concurrent users
■
Security requirements
Encrypting your Web Server’s data streams with SSL makes an enormous difference to your
site’s credibility for electronic commerce and other security conscious applications, but it
can also seriously impact your CPU load. For more information, see “SSL Performance” on
page 21.
■
The size of the document tree
■
Dynamic or static content
The content you serve affects your server’s performance. A Web Server delivering mostly
static HTML can run much faster than a server that must execute CGIs for every query.
Configuration
Certain tuning parameters are set at the configuration level, so that every server instance that is
based on the configuration has the same tuning information. In addition, some monitoring
information is available at the configuration level, so you can monitor the performance of all
instances based on the configuration. However, the bulk of the monitoring information is
available at the individual server instance, or virtual server level. If you are using a single Web
Server instance per configuration (your server is not part of a server farm), the
configuration-level statistics show the information for the single server instance based on that
configuration.
Virtual Servers
Virtual servers add another layer to the performance improvement process. Certain settings are
tunable for the configuration, while others are based on an individual virtual server.
You can also use the quality of service (QoS) features to set resource utilization constraints for
an individual virtual server. For example, you can use QoS features to limit the amount of
bandwidth and the number of connections allowed for a virtual server. You can set these
performance limits, track them, and optionally enforce them.
For more information about using the quality of service features, see Sun Java System Web
Server 7.0 Update 1 Administrator’s Guide.
20
Sun Java System Web Server 7.0 Update 1 Performance Tuning, Sizing, and Scaling Guide •
SSL Performance
Server Farms
The clustering features of Web Server allow you to easily deploy to a server farm. Because all
servers in a server farm share identical configurations, tuning is not done on a server-by-server
basis.
64–Bit Servers
The performance for the 64–bit Web Server is not necessarily better than the performance for
the 32–bit Web Server, but the 64–bit server scales better. Because the 32–bit Web Server
process is confined to 4 GB of address space, it can run out of address space attempting to
support simultaneous sessions beyond a certain limit. Even if the host machine has available
memory and CPU resources, the 32–bit Web Server might not be able to take advantage of it
because of the address space limit. The 64–bit Web Server can run more applications and
servlets than the 32-bit server. Also, the 64–bit Web Server can cache several GBs of static
content, while the 32-bit Web Server is confined to 4 GB of address space.
In general, the tuning for the 64–bit Web Server is similar to the tuning for the 32–bit Web
Server. The differences are mostly tuned at the operating system level. Tuning specifics are
discussed in “Tuning UltraSPARC T1–Based Systems for Performance Benchmarking” on
page 97.
SSL Performance
SSL always has a significant impact on throughput, so for best performance minimize your use
of SSL, or consider using a multi-CPU server to handle it.
For SSL, the Web Server uses the NSS library. However, there are other options available for
SSL:
■
If you are using the Solaris 10 operating system, kernel SSL (KSSL) is available. It does not
contain all the algorithms available, as does NSS, but it often provides better performance.
■
A cryptographic card hardware accelerator for SSL can also improve performance.
■
If you are using the 64–bit Web Server on Solaris, you can use the cryptographic accelerator
of the UltraSPARC T1 processor.
Chapter 1 • Performance and Monitoring Overview
21
Monitoring Server Performance
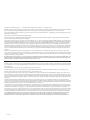
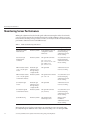
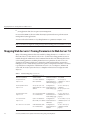
Monitoring Server Performance
Making the adjustments described in this guide without measuring their effects doesn’t make
sense. If you don’t measure the system’s behavior before and after making a change, you won’t
know whether the change was a good idea, a bad idea, or merely irrelevant. You can monitor the
performance of Web Server in several different ways.
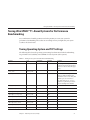
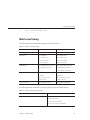
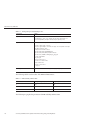
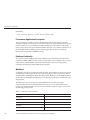
TABLE 1–1
Methods of Monitoring Performance
Monitoring Method
How to Enable
How to Access
Advantages and Requirements
Statistics through the
Admin Console
Enabled by default
In the Admin Console, for a
configuration, click the
Monitor tab
Accessible when session
threads are hanging.
Administration Server
must be running.
Statistics through
individual wadm
commands
Enabled by default
Through wadm commands:
Accessible when session
threads are hanging.
Administration Server
must be running.
XML-formatted statistics
(stats-xml) through a
browser
Enable through
Admin Console or
through editing a
configuration file
Through a URI
Administration Server
need not be running.
XML-formatted statistics
(stats-xml) through the
command-line interface
Enabled by default
Through the wadm command
get-stats-xml
Accessible when session
threads are hanging.
Administration Server
must be running.
perfdump through a
browser
Enable through
Admin Console or
through editing a
configuration file
Through a URI
Administration Server
need not be running.
perfdump through the
command-line interface
Enabled by default
Through wadm command
get-perfdump
Accessible when session
threads are hanging.
Administration Server
must be running.
Java ES Monitoring
Enabled by default
Through the Java ES
Monitoring Console
Only for Java ES
installations.
Administration Server
must be running.
get-config-stats
get-virtual-server-stats
get-webapp-stats
get-servlet-stats
Monitoring the server does have some impact on computing resources. In general, using
perfdump through the URI is the least costly, followed by using stats-xml through a URI.
22
Sun Java System Web Server 7.0 Update 1 Performance Tuning, Sizing, and Scaling Guide •
Monitoring Server Performance
Because using the Administration Server takes computing resources, the command-line
interface and the Admin Console are the most costly monitoring methods.
For more information on these monitoring methods, see the following sections:
■
■
■
■
■
■
“About Statistics” on page 23
“Monitoring Current Activity Using the Admin Console” on page 25
“Monitoring Current Activity Using the CLI” on page 26
“Monitoring Current Activity Using stats.xml” on page 29
“Monitoring Current Activity Using perfdump” on page 31
“Monitoring Current Activity Using the Java ES Monitoring Console” on page 37
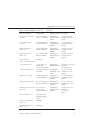
About Statistics
You can monitor many performance statistics through the Admin Console user interface,
through the command-line interface, through the stats-xml URI, and through perfdump. For
all these monitoring methods, the server uses statistics it collects. None of these monitoring
methods will work if statistics are not collected.
The statistics give you information at the configuration level, the server instance level, or the
virtual server level. The statistics are broken up into functional areas.
For the configuration, statistics are available in the following areas:
■
■
■
Requests
Errors
Response Time
For the server instance, statistics are available in the following areas:
■
Requests
■
Errors
■
Response Time
■
General
■
Java Virtual Machine (JVMTM)
■
Connection Queue
■
Keep Alive
■
DNS
■
File Cache
■
Thread Pools
■
Session Replication
■
Session Threads, including Profiling data (available if profiling is enabled)
Chapter 1 • Performance and Monitoring Overview
23
Monitoring Server Performance
■
Java DataBase Connectivity (JDBCTM) (available if a JDBC resource is created and the
connection pool is accessed)
For the virtual server, statistics are available in the following areas:
■
General
■
Response
■
Web Applications
■
Profiling Data (available if profiling is enabled)
■
Servlet and Servlet Response Cache (available if the Servlet cache is enabled in
sun.web.xml)
Some statistics default to zero if Quality of Service (QoS) is not enabled, for example, the count
of open connections, the maximum open connections, the rate of bytes transmitted, and the
maximum byte transmission rate.
Enabling Statistics
Statistics are activated by default on Web Server. However, if you have disabled them, you need
to enable them again to monitor your server for performance. To enable statistics, use Admin
Console or the wadm command-line utility (CLI).
Note – Collecting statistics causes a slight hit to performance.
▼ To Enable Statistics from the Admin Console
24
1
From the Admin Console Common Tasks page, select the configuration.
2
Click Edit Configuration.
3
Click the General tab.
4
Click the Monitoring Settings sub tab.
5
On the Monitoring Settings page, under General Settings, select the Statistics Enabled
checkbox.
6
Configure the interval and profiling.
■
The Interval is the period in seconds between statistics updates. A higher setting (less
frequent) improves performance. The minimum value is .001 seconds; the default value is 5
seconds.
■
Profiling is activated by default. Deactivating it results in slightly less monitoring overhead.
Sun Java System Web Server 7.0 Update 1 Performance Tuning, Sizing, and Scaling Guide •
Monitoring Server Performance
7
Restart the server.
▼ To Enable Statistics from the CLI
1
Enter the following CLI command to enable statistics collection:
./wadm set-stats-prop --user=admin_user –password-file=password-file
--config=myconfig enabled=true
To disable statistics, set enabled to false.
2
To set the interval and enable profiling, use the set-stats-prop interval and profiling
properties. For more information, see the help for set-stats-prop.
3
Restart the server.
Monitoring Current Activity Using the Admin Console
Frequently-used statistics are available through the Admin Console, viewed as general statistics,
instance statistics, and virtual server statistics.
▼ To Monitor Statistics from the Admin Console
1
In the Admin Console, from the Common Tasks page, select the Monitoring tab.
2
Select the configuration.
The configuration statistics are displayed.
3
From the drop-down list, select a View interval.
The statistics displayed in your browser are automatically updated at this interval.
4
Select the type of statistics to display.
The initial list of statistics types includes General Statistics, Instance Statistics, and Virtual
Server Statistics.
If you choose Instance Statistics, click the name of the instance to monitor. Detailed statistics
are then displayed, including information on processes and session replications.
If you choose Virtual Server Statistics, click the name of the virtual server to monitor. Statistics
for the virtual server are displayed, including response statistics and web application statistics.
This information is not provided through perfdump.
Chapter 1 • Performance and Monitoring Overview
25
Monitoring Server Performance
Monitoring Current Activity Using the CLI
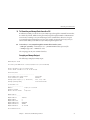
You can also view statistics information using the wadm commands get-config-stats,
get-virtual-server-stats, get-webapp-stats and get-servlet-stats. Note that the
examples below do not contain all possible command options. For the complete syntax, see the
help for the command.
▼ To Monitor Statistics from the CLI
1
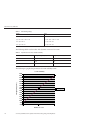
To get statistics for a configuration deployed on a single node, enter:
./wadm get-config-stats --user=admin-user --password-file=admin-password-file
--config=config-name --node=node-name
Using the node option in this syntax restricts the output to a single node. To get the statistics at
the configuration level, use the command without the node option.
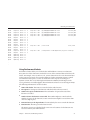
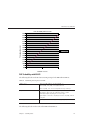
The following shows an example of the output for a single node:
timeStarted=1168035653
secondsRunning=1404
countRequests=690546
rpsLast1MinAvg=4491.7666
rpsLast5MinAvg=1844.6061
rpsLast15MinAvg=637.37305
countErrors=0
epsLast1MinAvg=0.0
epsLast5MinAvg=0.0
epsLast15MinAvg=0.0
maxResponseTime=0.30789953
rtLast1MinAvg=5.3970284
rtLast5MinAvg=5.208407
rtLast15MinAvg=35.56042
countBytesReceived=96800935
countBytesTransmitted=689929574
countChildDied=0
countVirtualServers=2
instanceName=https-test
process.1.countThreadPools=2
process.1.jdbcPoolCount=1
process.1.countThreads=64
process.1.fractionSystemMemoryUsage=2887.0
process.1.countConnectionQueues=1
process.1.sizeResident=0
process.1.countIdleThreads=32
process.1.mode=1
process.1.sizeVirtual=0
process.1.countConfigurations=1
process.1.pid=15874
26
Sun Java System Web Server 7.0 Update 1 Performance Tuning, Sizing, and Scaling Guide •
Monitoring Server Performance
process.1.timeStarted=Jan 5, 2007 2:20:53 PM
process.1.DNSCache.countCacheHits=687804
process.1.DNSCache.countAsyncNameLookup=0
process.1.DNSCache.countAsyncLookupsInProgress=0
process.1.DNSCache.flagAsyncEnabled=false
process.1.DNSCache.countAsyncAddrLookups=0
process.1.DNSCache.flagCacheEnabled=true
process.1.DNSCache.countCacheMisses=75
process.1.JDBCPool.1.countQueued=32
process.1.JDBCPool.1.countFreeConnections=0
process.1.JDBCPool.1.peakConnections=32
process.1.JDBCPool.1.millisecondsPeakWait=72
process.1.JDBCPool.1.countWaitQueueTimeouts=288
process.1.JDBCPool.1.peakQueued=64
process.1.JDBCPool.1.maxConnections=32
process.1.JDBCPool.1.currentConnections=32
process.1.JDBCPool.1.millisecondsAverageQueued=1.0
process.1.JDBCPool.1.countTotalFailedValidationConnections=0
process.1.JDBCPool.1.countLeasedConnections=32
process.1.JDBCPool.1.countTotalLeasedConnections=414
process.1.JDBCPool.1.countConnectionIdleTimeouts=1
process.1.JDBCPool.1.name=jdbc/jdbc-simple_1
process.1.connectionQueue.1.countQueued15MinuteAverage=4.3203125
process.1.connectionQueue.1.countQueued=0
process.1.connectionQueue.1.countQueued1MinuteAverage=0.046875
process.1.connectionQueue.1.countTotalQueued=79171
process.1.connectionQueue.1.countQueued5MinuteAverage=4.03125
process.1.connectionQueue.1.countOverflows=0
process.1.connectionQueue.1.maxQueued=1288
process.1.connectionQueue.1.ticksTotalQueued=724956383
process.1.connectionQueue.1.countTotalConnections=863
process.1.connectionQueue.1.peakQueued=64
process.1.connectionQueue.1.name=cq1
process.1.fileCache.countContentMisses=7
process.1.fileCache.maxMmapCacheSize=0
process.1.fileCache.sizeHeapCache=27520
process.1.fileCache.countMisses=22
process.1.fileCache.countContentHits=620662
process.1.fileCache.maxEntries=1024
process.1.fileCache.flagEnabled=true
process.1.fileCache.secondsMaxAge=30
process.1.fileCache.sizeMmapCache=0
process.1.fileCache.countInfoHits=1862013
process.1.fileCache.maxHeapCacheSize=10747924
process.1.fileCache.countOpenEntries=0
process.1.fileCache.countHits=2482682
process.1.fileCache.maxOpenEntries=1024
process.1.fileCache.countEntries=12
Chapter 1 • Performance and Monitoring Overview
27
Monitoring Server Performance
process.1.fileCache.countInfoMisses=19
process.1.jvm.countGarbageCollections=96
process.1.jvm.sizeHeap=67762048
process.1.jvm.countThreads=79
process.1.jvm.countClassesUnloaded=0
process.1.jvm.vMVendor=Sun Microsystems Inc.
process.1.jvm.countTotalClassesLoaded=3170
process.1.jvm.vMName=Java HotSpot(TM) Server VM
process.1.jvm.countTotalThreadsStarted=81
process.1.jvm.countClassesLoaded=3170
process.1.jvm.peakThreads=79
process.1.jvm.millisecondsGarbageCollection=1981
process.1.jvm.vMVersion=1.5.0_09-b03
process.1.keepalive.countConnections=32
process.1.keepalive.maxConnections=200
process.1.keepalive.countFlushes=0
process.1.keepalive.countRefusals=0
process.1.keepalive.countTimeouts=6
process.1.keepalive.countHits=686943
process.1.keepalive.secondsTimeout=30
process.1.threadPool.1.countQueued=0
process.1.threadPool.1.countThreadsIdle=1
process.1.threadPool.1.threadPoolId=NativePool
process.1.threadPool.1.maxThreads=128
process.1.threadPool.1.countThreads=1
process.1.threadPool.1.maxQueued=0
process.1.threadPool.1.peakQueued=0
process.1.threadPool.1.name=NativePool
process.1.threadPool.2.countQueued=0
process.1.threadPool.2.countThreadsIdle=1
process.1.threadPool.2.threadPoolId=my-custom-pool
process.1.threadPool.2.maxThreads=128
process.1.threadPool.2.countThreads=1
process.1.threadPool.2.maxQueued=0
process.1.threadPool.2.peakQueued=0
process.1.threadPool.2.name=my-custom-pool
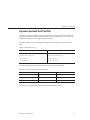
2
To get statistics for a virtual server, enter:
./wadm get-virtual-server-stats --user=admin-user
--password-file=admin-password-file --config=config-name --vs=virtual-server-name
Because the node option is not used, this syntax gives the aggregate statistics for the virtual
server across all the nodes where the configuration has been deployed. Using the node option
restricts the output to a single node.
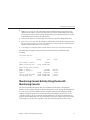
3
28
To get statistics for a deployed web application, enter:
./wadm get-webapp-stats --user=admin-user --password-file=admin-password-file
--config=config-name --node=node-name --vs=virtual-server-name --uri=URI
Sun Java System Web Server 7.0 Update 1 Performance Tuning, Sizing, and Scaling Guide •
Monitoring Server Performance
The syntax gets the statistics for a given web application deployed on the given virtual server of
the given instance. To get the aggregated web application statistics for a given configuration
across all the nodes where the configuration has been deployed, use the command without the
node option.
The following example shows the output for the URI hello:
countActiveSessions=1
countExpiredSessions=0
countJsps=1
countRejectedSessions=0
countReloadedJsps=1
countSessions=1
peakActiveSessions=1
secondsSessionAliveAverage=0
secondsSessionAliveMax=0
uri=/hello
vsName=myvs.sun.com
Monitoring Current Activity Using stats.xml
You can also display statistics using stats-xml, which displays statistics in XML format. The
output of stats-xml is in XML so that various tools can easily parse the statistics. You can view
the stats-xml output through a URI, which you have to enable, or you can view the stats-xml
output through the CLI, which is enabled by default.
▼ To Enable the stats-xml URI from the Admin Console
If you enable the stats-xml URI, you can access statistics for your server in XML format
through a browser. Note that when you use the stats-xml URI, you can access statistics even
when the Administration Server is not running. Also, with the stats-xml URI activated, users
can see the statistics information for your server, unless you take precautions to deny access.
1
On the Common Tasks page, select the configuration from the pull-down menu on the left.
2
Select the virtual server from the pull-down menu on the right, then click Edit Virtual Server.
3
On the Server Settings tab, click the Monitoring Settings sub tab.
4
Select the XML Report enabled checkbox.
5
Provide a URI, for example, /stats-xml.
6
Click Save.
7
Deploy the configuration.
Chapter 1 • Performance and Monitoring Overview
29
Monitoring Server Performance
8
Access the stats-xml URI, for example:
http://yourhost:port/stats-xml
The statistics are displayed in XML format.
▼ To Enable the stats-xml URI from the CLI
1
Use the following command to enable stats-xml:
./wadm enable-stats-xml --user=admin-user --password-file=admin-password-file
[--uri-prefix=prefix]--config=config-name --vs=virtual-server-name
Use the uri-prefix option to set the stats-xml URI.
2
Deploy the configuration using the wadm deploy-config command.
3
Access the stats-xml URI, for example:
http://yourhost:port/stats-xml
The statistics are displayed in XML format.
▼ To Limit the stats-xml Statistics Displayed in the URI
You can modify the stats-xml URI to limit the data it provides.
●
Modify the stats-xml URI to limit the information by setting elements to 0 or 1. An element set
to 0 is not displayed on the stats-xml output. For example:
http://yourhost:port/stats-xml?thread=0&process=0
This syntax limits the stats-xml output so that thread and process statistics are not included.
By default all statistics are enabled (set to 1).
Most of the statistics are available at the server level, but some are available at the process level.
Use the following syntax elements to limit stats-xml:
■
■
■
■
■
■
■
■
■
■
■
■
30
cache-bucket
connection-queue
connection-queue-bucket (process-level)
cpu-info
dns-bucket
jdbc-resource-bucket
keepalive-bucket
process
profile
profile-bucket (process-level)
request-bucket
servlet-bucket
Sun Java System Web Server 7.0 Update 1 Performance Tuning, Sizing, and Scaling Guide •
Monitoring Server Performance
■
■
■
■
■
■
session-replication
thread
thread-pool
thread-pool-bucket (process-level)
virtual-server
web-app-bucket
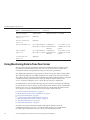
▼ To View stats-xml Output from the CLI
In addition to a URI, you can also access stats-xml output through the command-line
interface. It is enabled by default. Unlike viewing stats-xml output through the URI, the
Administration Server must be running to view stats-xml output at the command-line.
However, if request processing threads are hanging in your server (for example, because they
are busy), and you cannot use the URI, you can still access stats-xml output through the CLI.
●
To view the stats-xml output through the command-line interface, enter:
./wadm get-stats-xml --user=admin-user --password-file=admin-password-file
--config=config-name --node=node-name
Monitoring Current Activity Using perfdump
perfdump is a Server Application Function (SAF) built into Web Server that collects various
pieces of performance data from the Web Server internal statistics and displays them in ASCII
text. The perfdump output does not display all the statistics available through the
command-line statistics or the Admin Console, but it can still be a useful tool. For example, you
can still use perfdump even if the Administration Server is not running. You can view the
perfdump output through the CLI, which is enabled by default, or you can view the perfdump
output through a URI, which you have to enable. If you enable the URI, you must control access
to the perfdump URI, otherwise it can be visible to users.
With perfdump, the statistics are unified. Rather than monitoring a single process, statistics are
multiplied by the number of processes, which gives you an accurate view of the server as a
whole.
For information on tuning the information displayed by perfdump, see “Using Monitoring
Data to Tune Your Server” on page 48.
▼ To Enable the perfdump URI from the Admin Console
You can enable perfdump URI for a virtual server through the Admin Console.
Chapter 1 • Performance and Monitoring Overview
31
Monitoring Server Performance
Note – The statistics displayed by perfdump are for the server as a whole. If you enable perfdump
on one virtual server, it displays statistics for the whole server, not an individual virtual server.
1
From Common Tasks, select a configuration.
2
Select the virtual server and click Edit Virtual Server.
3
Click the Monitoring Settings tab.
4
Select the Plain Text Report Enabled checkbox.
5
Provide a URI for accessing the report, for example /.perf.
6
Click Save.
7
Deploy the configuration.
8
To access perfdump, access the URI on the virtual server.
For example: http://localhost:80/.perf
You can request the perfdump statistics and specify how frequently (in seconds) the browser
should automatically refresh. The following example sets the refresh to every 5 seconds:
http://yourhost/.perf?refresh=5
▼ To Enable the perfdump URI from the CLI
1
Use the following command to enable stats-xml:
./wadm enable-perfdump --user=admin-user --password-file=admin-password-file
[--uri=uri]--config=config-name--vs=virtual-server-name
Use the uri option to set the pefdump URI.
2
Deploy the configuration using the wadm deploy-config command.
3
To access perfdump, access the URI on the virtual server.
For example: http://localhost:80/.perf
You can request the perfdump statistics and specify how frequently (in seconds) the browser
should automatically refresh. The following example sets the refresh to every 5 seconds:
http://yourhost/.perf?refresh=5
32
Sun Java System Web Server 7.0 Update 1 Performance Tuning, Sizing, and Scaling Guide •
Monitoring Server Performance
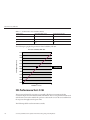
▼ To View the perfdump Data from the CLI
In addition to a URI, you can also access perfdump output through the command-line interface.
It is enabled by default. Unlike viewing perfdump output through the URI, the Administration
Server must be running to view perfdump output at the command-line. However, if request
processing threads are hanging in your server (for example, because they are busy), and you
cannot use the URI, you can still access perfdump output through the CLI.
●
To view the perfdump output through the command-line interface, enter:
./wadm get-perfdump --user=admin-user --password-file=admin-password-file
--config=config-name --node=node-name
The output appears in your command window.
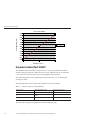
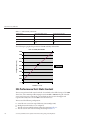
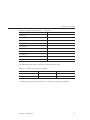
Sample perfdump Output
The following is sample perfdump output:
webservd pid: 29133
Sun Java System Web Server 7.0 B07/13/2006 17:09 (SunOS DOMESTIC)
Server started Fri Jul 14 14:34:15 2006
Process 29133 started Fri Jul 14 14:34:17 2006
ConnectionQueue:
----------------------------------------Current/Peak/Limit Queue Length
Total Connections Queued
Average Queue Length (1, 5, 15 minutes)
Average Queueing Delay
2/237/1352
67364017
4.52, 4.73, 4.85
13.63 milliseconds
ListenSocket ls1:
-----------------------Address
https://0.0.0.0:2014
Acceptor Threads
1
Default Virtual Server
https-test
KeepAliveInfo:
-------------------KeepAliveCount
KeepAliveHits
KeepAliveFlushes
KeepAliveRefusals
KeepAliveTimeouts
KeepAliveTimeout
198/200
0
0
56844280
365589
10 seconds
SessionCreationInfo:
Chapter 1 • Performance and Monitoring Overview
33
Monitoring Server Performance
-----------------------Active Sessions
128
Keep-Alive Sessions
0
Total Sessions Created
128/128
Server cache disabled
Native pools:
---------------------------NativePool:
Idle/Peak/Limit
Work Queue Length/Peak/Limit
TestPool:
Idle/Peak/Limit
Work Queue Length/Peak/Limit
1/1/128
0/0/0
5/5/10
0/0/15
DNSCacheInfo:
-----------------enabled
yes
CacheEntries
4/1024
HitRatio
62854802/62862912 ( 99.99%)
Async DNS disabled
Performance Counters:
-----------------------------------------------Average
Total
Total number of requests:
Request processing time:
Percent
62647125
0.0343 2147687.2500
default-bucket (Default bucket)
Number of Requests:
62647125
Number of Invocations:
3374170785
Latency:
0.0008
47998.2500
Function Processing Time: 0.0335 2099689.0000
Total Response Time:
0.0343 2147687.2500
(100.00%)
(100.00%)
( 2.23%)
( 97.77%)
(100.00%)
Sessions:
----------------------------------------------------------------------------------------------------------Process Status
Client
Age VS
Method URI
Function
29133
29133
29133
29133
29133
29133
34
response
response
response
response
response
response
192.6.7.7
192.6.7.7
192.6.7.7
10.5.8.19
192.6.7.7
192.6.7.7
115
8
4
4
3
3
https-test
https-test
https-test
https-test
https-test
https-test
GET
GET
GET
GET
GET
GET
/qa_webapp/CheckNetwork.class
/qa_webapp/CheckNetwork.class
/qa_webapp/CheckNetwork.class
/perf
/qa_webapp/CheckNetwork.class
/qa_webapp/CheckNetwork.class
Sun Java System Web Server 7.0 Update 1 Performance Tuning, Sizing, and Scaling Guide •
service-j2ee
service-j2ee
service-j2ee
service-dump
service-j2ee
service-j2ee
Monitoring Server Performance
29133
29133
29133
29133
29133
29133
29133
29133
29133
29133
29133
29133
29133
29133
29133
29133
29133
29133
.
.
.
response
response
response
response
request
request
request
request
request
response
request
request
response
request
updating
updating
updating
updating
192.6.7.7
192.6.7.7
192.6.7.7
192.6.7.7
192.6.7.7
192.6.7.7
192.6.7.7
192.6.7.7
192.6.7.7
192.6.7.7
192.6.7.7
192.6.7.7
192.6.7.7
192.6.7.7
192.6.7.7
192.6.7.7
192.6.7.7
192.6.7.7
2
2
2
2
0
0
0
0
0
0
0
0
0
0
https-test
https-test
https-test
https-test
GET
GET
GET
GET
/qa_webapp/CheckNetwork.class
/qa_webapp/CheckNetwork.class
/qa_webapp/CheckNetwork.class
/qa_webapp/CheckNetwork.class
service-j2ee
service-j2ee
service-j2ee
service-j2ee
https-test GET
/file1.shtml
shtml_send
https-test GET
/find-pathinfo-forward/pathinfo.pl/p/info send-cgi
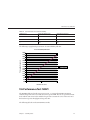
Using Performance Buckets
Performance buckets allow you to define buckets and link them to various server functions.
Every time one of these functions is invoked, the server collects statistical data and adds it to the
bucket. For example, send-cgi and service-j2ee are functions used to serve the CGI and Java
servlet requests respectively. You can either define two buckets to maintain separate counters
for CGI and servlet requests, or create one bucket that counts requests for both types of
dynamic content. The cost of collecting this information is minimal, and the impact on the
server performance is usually negligible. This information can later be accessed using perfdump.
The following information is stored in a bucket:
■
Name of the bucket. This name associates the bucket with a function.
■
Description. A description of the functions with which the bucket is associated.
■
Number of requests for this function. The total number of requests that caused this
function to be called.
■
Number of times the function was invoked. This number might not coincide with the
number of requests for the function, because some functions might be executed more than
once for a single request.
■
Function latency or the dispatch time. The time taken by the server to invoke the function.
■
Function time. The time spent in the function itself.
The default-bucket is predefined by the server. It records statistics for the functions not
associated with any user-defined bucket.
Chapter 1 • Performance and Monitoring Overview
35
Monitoring Server Performance
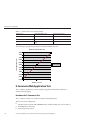
Configuration
You must specify all configuration information for performance buckets in the magnus.conf
and obj.conf files. Only the default-bucket is automatically enabled.
First, you must enable performance statistics collection and perfdump.
The following examples show how to define new buckets in magnus.conf:
Init fn="define-perf-bucket" name="acl-bucket" description="ACL bucket"
Init fn="define-perf-bucket" name="file-bucket" description="Non-cached responses"
Init fn="define-perf-bucket" name="cgi-bucket" description="CGI Stats"
The examples above create three buckets: acl-bucket, file-bucket, and cgi-bucket. To
associate these buckets with functions, add bucket=bucket-name to the obj.conf function for
which to measure performance.
Example
PathCheck fn="check-acl" acl="default" bucket="acl-bucket"
...
Service method="(GET|HEAD|POST)" type="*~magnus-internal/*"
fn="send-file" bucket="file-bucket"
...
<Object name="cgi">
ObjectType fn="force-type" type="magnus-internal/cgi"
Service fn="send-cgi" bucket="cgi-bucket"
</Object>
For more information, see “The bucket Parameter” in Sun Java System Web Server 7.0 Update 1
Administrator’s Configuration File Reference.
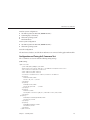
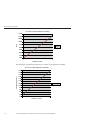
Performance Report
The server statistics in buckets can be accessed using perfdump. The performance buckets
information is located in the last section of the report returned by perfdump.
The report contains the following information:
36
■
Average, Total, and Percent columns give data for each requested statistic.
■
Request Processing Time is the total time required by the server to process all requests it
has received so far.
■
Number of Requests is the total number of requests for the function.
Sun Java System Web Server 7.0 Update 1 Performance Tuning, Sizing, and Scaling Guide •
Monitoring Server Performance
■
Number of Invocations is the total number of times that the function was invoked. This
differs from the number of requests in that a function could be called multiple times while
processing one request. The percentage column for this row is calculated in reference to the
total number of invocations for all of the buckets.
■
Latency is the time in seconds that Web Server takes to prepare for calling the function.
■
Function Processing Time is the time in seconds that Web Server spent inside the function.
The percentage of Function Processing Time and Total Response Time is calculated with
reference to the total Request Processing Time.
■
Total Response Time is the sum in seconds of Function Processing Time and Latency.
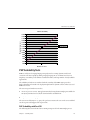
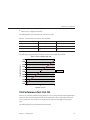
The following is an example of the performance bucket information available through
perfdump:
Performance Counters:
-----------------------------------------------Average
Total
Total number of requests:
Request processing time:
Percent
62647125
0.0343 2147687.2500
default-bucket (Default bucket)
Number of Requests:
62647125
Number of Invocations:
3374170785
Latency:
0.0008
47998.2500
Function Processing Time: 0.0335 2099689.0000
Total Response Time:
0.0343 2147687.2500
(100.00%)
(100.00%)
( 2.23%)
( 97.77%)
(100.00%)
Monitoring Current Activity Using the Java ES
Monitoring Console
The statistics available through the Web Server Admin Console and the command-line
interface are also available through the Java ES Monitoring Console. Though the information is
the same, it is presented in a different format, using the Common Monitoring Data Model
(CMM). Though this guide covers monitoring using tools available in the Web Server, you
could also monitor your server using the Java ES monitoring tools. For more information on
using the Java ES monitoring tools, see Sun Java Enterprise System 5 Monitoring Guide. Use the
same settings to tune the server, regardless of the what monitoring method you are using.
Chapter 1 • Performance and Monitoring Overview
37
38
2
C H A P T E R
2
Tuning Sun Java System Web Server
This chapter describes specific adjustments you can make that might improve Sun Java System
Web Server performance. It provides an overview of Web Server's connection-handling process
so that you can better understand the tuning settings. The chapter includes the following topics:
■
■
■
■
■
■
■
■
■
■
“General Tuning Tips” on page 39
“Understanding Threads, Processes, and Connections” on page 40
“Mapping Web Server 6.1 Tuning Parameters to Web Server 7.0” on page 46
“Using Monitoring Data to Tune Your Server” on page 48
“Tuning the ACL User Cache” on page 77
“Tuning Java Web Application Performance” on page 78
“Tuning CGI Stub Processes (UNIX/Linux)” on page 81
“Using find-pathinfo-forward” on page 82
“Using nostat” on page 82
“Using Busy Functions” on page 83
Note – Be very careful when tuning your server. Always back up your configuration files before
making any changes.
General Tuning Tips
As you tune your server, it is important to remember that your specific environment is unique.
The impacts of the suggestions provided in this guide will vary, depending on your specific
environment. Ultimately you must rely on your own judgement and observations to select the
adjustments that are best for you.
As you work to optimize performance, keep the following guidelines in mind:
■
Work methodically
As much as possible, make one adjustment at a time. Measure your performance before and
after each change, and rescind any change that doesn’t produce a measurable improvement.
39
Understanding Threads, Processes, and Connections
■
Adjust gradually
When adjusting a quantitative parameter, make several stepwise changes in succession,
rather than trying to make a drastic change all at once. Different systems face different
circumstances, and you might leap right past your system’s best setting if you change the
value too rapidly.
■
Start fresh
At each major system change, be it a hardware or software upgrade or deployment of a
major new application, review all previous adjustments to see whether they still apply. After
a Solaris upgrade, you should start over with an unmodified /etc/system file.
■
Stay informed
Read the Sun Java System Web Server 7.0 Update 1 Release Notes and the release notes for
your operating system whenever you upgrade your system. The release notes often provide
updated information about specific adjustments.
Understanding Threads, Processes, and Connections
Before tuning your server, you should understand the connection-handling process in Web
Server. This section includes the following topics:
■
■
■
■
“Connection-Handling Overview” on page 40
“Custom Thread Pools” on page 42
“The Native Thread Pool” on page 43
“Process Modes” on page 44
Connection-Handling Overview
In Web Server, acceptor threads on a listen socket accept connections and put them into a
connection queue. Request processing threads in a thread pool then pick up connections from
the queue and service the requests.
Acceptor
Threads
Connection
Queue
Request
Processing
Threads
Requests
Thread Pool
Web Server
FIGURE 2–1
40
Web Server Connection Handling
Sun Java System Web Server 7.0 Update 1 Performance Tuning, Sizing, and Scaling Guide •
Understanding Threads, Processes, and Connections
A request processing thread might also be instructed to send the request to a different thread
pool for processing. For example, if the request processing thread must perform some work that
is not thread-safe, it might be instructed to send part of the processing to the NativePool. Once
the NativePool completes its work, it communicates the result to the request processing thread
and the request processing thread continues processing the request.
At startup, the server only creates the number of threads defined in the thread pool minimum
threads, by default 16. As the load increases, the server creates more threads. The policy for
adding new threads is based on the connection queue state.
Each time a new connection is returned, the number of connections waiting in the queue (the
backlog of connections) is compared to the number of request processing threads already
created. If the number of connections waiting is greater than the number of threads, more
threads are scheduled to be added the next time a request completes.
The process of adding new session threads is strictly limited by the maximum threads value. For
more information on maximum threads, see “Maximum Threads (Maximum Simultaneous
Requests)” on page 58.
You can change the settings that affect the number and timeout of threads, processes, and
connections in the Admin Console, on the configuration's Performance tab (HTTP settings),
and on the HTTP listener. You can also use the wadm commands set-thread-pool-prop and
set-http-listener-prop and set-keep-alive-prop.
Low Latency and High Concurrency Modes
The server can run in one of two modes, depending upon the load. It changes modes to
accommodate the load most efficiently.
■
In low latency mode, for keep-alive connections, session threads themselves poll for new
requests.
■
In high concurrency mode, after finishing the request, session threads give the connection to
the keep-alive subsystem. In high concurrency mode, the keep-alive subsystem polls for new
requests for all keep-alive connections.
When the server is started, it starts in low latency mode. When the load increases, the server
moves to high concurrency mode. The decision to move from low latency mode to high
concurrency mode and back again is made by the server, based on connection queue length,
average total sessions, average idle sessions, and currently active and idle sessions.
Disabled Thread Pools
If a thread pool is disabled, no threads are created in the pool, no connection queue is created,
and no keep-alive threads are created. When the thread pool is disabled, the acceptor threads
themselves process the request.
Chapter 2 • Tuning Sun Java System Web Server
41
Understanding Threads, Processes, and Connections
Connection–Handling magnus.conf Directives for NSAPI
In addition to the settings discussed above, you can edit the following directives in the
magnus.conf file to configure additional request-processing settings for NSAPI plug-ins:
■
KernelThreads – Determines whether NSAPI plug-ins always run on kernel-scheduled
threads (Windows only)
■
TerminateTimeout – Determines the maximum amount of time to wait for NSAPI plug-ins
to finish processing requests when the server is shut down
For detailed information about these directives, see the Sun Java System Web Server 7.0
Update 1 Administrator’s Configuration File Reference.
Note – For the safest way to edit configuration files such as magnus.conf, use the wadm
commands get-config-file and set-config-file to pull a local copy for editing and push it
back to the Web Server. For more information on these commands, see the help for these
commands.
Custom Thread Pools
By default, the connection queue sends requests to the default thread pool. However, you can
also create your own thread pools in magnus.conf using a thread pool Init function. These
custom thread pools are used for executing NSAPI Service Application Functions (SAFs), not
entire requests.
If the SAF requires the use of a custom thread pool, the current request processing thread
queues the request, waits until the other thread from the custom thread pool completes the SAF,
then the request processing thread completes the rest of the request.
For example, the obj.conf file contains the following:
NameTrans fn="assign-name" from="/testmod" name="testmod" pool="my-custom-pool"
...
<Object name="testmod">
ObjectType fn="force-type" type="magnus-internal/testmod"
Service method=(GET|HEAD|POST) type="magnus-internal/testmod"
fn="testmod_service" pool="my-custom-pool2"
</Object>
In this example, the request is processed as follows:
1. The request processing thread (in this example, called A1) picks up the request and executes
the steps before the NameTrans directive.
2. If the URI starts with /testmod, the A1 thread queues the request to the my-custom-pool
queue. The A1 thread waits.
42
Sun Java System Web Server 7.0 Update 1 Performance Tuning, Sizing, and Scaling Guide •
Understanding Threads, Processes, and Connections
3. A different thread in my-custom-pool, called the B1 thread in this example, picks up the
request queued by A1. B1 completes the request and returns to the wait stage.
4. The A1 thread wakes up and continues processing the request. It executes the ObjectType
SAF and moves on to the Service function.
5. Because the Service function must be processed by a thread in my-custom-pool2, the A1
thread queues the request to my-custom-pool2.
6. A different thread in my-custom-pool2, called C1 in this example, picks up the queued
request. C1 completes the request and returns to the wait stage.
7. The A1 thread wakes up and continues processing the request.
In this example, three threads, A1, B1, and C1 work to complete the request.
Additional thread pools are a way to run thread-unsafe plug-ins. By defining a pool with a
maximum number of threads set to 1, only one request is allowed into the specified service
function. In the previous example, if testmod_service is not thread-safe, it must be executed
by a single thread. If you create a single thread in the my-custom-pool2, the SAF works in a
multi-threaded Web Server.
For more information on defining thread pools, see “thread-pool-init” in Sun Java System Web
Server 7.0 Update 1 Administrator’s Configuration File Reference.
The Native Thread Pool
On Windows, the native thread pool (NativePool) is used internally by the server to execute
NSAPI functions that require a native thread for execution.
Web Server uses Netscape Portable Runtime (NSPR), which is an underlying portability layer
providing access to the host OS services. This layer provides abstractions for threads that are
not always the same as those for the OS-provided threads. These non-native threads have lower
scheduling overhead, so their use improves performance. However, these threads are sensitive
to blocking calls to the OS, such as I/O calls. To make it easier to write NSAPI extensions that
can make use of blocking calls, the server keeps a pool of threads that safely support blocking
calls. These threads are usually native OS threads. During request processing, any NSAPI
function that is not marked as being safe for execution on a non-native thread is scheduled for
execution on one of the threads in the native thread pool.
If you have written your own NSAPI plug-ins such as NameTrans, Service, or PathCheck
functions, these execute by default on a thread from the native thread pool. If your plug-in
makes use of the NSAPI functions for I/O exclusively or does not use the NSAPI I/O functions
at all, then it can execute on a non-native thread. For this to happen, the function must be
loaded with a NativeThread="no" option, indicating that it does not require a native thread.
For example, add the following to the load-modules Init line in the magnus.conf file:
Chapter 2 • Tuning Sun Java System Web Server
43
Understanding Threads, Processes, and Connections
Init funcs="pcheck_uri_clean_fixed_init" shlib="C:/Sun/webserver7/lib/custom.dll"
fn="load-modules" NativeThread="no"
The NativeThread flag affects all functions in the funcs list, so if you have more than one
function in a library, but only some of them use native threads, use separate Init lines. If you set
NativeThread to yes, the thread maps directly to an OS thread.
For information on the load-modules function, see “load-modules” in Sun Java System Web
Server 7.0 Update 1 Administrator’s Configuration File Reference.
Process Modes
You can run Sun Java System Web Server in one of the following modes:
■
■
“Single-Process Mode” on page 44
“Multi-Process Mode” on page 44
Note – Multi-process mode is deprecated for Java technology-enabled servers. Most applications
are now multi-threaded, and multi-process mode is usually not needed. However,
multi-process mode can significantly improve overall server throughput for NSAPI
applications that do not implement fine-grained locking.
Single-Process Mode
In the single-process mode, the server receives requests from web clients to a single process.
Inside the single server process, acceptor threads are running that are waiting for new requests
to arrive. When a request arrives, an acceptor thread accepts the connection and puts the
request into the connection queue. A request processing thread picks up the request from the
connection queue and handles the request.
Because the server is multi-threaded, all NSAPI extensions written to the server must be
thread-safe. This means that if the NSAPI extension uses a global resource, like a shared
reference to a file or global variable, then the use of that resource must be synchronized so that
only one thread accesses it at a time. All plug-ins provided with the Web Server are thread-safe
and thread-aware, providing good scalability and concurrency. However, your legacy
applications might be single-threaded. When the server runs the application, it can only execute
one at a time. This leads to server performance problems when put under load. Unfortunately,
in the single-process design, there is no real workaround.
Multi-Process Mode
You can configure the server to handle requests using multiple processes with multiple threads
in each process. This flexibility provides optimal performance for sites using threads, and also
provides backward compatibility to sites running legacy applications that are not ready to run
in a threaded environment. Because applications on Windows generally already take advantage
of multi-thread considerations, this feature applies to UNIX and Linux platforms.
44
Sun Java System Web Server 7.0 Update 1 Performance Tuning, Sizing, and Scaling Guide •
Understanding Threads, Processes, and Connections
The advantage of multiple processes is that legacy applications that are not thread-aware or
thread-safe can be run more effectively in Sun Java System Web Server. However, because all of
the Sun Java System extensions are built to support a single-process threaded environment, they
might not run in the multi-process mode. The Search plug-ins fail on startup if the server is in
multi-process mode, and if session replication is enabled, the server will fail to start in
multi-process mode.
In the multi-process mode, the server spawns multiple server processes at startup. Each process
contains one or more threads (depending on the configuration) that receive incoming requests.
Since each process is completely independent, each one has its own copies of global variables,
caches, and other resources. Using multiple processes requires more resources from your
system. Also, if you try to install an application that requires shared state, it has to synchronize
that state across multiple processes. NSAPI provides no helper functions for implementing
cross-process synchronization.
When you specify a MaxProcs value greater than 1, the server relies on the operating system to
distribute connections among multiple server processes (see “MaxProcs (UNIX/Linux)” on
page 45 for information about the MaxProcs directive). However, many modern operating
systems do not distribute connections evenly, particularly when there are a small number of
concurrent connections.
Because Sun Java System Web Server cannot guarantee that load is distributed evenly among
server processes, you might encounter performance problems if you set Maximum Threads to 1
and MaxProcs greater than 1 to accommodate a legacy application that is not thread-safe. The
problem is especially pronounced if the legacy application takes a long time to respond to
requests (for example, if the legacy application contacts a back-end database). In this scenario, it
might be preferable to use the default value for Maximum Threads and serialize access to the
legacy application using thread pools. For more information about creating a thread pool, see
“thread-pool-init” in Sun Java System Web Server 7.0 Update 1 Administrator’s Configuration
File Reference.
If you are not running any NSAPI in your server, you should use the default settings: one
process and many threads. If you are running an application that is not scalable in a threaded
environment, you should use a few processes and many threads, for example, 4 or 8 processes
and 128 or 512 threads per process.
MaxProcs (UNIX/Linux)
To run a UNIX or Linux server in multi-process mode, set the MaxProcs directive to a value
that is greater than 1. Multi-process mode might provide higher scalability on multi-processor
machines and improve the overall server throughput on large systems such as the Sun FireTM
T2000 server. If you set the value to less than 1, it is ignored and the default value of 1 is used.
Use the MaxProcs directive to improve overall server throughput for the following types of
applications:
■
NSAPI applications that do not implement fine-grained locking
Chapter 2 • Tuning Sun Java System Web Server
45
Mapping Web Server 6.1 Tuning Parameters to Web Server 7.0
■
Java applications that do not require session management
Do not use the MaxProcs directive when the Sun Java System Web Server performs session
management for Java applications.
You can set the value for MaxProcs by editing the MaxProcs parameter in magnus.conf.
Note – You will receive duplicate startup messages when running your server in MaxProcs mode.
Mapping Web Server 6.1 Tuning Parameters to Web Server 7.0
Many of the tuning parameters that were tunable by editing the magnus.conf and nsfc.conf
files in Web Server 6.1 have moved to the server.xml file. These tuning parameters are now
tunable through the Admin Console and command-line interface. The following table shows
selected tuning parameters, including the Web Server 6.1 parameter, the new server.xml
element used for tuning, and the way to change the parameters through the user interface.
Editing the server.xml file directly can be error-prone, so using the user interface to set values
is preferable. For a complete list of all elements in server.xml, see Chapter 3, “Elements in
server.xml,” in Sun Java System Web Server 7.0 Update 1 Administrator’s Configuration File
Reference.
TABLE 2–1
46
Parameter Mapping to server.xml
Web Server 6.1 parameter
Web Server 7.0 server.xml
element or attribute
AcceptTimeout in
magnus.conf
io-timeout element of
the http element
ACLGroupCacheSize in
magnus.conf
max-groups-per-user
Configuration's
element of the acl-cache Performance tab ⇒
element
Cache Settings page
set-acl-cache-prop
command's
max-groups-per-user
property
ACLUserCacheSize in
magnus.conf
max-users element of the Configuration's
acl-cache element
Performance tab ⇒
Cache Settings page
set-acl-cache-prop
command's max-users
property
ConnQueueSize in
magnus.conf
queue-size element of
Configuration's
the thread-pool element Performance tab ⇒
HTTP tab
set-thread-pool-prop
command's queue-size
property
dns-cache-init Init SAF
enabled element of the
dns-cache element
set-dns-cache-prop
command's enabled
property
Admin Console Location
wadm command
Configuration's
Performance tab ⇒
HTTP Settings page
set-http-prop
command's io-timeout
property
Configuration's
Performance tab ⇒
DNS tab
Sun Java System Web Server 7.0 Update 1 Performance Tuning, Sizing, and Scaling Guide •
Mapping Web Server 6.1 Tuning Parameters to Web Server 7.0
TABLE 2–1
Parameter Mapping to server.xml
(Continued)
Web Server 6.1 parameter
Web Server 7.0 server.xml
element or attribute
dns-cache-init Init SAF
cache size
Admin Console Location
wadm command
max-entries element of
the dns-cache element
Configuration's
Performance tab ⇒
DNS tab
set-dns-cache-prop
command's max-entries
property
FileCacheEnabled in
nsfc.conf
enabled element of the
file-cache element
Configuration's
Performance tab ⇒
Cache tab
set-file-cache-prop
command's enabled
property
KeepAliveThreads in
magnus.conf
threads element of the
keep-alive element
Configuration's
Performance tab ⇒
HTTP tab
set-keep-alive-prop
command's threads
property
KeepAliveTimeout in
magnus.conf
timout element of the
keep-alive element
Configuration's
Performance tab ⇒
HTTP tab
set-keep-alive-prop
command's timeout
property
KernelThreads in
magnus.conf (Windows only)
Unchanged
ListenQ in magnus.conf
listen-queue-size
element of the
http-listener element
Configuration's
HTTP Listeners tab
set-http-listener-prop
command's
listen-queue-size
LogVerbose in magnus.conf
log-level element of the Configuration's
log element
General Tab ⇒ Log
Settings
set-error-log-prop
command's log-level
property
MaxAge in nsfc.conf file
max-age element of the
file-cache element
Configuration's
Performance tab ⇒
Cache tab
set-file-cache-prop
command's max-age
property
MaxFiles in nsfc.conf file
max-entries element of
the file-cache element
Configuration's
Performance tab ⇒
Cache tab
set-file-cache-prop
command's max-entries
property
MaxKeepAliveConnections in
magnus.conf
max-connections
element of the
keep-alive element
Configuration's
Performance tab ⇒
HTTP tab
set-keep-alive-prop
command's
max-connections
property
MaxProcs in magnus.conf
Deprecated for Java
technology-enabled
servers
NativePoolMaxThreads in
magnus.conf
Unchanged
NativePoolMinThreads in
magnus.conf
Unchanged
Chapter 2 • Tuning Sun Java System Web Server
47
Using Monitoring Data to Tune Your Server
TABLE 2–1
Parameter Mapping to server.xml
Web Server 6.1 parameter
(Continued)
Web Server 7.0 server.xml
element or attribute
Admin Console Location
wadm command
NativePoolQueueSize in
magnus.conf
Unchanged
NativePoolStackSize in
magnus.conf
Unchanged
RqThrottle in magnus.conf
max-threads element of Configuration's
the thread-pool element Performance tab ⇒
HTTP tab
set-thread-pool-prop
command's max-threads
property
RqThrottleMin in
magnus.conf
min-threads element of Configuration's
the thread-pool element Performance tab ⇒
HTTP tab
set-thread-pool-prop
command's min-threads
property
TerminateTimeout in
magnus.conf
Unchanged
Using Monitoring Data to Tune Your Server
This section describes the performance information available through the Admin Console,
perfdump, the command-line interface, and stats-xml. It discusses how to analyze that
information and tune some parameters to improve your server’s performance.
The default tuning parameters are appropriate for all sites except those with very high volume.
The only settings that large sites might regularly need to change are the thread pool and keep
alive settings. Tune these settings at the configuration level in the Admin Console or using wadm
commands. It is also possible to tune the server by editing the elements directly in the
server.xml file, but editing the server.xml file directly can lead to complications.
perfdump monitors statistics in the following categories, which are described in the following
sections. In most cases these statistics are also displayed in the Admin Console, command-line
interface, and stats-xml output. The following sections contain tuning information for all
these categories, regardless of what method you are using to monitor the data:
■
■
■
■
■
■
■
“Connection Queue Information” on page 49
“HTTP Listener (Listen Socket) Information” on page 51
“Keep-Alive Information” on page 53
“Session Creation (Thread) Information” on page 57
“File Cache Information (Static Content)” on page 59
“Thread Pool Information” on page 65
“DNS Cache Information” on page 68
In addition, the statistics information displayed through the Admin Console, the
command-line interface, and stats-xml contains other categories not contained in the
perfdump output. Tuning these statistics is discussed in the following sections:
48
Sun Java System Web Server 7.0 Update 1 Performance Tuning, Sizing, and Scaling Guide •
Using Monitoring Data to Tune Your Server
■
■
■
“Java Virtual Machine (JVM) Information” on page 70
“Web Application Information” on page 71
“JDBC Resource Information” on page 72
Once you have viewed the statistics you need, you can tune various aspects of your server’s
performance at the configuration level using the Admin Console's Performance tab. The Admin
Console Performance tab includes settings for many performance categories, including:
■
■
■
■
■
■
HTTP Settings (includes Thread Pool and Keep Alive)
DNS Settings
SSL and TLS Settings
Cache Settings
CGI Settings
Access Log Buffer Settings
You can also view and set tuning parameters using the appropriate wadm commands. In general,
when you set tuning properties using wadm commands, the names of the properties are the same
as displayed in stats.xml.
Connection Queue Information
In Web Server, a connection is first accepted by acceptor threads associated with the HTTP
listener. The acceptor threads accept the connection and put it into the connection queue.
Then, request processing threads take the connection in the connection queue and process the
request. For more information, see “Connection-Handling Overview” on page 40.
Connection queue information shows the number of sessions in the connection queue, and the
average delay before the connection is accepted by the request processing thread.
The following is an example of how these statistics are displayed in perfdump:
ConnectionQueue:
----------------------------------------Current/Peak/Limit Queue Length
Total Connections Queued
Average Queue Length (1, 5, 15 minutes)
Average Queueing Delay
0/1853/160032
11222922
90.35, 89.64, 54.02
4.80 milliseconds
The same information is displayed in a different format through the Admin Console or
command-line interface, with some slight differences. The following table shows the
information as displayed in the Admin Console when accessing monitoring information for the
server instance:
Chapter 2 • Tuning Sun Java System Web Server
49
Using Monitoring Data to Tune Your Server
TABLE 2–2
Connection Queue Statistics
Present Number of Connections Queued
0
Total Number of Connections Queued
11222922
Average Connections Over Last 1 Minute
90.35
Average Connections Over Last 5 Minutes
89.64
Average Connections Over Last 15 Minutes
54.02
Maximum Queue Size
160032
Peak Queue Size
1853
Number of Connections Overflowed
0
Ticks Spent
5389284274
Total Number of Connections Added
425723
Current /Peak /Limit Queue Length
Current/Peak/Limit queue length shows, in order:
■
The number of connections currently in the queue.
■
The largest number of connections that have been in the queue simultaneously.
■
The maximum size of the connection queue. This number is:
Maximum Queue Size = Thread Pool Queue Size + Maximum Threads + Keep-Alive Queue
Size
Once the connection queue is full, new connections are dropped.
Tuning
If the peak queue length (maximum queue size) is close to the limit, you can increase the
maximum connection queue size to avoid dropping connections under heavy load.
You can increase the maximum connection queue size in the Admin Console by changing the
value of the thread pool Queue Size field on the configuration's Performance tab ⇒ HTTP sub
tab. The default is 1024.
To change the queue size using the command-line interface, use the wadm
set-thread-pool-prop command's queue-size property.
Total Connections Queued
Total Connections Queued is the total number of times a connection has been queued. This
number includes newly-accepted connections and connections from the keep-alive system.
50
Sun Java System Web Server 7.0 Update 1 Performance Tuning, Sizing, and Scaling Guide •
Using Monitoring Data to Tune Your Server
This setting is not tunable.
Average Queue Length
The Average Queue Length shows the average number of connections in the queue over the last
one-minute, five-minute, and 15–minute intervals.
This setting is not tunable.
Average Queuing Delay
The Average Queueing Delay is the average amount of time a connection spends in the
connection queue. This represents the delay between when a request connection is accepted by
the server and when a request processing thread begins servicing the request. It is the Ticks
Spent divided by the Total Connections Queued, and converted to milliseconds.
This setting is not tunable.
Ticks Spent
A tick is a system-dependent value and provided by the tickPerSecond attribute of the server
element in stats.xml. The ticks spent value is the total amount of time that connections spent
in the connection queue and is used to calculate the average queueing delay.
This setting is not tunable.
Total Number of Connections Added
The new connections added to the connection queue. This setting is not tunable.
HTTP Listener (Listen Socket) Information
The following HTTP listener information includes the IP address, port number, number of
acceptor threads, and the default virtual server. For tuning purposes, the most important field in
the HTTP listener information is the number of acceptor threads.
You can have many HTTP listeners enabled for virtual servers, but at least one is enabled for
your default server instance (usually http://0.0.0.0:80). The monitoring information
available through the Admin Console does not show the HTTP listener information, because
that information is available in the Admin Console on the configuration's HTTP Listeners tab.
The following is an example of how the HTTP listeners information appears in perfdump:
ListenSocket ls1:
-----------------------Address
https://0.0.0.0:2014
Acceptor Threads
1
Default Virtual Server
https-test
Chapter 2 • Tuning Sun Java System Web Server
51
Using Monitoring Data to Tune Your Server
If you have created multiple HTTP listeners, perfdump displays all of them.
To edit an HTTP listener using the Admin Console, for the configuration, select the HTTP
Listeners tab. Click the listener name to edit the listener.
To configure an HTTP listener using the command-line interface, use the command wadm
set-http-listener-prop.
For more information about adding and editing listen sockets, see the Sun Java System Web
Server 7.0 Update 1 Administrator’s Guide.
Address
The Address field contains the base address on which this listen socket is listening. A host can
have multiple network interfaces and multiple IP addresses. The address contains the IP
address and the port number.
If your listen socket listens on all network interfaces for the host machine, the IP part of the
address is 0.0.0.0.
Tuning
This setting is tunable when you edit an HTTP listener. If you specify an IP address other than
0.0.0.0, the server makes one less system call per connection. Specify an IP address other than
0.0.0.0 for best possible performance.
Acceptor Threads
Acceptor threads are threads that wait for connections. The threads accept connections and put
them in a queue where they are then picked up by worker threads. For more information, see
“Connection-Handling Overview” on page 40.
Ideally, you want to have enough acceptor threads so that there is always one available when a
user needs one, but few enough so that they do not provide too much of a burden on the system.
A good rule is to have one acceptor thread per CPU on your system. You can increase this value
to about double the number of CPUs if you find indications of TCP/IP listen queue overruns.
Tuning
This setting is tunable when you edit an HTTP listener. The default value is 1.
Other HTTP listener settings that affect performance are the size of the send buffer and receive
buffer. For more information regarding these buffers, see your operating system
documentation.
52
Sun Java System Web Server 7.0 Update 1 Performance Tuning, Sizing, and Scaling Guide •
Using Monitoring Data to Tune Your Server
Default Virtual Server
Virtual servers work using the HTTP 1.1 Host header. If the end user’s browser does not send
the Host header, or if the server cannot find the virtual server specified by the Host header, Web
Server handles the request using a default virtual server. You can configure the default virtual
server to send an error message or serve pages from a special document root.
Tuning
This setting is tunable when you edit an HTTP listener.
Keep-Alive Information
This section provides information about the server’s HTTP-level keep-alive system.
Note – The name keep alive should not be confused with TCP keep-alives. Also, note that the
name keep-alive was changed to PersistentConnections in HTTP 1.1, but Web Server
continues to refer to them as keep-alive connections.
The following example shows the keep-alive statistics displayed by perfdump:
KeepAliveInfo:
-------------------KeepAliveCount
KeepAliveHits
KeepAliveFlushes
KeepAliveRefusals
KeepAliveTimeouts
KeepAliveTimeout
198/200
0
0
56844280
365589
10 seconds
The following table shows the keep-alive statistics displayed in the Admin Console:
TABLE 2–3
Keep-Alive Statistics
Number of Connections Processed
0
Total Number of Connections Added
198
Maximum Connection Size
200
Number of Connections Flushed
0
Number of Connections Refused
56844280
Number of Idle Connections Closed
365589
Chapter 2 • Tuning Sun Java System Web Server
53
Using Monitoring Data to Tune Your Server
TABLE 2–3
Keep-Alive Statistics
(Continued)
Connection Timeout
10
Both HTTP 1.0 and HTTP 1.1 support the ability to send multiple requests across a single
HTTP session. A web server can receive hundreds of new HTTP requests per second. If every
request was allowed to keep the connection open indefinitely, the server could become
overloaded with connections. On UNIX and Linux systems, this could lead to a file table
overflow very easily.
To deal with this problem, the server maintains a counter for the maximum number of waiting
keep-alive connections. A waiting keep-alive connection has fully completed processing the
previous request, and is now waiting for a new request to arrive on the same connection. If the
server has more than the maximum waiting connections open when a new connection waits for
a keep-alive request, the server closes the oldest connection. This algorithm keeps an upper
bound on the number of open waiting keep-alive connections that the server can maintain.
Sun Java System Web Server does not always honor a keep-alive request from a client. The
following conditions cause the server to close a connection, even if the client has requested a
keep-alive connection:
■
The keep alive timeout is set to 0.
■
The keep alive maximum connections count is exceeded.
■
Dynamic content, such as a CGI, does not have an HTTP content-length header set. This
applies only to HTTP 1.0 requests. If the request is HTTP 1.1, the server honors keep-alive
requests even if the content-length is not set. The server can use chunked encoding for
these requests if the client can handle them (indicated by the request header
transfer-encoding: chunked).
■
The request is not HTTP GET or HEAD.
■
The request was determined to be bad. For example, if the client sends only headers with no
content.
The keep-alive subsystem in Web Server is designed to be massively scalable. The
out-of-the-box configuration can be less than optimal if the workload is non-persistent (that is,
HTTP 1.0 without the KeepAlive header), or for a lightly loaded system that’s primarily
servicing keep-alive connections.
Keep-Alive Count
This section in perfdump has two numbers:
54
■
Number of connections in keep-alive mode (total number of connections added)
■
Maximum number of connections allowed in keep-alive mode simultaneously (maximum
connection size)
Sun Java System Web Server 7.0 Update 1 Performance Tuning, Sizing, and Scaling Guide •
Using Monitoring Data to Tune Your Server
Tuning
You can tune the maximum number of connections that the server allows to wait at one time
before closing the oldest connection in the Admin Console by editing the Maximum
Connections field on the configuration's Performance tab ⇒ HTTP tab, under Keep Alive
Settings. The default is 200. In the command-line interface, use the max-connections property
in the wadm set-keep-alive-prop command.
Note – The number of connections specified by the maximum connections setting is divided
equally among the keep-alive threads. If the maximum connections setting is not equally
divisible by the keep-alive threads setting, the server might allow slightly more than the
maximum number of simultaneous keep-alive connections.
Keep-Alive Hits
The keep-alive hits (number of connections processed) is the number of times a request was
successfully received from a connection that had been kept alive.
This setting is not tunable.
Keep-Alive Flushes
The number of times the server had to close a connection because the total number of
connections added exceeded the keep-alive maximum connections setting. The server does not
close existing connections when the keep-alive count exceeds the maximum connection size.
Instead, new keep-alive connections are refused and the number of connections refused count
is incremented.
Keep-Alive Refusals
The number of times the server could not hand off the connection to a keep-alive thread,
possibly due to too many persistent connections (or when total number of connections added
exceeds the keep-alive maximum connections setting). The suggested tuning is to increase the
keep-alive maximum connections.
Keep-Alive Timeouts
The number of times the server closed idle keep-alive connections as the client connections
timed out without any activity. This statistic is useful to monitor; no specific tuning is advised.
Keep-Alive Timeout
The time (in seconds) before idle keep-alive connections are closed. Set this value in the Admin
Console in the Timeout field on the configuration's Performance tab ⇒ HTTP tab, under Keep
Alive Settings. The default is 30 seconds, meaning the connection times out if idle for more than
30 seconds. The maximum is 3600 seconds (60 minutes). In the command-line interface, use
the timeout property in the wadm set-keep-alive-prop command.
Chapter 2 • Tuning Sun Java System Web Server
55
Using Monitoring Data to Tune Your Server
Keep-Alive Poll Interval
The keep-alive poll interval specifies the interval (in seconds) at which the system polls
keep-alive connections for further requests. The default is 0.001 second, the lowest value
allowed. It is set to a low value to enhance performance at the cost of CPU usage.
To tune the poll interval, edit the Poll Interval field on the configuration's Performance tab ⇒
HTTP tab, under Keep Alive Settings. In the command-line interface, use the poll-interval
property in the wadm set-keep-alive-prop command.
Keep-Alive Threads
You can configure the number of threads used in the keep-alive system in the Admin Console
by editing the Threads field on the configuration's Performance tab ⇒ HTTP tab, under Keep
Alive Settings. The default is 1. In the command-line interface, use the threads property in the
wadm set-keep-alive-prop command.
Tuning for HTTP 1.0-Style Workload
Since HTTP 1.0 results in a large number of new incoming connections, the default acceptor
threads of 1 per listen socket would be suboptimal. Increasing this to a higher number should
improve performance for HTTP 1.0-style workloads. For instance, for a system with 2 CPUs,
you might want to set it to 2. You might also want to reduce the keep-alive connections, for
example, to 0.
HTTP 1.0-style workloads would have many connections established and terminated.
If users are experiencing connection timeouts from a browser to Web Server when the server is
heavily loaded, you can increase the size of the HTTP listener backlog queue by setting the
HTTP listener listen queue size to a larger value, such as 8192.
The HTTP listener listen queue specifies the maximum number of pending connections on a
listen socket. Connections that time out on a listen socket whose backlog queue is full fail.
Tuning for HTTP 1.1-Style Workload
In general, it is a trade-off between throughput and latency while tuning server-persistent
connection handling. The keep-alive poll interval and timeout control latency. Lowering the
value of these settings is intended to lower latency on lightly loaded systems (for example,
reduce page load times). Increasing the values of these settings is intended to raise aggregate
throughput on heavily loaded systems (for example, increase the number of requests per second
the server can handle). However, if there's too much latency and too few clients, aggregate
throughput suffers as the server sits idle unnecessarily. As a result, the general keep-alive
subsystem tuning rules at a particular load are as follows:
■
■
56
If there's idle CPU time, decrease the poll interval.
If there's no idle CPU time, increase the poll interval.
Sun Java System Web Server 7.0 Update 1 Performance Tuning, Sizing, and Scaling Guide •
Using Monitoring Data to Tune Your Server
Also, chunked encoding could affect the performance for HTTP 1.1 workload. Tuning the
response buffer size could positively affect the performance. A higher response buffer size in the
configuration's Performance tab ⇒ HTTP tab would result in sending a Content-length:
header, instead of chunking the response. To set the buffer size using the CLI, use the wadm
set-http-prop command's output-buffer-size property.
You can also set the buffer size for a Service-class function in the obj.conf file, using the
UseOutputStreamSize parameter. UseOutputStreamSize overrides the value set using the
output-buffer-size property. If UseOutputStreamSize is not set, Web Server uses the
output-buffer-size setting. If the output-buffer-size is not set, Web Server uses the
output-buffer-size default value of 8192.
The following example shows using the CLI to increase the output buffer size, then deploying
the configuration (used if UseOutputStreamSize is not specified in obj.conf):
./wadm set-http-prop --user=admin-user --password-file=admin-password-file
--config=config-name output-buffer-size=16384
./wadm deploy-config --user=admin-user --password-file=admin-password-file
--config=config-name
The following example shows setting the buffer size for the nsapi_test Service function:
<Object name="nsapitest">
ObjectType fn="force-type" type="magnus-internal/nsapitest"
Service method=(GET) type="magnus-internal/nsapitest" fn="nsapi_test"
UseOutputStreamSize=12288
</Object>
Session Creation (Thread) Information
Session (thread) creation statistics are displayed in perfdump as follows:
SessionCreationInfo:
-----------------------Active Sessions
128
Keep-Alive Sessions
0
Total Sessions Created
128/128
Active Sessions shows the number of sessions (request processing threads) currently
servicing requests.
Keep-Alive Sessions shows the number of HTTP request processing threads serving
keep-alive sessions.
Total Sessions Created in perfdump shows both the number of sessions that have been
created and the maximum threads.
Chapter 2 • Tuning Sun Java System Web Server
57
Using Monitoring Data to Tune Your Server
The equivalent information as the Total Number of Threads is available through the Admin
Console from the Monitoring tab ⇒ Instances sub tab, under General Statistics. To see the
maximum threads allowed, see the Maximum Threads field on the configuration's Performance
tab ⇒ HTTP sub tab, under Thread Pool Settings.
To get the equivalent of the perfdump Active Sessions, you can subtract the Number of Idle
Threads from the Total Number of Threads.
Maximum Threads (Maximum Simultaneous Requests)
The maximum threads setting specifies the maximum number of simultaneous transactions
that the Web Server can handle. The default value is 128. Changes to this value can be used to
throttle the server, minimizing latencies for the transactions that are performed. The Maximum
Threads value acts across multiple virtual servers, but does not attempt to load balance. It is set
for each configuration.
Reaching the maximum number of configured threads is not necessarily undesirable, and you
do not need to automatically increase the number of threads in the server. Reaching this limit
means that the server needed this many threads at peak load, but as long as it was able to serve
requests in a timely manner, the server is adequately tuned. However, at this point connections
queue up in the connection queue, potentially overflowing it. If you monitor your server's
performance regularly and notice that total sessions created number is often near the maximum
number of threads, you should consider increasing your thread limits.
To compute the number of simultaneous requests, the server counts the number of active
requests, adding one to the number when a new request arrives, subtracting one when it finishes
the request. When a new request arrives, the server checks to see if it is already processing the
maximum number of requests. If it has reached the limit, it defers processing new requests until
the number of active requests drops below the maximum amount.
In theory, you could set the maximum threads to 1 and still have a functional server. Setting this
value to 1 would mean that the server could only handle one request at a time, but since HTTP
requests for static files generally have a very short duration (response time can be as low as 5
milliseconds), processing one request at a time would still allow you to process up to 200
requests per second.
However, in actuality, Internet clients frequently connect to the server and then do not
complete their requests. In these cases, the server waits 30 seconds or more for the data before
timing out. You can define this timeout period using the IO Timeout setting on the
configuration's Performance tab ⇒ HTTP Settings page. You can also use the command wadm
set-http-prop and set the io-timeout property. The default value is 30 seconds. By setting it
to less than the default you can free up threads sooner, but you might also disconnect users with
slower connections. Also, some sites perform heavyweight transactions that take minutes to
complete. Both of these factors add to the maximum simultaneous requests that are required. If
your site is processing many requests that take many seconds, you might need to increase the
number of maximum simultaneous requests.
58
Sun Java System Web Server 7.0 Update 1 Performance Tuning, Sizing, and Scaling Guide •
Using Monitoring Data to Tune Your Server
Suitable maximum threads values range from 100-500, depending on the load. Maximum
Threads represents a hard limit for the maximum number of active threads that can run
simultaneously, which can become a bottleneck for performance. The default value is 128.
The thread pool minimum threads is the minimum number of threads the server initiates upon
startup. The default value is 16.
Note – When configuring Web Server to be used with the Solaris Network Cache and
Accelerator (SNCA), setting the maximum threads and the queue size to 0 provides better
performance. Because SNCA manages the client connections, it is not necessary to set these
parameters. These parameters can also be set to 0 with non-SNCA configurations, especially for
cases in which short latency responses with no keep-alives must be delivered. It is important to
note that the maximum threads and queue size must both be set to 0.
For information about using SNCA, see “Using the Solaris Network Cache and Accelerator
(SNCA)” on page 91.
Tuning
You can increase your thread limits in the Admin Console by editing the Maximum Threads
field on the configuration's Performance tab ⇒ HTTP tab, under Thread Pool Settings. In the
command-line interface, use the wadm set-thread-pool-prop command's max-threads
property. The default is 128.
File Cache Information (Static Content)
The cache information section provides statistics on how your file cache is being used. The file
cache caches static content so that the server handles requests for static content quickly. The file
cache contains information about files and static file content. The file cache also caches
information that is used to speed up processing of server-parsed HTML. For servlets and JSPs,
other kinds of caching are used.
For sites with scheduled updates to content, consider shutting down the cache while the content
is being updated, and starting it again after the update is complete. Although performance slows
down, the server operates normally when the cache is off.
For performance reasons, Web Server caches as follows:
■
For small files, it caches the content in memory (heap).
■
For large files, it caches the open file descriptors (to avoid opening and closing files).
The following is an example of how the cache statistics are displayed in perfdump:
CacheInfo:
-----------------File Cache Enabled
yes
Chapter 2 • Tuning Sun Java System Web Server
59
Using Monitoring Data to Tune Your Server
File Cache Entries
File Cache Hit Ratio
Maximum Age
Accelerator Entries
Acceleratable Requests
Acceleratable Responses
Accelerator Hit Ratio
141/1024
652/664 (
30
120/1024
281/328 (
131/144 (
247/281 (
98.19%)
85.67%)
90.97%)
87.90%)
The following table shows the file cache statistics as displayed in the Admin Console:
TABLE 2–4
File Cache Statistics
Total Cache Hits
46
Total Cache Misses
52
Total Cache Content Hits
0
Number of File Lookup Failures
9
Number of File Information Lookups
37
Number of File Information Lookup Failures
50
Number of Entries
12
Maximum Cache Size
1024
Number of Open File Entries
0
Number of Maximum Open Files Allowed
1024
Heap Size
36064
Maximum Heap Cache Size
10735636
Size of Memory Mapped File Content
0
Maximum Memory Mapped File Size
0
Maximum Age of Entries
30
Accelerator Entries
The number of files that have been cached in the accelerator cache.
Tuning
You can increase the maximum number of accelerator cache entries by increasing the number
of file cache entries as described in “File Cache Entries” on page 62. Note that this number will
typically be smaller than the File Cache Entries number because the accelerator cache only
caches information about files and not directories. If the number is significantly lower than the
60
Sun Java System Web Server 7.0 Update 1 Performance Tuning, Sizing, and Scaling Guide •
Using Monitoring Data to Tune Your Server
File Cache Entries number, you can improve the accelerator cache utilization by following the
tuning information described in “Acceleratable Requests” on page 61 and “Acceleratable
Responses” on page 61.
Acceleratable Requests
The number of client requests that were eligible for processing by the accelerator cache. Only
simple GET requests are processed by the accelerator cache. The accelerator cache does not
process requests that explicitly disable caching, for example, requests sent when a user clicks
Reload in the browser and requests that include a query string, that is, requests for URLs that
include a ? character.
Tuning
To maximize the number of acceleratable requests, structure your web sites to use static files
when possible and avoid using query strings in requests for static files.
Acceleratable Responses
The number of times the response to an acceleratable request was eligible for addition to the
accelerator cache.
Tuning
When the server serves a static file from the file cache, the accelerator cache may be able to cache
the response for faster processing on subsequent requests. To maximize performance, you
should maximize the number of responses that are acceleratable. In the default configuration,
all responses to requests for static files can be cached in the accelerator cache. The following
configuration changes may prevent a response from being acceleratable:
■
ACLs that deny read access
■
Additional directives in the default object of the obj.conf file, including third party plug-ins
■
Using <Client> or <If> in the default object of the obj.conf file
■
Custom access log formats
■
Java Servlet filters
To maximize the number of responses that are acceleratable, avoid such configurations.
Accelerator Hit Ratio
The number of times the response for an acceleratable request was found in the accelerator
cache.
Chapter 2 • Tuning Sun Java System Web Server
61
Using Monitoring Data to Tune Your Server
Tuning
Higher hit ratios result in better performance. To maximize the hit ratio, see the tuning
information for “Acceleratable Responses” on page 61.
File Cache Enabled
If the cache is disabled, the rest of this section is not displayed in perdump. In the Admin
Console, the File Cache Statistics section shows zeros for the values.
Tuning
The cache is enabled by default. You can disable it in the Admin Console by deselecting the File
Cache Enabled box on the configuration's Performance tab ⇒ Cache sub tab, under File Cache.
To disable it using the command-line-interface, use wadm set-file-cache-prop and set the
enabled property to false.
File Cache Entries
The number of current cache entries and the maximum number of cache entries are both
displayed in perfdump. In the Admin Console, they are called the Number of Entries and the
Maximum Cache Size. A single cache entry represents a single URI.
Tuning
You can set the maximum number of cached entries in the Admin Console in the Maximum
Entries field on the configuration's Performance tab ⇒ Cache tab, under File Cache. In the
command-line interface, use wadm set-file-cache-prop and set the max-entries property.
The default is 1024. The range of values is 1-1048576.
File Cache Hit Ratio (Cache Hits / Cache Lookups)
The hit ratio available through perfdump gives you the number of file cache hits compared to
cache lookups. Numbers approaching 100% indicate that the file cache is operating effectively,
while numbers approaching 0% could indicate that the file cache is not serving many requests.
To figure this number yourself using the statistics provided through the Admin Console, divide
the Total Cache Hits by the sum of the Total Cache Hits and the Total Cache Misses.
This setting is not tunable.
Maximum Age
This field displays the maximum age of a valid cache entry. The parameter controls how long
cached information is used after a file has been cached. An entry older than the maximum age is
replaced by a new entry for the same file.
62
Sun Java System Web Server 7.0 Update 1 Performance Tuning, Sizing, and Scaling Guide •
Using Monitoring Data to Tune Your Server
Tuning
Set the maximum age based on whether the content is updated (existing files are modified) on a
regular schedule. For example, if content is updated four times a day at regular intervals, you
could set the maximum age to 21600 seconds (6 hours). Otherwise, consider setting the
maximum age to the longest time you are willing to serve the previous version of a content file
after the file has been modified. If your web site’s content changes infrequently, you might want
to increase this value for improved performance.
Set the maximum age in the Admin Console in the Maximum Age field on the configuration's
Performance tab ⇒ Cache tab, under File Cache. In the command-line interface, use wadm
set-file-cache-prop and change the max-age property. The default value is 30 seconds. The
range of values is 0.001-3600.
Maximum Heap Cache Size
The optimal cache heap size depends upon how much system memory is free. A larger heap size
means that the Web Server can cache more content and therefore get a better hit ratio.
However, the heap size should not be so large that the operating system starts paging cached
files.
Tuning
Set the maximum heap size in the Admin Console in the Maximum Heap Space Size field on the
configuration's Performance tab ⇒ Cache tab, under File Cache. In the command-line
interface, use wadm set-file-cache-prop and change the max-heap-space property. The
default value is 10485760 bytes. The range of values is 0-9223372036854775807. In a 32–bit
Web Server, since processes have four GBs of address space for the file cache, the value should
be well under four GB.
Using the nocache Parameter
You can use the parameter nocache for the Service function send-file to specify that files in a
certain directory should not be cached. Make this change by editing obj.conf. For example, if
you have a set of files that changes too rapidly for caching to be useful, you can put them into a
directory and instruct the server not to cache files in that directory by editing obj.conf.
Example
<Object name=default>
...
NameTrans fn="pfx2dir" from="/myurl" dir="/export/mydir"
name="myname"
...
Service method=(GET|HEAD|POST) type=*~magnus-internal/*
fn=send-file
Chapter 2 • Tuning Sun Java System Web Server
63
Using Monitoring Data to Tune Your Server
...
</Object>
<Object name="myname">
Service method=(GET|HEAD) type=*~magnus-internal/* fn=send-file
nocache=""
</Object>
In the above example, the server does not cache static files from /export/mydir/ when
requested by the URL prefix /myurl. For more information on editing obj.conf, see Sun Java
System Web Server 7.0 Update 1 Administrator’s Configuration File Reference.
File Cache Dynamic Control and Monitoring
You can add an object to obj.conf to dynamically monitor and control the file cache while the
server is running.
▼ To Control and Monitor the File Cache
1
Add a NameTrans directive to the default object:
NameTrans fn="assign-name" from="/nsfc" name="nsfc"
2
Add an nsfc object definition:
<Object name="nsfc">
Service fn="service-nsfc-dump"
</Object>
This enables the file cache control and monitoring function (nsfc-dump) to be accessed through
the URI /nfsc. To use a different URI, change the from parameter in the NameTrans directive.
The following is an example of the information you receive when you access the URI:
Sun Java System File Cache Status (pid 3602)
The file cache is enabled.
Cache resource utilization
Number of cached file entries = 174968 (152 bytes each, 26595136 total bytes)
Heap space used for cache = 1882632616/1882632760 bytes
Mapped memory used for medium file contents = 0/1 bytes
Number of cache lookup hits = 47615653/48089040 ( 99.02 %)
Number of hits/misses on cached file info = 23720344/324195
Number of hits/misses on cached file content = 16247503/174985
Number of outdated cache entries deleted = 0
Number of cache entry replacements = 0
Total number of cache entries deleted = 0
Parameter settings
64
Sun Java System Web Server 7.0 Update 1 Performance Tuning, Sizing, and Scaling Guide •
Using Monitoring Data to Tune Your Server
ReplaceFiles: false
ReplaceInterval: 1 milliseconds
HitOrder: false
CacheFileContent: true
TransmitFile: false
MaxAge: 3600 seconds
MaxFiles: 600000 files
SmallFileSizeLimit: 500000 bytes
MediumFileSizeLimit: 1000001 bytes
BufferSize: 8192 bytes
CopyFiles: false
Directory for temporary files: /tmp
Hash table size: 1200007 buckets
You can include a query string when you access the URI. The following values are recognized:
■
■
■
■
■
?list: Lists the files in the cache.
?refresh=n: Causes the client to reload the page every n seconds.
?restart: Causes the cache to be shut down and then restarted.
?start: Starts the cache.
?stop: Shuts down the cache.
If you choose the ?list option, the file listing includes the file name, a set of flags, the current
number of references to the cache entry, the size of the file, and an internal file ID value. The
flags are as follows:
■
■
■
■
■
■
■
■
■
C: File contents are cached.
D: Cache entry is marked for delete.
E: PR_GetFileInfo() returned an error for this file.
I: File information (size, modify date, and so on) is cached.
M: File contents are mapped into virtual memory.
O: File descriptor is cached (when TransmitFile is set to true).
P: File has associated private data (should appear on shtml files).
T: Cache entry has a temporary file.
W: Cache entry is locked for write access.
Thread Pool Information
If you are using the default settings, threads from the default thread pool process the request.
However, you can also create custom thread pools and use them to run custom NSAPI
functions. By default, Web Server creates one additional pool, named NativePool. In most
cases, the native thread pool is only needed on the Windows platform. For more information on
thread pools, see “Understanding Threads, Processes, and Connections” on page 40.
Chapter 2 • Tuning Sun Java System Web Server
65
Using Monitoring Data to Tune Your Server
Native Thread Pool
The following example shows native thread pool information as it appears in perfdump:
Native pools:
---------------------------NativePool:
Idle/Peak/Limit
Work Queue Length/Peak/Limit
my-custom-pool:
Idle/Peak/Limit
Work Queue Length/Peak/Limit
1/1/128
0/0/0
1/1/128
0/0/0
If you have defined additional custom thread pools, they are shown under the Native Pools
heading in perfdump.
The following table shows the thread pool statistics as they appear in the Admin Console. If you
have not defined additional thread pools, only the NativePool is shown:
TABLE 2–5
Thread Pools Statistics
Name
NativePool
Idle Threads
1
Threads
1
Requests Queued
0
Peak Requests Queued
0
Idle /Peak /Limit
Idle, listed as Idle Threads in the Admin Console, indicates the number of threads that are
currently idle. Peak indicates the peak number of threads in the pool. Limit, listed as Threads in
the Admin Console, indicates the maximum number of native threads allowed in the thread
pool, and for NativePool is determined by the setting of NativePoolMaxThreads in the
magnus.conf file.
Tuning
You can modify the maximum threads for NativePool by editing the NativePoolMaxThreads
parameter in magnus.conf. For more information, see “NativePoolMaxThreads Directive” on
page 68.
Work Queue Length /Peak /Limit
These numbers refer to a queue of server requests that are waiting for the use of a native thread
from the pool. The Work Queue Length is the current number of requests waiting for a native
thread, which is represented as Requests Queued in the Admin Console.
66
Sun Java System Web Server 7.0 Update 1 Performance Tuning, Sizing, and Scaling Guide •
Using Monitoring Data to Tune Your Server
Peak (Peak Requests Queued in the Admin Console) is the highest number of requests that were
ever queued up simultaneously for the use of a native thread since the server was started. This
value can be viewed as the maximum concurrency for requests requiring a native thread.
Limit is the maximum number of requests that can be queued at one time to wait for a native
thread, and is determined by the setting of NativePoolQueueSize.
Tuning
You can modify the queue size for NativePool by editing the NativePoolQueueSize directive in
magnus.conf. For more information, see “NativePoolQueueSize Directive” on page 67.
NativePoolStackSize Directive
The NativePoolStackSize determines the stack size in bytes of each thread in the native
(kernel) thread pool.
Tuning
You can modify the NativePoolStackSize by editing the NativePoolStackSize directive in
magnus.conf.
NativePoolQueueSize Directive
The NativePoolQueueSize determines the number of threads that can wait in the queue for the
thread pool. If all threads in the pool are busy, then the next request-handling thread that needs
to use a thread in the native pool must wait in the queue. If the queue is full, the next
request-handling thread that tries to get in the queue is rejected, with the result that it returns a
busy response to the client. It is then free to handle another incoming request instead of being
tied up waiting in the queue.
Setting the NativePoolQueueSize lower than the maximum threads value causes the server to
execute a busy function instead of the intended NSAPI function whenever the number of
requests waiting for service by pool threads exceeds this value. The default returns a “503
Service Unavailable” response and logs a message, depending on your log level setting. Setting
the NativePoolQueueSize higher than the maximum threads causes the server to reject
connections before a busy function can execute.
This value represents the maximum number of concurrent requests for service that require a
native thread. If your system is unable to fulfill requests due to load, letting more requests queue
up increases the latency for requests, and could result in all available request threads waiting for
a native thread. In general, set this value to be high enough to avoid rejecting requests by
anticipating the maximum number of concurrent users who would execute requests requiring a
native thread.
Chapter 2 • Tuning Sun Java System Web Server
67
Using Monitoring Data to Tune Your Server
The difference between this value and the maximum threads is the number of requests reserved
for non-native thread requests, such as static HTML and image files. Keeping a reserve and
rejecting requests ensures that your server continues to fill requests for static files, which
prevents it from becoming unresponsive during periods of very heavy dynamic content load. If
your server consistently rejects connections, this value is either set too low, or your server
hardware is overloaded.
Tuning
You can modify the NativePoolQueueSize by editing the NativePoolQueueSize directive in
magnus.conf.
NativePoolMaxThreads Directive
NativePoolMaxThreads determine the maximum number of threads in the native (kernel)
thread pool.
A higher value allows more requests to execute concurrently, but has more overhead due to
context switching, so bigger is not always better. Typically, you do not need to increase this
number, but if you are not saturating your CPU and you are seeing requests queue up, then you
should increase this number.
Tuning
You can modify the NativePoolMaxThreads by editing the NativePoolMaxThreads parameter
in magnus.conf.
NativePoolMinThreads Directive
Determines the minimum number of threads in the native (kernel) thread pool.
Tuning
You can modify the NativePoolMinThreads by editing the NativePoolMinThreads parameter
in magnus.conf.
DNS Cache Information
The DNS cache caches IP addresses and DNS names. Web Server uses DNS caching for logging
and for access control by IP address. DNS cache is enabled by default. The following example
shows DNS cache information as displayed in perfdump:
DNSCacheInfo:
-----------------enabled
yes
68
Sun Java System Web Server 7.0 Update 1 Performance Tuning, Sizing, and Scaling Guide •
Using Monitoring Data to Tune Your Server
CacheEntries
HitRatio
4/1024
62854802/62862912 ( 99.99%)
AsyncDNS Data:
-----------------enabled
NameLookups
AddrLookups
LookupsInProgress
yes
0
0
0
The following example shows the DNS Cache information as displayed in the Admin Console:
TABLE 2–6
DNS Cache Statistics
Total Cache Hits
62854802
Total Cache Misses
6110
Number of Asynchronous Lookups
0
Lookups in Progress
4
Asynchronous Lookups Enabled
1
Number of Asynchronous Address Lookups
Performed
0
Enabled
If the DNS cache is disabled, the rest of this section is not displayed in perfdump. In the Admin
Console, the page displays zeros.
Tuning
By default, the DNS cache is on. You can enable or disable DNS caching in the Admin Console
on the configuration's Performance tab ⇒ DNS sub tab, under DNS Cache Settings and
selecting or deselecting the DNS Cache Enabled box. To enable or disable it using the
command-line-interface, use wadm set-dns-cache-prop and set the enabled property.
Cache Entries (Current Cache Entries / Maximum Cache Entries)
This section in perfdump shows the number of current cache entries and the maximum number
of cache entries. In the Admin Console the current cache entries are shown as Total Cache Hits.
A single cache entry represents a single IP address or DNS name lookup. The cache should be as
large as the maximum number of clients that access your web site concurrently. Note that
setting the cache size too high wastes memory and degrades performance.
Chapter 2 • Tuning Sun Java System Web Server
69
Using Monitoring Data to Tune Your Server
Tuning
You can set the maximum size of the DNS cache in the Admin Console in the Maximum Cache
Size field on the configuration's Performance tab ⇒ DNS sub tab, under DNS Cache Settings.
To set it using the command-line-interface, use wadm set-dns-cache-prop and set the
max-entries property. The default cache size is 1024. The value range is 2-32768.
Hit Ratio (Cache Hits / Cache Lookups)
The hit ratio in perfdump displays the number of cache hits compared to the number of cache
lookups. You can compute this number using the statistics in the Admin Console by dividing
the Total Cache Hits by the sum of the Total Cache Hits and the Total Cache Misses.
This setting is not tunable.
Async DNS Enabled/Disabled
Async DNS enabled/disabled displays whether the server uses its own asynchronous DNS
resolver instead of the operating system's synchronous resolver. By default, Async DNS is
disabled. If it is disabled, this section does not appear in perfdump. To enable it using the Admin
Console, on the configuration's Performance tab ⇒ DNS tab, under DNS Lookup Settings,
select Asynchronous DNS. To enable it using the command-line interface, use wadm
set-dns-prop and set the async property to true.
Java Virtual Machine (JVM) Information
JVM statistics are displayed through the Admin Console, the CLI, and stats-xml only. They
are not shown in perfdump.
The following table shows an example of the JVM statistics displayed in the Admin Console:
TABLE 2–7
70
Java Virtual Machine (JVM) Statistics
Virtual Machine Name
Java HotSpotTM Server VM
Virtual Machine Vendor
Sun Microsystems Inc.
Virtual Machine Version
1.5.0_06-b05
Heap Memory Size
5884856
Elapsed Garbage Collection Time (milli seconds)
51
Present Number of Classes Loaded
1795
Total Number of Classes Loaded
1795
Sun Java System Web Server 7.0 Update 1 Performance Tuning, Sizing, and Scaling Guide •
Using Monitoring Data to Tune Your Server
TABLE 2–7
Java Virtual Machine (JVM) Statistics
(Continued)
Total Number of Classes Unloaded
0
Number of Garbage Collections Occurred
3
Number of Live Threads
8
Number of Started Threads
9
Peak Live Thread Count
8
Most of these statistics are not tunable. They provide information about the JVM's operation.
Another source of tuning information on the JVM is the package java.lang.management,
which provides the management interface for monitoring and management of the JVM. For
more information on this package, see http://java.sun.com/
j2se/1.5.0/docs/api/java/lang/management/package-summary.html.
Java Heap Tuning
As with all Java programs, the performance of the web applications in the Web Server is
dependent on the heap management performed by the JVM. There is a trade-off between pause
times and throughput. A good place to start is by reading the performance documentation for
the Java HotSpot virtual machine, which can be found at
http://java.sun.com/docs/hotspot/index.html.
Specific documents of interest include “Tuning Garbage Collection with the 5.0 Java Virtual
Machine” (http://java.sun.com/docs/hotspot/gc5.0/gc_tuning_5.html) and
“Ergonomics in the 5.0 Java Virtual Machine”
(http://java.sun.com/docs/hotspot/gc5.0/ergo5.html).
JVM options can be specified in the Admin Console on the configuration's Java tab ⇒ JVM
Settings sub tab. In the CLI, use the wadm commands set-jvm-prop and
set-jvm-profiler-prop.
Web Application Information
Web application statistics are displayed through the Admin Console, wadm get-config-stats
command), and stats-xml only. They are not shown in perfdump.
▼ To Access Web Application Statistics From the Admin Console
1
From the Common Tasks page, choose the Monitoring tab.
2
Click the configuration name to view web application statistics for the configuration. To view
web application statistics for the instance, click the Instance sub tab and the instance name.
Chapter 2 • Tuning Sun Java System Web Server
71
Using Monitoring Data to Tune Your Server
3
On the Monitoring Statistics page, click Virtual Server Statistics.
4
Click the virtual server name.
5
On the Virtual Server Monitoring Statistics page, click Web Applications.
6
Select the web application for which to view statistics from the Web Application pull-down
menu.
Web Application Statistics
The following table shows an example of the Web Application statistics displayed in the Admin
Console:
TABLE 2–8
Web Application Statistics
Number of JSPs Loaded
1
Number of JSPs Reloaded
1
Total Number of Sessions Serviced
2
Number of Sessions Active
2
Peak Number of Active Sessions
2
Number of Sessions Rejected
0
Number of Sessions Expired
0
Average Time (seconds) that expired sessions had
been alive
0
Longest Time (seconds) for which an expired session
was alive
0
For more information on tuning, see “Tuning Java Web Application Performance” on page 78.
Also see Sun Java System Web Server 7.0 Update 1 Developer’s Guide to Java Web Applications.
JDBC Resource Information
A JDBC resource is a named group of JDBC connections to a database. A JDBC resource defines
the properties used to create a connection pool. Each JDBC resource uses a JDBC driver to
establish a connection to a physical database when the server is started. A pool of connections is
created when the first request for connection is made on the pool after you start Web Server.
A JDBC-based application or resource draws a connection from the pool, uses it, and when no
longer needed, returns it to the connection pool by closing the connection. If two or more JDBC
resources point to the same pool definition, they use the same pool of connections at run time.
72
Sun Java System Web Server 7.0 Update 1 Performance Tuning, Sizing, and Scaling Guide •
Using Monitoring Data to Tune Your Server
The use of connection pooling improves application performance by doing the following:
■
Creating connections in advance. The cost of establishing connections is moved outside of
the code that is critical for performance.
■
Reusing connections. The number of times connections are created is significantly lowered.
■
Controlling the amount of resources a single application can use at any moment.
JDBC resources can be created and edited using the Admin Console's Java tab ⇒ Resources sub
tab for the configuration. You can also use the wadm create-jdbc-resource and
set-jdbc-resource-prop commands. For more information, see the Sun Java System Web
Server 7.0 Update 1 Administrator’s Guide.
Note – Each defined pool is instantiated during Web Server startup. However, the connections
are only created the first time the pool is accessed. You should jump-start a pool before putting
it under heavy load.
JDBC resource statistics are available through the Admin Console, CLI, and stats.xml only.
They are not shown in perfdump. Some of the monitoring data is unavailable through the
Admin Console and can only be viewed through the CLI using wadm get-config-stats and
through the stats.xml output.
A pool is created on demand, that is, it is created the first time it is used. The monitoring
statistics are not displayed until the first time the pool is used.
JDBC Resource Statistics Available Through the Admin Console
The following table shows an example of the JDBC resource statistics displayed through the
Admin Console:
TABLE 2–9
JDBC Resource Statistics
Connections
32
Free Connections
0
Leased Connections
32
Average Queue Time
1480.00
Queued Connections
40
Connection Timeout
100
To change the settings for a JDBC resource through the Admin Console, for the configuration,
choose the Java tab ⇒ Resources sub tab. Select the JDBC resource. The settings are available on
the Edit JDBC Resource page. To change the JDBC resource through the
command-line-interface, use wadm set-jdbc-resource-prop.
Chapter 2 • Tuning Sun Java System Web Server
73
Using Monitoring Data to Tune Your Server
Connections
This number shows the current JDBC connections, including both free and busy connections.
Tuning – This setting cannot be tuned, but it is a good indicator of recent pool activity. If the
number of connections is consistently higher than the minimum number of connections,
consider increasing the minimum number of connections to be closer to the number of current
JDBC connections. To change the minimum connections for a JDBC resource through the
Admin Console, on the Edit JDBC Resources page, edit the Minimum Connections setting. To
change the JDBC resource's minimum connections through the command-line-interface, use
wadm set-jdbc-resource-prop and change the min-connections property.
Free Connections
This number shows the current number of free connections in the pool. All free connections
over the minimum pool size are closed if they are idle for more than the maximum idle timeout.
The free connections are not tunable.
Leased Connections
This number shows the current number of connections in use.
Tuning – If number of leased connections is consistently lower than the minimum
connections, consider reducing the minimum connections for the JDBC resource. If number of
leased connections is consistently higher than minimum connections, consider increasing the
minimum connections. If number of leased connections is consistently at the JDBC resource's
maximum number of connections, consider increasing the maximum number of connections.
The upper limit for the number of leased connections is the number of maximum connections.
To change the minimum or maximum connections for a JDBC resource through the Admin
Console, on the Edit JDBC Resource page, edit the Minimum Connections or Maximum
Connections fields. To change the JDBC resource's minimum or maximum connections
through the command-line-interface, use wadm set-jdbc-resource-prop and change the
min-connections or max-connections properties.
Queued Connections
This number shows the current number of requests for connections that are waiting to receive a
connection from the JDBC pool. Connection requests are queued if the current number of
leased connections has reached the maximum connections.
Tuning – If this number is consistently greater than zero, consider increasing the JDBC
resource's maximum connections. To change the maximum connections for a JDBC resource
through the Admin Console, on the Edit JDBC Resource page, edit the Maximum Connections
field. To change the JDBC resource's maximum connections through the
command-line-interface, use wadm set-jdbc-resource-prop and change the
max-connections property.
74
Sun Java System Web Server 7.0 Update 1 Performance Tuning, Sizing, and Scaling Guide •
Using Monitoring Data to Tune Your Server
JDBC Resource Statistics Not Available in the Admin Console
Some JDBC statistics are available through the wadm get-config-stats command (using the
--node option), through stats-xml, and through SNMP but not through the Admin Console.
maxConnections – The configured maximum size of the pool. Use as a reference for other
statistics. To change the maximum connections for a JDBC resource through the Admin
Console, on the Edit JDBC Resource page, edit the Maximum Connections field. To change the
JDBC resource's maximum connections through the command-line-interface, use wadm
set-jdbc-resource-prop and change the max-connections property.
peakConnections – The highest number of connections that have been leased concurrently
during the history of the pool. This number is a good indication on the upper limit on pool
usage. It is limited by the maximum connections setting.
countTotalLeasedConnections – The total number of times a connection has been handed out
by the pool. Indicates total pool activity. Not tunable.
countTotalFailedValidationConnections – If connection validation is enabled, shows the
number of times a connection has been detected as invalid by the pool. If this number is
relatively high, it could signal database or network problems. Not tunable.
peakQueued – The highest number of connection requests that have been queued
simultaneously at any time during the lifetime of the pool. Not tunable.
millisecondsPeakWait – The maximum time in milliseconds that any connection request has
been in the wait queue. A high number is an indication of high pool activity. The upper limit is
the JDBC resource setting wait timeout.
countConnectionIdleTimeouts – The number of free connections that have been closed by the
pool because they exceeded the configured JDBC idle timeout. To change the idle timeout for a
JDBC resource through the Admin Console, on the Edit JDBC Resource page, edit the Idle
Timeout field. To change the JDBC resource's idle timeout through the
command-line-interface, use wadm set-jdbc-resource-prop and change the idle-timeout
property.
JDBC Resource Connection Settings
Depending on your application’s database activity, you might need to size JDBC resource
connection pool settings. Attributes of a JDBC resource which affect performance are listed
below, along with performance considerations when setting values.
■
Minimum connections
The size the pool tends to keep during the life of the server instance. Also the initial size of
the pool. Defaults to 8. This number should be as close as possible to the expected average
size of the pool. Use a high number for a pool that is expected to be under heavy load, to
Chapter 2 • Tuning Sun Java System Web Server
75
Using Monitoring Data to Tune Your Server
minimize creation of connections during the life of the application and minimize pool
resizing. Use a lower number if the pool load is expected to be small, to minimize resource
consumption.
■
Maximum connections
The maximum number of connections that a pool can have at any given time. Defaults to 32.
Use this setting to enforce a limit in the amount of connection resources that a pool or
application can have. This limit is also beneficial to avoid application failures due to
excessive resource consumption.
■
Idle timeout
The maximum amount in seconds that a connection is ensured to remain unused in the
pool. After the idle timeout, connections are automatically closed. If necessary, new
connections are created up to the minimum number of connections to replace the closed
connection. Note that this setting does not control connection timeouts enforced at the
database server side. Defaults to 60 seconds.
Setting this attribute to –1 prevents the connections from being closed. This setting is good
for pools that expect continuous high demand. Otherwise, keep this timeout shorter than
the database server-side timeout (if such timeouts are configured on the specific vendor
database), to prevent accumulation of unusable connections in the pool.
■
Wait timeout
The amount of time in seconds that a request waits for a connection in the queue before
timing out. After this timeout, the user sees an error. Defaults to 60.
Setting this attribute to 0 causes a request for a connection to wait indefinitely. This setting
could also improve performance by keeping the pool from having to account for connection
timers.
■
Validation method
The method used by the pool to determine the health of a connections in the pool. Defaults
to off.
If a validation method is used, the pool executes a sanity check on a connection before
leasing it to an application. The effectivity and performance impact depends on the method
selected:
■
76
■
meta-data is less expensive than table in terms of performance, but usually less
effective as most drivers cache the result and do not use the connection, providing false
results.
■
table is almost always effective, as it forces the driver to perform an SQL call to the
database, but it is also the most costly.
■
auto-commit can provide the best balance of effectiveness and performance cost, but a
number of drivers also cache the results of this method.
Validation Table Name
Sun Java System Web Server 7.0 Update 1 Performance Tuning, Sizing, and Scaling Guide •
Tuning the ACL User Cache
The user-defined table to use for validation when the validation method is table. Defaults
to test.
If this method is used, the table used should be dedicated only to validation, and the number
of rows in the table should be kept to a minimum.
■
Fail All Connections
Indicates whether all connections in the pool are re-created when one is found to be invalid,
or only the invalid one. Only applicable if you have selected a connection validation method.
Disabled by default.
If enabled, all of the re-creation is done in one step, and the thread requesting the
connection is heavily affected. If disabled, the load of re-creating connections is distributed
between the threads requesting each connection.
■
Transaction Isolation Level
Specifies the Transaction Isolation Level on the pooled database connections.
By default, the default isolation level of the connection is left intact. Setting it to any value
does incur the small performance penalty caused by the method call.
■
Guarantee Isolation
Only applicable if a transaction isolation level is specified. Defaults to disabled.
Leaving this setting disabled causes the isolation level to be set only when the connection is
created. Enabling sets the level every time the connection is leased to an application. In most
cases, leave this setting disabled.
Tuning the ACL User Cache
The ACL user cache is on by default. Because of the default size of the cache (200 entries), the
ACL user cache can be a bottleneck, or can simply not serve its purpose on a site with heavy
traffic. On a busy site, more than 200 users can hit ACL-protected resources in less time than the
lifetime of the cache entries. When this situation occurs, Web Server must query the LDAP
server more often to validate users, which impacts performance.
This bottleneck can be avoided by increasing the maximum users of the ACL cache on the
configuration's Performance tab ⇒ Cache sub tab. You can also set the number of users by
setting the max-users property using the command wadm set-acl-cache-prop. Note that
increasing the cache size uses more resources; the larger you make the cache, the more RAM
you'll need to hold it.
There can also be a potential (but much harder to hit) bottleneck with the number of groups
stored in a cache entry (four by default). If a user belongs to five groups and hits five ACLs that
check for these different groups within the ACL cache lifetime, an additional cache entry is
created to hold the additional group entry. When there are two cache entries, the entry with the
original group information is ignored.
Chapter 2 • Tuning Sun Java System Web Server
77
Tuning Java Web Application Performance
While it would be extremely unusual to hit this possible performance problem, the number of
groups cached in a single ACL cache entry can be tuned with Maximum Groups setting on the
configuration's Performance tab ⇒ Cache sub tab. Or you can use the max-groups-per-user
property of the wadm set-acl-cache-prop command.
The maximum age setting of the ACL cache determines the number of seconds before the cache
entries expire. Each time an entry in the cache is referenced, its age is calculated and checked
against the maximum age setting. The entry is not used if its age is greater than or equal to the
maximum age. The default value is 120 seconds. If your LDAP is not likely to change often, use a
large number for the maximum age. However, if your LDAP entries change often, use a smaller
value. For example, when the value is 120 seconds, the Web Server might be out of sync with the
LDAP server for as long as two minutes. Depending on your environment, that might or might
not be a problem.
Tuning Java Web Application Performance
This section contains information to help you improve the performance of your Java Web
Applications. This section includes the following topics:
■
■
■
■
■
■
“Using Precompiled JSPs” on page 78
“Using Servlet/JSP Caching” on page 79
“Configuring the Java Security Manager” on page 79
“Configuring Class Reloading” on page 79
“Avoiding Directories in the Classpath” on page 80
“Configuring the Web Application’s Session Settings” on page 80
In addition, see the following sections for other tuning information related to the Java Web
Applications:
■
■
“Java Virtual Machine (JVM) Information” on page 70
“JDBC Resource Information” on page 72
Using Precompiled JSPs
Compiling JSPs is a resource-intensive and relatively time-consuming process. By default, the
Web Server periodically checks to see if your JSPs have been modified and dynamically reloads
them; this allows you to deploy modifications without restarting the server. The
reload-interval property of the jsp-config element in sun-web.xml controls how often the
server checks JSPs for modifications. However, there is a small performance penalty for that
checking.
When the server detects a change in a .jsp file, only that JSP is recompiled and reloaded; the
entire web application is not reloaded.
If your JSPs don't change, you can improve performance by precompiling your JSPs.
78
Sun Java System Web Server 7.0 Update 1 Performance Tuning, Sizing, and Scaling Guide •
Tuning Java Web Application Performance
When adding a web application, either through the Admin Console or CLI, choose the
precompile JSPs option. Enabling precompiled JSPs allows all the JSPs present in the web
application to be pre-compiled, and their corresponding servlet classes are bundled in the web
application's WEB-INF/lib or WEB-INF/classes directory. When a JSP is accessed, it is not
compiled and instead, its precompiled servlet is used. For more information on JSPs, see Sun
Java System Web Server 7.0 Update 1 Developer’s Guide to Java Web Applications. Also see
“Configuring Class Reloading” on page 79.
Using Servlet/JSP Caching
If you spend a lot of time re-running the same servlet/JSP, you can cache its results and return
results out of the cache the next time it is run. For example, this is useful for common queries
that all visitors to your site run: you want the results of the query to be dynamic because it might
change daily, but you don't need to run the logic for every user.
To enable caching, you configure the caching parameters in the sun-web.xml file of your
application. For more details, see “Caching Servlet Results” in Sun Java System Web Server 7.0
Update 1 Developer’s Guide to Java Web Applications.
Configuring the Java Security Manager
Web Server supports the Java Security Manager. The main drawback of running with the
Security Manager is that it negatively impacts performance. The Java Security Manager is
disabled by default when you install the product. Running without the Security Manager might
improve performance significantly for some types of applications. Based on your application
and deployment needs, you should evaluate whether to run with or without the Security
Manager. For more information, see Sun Java System Web Server 7.0 Update 1 Developer’s Guide
to Java Web Applications.
Configuring Class Reloading
The dynamic reload interval of the servlet container and the dynamic-reload-interval of the
class-loader element in sun-web.xml control the frequency at which the server checks for
changes in servlet classes. When dynamic reloading is enabled and the server detects that a
.class file has changed, the entire web application is reloaded.
Set the dynamic reload interval on the configuration's Java tab ⇒ Servlet Container sub tab, or
using the wadm set-servelt-container-props command. In a production environment
where changes are made in a scheduled manner, set this value to 0 to prevent the server from
constantly checking for updates. The default value is 0 (that is, class reloading is disabled). For
more information about elements in sun-web.xml, see Sun Java System Web Server 7.0 Update 1
Developer’s Guide to Java Web Applications.
Chapter 2 • Tuning Sun Java System Web Server
79
Tuning Java Web Application Performance
Avoiding Directories in the Classpath
For certain applications (especially if the Java Security Manager is enabled) you can improve
performance by ensuring that there are no unneeded directories in the classpath. To do so,
change the Server Class Path, Class Path Prefix, and Class Path Suffix fields on the
configuration's Java tab ⇒ General sub tab for the configuration or use the command wadm
set-jvm-prop. Also, package the web application's .class files in a .jar archive in
WEB-INF/lib instead of packaging the .class files as is in WEB-INF/classes, and ensure that
the .war archive does not contain a WEB-INF/classes directory.
Configuring the Web Application’s Session Settings
If you have relatively short-lived sessions, try decreasing the session timeout by configuring the
value of the timeOutSeconds property under the session-properties element in
sun-web.xml from the default value of 10 minutes.
If you have relatively long-lived sessions, you can try decreasing the frequency at which the
session reaper runs by increasing the value of the reapIntervalSeconds property from the
default value of once every minute.
For more information about these settings, and about session managers, see Sun Java System
Web Server 7.0 Update 1 Developer’s Guide to Java Web Applications.
In multi-process mode when the persistence-type in sun-web.xml is configured to be either
s1ws60 or mmap, the session manager uses cross-process locks to ensure session data integrity.
These can be configured to improve performance as described below.
Note – For Java technology-enabled servers, multi-process mode is deprecated and included for
backward-compatibility only.
Tuning maxLocks (UNIX/Linux)
The implication of the number specified in the maxLocks property can be gauged by dividing
the value of maxSessions with maxLocks. For example, if maxSessions = 1000 and you set
maxLocks = 10, then approximately 100 sessions (1000/10) contend for the same lock.
Increasing maxLocks reduces the number of sessions that contend for the same lock and might
improve performance and reduce latency. However, increasing the number of locks also
increases the number of open file descriptors, and reduces the number of available descriptors
that would otherwise be assigned to incoming connection requests.
For more information about these settings, see Chapter 6, “Session Managers,” in Sun Java
System Web Server 7.0 Update 1 Developer’s Guide to Java Web Applications.
80
Sun Java System Web Server 7.0 Update 1 Performance Tuning, Sizing, and Scaling Guide •
Tuning CGI Stub Processes (UNIX/Linux)
Tuning MMapSessionManager (UNIX/Linux)
The following example describes the effect on process size when configuring the
persistence-type="mmap" using the manager-properties properties. For more information,
see “MMap Session Manager (UNIX Only)” in Sun Java System Web Server 7.0 Update 1
Developer’s Guide to Java Web Applications.
maxSessions = 1000
maxValuesPerSession = 10
maxValueSize = 4096
This example would create a memory mapped file of size 1000 X 10 X 4096 bytes, or ~40 MB. As
this is a memory mapped file, the process size will increase by 40 MB upon startup. The larger
the values you set for these parameters, the greater the increase in process size.
Tuning CGI Stub Processes (UNIX/Linux)
In Web Server, the CGI engine creates CGI stub processes as needed. On systems that serve a
large load and rely heavily on CGI-generated content, it is possible for the CGI stub processes to
consume all system resources. If this is happening on your server, the CGI stub processes can be
tuned to restrict how many new CGI stub processes can be spawned, their timeout value, and
the minimum number of CGI stub process that run at any given moment.
Note – If you have an init-cgi function in the magnus.conf file and you are running in
multi-process mode, you must add LateInit = yes to the init-cgi line.
Tune the following settings to control CGI stubs. These settings are on the configuration's
Performance Tab ⇒ CGI sub tab.
■
Minimum Stubs Size: Controls the number of processes that are started by default. The first
CGI stub process is not started until a CGI program has been accessed. The default value is
0. If you have an init-cgi directive in the magnus.conf file, the minimum number of CGI
stub processes are spawned at startup.
■
Maximum Stub Size: Controls the maximum number of CGI stub processes the server can
spawn. This is the maximum concurrent CGI stub processes in execution, not the
maximum number of pending requests. The default value is 16 and should be adequate for
most systems. Setting this too high might actually reduce throughput.
■
CGI Stub Timeout: Causes the server to kill any CGI stub processes that have been idle for
the number of seconds set by this directive. Once the number of processes is at the
minimum stubs size, it does not kill any more processes. The default is 30.
■
CGI Timeout: Limits the maximum time in seconds that CGI processes can run. The default
is –1, which means there is no timeout.
Chapter 2 • Tuning Sun Java System Web Server
81
Using find-pathinfo-forward
Using find-pathinfo-forward
The find-pathinfo-forward parameter used in obj.conf can help improve your
performance. It is used with the PathCheck function find-pathinfo and the NameTrans
functions pfx2dir and assign-name. The find-pathinfo-forward parameter instructs the
server to search forward for PATH_INFO in the path after ntrans-base, instead of backward
from the end of the path in the server function find-pathinfo.
Note – The server ignores the find-pathinfo-forward parameter if the ntrans-base parameter
is not set in rq->vars when the server function find-pathinfo is called. By default,
ntrans-base is set.
Example
NameTrans fn="pfx2dir" find-pathinfo-forward="" from="/cgi-bin"
dir="/export/home/cgi-bin" name="cgi"
NameTrans fn="assign-name" from="/perf"
find-pathinfo-forward="" name="perf"
This feature can improve performance for certain URLs by doing fewer stats in the server
function find-pathinfo. On Windows, you can also use this feature to prevent the server from
changing "\\" to "/" when using the PathCheck server function find-pathinfo.
For more information about obj.conf, see the Sun Java System Web Server 7.0 Update 1
Administrator’s Configuration File Reference.
Using nostat
You can specify the parameter nostat in the obj.conf NameTrans function assign-name to
prevent the server from doing a stat on a specified URL whenever possible. Use the following
syntax:
nostat=virtual-path
Example
<Object name=default>
NameTrans fn="assign-name" from="/nsfc" nostat="/nsfc" name="nsfc"
</Object>
<Object name=nsfc>
Service fn=service-nsfc-dump
</Object>
82
Sun Java System Web Server 7.0 Update 1 Performance Tuning, Sizing, and Scaling Guide •
Using Busy Functions
In the previous example, the server does not stat for path /ntrans-base/nsfc and
/ntrans-base/nsfc/* if ntrans-base is set. If ntrans-base is not set, the server does not stat for
URLs /nsfc and /nsfc/*. By default, ntrans-base is set. The example assumes the default
PathCheck server functions are used.
When you use nostat= virtual-path in the assign-name NameTrans, the server assumes that
stat on the specified virtual-path will fail. Therefore, use nostat only when the path of the
virtual-path does not exist on the system, for example, in NSAPI plug-in URLs. Using nostat
on those URLs improves performance by avoiding unnecessary stats on those URLs.
For more information about obj.conf, see the Sun Java System Web Server 7.0 Update 1
Administrator’s Configuration File Reference.
Using Busy Functions
The default busy function returns a "503 Service Unavailable" response and logs a message
depending upon the log level setting. You might want to modify this behavior for your
application. You can specify your own busy functions for any NSAPI function in the obj.conf
file by including a service function in the configuration file in this format:
busy="my-busy-function"
For example, you could use this sample service function:
Service fn="send-cgi" busy="service-toobusy"
This allows different responses if the server become too busy in the course of processing a
request that includes a number of types (such as Service, AddLog, and PathCheck). Note that
your busy function applies to all functions that require a native thread to execute when the
default thread type is non-native.
To use your own busy function instead of the default busy function for the entire server, you can
write an NSAPI init function that includes a func_insert call as shown below:
extern "C" NSAPI_PUBLIC int my_custom_busy_function
(pblock *pb, Session *sn, Request *rq);
my_init(pblock *pb, Session *, Request *){func_insert
("service-toobusy", my_custom_busy_function);}
Busy functions are never executed on a pool thread, so you must be careful to avoid using
function calls that could cause the thread to block.
Chapter 2 • Tuning Sun Java System Web Server
83
84
3
C H A P T E R
3
Common Performance Problems
This chapter discusses common web site performance problems, and includes the following
topics:
■
■
■
■
■
■
“check-acl Server Application Functions” on page 85
“Low-Memory Situations” on page 86
“Too Few Threads” on page 86
“Cache Not Utilized” on page 87
“Keep-Alive Connections Flushed” on page 87
“Log File Modes” on page 88
Note – For platform-specific issues, see Chapter 4, “Platform-Specific Issues and Tips”
check-acl Server Application Functions
For optimal performance of your server, use ACLs only when required.
The server is configured with an ACL file containing the default ACL allowing write access to
the server only to all, and an es-internal ACL for restricting write access for anybody. The
latter protects the manuals, icons, and search UI files in the server.
The default obj.conf file has NameTrans lines mapping the directories that need to be read-only
to the es-internal object, which in turn has a check-acl SAF for the es-internal ACL.
The default object also contains a check-acl SAF for the default ACL.
You can improve performance by removing the check-acl SAF from the default object for
URIs that are not protected by ACLs.
85
Low-Memory Situations
Low-Memory Situations
If Web Server must run in low-memory situations, reduce the thread limit to a bare minimum
by lowering the value of the Maximum Threads setting on the configuration's Performance Tab
⇒ HTTP sub tab. You can also set it with wadm set-thread-pool-prop command's
max-threads property.
Your web applications running under stress might sometimes result in the server running out
of Java VM runtime heap space, as can be seen by java.lang.OutOfMemoryError messages in
the server log file. There could be several reasons for this (such as excessive allocation of
objects), but such behavior could affect performance. To address this problem, profile the
application. Refer to the following HotSpot VM performance FAQ for tips on profiling
allocations (objects and their sizes) of your application:
http://java.sun.com/docs/hotspot/index.html
At times your application could be running out of maximum sessions (as evidenced by a “too
many active sessions” message in the server log file), which would result in the container
throwing exceptions, which in turn impacts application performance. Consideration of session
manager properties, session creation activity (note that JSPs have sessions enabled by default),
and session idle time is needed to address this situation.
Too Few Threads
The server does not allow the number of active threads to exceed the thread limit value. If the
number of simultaneous requests reaches that limit, the server stops servicing new connections
until the old connections are freed up. This can lead to increased response time.
In Web Server, the server’s default maximum threads setting is 128. If you want your server to
process more requests concurrently, you need to increase the maximum number of threads.
The symptom of a server with too few threads is a long response time. Making a request from a
browser establishes a connection fairly quickly to the server, but if there are too few threads on
the server it might take a long time before the response comes back to the client.
The best way to tell if your server is being throttled by too few threads is to see if the number of
active sessions is close to, or equal to, the maximum number of threads. To do this, see “Session
Creation (Thread) Information” on page 57.
86
Sun Java System Web Server 7.0 Update 1 Performance Tuning, Sizing, and Scaling Guide •
Keep-Alive Connections Flushed
Cache Not Utilized
If the file cache is not utilized, your server is not performing optimally. Since most sites have lots
of GIF or JPEG files that should always be cacheable, you need to use your cache effectively.
Some sites, however, do almost everything through CGIs, SHTML, or other dynamic sources.
Dynamic content is generally not cacheable, and inherently yields a low cache hit rate. Don’t be
too alarmed if your site has a low cache hit rate. The most important thing is that your response
time is low. You can have a very low cache hit rate and still have very good response time. As
long as your response time is good, you might not care that the cache hit rate is low.
Check your hit ratio using statistics from perfdump, the Admin Console Monitoring tab, or
wadm stats commands. The hit ratio is the percentage of times the cache was used with all hits to
your server. A good cache hit rate is anything above 50%. Some sites might even achieve 98% or
higher. For more information, see “File Cache Information (Static Content)” on page 59.
In addition, if you are doing a lot of CGI or NSAPI calls, you might have a low cache hit rate. If
you have custom NSAPI functions, you might also have a low cache hit rate.
Keep-Alive Connections Flushed
A web site that might be able to service 75 requests per second without keep-alive connections
might be able to do 200-300 requests per second when keep-alive is enabled. Therefore, as a
client requests various items from a single page, it is important that keep-alive connections are
being used effectively. If the KeepAliveCount shown in perfdump (Total Number of
Connections Added, as displayed in the Admin Console) exceeds the keep-alive maximum
connections, subsequent keep-alive connections are closed, or “flushed,” instead of being
honored and kept alive.
Check the KeepAliveFlushes and KeepAliveHits values using statistics from perfdump or the
Number of Connections Flushed and Number of Connections Processed under Keep Alive
Statistics on the Monitoring Statistics page. For more information, see “Keep-Alive
Information” on page 53.
On a site where keep-alive connections are running well, the ratio of KeepAliveFlushes to
KeepAliveHits is very low. If the ratio is high (greater than 1:1), your site is probably not
utilizing keep-alive connections as well as it could.
To reduce keep-alive flushes, increase the keep-alive maximum connections (as configured on
the configuration's Performance Tab ⇒ HTTP sub tab or the wadm set-keep-ailve props
command). The default value is 200. By raising the value, you keep more waiting keep-alive
connections open.
Chapter 3 • Common Performance Problems
87
Log File Modes
Caution – On UNIX/Linux systems, if the keep-alive maximum connections value is too high,
the server can run out of open file descriptors. Typically 1024 is the limit for open files on
UNIX/Linux, so increasing this value above 500 is not recommended.
Log File Modes
Keeping the log files on a high-level of verbosity can have a significant impact on performance.
On the configuration's General Tab ⇒ Log Settings page choose the appropriate log level and
use levels such as Fine, Finer, and Finest with care. To set the log level using the CLI, use the
command wadm set-log-prop and set the log-level.
88
Sun Java System Web Server 7.0 Update 1 Performance Tuning, Sizing, and Scaling Guide •
4
C H A P T E R
4
Platform-Specific Issues and Tips
This chapter provides platform-specific tuning tips, and includes the following topics:
■
■
■
■
■
“Solaris Platform-Specific Issues” on page 89
“Solaris File System Tuning” on page 93
“Solaris Platform-Specific Performance Monitoring” on page 94
“Tuning Solaris for Performance Benchmarking” on page 96
“Tuning UltraSPARC T1–Based Systems for Performance Benchmarking” on page 97
Solaris Platform-Specific Issues
This section discusses miscellaneous Solaris-specific issues and tuning tips, and includes the
following topics:
■
■
■
■
■
“Files Open in a Single Process (File Descriptor Limits)” on page 89
“Failure to Connect to HTTP Server” on page 90
“Connection Refused Errors” on page 91
“Tuning TCP Buffering” on page 91
“Using the Solaris Network Cache and Accelerator (SNCA)” on page 91
Files Open in a Single Process (File Descriptor Limits)
Different platforms each have limits on the number of files that can be open in a single process
at one time. For busy sites, you might need to increase that number. On Solaris systems, control
this limit by setting rlim_fd_max in the /etc/system file. For Solaris 8, the default is 1024,
which you can increase to 65536. For Solaris 9 and 10, the default is 65536, which doesn't need
to be increased.
After making this or any change in the /etc/system file, reboot Solaris to put the new settings
into effect. In addition, if you upgrade to a new version of Solaris, any line added to
/etc/system should be removed and added again only after verifying that it is still valid.
89
Solaris Platform-Specific Issues
An alternative way to make this change is using the ulimit –n "value" command. Using this
command does not require a system restart. However, this command only changes the login
shell, while editing the etc/system file affects all shells.
Failure to Connect to HTTP Server
If users are experiencing connection timeouts from a browser to Web Server when the server is
heavily loaded, you can increase the size of the HTTP listener backlog queue. To increase this
setting, edit the HTTP listener's listen queue value.
In addition to this setting, you must also increase the limits within the Solaris TCP/IP
networking code. There are two parameters that are changed by executing the following
commands:
/usr/sbin/ndd -set /dev/tcp tcp_conn_req_max_q 8192
/usr/sbin/ndd -set /dev/tcp tcp_conn_req_max_q0 8192
These two settings increase the maximum number of two Solaris listen queues that can fill up
with waiting connections. tcp_conn_req_max_q increases the number of completed
connections waiting to return from an accept() call. tcp_conn_req_max_q0 increases the
maximum number of connections with the handshake incomplete. The default values are 128
and 1024 respectively. To automatically have these ndd commands executed after each system
reboot, place them in a file called /etc/init.d/network-tuning and create a link to that file
named /etc/rc2.d/S99network-tuning.
You can monitor the effect of these changes by using the netstat -s command and looking at
the tcpListenDrop, tcpListenDropQ0, and tcpHalfOpenDrop values. Review them before
adjusting these values. If they are not zero, adjust the value to 2048 initially, and continue to
monitor the netstat output.
The Web Server HTTP listener's listen queue setting and the related Solaris
tcp_conn_req_max_q and tcp_conn_req_max_q0 settings should match the throughput of the
Web Server. These queues act as a "buffer" to manage the irregular rate of connections coming
from web users. These queues allow Solaris to accept the connections and hold them until they
are processed by the Web Server.
You don't want to accept more connections than the Web Server is able to process. It is better to
limit the size of these queues and reject further connections than to accept excess connections
and fail to service them. The value of 2048 for these three parameters typically reduces
connection request failures, and improvement has been seen with values as high as 4096.
This adjustment is not expected to have any adverse impact in any web hosting environment, so
you can consider this suggestion even if your system is not showing the symptoms mentioned.
90
Sun Java System Web Server 7.0 Update 1 Performance Tuning, Sizing, and Scaling Guide •
Solaris Platform-Specific Issues
Connection Refused Errors
If users are experiencing connection refused errors on a heavily loaded server, you can tune the
use of network resources on the server.
When a TCP/IP connection is closed, the port is not reused for the duration of
tcp_time_wait_interval (default value of 240000 milliseconds). This is to ensure that there
are no leftover segments. The shorter the tcp_time_wait_interval, the faster precious
network resources are again available. This parameter is changed by executing the following
command (do not reduce it below 60000):
usr/sbin/ndd -set /dev/tcp tcp_time_wait_interval 60000
To automatically have this ndd command executed after each system reboot, place it in a file
called /etc/init.d/network-tuning and create a link to that file named
/etc/rc2.d/S99network-tuning.
If your system is not exhibiting the symptoms mentioned, and if you are not well-versed in
tuning the TCP protocol, it is suggested that you do not change the above parameter.
Tuning TCP Buffering
If you are seeing unpredictable intermittent slowdowns in network response from a
consistently loaded server, you might investigate setting the sq_max_size parameter by adding
the following line to the /etc/system file:
set sq_max_size=512
This setting adjusts the size of the sync queue, which transfers packets from the hardware driver
to the TCP/IP protocol driver. Using the value of 512 allows the queue to accommodate high
volumes of network traffic without overflowing.
Using the Solaris Network Cache and Accelerator
(SNCA)
The Solaris Network Cache and Accelerator (SNCA) is a caching server that provides improved
web performance to the Solaris operating system.
It is assumed that SNCA has been configured for the system on which the Web Server is
running. For more information about SNCA and its configuration and tuning, refer to the
following man pages on your system:
■
■
ncab2clf(1)
ncakmod(1)
Chapter 4 • Platform-Specific Issues and Tips
91
Solaris Platform-Specific Issues
■
■
■
■
■
nca(1)
snca(1)
nca.if(4)
ncakmod.conf(4)
ncalogd.conf(4)
▼ To Enable SNCA to Work With Web Server
This procedure assumes that SNCA has been configured, as discussed above.
1
From the Common Tasks page, choose a configuration and click Edit Configuration.
2
Click the HTTP Listeners tab and select the HTTP listener to edit.
3
On the Edit HTTP Listener page, set the Protocol Family to nca.
The HTTP listener must be listening on port 80 for this to work.
4
Save your changes.
5
Click the Performance tab.
6
Click the Cache sub tab.
7
On the Cache Settings page, make sure the file cache is enabled and enable Use Sendfile.
8
Save your changes.
9
Redeploy the configuration for your changes to take effect.
Maximum Threads and Queue Size
When configuring Web Server to be used with SNCA, disabling the thread pool provides better
performance. These settings are on the configuration's Performance tab ⇒ HTTP sub tab,
under Thread Pool Settings. To disable the thread pool, deselect the Thread Pool Enabled
checkbox. You can also disable the thread pool using the wadm set-thread-pool-prop
command's enabled property.
The thread pool can also be disabled with non-SNCA configurations, especially for cases in
which short latency responses with no keep-alives must be delivered.
92
Sun Java System Web Server 7.0 Update 1 Performance Tuning, Sizing, and Scaling Guide •
Solaris File System Tuning
Solaris File System Tuning
This section discusses changes that can be made for file system tuning, and includes topics that
address the following issues:
■
■
■
“High File System Page-In Rate” on page 93
“Reduce File System Housekeeping” on page 93
“Long Service Times on Busy Disks or Volumes” on page 93
Please read the descriptions of the following parameters carefully. If the description matches
your situation, consider making the adjustment.
High File System Page-In Rate
If you are seeing high file system page-in rates on Solaris 8 or 9, you might benefit from
increasing the value of segmap_percent. This parameter is set by adding the following line to
the /etc/system file:
set segmap_percent=25
segmap_percent adjusts the percentage of memory that the kernel maps into its address space
for the file system cache. The default value is 12; that is, the kernel reserves enough space to map
at most 12% of memory for the file system cache. On a heavily loaded machine with 4 GB of
physical memory, improvements have been seen with values as high as 60. You should
experiment with this value, starting with values around 25. On systems with large amounts of
physical memory, you should raise this value in small increments, as it can significantly increase
kernel memory requirements.
Reduce File System Housekeeping
UNIX file system (UFS) volumes maintain the time that each file was accessed. Note that the
following change does not turn off the access time updates when the file is modified, but only
when the file is accessed. If the file access time updates are not important in your environment,
you could turn them off by adding the noatime parameter to the data volume's mount point in
/etc/vfstab. For example:
/dev/dsk/c0t5d0s6 /dev/rdsk/c0t5d0s6 /data0 ufs 1 yes noatime
Long Service Times on Busy Disks or Volumes
Web Server's responsiveness depends greatly on the performance of the disk subsystem. Use the
iostat utility to monitor how busy the disks are and how rapidly they complete I/O requests
Chapter 4 • Platform-Specific Issues and Tips
93
Solaris Platform-Specific Performance Monitoring
(the %b and svc_t columns, respectively). Service times are unimportant for disks that are less
than about 30% busy, but for busier disks, service times should not exceed about 20
milliseconds. If your busy disks have slower service times, improving disk performance might
help Web Server performance substantially.
Your first step should be to balance the load: if some disks are busy while others are lightly
loaded, move some files off of the busy disks and onto the idle disks. If there is an imbalance,
correcting it usually gives a far greater payoff than trying to tune the overloaded disks.
Solaris Platform-Specific Performance Monitoring
This section describes some of the Solaris-specific tools and utilities you can use to monitor
your system's behavior, and includes the following topics:
■
■
■
“Short-Term System Monitoring” on page 94
“Long-Term System Monitoring” on page 95
““Intelligent” Monitoring” on page 95
The tools described in this section monitor performance from the standpoint of how the system
responds to the load that Web Server generates. For information about using Web Server's own
capabilities to track the demands that users place on the Web Server itself, see “Monitoring
Server Performance” on page 22.
Short-Term System Monitoring
Solaris offers several tools for taking “snapshots” of system behavior. Although you can capture
their output in files for later analysis, the tools listed below are primarily intended for
monitoring system behavior in real time:
■
The iostat -x 60 command reports disk performance statistics at 60-second intervals.
Watch the %b column to see how much of the time each disk is busy. For any disk busy more
than about 20% of the time, pay attention to the service time as reported in the svct column.
Other columns report the I/O operation rates, the amount of data transferred, and so on.
■
The vmstat 60 command summarizes virtual memory activity and some CPU statistics at
60-second intervals.
Monitor the sr column to keep track of the page scan rate and take action if it's too high
(note that "too high" is very different for Solaris 8 and 9 than for earlier releases). Watch the
us, sy, and id columns to see how heavily the CPUs are being used; remember that you need
to keep plenty of CPU power in reserve to handle sudden bursts of activity. Also keep track
of the r column to see how many threads are contending for CPU time; if this remains
higher than about four times the number of CPUs, you might need to reduce the server's
concurrency.
94
Sun Java System Web Server 7.0 Update 1 Performance Tuning, Sizing, and Scaling Guide •
Solaris 10 Platform-Specific Tuning Information
■
The mpstat 60 command gives a detailed look at CPU statistics, while the netstat -i 60
command summarizes network activity.
Long-Term System Monitoring
It is important not only to "spot-check" system performance with the tools mentioned above,
but to collect longer-term performance histories so you can detect trends. If nothing else, a
baseline record of a system performing well might help you figure out what has changed if the
system starts behaving poorly. Enable the system activity reporting package by doing the
following:
■
Edit the file /etc/init.d/perf and remove the # comment characters from the lines near
the end of the file. For Solaris 10, run the following command:
svcadm enable system/sar
■
Run the command crontab -e sys and remove the # comment characters from the lines
with the sa1 and sa2 commands. You might also wish to adjust how often the commands
run and at what times of day depending on your site's activity profile (see the crontab man
page for an explanation of the format of this file).
This causes the system to store performance data in files in the /var/adm/sa directory,
where by default they are retained for one month. You can then use the sar command to
examine the statistics for time periods of interest.
“Intelligent”Monitoring
The SE toolkit is a freely downloadable software package developed by Sun performance
experts. In addition to collecting and monitoring raw performance statistics, the toolkit can
apply heuristics to characterize the overall health of the system and highlight areas that might
need adjustment. You can download the toolkit and its documentation from the following
location:
http://www.sunfreeware.com/setoolkit.html
Solaris 10 Platform-Specific Tuning Information
DTrace is a comprehensive dynamic tracing framework for the Solaris Operating Environment.
You can use the DTrace Toolkit to monitor the system. It is available from the following URL:
http://www.opensolaris.org/os/community/dtrace/dtracetoolkit/
Chapter 4 • Platform-Specific Issues and Tips
95
Tuning Solaris for Performance Benchmarking
Tuning Solaris for Performance Benchmarking
The following table shows the operating system tuning for Solaris used when benchmarking for
performance and scalability. These values are an example of how you might tune your system to
achieve the desired result.
TABLE 4–1
Tuning Solaris for Performance Benchmarking
Parameter
Scope
Default Value
Tuned Value
Comments
rlim_fd_max
/etc/system
65536
65536
Process open file descriptors limit;
should account for the expected load
(for the associated sockets, files, and
pipes if any).
sq_max_size
/etc/system
2
0
Controls streams driver queue size;
setting to 0 makes it infinite so the
performance runs won’t be hit by lack
of buffer space. Set on clients too.
Note that setting sq_max_size to 0
might not be optimal for production
systems with high network traffic.
tcp_time_wait_interval
ndd /dev/tcp
240000
60000
Set on clients too.
tcp_conn_req_max_q
ndd /dev/tcp
128
1024
tcp_conn_req_max_q0
ndd /dev/tcp
1024
4096
tcp_ip_abort_interval
ndd /dev/tcp
480000
60000
tcp_keepalive_interval
ndd /dev/tcp
7200000
900000
For high traffic web sites, lower this
value.
tcp_rexmit_interval_initial
ndd /dev/tcp
3000
3000
If retransmission is greater than
30-40%, you should increase this
value.
tcp_rexmit_interval_max
ndd /dev/tcp
240000
10000
tcp_rexmit_interval_min
ndd /dev/tcp
200
3000
tcp_smallest_anon_port
ndd /dev/tcp
32768
1024
Set on clients too.
tcp_slow_start_initial
ndd /dev/tcp
1
2
Slightly faster transmission of small
amounts of data.
tcp_xmit_hiwat
ndd /dev/tcp
8129
32768
To increase the transmit buffer.
tcp_recv_hiwat
ndd /dev/tcp
8129
32768
To increase the receive buffer.
96
Sun Java System Web Server 7.0 Update 1 Performance Tuning, Sizing, and Scaling Guide •
Tuning UltraSPARC® T1–Based Systems for Performance Benchmarking
Tuning UltraSPARC® T1–Based Systems for Performance
Benchmarking
Use a combination of tunable parameters and other parameters to tune your system for
performance benchmarking. These values are an example of how you might tune your system
to achieve the desired result.
Tuning Operating System and TCP Settings
The following table shows the operating system tuning for Solaris 10 used when benchmarking
for performance and scalability on UtraSPARC T1–based systems (64 bit systems).
TABLE 4–2
Tuning 64–bit Systems for Performance Benchmarking
Parameter
Scope
Default Value
Tuned Value
Comments
rlim_fd_max
/etc/system
65536
260000
Process open file descriptors limit;
should account for the expected load
(for the associated sockets, files, pipes
if any).
hires_tick
/etc/system
sq_max_size
/etc/system
1
2
0
ip:ip_squeue_bind
0
ip:ip_squeue_fanout
1
ipge:ipge_taskq_disable
/etc/system
0
ipge:ipge_tx_ring_size
/etc/system
2048
ipge:ipge_srv_fifo_depth
/etc/system
2048
ipge:ipge_bcopy_thresh
/etc/system
384
ipge:ipge_dvma_thresh
/etc/system
384
ipge:ipge_tx_syncq
/etc/system
1
tcp_conn_req_max_q
ndd /dev/tcp
128
Chapter 4 • Platform-Specific Issues and Tips
Controls streams driver queue size;
setting to 0 makes it infinite so the
performance runs won’t be hit by lack
of buffer space. Set on clients too.
Note that setting sq_max_size to 0
might not be optimal for production
systems with high network traffic.
3000
97
Tuning UltraSPARC® T1–Based Systems for Performance Benchmarking
TABLE 4–2
Tuning 64–bit Systems for Performance Benchmarking
(Continued)
Parameter
Scope
Default Value
Tuned Value
Comments
tcp_conn_req_max_q0
ndd /dev/tcp
1024
3000
tcp_max_buf
ndd /dev/tcp
4194304
tcp_cwnd_max
ndd/dev/tcp
2097152
tcp_xmit_hiwat
ndd /dev/tcp
8129
400000
To increase the transmit buffer.
tcp_recv_hiwat
ndd /dev/tcp
8129
400000
To increase the receive buffer.
Note that the IPGE driver version is 1.25.25.
Disk Configuration
If HTTP access is logged, follow these guidelines for the disk:
■
Write access logs on faster disks or attached storage.
■
If running multiple instances, move the logs for each instance onto separate disks as much
as possible.
■
Enable the disk read/write cache. Note that if you enable write cache on the disk, some
writes might be lost if the disk fails.
■
Consider mounting the disks with the following options, which might yield better disk
performance: nologging, directio, noatime.
Network Configuration
If more than one network interface card is used, make sure the network interrupts are not all
going to the same core. Run the following script to disable interrupts:
allpsr=‘/usr/sbin/psrinfo | grep -v off-line | awk ’{ print $1 }’‘
set $allpsr
numpsr=$#
while [ $numpsr -gt 0 ];
do
shift
numpsr=‘expr $numpsr - 1‘
tmp=1
while [ $tmp -ne 4 ];
do
/usr/sbin/psradm -i $1
shift
numpsr=‘expr $numpsr - 1‘
98
Sun Java System Web Server 7.0 Update 1 Performance Tuning, Sizing, and Scaling Guide •
Tuning UltraSPARC® T1–Based Systems for Performance Benchmarking
tmp=‘expr $tmp + 1‘
done
done
Put all network interfaces into a single group. For example:
$ifconfig ipge0 group webserver
$ifconfig ipge1 group webserver
Web Server Start Options
In some cases, performance can be improved by using large page sizes. To start the 32–bit Web
Server with 4 MB pages:
LD_PRELOAD_32=/usr/lib/mpss.so.1 ; export LD_PRELOAD_32; export MPSSHEAP=4M;
./bin/startserv; unset LD_PRELOAD_32; unset MPSSHEAP
For 64–bit servers:
LD_PRELOAD_64=/usr/lib/64/mpss.so.1; export LD_PRELOAD_64; export MPSSHEAP=4M;
./bin/startserv; unset LD_PRELOAD_64; unset MPSSHEAP
Chapter 4 • Platform-Specific Issues and Tips
99
100
5
C H A P T E R
5
Sizing and Scaling Your Server
This chapter examines the subsystems of your server, and provides recommendations for
optimal performance. The chapter includes the following topics:
■
■
■
■
■
“64-Bit Server” on page 101
“Processors” on page 101
“Memory” on page 102
“Drive Space” on page 102
“Networking” on page 102
64-Bit Server
The 64–bit server, available on Solaris SPARC and AMD64 platforms only, is more scalable
than the 32–bit version. You can use the 64–bit server if your system has more than 4 GB of
RAM. Some of the advantages which the 64–bit server has over the 32–bit server are:
■
■
More file cache for static content
Many simultaneous servlet sessions because of the 64–bit JVM
Processors
On Solaris and Windows, Web Server transparently takes advantage of multiple CPUs. In
general, the effectiveness of multiple CPUs varies with the operating system and the workload.
Dynamic content performance improves as more processors are added to the system. Because
static content involves mostly IO, and more primary memory means more caching of the
content (assuming the server is tuned to take advantage of the memory), more time is spent in
IO rather than CPU activity.
101
Memory
Memory
As a baseline, Web Server requires 64 MB RAM. Multiple CPUs require at least 64 MB for each
CPU. For example, if you have four CPUs, you should install at least 256 MB RAM for optimal
performance. For high numbers of peak concurrent users, also allow extra RAM for the
additional threads. After the first 50 concurrent users, add an extra 512 KB for each peak
concurrent user.
Drive Space
You need to have enough drive space for your OS, document tree, and log files. In most cases, 2
GB total is sufficient.
Put the OS, swap/paging file, Web Server logs, and document tree each on separate hard drives.
If your log files fill up the log drive, your OS does not suffer. Also, you’ll be able to tell whether,
for example, the OS paging file is causing drive activity.
Your OS vendor might have specific recommendations for how much swap or paging space you
should allocate. Based on testing, Web Server performs best with swap space equal to RAM,
plus enough to map the document tree.
Networking
For an Internet site, decide how many peak concurrent users you need the server to handle, and
multiply that number of users by the average request size on your site. Your average request
might include multiple documents. If you’re not sure, try using your home page and all of its
associated subframes and graphics.
Next decide how long the average user will be willing to wait for a document, at peak utilization.
Divide by that number of seconds. That’s the WAN bandwidth your server needs.
For example, to support a peak of 50 users with an average document size of 24 KB, and
transferring each document in an average of 5 seconds, 240 KBs (1920 Kbit/s) are needed.
Therefore, our site needs two T1 lines (each 1544 Kbit/s). This also allows some overhead for
growth.
Your server’s network interface card should support more than the WAN to which it’s
connected. For example, if you have up to three T1 lines, you can get by with a 10BaseT
interface. Up to a T3 line (45 Mbit/s), you can use 100BaseT. But if you have more than 50
Mbit/s of WAN bandwidth, consider configuring multiple 100BaseT interfaces, or look at
Gigabit Ethernet technology.
For an intranet site, your network is unlikely to be a bottleneck. However, you can use the same
calculations as above to verify this.
102
Sun Java System Web Server 7.0 Update 1 Performance Tuning, Sizing, and Scaling Guide •
6
C H A P T E R
6
Scalability Studies
This chapter describes the results of scalability studies. You can refer to these studies for a
sample of how the server performs, and how you might configure your system to best take
advantage of Web Server’s strengths.
This chapter includes the following topics:
■
■
■
■
■
■
“Study Goals” on page 103
“Study Conclusion” on page 104
“Hardware” on page 104
“Software” on page 105
“Configuration and Tuning” on page 105
“Performance Tests and Results” on page 108
Study Goals
The goal of the tests in the study was to shows how well Sun Java System Web Server 7 scales.
The tests also helped to determine the configuration and tuning requirements for different
types of content.
The studies were conducted with the following content:
■
■
■
■
■
■
■
100% static
100% C CGI
100% Perl CGI
100% NSAPI
100% Java servlets
100% PHP/FastCGI
E-commerce web application with large inventory
103
Study Conclusion
Study Conclusion
When tuned, Sun Java System Web Server 7.0 scaled almost linearly in performance for
dynamic and static content.
Hardware
The studies (except for the e-commerce study) were conducted using the following hardware.
For hardware information for the e-commerce study, see “Hardware for E-Commerce Test” on
page 122.
Web Server system configuration for static content:
■
Sun Microsystems Sun Fire T2000 (120 MHz, 8 cores) (only six cores were used for this test)
■
16256 Megabytes of memory
■
Solaris 10 operating system
■
Three Sun StoreEdge 3510
Web Server system configuration:
■
■
■
Sun Microsystems Sun Fire T2000 (1000 MHz , 6 cores)
16376 Megabytes of memory
Solaris 10 operating system
Driver system configuration:
■
■
■
■
■
■
Three Sun Microsystems Sun FireTM X4100
Four Sun Microsystems Sun Fire V490 ( 2 X 1050 MHzUS-IV)
Three Sun Fire T1000
Sun Fire 880 (990 MHz US-III+)
8192 Megabytes of memory
Solaris 10 operating system
Network configuration:
The Web Server and the driver machines were connected with multiple gigabit Ethernet links
104
Sun Java System Web Server 7.0 Update 1 Performance Tuning, Sizing, and Scaling Guide •
Configuration and Tuning
Software
The load driver for these tests was an internally-developed Java application framework called
the Faban driver.
Configuration and Tuning
The following tuning settings are common to all the tests in this study. Individual studies may
also have additional configuration and tuning information.
/etc/system tuning:
set rlim_fd_max=500000
set rlim_fd_cur=500000
set
set
set
set
set
set
set
set
sq_max_size=0
consistent_coloring=2
autoup=60
ip:ip_squeue_bind=0
ip:ip_soft_rings_cnt=0
ip:ip_squeue_fanout=1
ip:ip_squeue_enter=3
ip:ip_squeue_worker_wait=0
set
set
set
set
set
segmap_percent=6
bufhwm=32768
maxphys=1048576
maxpgio=128
ufs:smallfile=6000000
*For ipge driver
set ipge:ipge_tx_ring_size=2048
set ipge:ipge_tx_syncq=1
set ipge:ipge_srv_fifo_depth=16000
set ipge:ipge_reclaim_pending=32
set ipge:ipge_bcopy_thresh=512
set ipge:ipge_dvma_thresh=1
set pcie:pcie_aer_ce_mask=0x1
*For e1000g driver
set pcie:pcie_aer_ce_mask = 0x1
TCP/IP tuning:
ndd -set /dev/tcp tcp_conn_req_max_q 102400
ndd -set /dev/tcp tcp_conn_req_max_q0 102400
Chapter 6 • Scalability Studies
105
Configuration and Tuning
ndd
ndd
ndd
ndd
-set
-set
-set
-set
/dev/tcp
/dev/tcp
/dev/tcp
/dev/tcp
tcp_max_buf 4194304
tcp_cwnd_max 2097152
tcp_recv_hiwat 400000
tcp_xmit_hiwat 400000
Network Configuration
Since the tests used multiple network interfaces, it was important to make sure that all the
network interfaces were not going to the same core. Network interrupts were enabled on one
strand and disabled on the remaining three strand of a core using the following script:
allpsr=‘/usr/sbin/psrinfo | grep -v off-line | awk ’{ print $1 }’‘
set $allpsr
numpsr=$#
while [ $numpsr -gt 0 ];
do
shift
numpsr=‘expr $numpsr - 1‘
tmp=1
while [ $tmp -ne 4 ];
do
/usr/sbin/psradm -i $1
shift
numpsr=‘expr $numpsr - 1‘
tmp=‘expr $tmp + 1‘
done
done
The following example shows psrinfo output before running the script:
# psrinfo | more
0
on-line
1
on-line
2
on-line
3
on-line
4
on-line
5
on-line
.................
since
since
since
since
since
since
12/06/2006
12/06/2006
12/06/2006
12/06/2006
12/06/2006
12/06/2006
14:28:34
14:28:35
14:28:35
14:28:35
14:28:35
14:28:35
The following example shows psrinfo output after running the script:
0
1
2
3
4
106
on-line
no-intr
no-intr
no-intr
on-line
since
since
since
since
since
12/06/2006
12/07/2006
12/07/2006
12/07/2006
12/06/2006
14:28:34
09:17:04
09:17:04
09:17:04
14:28:35
Sun Java System Web Server 7.0 Update 1 Performance Tuning, Sizing, and Scaling Guide •
Configuration and Tuning
5
no-intr since 12/07/2006 09:17:04
.................
Web Server Tuning
The following table shows the tuning settings used for the Web Server.
TABLE 6–1
Web Server Tuning Settings
Component
Default
Tuned
Access logging
enabled=true
enabled=false
Thread pool
min-threads=16
min-threads=128
max-threads=128
max-threads=200
stack-size=131072
stack-size=262144
queue-size=1024
queue-size=15000
Non-secure listener on port 80
Non-secure listener on port 80
listen-queue-size=128
Secure listener on port 443
HTTP listener
listen-queue-size=15000
Keep alive
default-web.xml
enabled=true
enabled=true
threads=1
threads=2
max-connections=200
timeout=30 sec
max-connections=15000
timeout=180 sec
JSP compilation turned on
JSP compilation turned off
The following table shows the SSL session cache tuning settings used for the SSL tests.
TABLE 6–2
SSL Session Cache Tuning Settings
Component
Default
SSL session cache
enabled=true
max-entries=10000
max-ssl2-session-age=100
max-ssl3-tls-session-age=86400
Chapter 6 • Scalability Studies
107
Performance Tests and Results
Performance Tests and Results
This section contains the test-specific configuration, tuning, and results for the following tests:
■
■
■
■
■
■
■
■
■
■
■
“Static Content Test” on page 108
“Dynamic Content Test: Servlet” on page 110
“Dynamic Content Test: C CGI” on page 111
“Dynamic Content Test: Perl CGI” on page 113
“Dynamic Content Test: NSAPI” on page 114
“PHP Scalability Tests” on page 115
“SSL Performance Test: Static Content” on page 118
“SSL Performance Test: Perl CGI” on page 119
“SSL Performance Test: C CGI” on page 120
“SSL Performance Test: NSAPI” on page 121
“E-Commerce Web Application Test” on page 122
The following metrics were used to characterize performance:
■
■
Operations per second (ops/sec) = successful transactions per second
Response time for single transaction (round-trip time) in milliseconds
The performance and scalability diagrams show throughput (ops/sec) against the number of
cores enabled on the system.
Static Content Test
This test was performed with a static download of a randomly selected file from a pool of 10,000
directories, each containing 36 files ranging in size from 1KB to 1000 KB. The goal of the static
content test was to saturate the cores and find out the respective throughput and response time.
This test used the following configuration:
108
■
Static files were created on striped disk array (Sun StorEdge 3510).
■
Multiple network interfaces were configured.
■
Web Server was configured with 64 bit.
■
File-cache was enabled with the tuning settings described in the following table.
Sun Java System Web Server 7.0 Update 1 Performance Tuning, Sizing, and Scaling Guide •
Performance Tests and Results
TABLE 6–3
File Cache Configuration
Default
Tuned
enabled=true
enabled=true
max-age=30 sec
max-age=3600
max-entries=1024
max-entries=1048576
sendfile=false
sendfile=true
max-heap-file-size=524288
max-heap-file-size=1200000
max-heap-space=10485760
max-heap-space=8000000000
max-mmap-file-size=0
max-mmap-file-size=1048576
max-mmap-space=0
max-mmap-space= l
max-open-files=1048576
The following table shows the static content scalability results.
TABLE 6–4
Static Content Scalability
Number Of Cores
Average Throughput (ops/sec)
Average Response Time (ms)
2
10365
184
4
19729
199
6
27649
201
The following is a graphical representation of static content scalability results.
Chapter 6 • Scalability Studies
109
Performance Tests and Results
Static Content Scalability
Throughput(ops/sec)
28000
27000
26000
25000
24000
23000
22000
21000
20000
19000
18000
17000
16000
15000
14000
13000
12000
11000
10000
Throughput
2
4
6
Number of cores
Dynamic Content Test: Servlet
This test was conducted using the servlet. The test prints out the servlet's initialization
arguments, environments, request headers, connection and client information, URL
information, and remote user information. JVM tuning settings were applied to the server. The
goal was to saturate the cores on the server and find out the respective throughput and response
time.
The following table shows the JVM tuning settings used in the test.
TABLE 6–5
Default
Tuned
-Xmx128m
-server -Xrs -Xmx2048m -Xms2048m -Xmn2024m
-XX:+AggressiveHeap -XX:LargePageSizeInBytes=256m
-XX:+UseParallelOldGC -XX:+UseParallelGC
-XX:ParallelGCThreads=<number of cores>
-XX:+DisableExplicitGC
-Xms256m
110
JVM Tuning Settings
Sun Java System Web Server 7.0 Update 1 Performance Tuning, Sizing, and Scaling Guide •
Performance Tests and Results
The following table shows the results for the dynamic content servlet test.
TABLE 6–6
Dynamic Content Test: Servlet Scalability
Number Of Cores
Average Throughput (ops/sec)
Average Response Time (ms)
2
5287
19
4
10492
19
6
15579
19
The following is a graphical representation of servlet scalability results.
Servlet Scalability
16000
15000
Throughput(ops/sec)
14000
13000
12000
11000
Throughput
10000
9000
8000
7000
6000
5000
2
4
6
Number of cores
Dynamic Content Test: C CGI
This test was performed by accessing a C executable called printenv. This executable outputs
the environment variable information. CGI tuning settings were applied to the server. The goal
was to saturate the cores on the server and find out the respective throughput and response
time.
The following table describes the CGI tuning settings used in this test.
Chapter 6 • Scalability Studies
111
Performance Tests and Results
TABLE 6–7
CGI Tuning Settings
Default
Tuned
idle-timeout=300
idle-timeout=300
cgistub-idle-timeout=30
cgistub-idle-timeout=1000
min-cgistubs=0
min-cgistubs=100
max-cgistubs=16
max-cgistubs=100
The following table shows the results of the dynamic content test for C CGI.
TABLE 6–8
Dynamic Content Test: C CGI Scalability
Number Of Cores
Average Throughput (ops/sec)
Average Response Time (ms)
2
892
112
4
1681
119
6
2320
129
The following is a graphical representation of C CGI scalability results.
Throughput(ops/sec)
C CGI Scalability
2400
2300
2200
2100
2000
1900
1800
1700
1600
1500
1400
1300
1200
1100
1000
900
800
Throughput
2
4
6
Number of cores
112
Sun Java System Web Server 7.0 Update 1 Performance Tuning, Sizing, and Scaling Guide •
Performance Tests and Results
Dynamic Content Test: Perl CGI
This test was conducted with Perl script called printenv.pl that prints the CGI environment.
CGI tuning settings were applied to the server. The goal was to saturate the cores on the server
and find out the respective throughput and response time.
The following table shows the CGI tuning settings used in the dynamic content test for Perl
CGI.
TABLE 6–9
CGI Tuning Settings
Default
Tuned
idle-timeout=300
idle-timeout=300
cgistub-idle-timeout=30
cgistub-idle-timeout=1000
min-cgistubs=0
min-cgistubs=100
max-cgistubs=16
max-cgistubs=100
The following table shows the results for the dynamic content test of Perl CGI.
TABLE 6–10
Dynamic Content Test: Perl CGI Scalability
Number Of Cores
Average Throughput (ops/sec)
Average Response Time (ms)
2
322
310
4
611
327
6
873
343
The following is a graphical representation of Perl CGI scalability results.
Chapter 6 • Scalability Studies
113
Performance Tests and Results
Perl CGI Scalability
900
850
Throughput(ops/sec)
800
750
700
650
Throughput
600
550
500
450
400
350
300
2
4
6
Number of cores
Dynamic Content Test: NSAPI
The NSAPI module used in this test was printenv2.so. It prints the NSAPI environment
variables along with some text to make the entire response 2 KB. The goal was to saturate the
cores on the server and find out the respective throughput and response time.
The only tuning for this test was optimizing the path checks in obj.conf by removing the
unused path checks.
The following table shows the results of the dynamic content test for NSAPI.
TABLE 6–11
Dynamic Content Test: NSAPI Scalability
Number Of Cores
Average Throughput (ops/sec)
Average Response Time (ms)
2
6264
14
4
12520
15
6
18417
16
The following is a graphical representation of NSAPI scalability results.
114
Sun Java System Web Server 7.0 Update 1 Performance Tuning, Sizing, and Scaling Guide •
Performance Tests and Results
NSAPI Scalability
19000
18000
17000
Throughput(ops/sec)
16000
15000
14000
Throughput
13000
12000
11000
10000
9000
8000
7000
6000
5000
2
4
6
Number of cores
PHP Scalability Tests
PHP is a widely-used scripting language uniquely suited to creating dynamic, Web-based
content. It is the most rapidly expanding scripting language in use on the Internet due to its
simplicity, accessibility, wide number of available modules, and large number of easily available
applications.
The scalability of Web Server combined with the versatility of the PHP engine provides a
high-performing and versatile web deployment platform for dynamic content. These tests used
PHP version 5.1.6.
The tests were performed in two modes:
■
An out-of-process fastcgi-php application invoked using the FastCGI plug-in available for
Sun Java System Web Server 7.0 (the download will be available from
http://www.zend.com/sun/).
■
In-process PHP NSAPI plug-in.
The test executed the phpinfo() query. The goal was to saturate the cores on the server and find
out the respective throughput and response time.
PHP Scalability with Fast CGI
The following table shows the Web Server tuning settings used for the FastCGI plug-in test
Chapter 6 • Scalability Studies
115
Performance Tests and Results
TABLE 6–12
Tuning Settings for FastCGI Plug-in Test
Configuration
Tuning
magnus.conf
Init fn="load-modules"
shlib="path_to_web_server_plugin_dir/fastcgi/libfastcgi.so"
funcs="responder_fastcgi" shlib_flags="(global|now)"
obj.conf
NameTrans fn="assign-name" from="/fcgi/*" name="fcgi.config"
<Object name="fcgi.config">
Service type="magnus-internal/ws-php" fn="responder-fastcgi"
app-path="path_to_php"
bind-path="localhost:9000"
app-env="PHP_FCGI_CHILDREN=128"
app-env="PHP_FCGI_MAX_REQUESTS=20000"
app-env="LD_LIBRARY_PATH=path_to_php_lib"
listen-queue=8192
req-retry=2
reuse-connection=1
connection-timeout=120
resp-timeout=60
restart-interval=0
</Object>
mime.types
type=magnus-internal/ws-php exts=php,php3,php4
The following table shows the results of the PHP with FastCGI test.
TABLE 6–13
PHP Scalability with Fast CGI
Number of Cores
Average Throughput (ops/sec)
Average Response Time (ms)
2
876
114
4
1706
117
6
2475
121
The following is a graphical representation of PHP scalability with Fast CGI.
116
Sun Java System Web Server 7.0 Update 1 Performance Tuning, Sizing, and Scaling Guide •
Performance Tests and Results
Throughput(ops/sec)
PHP Scalability With Fast CGI
2500
2400
2300
2200
2100
2000
1900
1800
1700
1600
1500
1400
1300
1200
1100
1000
900
800
Throughput
2
4
6
Number of cores
PHP Scalability with NSAPI
The following table shows the Web Server tuning settings for the PHP with NSAPI test.
TABLE 6–14
NSAPI Plug-in Configuration for PHP
magnus.conf
Init fn="load-modules" shlib="libphp5.so"
funcs="php5_init,php5_close,php5_execute"
Init fn="php5_init" errorString="PHP Totally Blew Up!"
obj.conf
NameTrans fn="pfx2dir" from="/php-nsapi"
dir="path_to_php_script_dir" name="php-nsapi" <Object
name="php-nsapi"> ObjectType fn="force-type"
type="magnus-internal/x-httpd-php" Service fn=php5_execute
</Object>
mime.types
type=magnus-internal/ws-php exts=php,php3,php4
The following table shows the results of the PHP with NSAPI test.
Chapter 6 • Scalability Studies
117
Performance Tests and Results
TABLE 6–15
PHP Scalability with NSAPI
Number of Cores
Average Throughput (ops/sec)
Average Response Time (ms)
2
950
105
4
1846
108
6
2600
115
The following is a graphical representation of PHP scalability with NSAPI.
PHP Scalability With NSAPI
2600
2400
Throughput(ops/sec)
2200
2000
1800
Throughput
1600
1400
1200
1000
800
2
4
6
Number of cores
SSL Performance Test: Static Content
This test was performed with static download of a randomly selected file from a pool of 10,000
directories, each containing 36 files ranging in size from 1KB to 1000 KB. The goal of the SSL
static content tests was to saturate the cores and find out the respective throughput and
response time. Only four cores of T2000 were used for this test.
This test used the following configuration:
■
■
■
■
118
Static files were created on striped disk array (Sun StorEdge 3510).
Multiple network interfaces were configured.
The file cache was enabled and tuned using the settings in Table 6–3.
The SSL session cache was tuned using the settings in Table 6–2.
Sun Java System Web Server 7.0 Update 1 Performance Tuning, Sizing, and Scaling Guide •
Performance Tests and Results
■
Web Server is configured with 64 bit
The following table shows the SSL static content test results.
TABLE 6–16
SSL Performance Test: Static Content Scalability
Number of Cores
Average Throughput (ops/sec)
Average Response Time (ms)
2
2284
379
4
4538
387
6
6799
387
The following is a graphical representation of static content scalability with SSL.
Static Content Scalability With SSL
7000
Throughput(ops/sec)
6500
6000
5500
5000
Throughput
4500
4000
3500
3000
2500
2000
2
4
Number of cores
6
SSL Performance Test: Perl CGI
This test was conducted with Perl script called printenv.pl that prints the CGI environment in
SSL mode. The test was performed in SSL mode with the SSL session cache enabled. The goal
was to saturate the cores on the server and find out the respective throughput and response
time.
The following table shows the SSL Perl CGI test results.
Chapter 6 • Scalability Studies
119
Performance Tests and Results
TABLE 6–17
SSL Performance Test: Perl CGI Scalability
Number of Cores
Average Throughput (ops/sec)
Average Response Time (ms)
2
303
329
4
580
344
6
830
361
The following is a graphical representation of Perl scalability with SSL.
Perl CGI Scalability With SSL
850
800
Throughput(ops/sec)
750
700
650
600
Throughput
550
500
450
400
350
300
2
4
Number of cores
6
SSL Performance Test: C CGI
This test was performed by accessing a C executable called printenv in SSL mode. This
executable outputs the environment variable information. The test was performed in SSL mode
with the SSL session cache enabled. The goal was to saturate the cores on the server and find out
the respective throughput and response time.
The following table shows the SSL CGI test results.
120
Sun Java System Web Server 7.0 Update 1 Performance Tuning, Sizing, and Scaling Guide •
Performance Tests and Results
TABLE 6–18
SSL Performance Test: C CGI Scalability
Number of Cores
Average Throughput (ops/sec)
Average Response Time (ms)
2
792
126
4
1499
133
6
2127
141
The following is a graphical representation of C CGI scalability with SSL.
Throughput(ops/sec)
C CGI Scalability With SSL
2200
2100
2000
1900
1800
1700
1600
1500
1400
1300
1200
1100
1000
900
800
700
Throughput
2
4
Number of cores
6
SSL Performance Test: NSAPI
The NSAPI module used in this test was printenv2.so. It prints the NSAPI environment
variables along with some text to make the entire response 2 KB. The test was performed in SSL
mode with the SSL session cache enabled. The goal was to saturate the cores on the server and
find out the respective throughput and response time.
The following table shows the SSL NSAPI test results.
Chapter 6 • Scalability Studies
121
Performance Tests and Results
TABLE 6–19
SSL Performance Test: NSAPI Scalability
Number of Cores
Average Throughput (ops/sec)
Average Response Time (ms)
2
2729
29
4
5508
30
6
7982
32
The following is a graphical representation of NSAPI scalability with SSL.
NSAPI Scalability With SSL
8000
7500
Throughput(ops/sec)
7000
6500
6000
Throughput
5500
5000
4500
4000
3500
3000
2500
2
4
Number of cores
6
E-Commerce Web Application Test
The e-commerce application is a more complicated application that utilizes a database to
simulate online shopping.
Hardware for E-Commerce Test
The e-commerce studies were conducted using the following hardware.
Web Server system configuration:
122
■
Sun Microsystems Sun Fire 880 ( 900MHz US-III+). Only four CPUs were used for this test.
■
16384 Megabytes of memory.
■
Solaris 10 operating system.
Sun Java System Web Server 7.0 Update 1 Performance Tuning, Sizing, and Scaling Guide •
Performance Tests and Results
Database system configuration:
■
■
■
■
Sun Microsystems Sun Fire 880 ( 900MHz US-III+)
16384 Megabytes of memory
Solaris 10 operating system
Oracle 10.1.0.2.0
Driver system configuration:
■
■
Sun Microsystems Sun Fire 880 ( 900MHz US-III+)
Solaris 10 operating system
Network configuration:
The Web Server, database, and the driver machines were connected with a gigabit Ethernet link.
Configuration and Tuning for E-Commerce Test
The e-commerce test was run with the following tuning settings.
JDBC tuning:
<jdbc-resource>
<jndi-name>jdbc/jwebapp</jndi-name>
<datasource-class>oracle.jdbc.pool.OracleDataSource</datasource-class>
<max-connections>200</max-connections>
<idle-timeout>0</idle-timeout>
<wait-timeout>5</wait-timeout>
<connection-validation>auto-commit</connection-validation>
<property>
<name>username</name>
<value> db_user </value>
</property>
<property>
<name>password</name>
<value> db_password
</value>
</property>
<property>
<name>url</name>
<value>jdbc:oracle:thin:@db_host_name:1521:oracle_sid</value>
</property>
<property>
<name>ImplicitCachingEnabled</name>
<value>true</value>
</property>
<property>
<name>MaxStatements</name>
<value>200</value>
</property>
</jdbc-resource
Chapter 6 • Scalability Studies
123
Performance Tests and Results
JVM tuning:
-server -Xmx1500m -Xms1500m -Xss128k -XX:+DisableExplicitGC
E-commerce Application Description
The test models an e-commerce web site that sells items from a large inventory. It uses the
standard web application model-view-controller design pattern for its implementation: the user
interface (that is, the view) is handled by 16 different JSP pages which interface with a single
master control servlet. The servlet maintains JDBC connections to the database, which serves as
the model and handles 27 different queries. The JSP pages make extensive use of JSP tag
libraries and comprise almost 2000 lines of logic.
Database Cardinality
The database contains 1000 orderable items (which have two related tables which also have a
cardinality of 1000), 72000 customers (with two related tables), and 1.9 million orders (with two
related tables). Standard JDBC connections handle database connection using prepared
statements and following standard JDBC design principles.
Workload
A randomly-selected user performs the online shopping. The following operations were used in
the Matrix mix workload (operations were carried out with precedence of operations): Home,
AdminConfirm, AdminRequest, BestSellers, BuyConfirm, BuyRequest, CustomerRegistration,
NewProducts, OrderDisplay, OrderInquiry, ProductDetail, SearchRequest, SearchResults, and
ShoppingCart.
The Faban driver was used to drive the load. Think time was chosen from a negative
exponential distribution. The minimum think time was 7.5 seconds, the maximum was 75
seconds. The maximum number of concurrent users that the system can support was based on
the following passing criteria.
TABLE 6–20
124
Performance Test Pass Criteria
Transaction
90th Percentile Response Time (Seconds)
HomeStart
3
AdminConfirm
20
AdminRequest
3
BestSellers
5
BuyConfirm
5
Sun Java System Web Server 7.0 Update 1 Performance Tuning, Sizing, and Scaling Guide •
Performance Tests and Results
TABLE 6–20
Performance Test Pass Criteria
(Continued)
Transaction
90th Percentile Response Time (Seconds)
BuyRequest
3
CustomerRegistration
3
Home
3
NewProducts
5
OrderDisplay
3
OrderInquiry
3
ProductDetail
3
SearchRequest
3
SearchResults
10
ShoppingCart
3
The following table shows the e-commerce web application test results.
TABLE 6–21
E-Commerce Web Application Scalability
Number of CPUs
Users
Throughput (ops/sec)
2
7000
790
4
11200
1350
The following is a graphical representation of e-commerce web application scalability.
Chapter 6 • Scalability Studies
125
Performance Tests and Results
E-commerce Web Application Scalability
11500
11000
10500
Users
10000
9500
Users
9000
8500
8000
7500
7000
2
4
Number of CPUs
The following is a graphical representation of e-commerce web application scalability.
E-commerce Web Application Scalability
1350
1300
Throughput(ops/sec)
1250
1200
1150
1100
1050
Throughput
1000
950
900
850
800
750
2
126
Number of CPUs
4
Sun Java System Web Server 7.0 Update 1 Performance Tuning, Sizing, and Scaling Guide •
Index
Numbers and Symbols
C
64–bit servers
performance advantages, 21
scaling, 101
cache not utilized, 87
caching, servlet/JSP, 79
cgi-bucket, 36
CGIStub processes, 81
check-acl SAF, 85
class-loader, 79
class reloading, configuring, 79
classpath, directories in, 80
configurations
and performance, 20
statistics, 23
connection handling, 40-42
connection queue information, 49-51
connection queue size, and SNCA, 92
connection refused errors, 91
connection settings, JDBC resource, 75-77
connection timeouts, 90
connections, 40-46
closed, 54
JDBC, 74
simultaneous, 58
simultaneous using maximum threads setting, 45
content_length header, 54
crontab -e sys command, 95
A
acceptor threads, 52
access time updates, 93
acl-bucket, 36
ACL user cache, 77-78
max-groups-per-user, 78
max-users, 77
maximum age, 78
activating statistics, 24-25
AddLog, 83
Admin Console, more information about, 12
assign-name function, 82
async DNS cache, 70
auto-commit validation method, 76
B
benchmarking
tuning Solaris for, 96, 97
bottleneck, ACL user cache, 77
buckets, performance, 35
busy functions, 83
D
default-bucket, 35
determining requirements, 102
directories in the classpath, 80
127
Index
disabling network interrupts, 98-99
disk configuration, 98
DNS cache, 68-70
async enabled, 70
current entries, 69-70
entries, 69-70
hit ratio, 70
maximum entries, 69-70
drive space, sizing issues, 102
dynamic control and monitoring, file cache, 64
dynamic reload interval, 79
func_insert, 83
G
get-config-stats command, 26
get-perfdump command, 33
get-stats-xml command, 31
get-virtual-server-stats command, 28
get-webapp-stats command, 28
guarantee isolation, JDBC resource, 77
E
H
enable-perfdump command, 32
enable-stats-xml command, 30
enabling statistics, 24-25
etc/system file, 89
in scalability studies, 105
hardware
for e-commerce study, 122-123
for studies, 104
high concurrency mode, 41
high file system page-in rate, 93
hires_tick, 97
hit ratio, 62, 87
HotSpot VM performance FAQ, 86
HTTP 1.0-style workload, 56
HTTP 1.1-style workload, 56-57
HTTP access logged, 98
HTTP listener, statistics, 51
F
Faban driver, 105
fail all connections, JDBC resource, 77
file-bucket, 36
file cache, 59-65
cache lookups, 62
dynamic control and monitoring, 64
entries, 62
flags for ?list option, 65
hit ratio, 62
low hit rate with custom NSAPI functions, 87
maximum age, 62-63
maximum heap size, 63
nocache parameter, 63
obj.conf object for monitoring, 64
problems, cache not utilized, 87
status example, 64
file system tuning, Solaris, 93-94
find-pathinfo-forward, 82
find-pathinfo function, 82
flushed keep-alive connections, 87-88
free connections, in JDBC resources, 74
128
I
idle threads, 66
idle timeout
JDBC resource, 75, 76
init-cgi, multi-process mode, 81
iostat -x 60 command, 94
iostat utility, 93
ip:ip_squeue_bind, 97
ip:ip_squeue_fanout, 97
ipge:ipge_bcopy_thresh, 97
ipge:ipge_srv_fifo_depth, 97
ipge:ipge_taskq_disable, 97
ipge:ipge_tx_ring_size, 97
ipge:ipge_tx_syncq, 97
Sun Java System Web Server 7.0 Update 1 Performance Tuning, Sizing, and Scaling Guide •
Index
J
L
Java ES monitoring console, 37
Java heap tuning, 71
Java HotSpot VM, 71
java.lang.OutOfMemoryError, 86
Java Security Manager, configuring, 79
Java VM heap space, 86
Java web applications, tuning performance, 78-81
JDBC connection pooling, improving application
performance, 73
JDBC resources, 72-77
connection settings, 75-77
connections, 74
free connections, 74
idle timeout, 75
leased connections, 74
maxConnections, 75
peakConnections, 75
queued connections, 74
statistics in Admin Console, 73-74
validation method, 76
jsp-config, 78
JVM, 70-71
Java heap tuning, 71
LateInit, 81
LDAP server, and ACL user cache, 77
leased connections, in JDBC resources, 74
listen socket, statistics, 51
load driver, for studies, 105
load-modules function, 43
log file modes, 88
verbose, 88
long service times, 93-94
low latency mode, 41
low-memory problems, 86
K
keep-alive, 53-57
connections flushed, 87-88
count, 54-55, 87
flushes, 55, 87
hits, 55, 87
maximum connections, 54, 87
maximum number of connections, 55
poll interval, 56
refusals, 55
threads, 56
timeout, 54
timeouts, 55
KernalThreads directive, 42
M
magnus.conf
connection-handling directives, 42
init-cgi, multi-process mode, 81
manager-properties properties, 81
max-groups-per-user, ACL user cache, 78
max-users, ACL user cache, 77
maximum age, file cache, 62-63
maximum connections, JDBC resource, 76
maximum heap size, 63
maximum threads, 45, 58, 86
and NativePoolQueueSize, 67
and SNCA, 92
too few threads, 86
maxLocks, tuning, 80
MaxProcs, 45
maxSessions, 80
memory, sizing issues, 102
memory requirements, 102
meta-data validation method, 76
minimum connections, JDBC resource, 75
MMapSessionManager, tuning, 81
modes
log file, 88
multi-process, 44-46
single-process, 44
monitoring server performance
comparison of methods, 22
methods with least impact, 22
overview, 19-37
129
Index
monitoring server performance (Continued)
using Java EE monitoring console, 37
using perfdump, 31-37
using performance buckets, 35-37
using SE toolkit, 95
using stats-xml, 29-31
mpstat 60 command, 95
multi-process mode, 44-46
N
NameTrans, 43, 82
native thread pool, 43-44, 66
NativePoolMaxThreads, 66, 68
NativePoolMinThreads, 68
NativePoolQueueSize, 67
NativePoolStackSize, 67
NativeThread, 44
ndd command, 91
netstat -i 60, 95
netstat -s command, 90
network configuration, 98-99
for studies, 106-107
network interrupts, disabling, 98-99
networking, sizing issues, 102
nocache parameter, 63
nostat, 82-83
NSPR, 43
NSServletService, 35
ntrans-base, 82
O
obj.conf
custom thread pool, 42
object for monitoring the file cache, 64
performance buckets, 36
UseOutputStreamSize parameter, 57
PATH_INFO, 82
PathCheck, 43, 83
peak concurrent users, 102
perfdump
about, 31-37
enabling, 31-32
sample output, 33-35
using to monitor server activity, 31-37
performance
buckets, 35
issues, 19-20
monitoring tools, 22
overview, 19-37
problems, 85
studies, 103-126
tuning, 39-83
performance buckets
configuration of, 36
defining in magnus.conf, 36
information in perfdump, 37
performance report, 36-37
using to monitor activity, 35
performance monitoring, Solaris-specific, 94-95
performance report, performance buckets, 36-37
persistence-type, 80, 81
persistent connection information, 53-57
pfx2dir function, 82
PR_GetFileInfo, 65
precompiled JSPs, 78-79
problems
common, 85
connection timeouts, 90
keep–alive connections flushed, 87-88
log file modes, 88
low memory, 86
too few threads, 86
process modes, 44-46
processes, 40-46
processors, sizing issues, 101
profiling, 24
P
page sizes, 99
130
Sun Java System Web Server 7.0 Update 1 Performance Tuning, Sizing, and Scaling Guide •
Index
Q
quality of service
features, 20
statistics and, 24
queued connections, in JDBC resources, 74
R
ratio, hit, 62
reapIntervalSeconds, 80
refresh, 65
reload-interval, 78
restart, 65
rlim_fd_max, 89, 96, 97
S
scalability studies, 103-126
SE toolkit, 95
segmap_percent, 93
send-cgi, 35
send-file, nocache parameter, 63
server instances, statistics, 23
Service, 43, 83
servlet/JSP caching, 79
session creation information, 57-59
session-properties, 80
session settings, web application, 80-81
set-http-prop command, 57
set-stats-prop command, 25
single-process mode, 44
SNCA, 91-92
connection queue size, 92
maximum threads, 92
Solaris
file system tuning, 89-92
Network Cache and Accelerator, 91-92
platform-specific issues, 89-92
tuning for performance benchmarking, 96, 97
Solaris-specific performance monitoring, 94-95
long-term system monitoring, 95
SE toolkit, 95
short-term system monitoring, 94-95
sq_max_size, 91, 96, 97
SSL performance, 21
start options, 99
statistics
activating, 24-25
connection queue, 49
file cache information, 59
listen socket information, 51
monitoring, 23
performance buckets, 35
stats-xml
accessing URI, 30
enabling URI, 29
limiting output, 30-31
using to monitor current activity, 29-31
studies, 103-126
conclusion, 104
goals, 103
hardware used, 104
load driver, 105
network configuration, 106-107
Web Server tuning, 107-108
T
table validation method, 76
TCP buffering, tuning, 91
tcp_conn_req_max_q, 90, 96, 97
tcp_conn_req_max_q0, 90, 96, 98
tcp_cwnd_max, 98
TCP/IP, tuning, 105
tcp_ip_abort_interval, 96, 98
tcp_keepalive_interval, 96
tcp_recv_hiwat, 96, 98
tcp_rexmit_interval_initial, 96
tcp_rexmit_interval_max, 96
tcp_rexmit_interval_min, 96
tcp_slow_start_initial, 96
tcp_smallest_anon_port, 96
tcp_time_wait_interval, 91, 96
tcp_xmit_hiwat, 96, 98
tcpHalfOpenDrop, 90
tcpListenDrop, 90
tcpListenDropQ0, 90
131
Index
TerminateTimeout directive, 42
test results, 103-126
thread pools, 48, 65-68
custom, 42-43
disabled, 41
native thread pool, 43-44, 66
threads, 40-46
acceptor, 52
creation statistics, 57-59
keep-alive, 56
maximum, 58
maximum and SNCA, 92
multi-process mode, 44
too few, 86
tips, general, 39-40
transaction isolation level, JDBC resource, 77
tuning maxLocks, 80
tuning MMapSessionManager, 81
tuning TCP buffering, 91
tuning the Web Server, 39-83
Java web applications performance, 78-81
threads, processes, and connections, 40-46
using statistics, 48-77
tuning tips
general, 39-40
platform-specific, 89-99
tuning Web Server
6.1 to 7.0 parameter mapping, 46-48
keep-alive subsystem, 56
virtual servers (Continued)
HTTP listeners, 51
performance overview, 20
vmstat 60 command, 94
W
wait timeout, JDBC resource, 76
web applications, 71-72
session timeout, 80
statistics for, 28
tuning performance, 78-81
Web Server
start options, 99
tuning for studies, 107-108
work queue
length, 66
limit, 67
peak, 67
U
UFS, 93
under-throttled server, 86
UNIX file system, 93
using statistics to tune your server, 48-77
V
validation method, JDBC resource, 76
validation table name, JDBC resource, 76
virtual servers
default, 53
132
Sun Java System Web Server 7.0 Update 1 Performance Tuning, Sizing, and Scaling Guide •