1
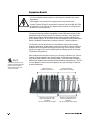
Electrical equipment contains hazardous Voltages and high
speed moving parts.
Can cause death, serious personal injury, or equipment
damage.
Always de-energize and ground the equipment before maintenance.
Maintenance should be performed only by qualified personnel.
The use of unauthorized parts in the repair of the equipment or tampering by
unqualified personnel will result in dangerous conditions which will cause
severe personal injury or equipment damage. Follow all safety instructions
contained herein.
,03257$17
The information contained herein is general in nature and not intended for
specific application purposes. It does not relieve the user of responsibility to
use sound practices in application, installation, operation, and maintenance of
the equipment purchased. Siemens reserves the right to make changes at any
time without notice or obligations. Should a conflict arise between the general
information contained in this publication and the contents of drawings or
supplementary material, or both, the latter shall take precedence.
48$/,),('3(56211(/
For the purposes of this manual, a qualified person is one who is familiar with
the installation, construction, or operation of the equipment and the hazards
involved. In addition, that person has the following qualifications:
(a)
is trained and authorized to de-energize, clear, ground, and tag
circuits and equipment in accordance with established safety practices.
(b)
is trained in the proper care and use of protective equipment such as
rubber gloves, hard hat, safety glasses, or face shields, flash clothing,
etc., in accordance with established safety procedures.
(c)
is trained in rendering first aid.
6800$5<
These instructions do not purport to cover all details or variations in equipment, nor to provide for every possible
contingency to be met in connection with installation, operation, or maintenance. Should further information be desired
or should particular problems arise which are not covered sufficiently for the purchaser’s purposes, the matter should
be referred to the local sales office.
The contents of the instruction manual shall not become part of or modify any prior or existing agreement, commitment
or relationship. The sales contract contains the entire obligation of Siemens Energy & Automation, Inc. The warranty
contained in the contract between parties is the sole warranty of Siemens Energy & Automation, Inc. Any statements
contained herein do not create new warranties or modify the existing warranty.
43;)6
78%68
Basic communications settings (baud rate, protocol) and metering
settings (volts mode, CT/PT ratios) must be configured before you can use
the 9700 Power Meter. If these settings have not been configured, follow
the steps in the 9700 Power Meter Installation & Basic Setup Instructions
before consulting this User’s Guide.
You may only need to read certain sections of this User’s Guide, depending
on how you will use the 9700 Power Meter.
Chapter 1
♦
Understanding the Basics of the 9700 Power Meter
Chapter 1 introduces the 9700 Power Meter, and shows how it fits into
power monitoring systems. The display and analysis software tools that
compliment the 9700 Power Meter are discussed, and some of the device’s
capabilities are presented.
Chapter 2
♦
Accessing Data and Interpreting Displays
Chapter 2 shows you how to access the data that the factory-configured
9700 Power Meter provides. Go directly to this chapter if you want to start
viewing real-time data without performing any additional configuration.
Chapter 2 describes what data you can access using WinPM and the front
panel display.
Chapter 3
♦
Making Minor Configuration Changes
Chapter 3 describes how to use the MGT to make minor changes to the
meter’s operation.
Chapter 4
♦
Using Advanced Features
Chapter 4 provides more details about the 9700 Power Meter’s operating
software so that the advanced user can create custom functions by linking
the modules. Chapter 4 also describes advanced communications and
output functions available with the 9700 Power Meter. Creating custom
front panel displays is also discussed.
Chapter 5
♦
Technical Specifications
Chapter 5 provides technical specifications, accuracy data, ordering options,
and warranty information.
Contents
Power Start ........................................................................................... i
Introduction....................................................................................... 1-1
8LI4S[IV1IXIVMW*EGXSV]'SRJMKYVIHERH6IEH]XS3TIVEXI 8LI4S[IV1IXIVMRE4S[IV1SRMXSVMRK7]WXIQ
Data Display and Analysis Tools........................................................................... 1-3
Communications Options ...................................................................................... 1-3
Input/Output............................................................................................................ 1-4
9WMRKXLMW+YMHI Before You can Use this Guide ............................................................................. 1-5
+IXXMRK1SVI-RJSVQEXMSR Displaying Data ................................................................................. 2-1
(MWTPE]MRK(EXE[MXLXLI1+8 Data Display Screens ............................................................................................. 2-2
Interpreting Numbers in Numeric Displays ......................................................... 2-3
Bar Graph Displays ................................................................................................ 2-4
Trend Displays........................................................................................................ 2-5
Harmonics Displays ............................................................................................... 2-5
Display Screens Available under SETUP.............................................................. 2-6
'SQTPIXI0MWXSJ*EGXSV]'SRJMKYVIH1IEWYVIQIRXWERH*YRGXMSRW Energy & Demand Framework .............................................................................. 2-8
Min/Max Framework ............................................................................................ 2-10
Historic Data Logging Framework ...................................................................... 2-13
Harmonics Logging Framework .......................................................................... 2-15
Power Quality Monitoring Framework................................................................ 2-16
Setpoint Framework ............................................................................................. 2-18
Digital Inputs Framework..................................................................................... 2-19
Real Time Measurements (Core Modules) ......................................................... 2-20
Making Configuration Changes ...................................................... 3–1
'SRJMKYVEXMSR8SSPW r
&EWMGWSJXLI%VGLMXIGXYVI r
The Module .............................................................................................................3–3
The Registers ..........................................................................................................3–3
1EOMRK'SRJMKYVEXMSR'LERKIW r
LLL
'SRJMKYVMRKXLI4S[IV1IXIV[MXLXLI1+8
The MGT’s Setup Menus ....................................................................................... 3-4
Using the MGT’s Buttons....................................................................................... 3-5
Quick Setup.............................................................................................................3–7
Parameter Reset .....................................................................................................3–9
Configure ION .......................................................................................................3–11
Using Advanced Features ............................................................... 4–1
;MR41%HZERGIH7IVMIW1IXIV4VSKVEQQMRK Basic Concepts ....................................................................................................... 4-2
The Module ............................................................................................................. 4-2
Making Configuration Changes............................................................................. 4-4
Overview of Module Groups ............................................................................... 4-14
9WMRK3RFSEVHERH)\TERWMSR-3 r
9WMRKXLI1SHFYW6894VSXSGSP r
9WMRKXLI(244VSXSGSP r
9WMRKXLI)XLIV+EXI4VSXSGSP r
9WMRKXLI-RXIVREP1SHIQ r
Baud Rates ............................................................................................................4–31
ModemGate Functionality ...................................................................................4–31
Connecting the Modem .......................................................................................4–31
9WMRK8MQI7]RGLVSRM^EXMSR r
'VIEXMRK'YWXSQ1+8(MWTPE]W r
Overview of MGT Button Configuration .............................................................4–37
Using the MGT Display Formats .........................................................................4–38
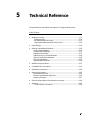
Technical Reference ........................................................................ 5–1
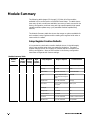
1SHYPI7YQQEV] r
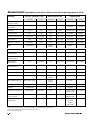
Measurements......................................................................................................5–12
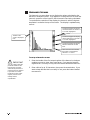
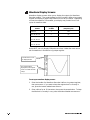
kW Measurement Accuracy.................................................................................5–13
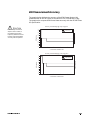
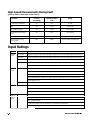
High-Speed Measurements During Fault ...........................................................5–14
-RTYX6EXMRKW r
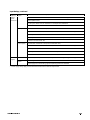
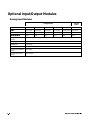
3TXMSREP-RTYX3YXTYX1SHYPIW r
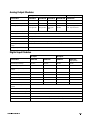
Analog Input Modules..........................................................................................5–16
Analog Output Modules.......................................................................................5–17
Digital Input Modules...........................................................................................5–17
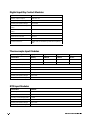
Digital Input Dry Contact Modules ......................................................................5–18
Thermocouple Input Modules .............................................................................5–18
RTD Input Modules...............................................................................................5–18
Digital Output Modules........................................................................................5–19
LY
%HHMXMSREP7TIGMJMGEXMSRW r
'SQTEXMFPI%8'SQQERHW r
7XERHEVHW'SQTPMERGI r
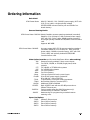
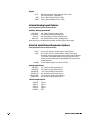
3VHIVMRK-RJSVQEXMSR r
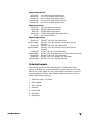
Internal Analog Input Options ............................................................................. 5-26
External Input/Output Expansion ........................................................................ 5-26
Ordering Example ................................................................................................ 5-27
)\XIVREP3YXTYX(IZMGI4EVX2YQFIV7YQQEV] r
;EVVERX] r
Product Return Procedure ...................................................................................5–29
Index ................................................................................................... I-1
Y
YL
1
Introduction
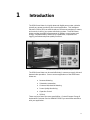
The 9700 Power Meter is a highly advanced digital power meter, suited to
virtually any power monitoring and control application. This intelligent
Electronic Device (IED) can take the place of numerous transducers, meters,
and control circuits in your power monitoring system. The 9700 Power
Meter provides true RMS measurements of voltage, current, power and
energy, complemented by extensive I/O capabilities, comprehensive
logging, and advanced power quality functions.
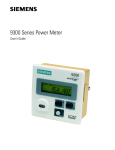
The 9700 Power Meter with the Modular Graphics Terminal
The 9700 Power Meter can be used effectively in numerous supply side and
demand side operations. Some common applications of the 9700 Power
Meter are:
♦
Revenue Metering
♦
Substation Automation
♦
Commercial/Industrial Metering
♦
Power Quality Monitoring
♦
Capacitor Control
♦
SCADA
These are just a few of the many possibilities. Contact Siemens Energy &
Automation Customer Service at 800-427-2256 if you would like assistance
with your application.
1-1
The 9700 Power Meter is Factory-Configured
and Ready to Operate
Although the 9700 Power Meter is fully customizable, it is shipped from the
factory with many functions pre-configured. Once installation and basic
setup are preformed, all of the basic measurements, energy calculations
and recording functions are ready to operate, right out of the box. Many
users will find that the factory configuration will serve their purposed
without performing any additional configuration.
New Communications and I/O Options
New or improved communications and I/O features include:
♦
The XPRESS CARD supports the DNP 3.0 protocol on either RS-485
port (only one port can be configured to use DNP 3.0 at any one time.)
♦
New protocols and functions provide high-accuracy time
synchronization using GPS receivers.
♦
The XPRESS CARD supports two independent EtherGate gateways.
♦
Support is added for various types of thermocouple inputs.
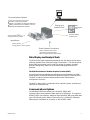
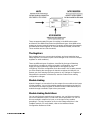
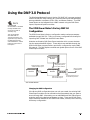
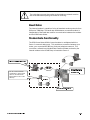
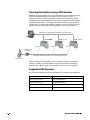
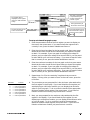
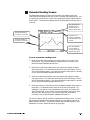
The 9700 Power Meter in a Power Monitoring
System
Applications that include the 9700 Power Meter, or any other IED, typically
require additional equipment. Display and analysis software tools are
almost always used to manage, interpret, and distribute the data measured
or logged by an IED. Usually there are a variety of tools used, and often
these tools are connected using different communications standards and
protocols. In many cases, an IED must also provide control capabilities and
device-level data sharing.
The 9700 Power Meter can adapt to almost any situation. Advanced
communications allow data to be shared simultaneously across multiple
networks, expandable I/O provides additional monitoring and control
capabilities, and a variety of display and analysis tools can be used to
monitor your power system. This User’s Guide discusses the 9700 Power
Meter as it is most commonly used – as part of a complete power
monitoring system.
1-2
9700 POWER METER USERS GUIDE
WinPM
software
Communications Options
corporate network
up to five concurrent connections
RS-232 and high-speed RS-485
10Base-T and 10Base-FL (fiberoptic) Ethernet
SEAbus, Modbus RTU and DNP3.0 protocols
EtherGate RS-485/Ethernet gateway
Display and
Analysis Tools
MGT
field display
unit
Modbus, DNP3.0
software tools
pulses, breaker status,
analog transducer signals
Input/Ouput
analog signals,
energy pulses, control signals
Power System Connections
phase voltage, phase current
and neutral current from Wye,
Delta or single-phase power systems
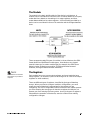
Data Display and Analysis Tools
The 9700 Power Meter integrates seamlessly with the display and analysis
software available from Siemens Energy & Automation. The data acquired
by the 9700 Power Meter can be used in a variety of systems; however,
WinPM is designed to make use of the advanced capabilities the unit
provides.
The 9700 Power Meter’s Modular Graphics Terminal (MGT)
Local monitoring and standalone applications are facilitated by the 9700
Power Meter’s front-panel interface, the Modular Graphics Terminal (MGT).
The MGT combines real-time display features with limited device
configuration functions.
The MGT is often used in combination with a WinPM system, providing an
interface for field personnel.
Communications Options
The standard 9700 Power Meter has a single RS-232/RS-485
communications port capable of data rates up to 19,200 bps. The optional
XPRESS CARD provides two additional high-speed RS-485 ports (data rates
up to 115,200 bps) and a 10Base-T Ethernet port. A 10 Base-FL fiberoptic
Ethernet port is available as an option on the XPRESS CARD .
INTRODUCTION
1-3
Depending on the hardware options purchased, separate ports can
communicate simultaneously. Siemens Energy & Automation’s SEAbus
Protocol, Modbus RTU, DNP 3.0 are supported, depending on the
communications port used. Refer to the section “Using Onboard and
Expansion I/O” in Chapter 4 for details.
Input/Output
The standard 9700 Power Meter has eight status inputs. Four optional
analog inputs are available on the meter to monitor AC or DC signals.
Additional I/O is available using one or two expansion boards – up to 15
input or output modules can be added (digital or analog inputs or outputs
are available.) Some restrictions apply to number of analog modules you
can use, due to the power they require. Refer to the section “Using
Onboard and Expansion I/O” in Chapter 4 for details.
Using this Guide
This User’s Guide is directed at three types of users: the typical user or
operator, the system administrator, and the advanced user. You might not
fit into any of these groups directly, or perhaps you are both an operator
and an administrator. These user classifications are intended to make this
guide easier to navigate.
♦
Typical User or Operator
Most users will simply want to display the data provided by the factoryconfigured 9700 Power Meter. These users want fast access to data
through the front panel, WinPM, or a third-party protocol.
Chapter 2 addresses the needs of the typical user who wants to get data
out of the 9700 Power Meter. This chapter assumes that the reader is
not concerned with how the device functions; instead the focus is on
accessing and interpreting the data provided.
♦
System Administrator or Manager
Some users will need to make minor adjustments so that their meters
“fit” their power systems: data recording intervals, demand subintervals and other parameters may need to be set before the 9700
Power meter’s setup is complete. These users will use the front panel,
or WinPM to change settings in the devices’ operating system.
Chapter 3 is directed at the users who wants to get more out of the 9700
Power Meter by making adjustments to its factory-configured
functionality. This chapter focuses on the different configuration
changes that can be made with minimal effort, and what effects each
type of setting will have. Very few details about the devices’ internal
operation are provided.
1-4
9700 POWER METER USERS GUIDE
♦
Advanced User of Systems Integrator
Advanced users may want to make use of the flexibility and power
provided by the device’s operation software. These users will need to
become familiar with the device’s operation software, the Architecture,
and the WinPM tools used to customize the device’s operation.
Chapter 4 is useful for the advanced user who wants to become familiar
with the device’s internal operation and its more sophisticated
capabilities. This chapter is designed to facilitate different applications
by providing background information and detailed functional
descriptions – specific applications are only discussed to illustrate a
particular function. Configuration instructions for particular
applications can be found in Siemens Energy & Automation Application
Notes, available from Siemens Energy & Automation Customer Service
at 800-427-2256.
Before You can Use this Guide
By the time you are ready to use this Guide, your 9700 Power Meter should
be installed, basic setup should have been performed, and
communications/basic operation should have been verified. If the unit is
not yet installed and operational, refer to the 9700 Power Meter Installation
& Basic Setup Instructions shipped with the meter.
Getting More Information
Additional information is available from Siemens Energy & Automation.
Check our web site at www.sea.siemens.com, contact Siemens Energy &
Automation directly at 800-427-2256. Documents related to the installation,
operation, and application of the 9700 Power Meter.
4S[IV1IXIV-RWXEPPEXMSR&EWMG7IXYT-RWXVYGXMSRW
This brief guide is shipped with each 9700 Power Meter. It details the
mounting, wiring, and basic setup of the device.
INTRODUCTION
1-5
1-6
9700 POWER METER USERS GUIDE
2
Displaying Data
The 9700 Power Meter is shipped from the factory with a comprehensive
configuration. Most users will find that the factory configuration suits their
needs entirely. This chapter describes how to view the data that is
measured and logged by the factory-configured 9700 Power Meter using
WinPM and the MGT front-panel interface.
-RXLMW'LETXIV
♦
Displaying Data with the MGT .................................................................. 2-2
Data Display Screens.............................................................................. 2-2
Interpreting Numbers in Numeric Displays.......................................... 2-3
Bar Graph Displays ................................................................................. 2-4
Trend Displays......................................................................................... 2-5
Harmonics Displays ................................................................................ 2-5
Display Screens Available under SETUP .............................................. 2-6
♦
Complete List of Factory-Configured Measurements and
Functions..................................................................................................... 2-8
Energy & Demand Framework............................................................... 2-8
Min/Max Framework ............................................................................. 2-10
Historic Data Logging Framework....................................................... 2-13
Harmonics Logging Framework .......................................................... 2-15
Power Quality Monitoring Framework ................................................ 2-16
Setpoint Framework.............................................................................. 2-18
Digital Inputs Framework ..................................................................... 2-19
Real Time Measurements (Core Modules) ......................................... 2-20
2-1
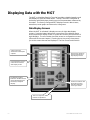
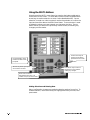
Displaying Data with the MGT
The MGT, or Modular Graphics Terminal, provides a detailed graphics and
text display for the 9700 Power Meter. The MGT has been configured at
the factory with 24 displays showing most of the parameters measured by
the meter. The factory-configured MGT displays numeric data screens,
waveforms, trend graphs and harmonics histograms.
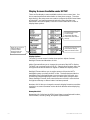
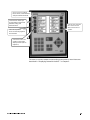
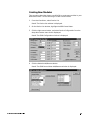
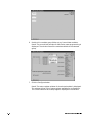
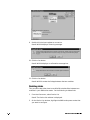
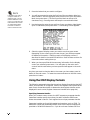
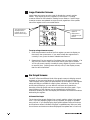
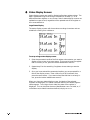
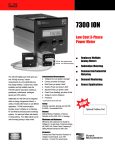
Data Display Screens
When the MGT is activated, it displays a menu of eight data display
screens. Press the button adjacent to a menu item in the display area to
access a particular display screen, or press NEXT move to the next menu of
eight displays. The SETUP button provides access to configuration screens
(discussed in the next chapter). Pressing the ESC key at any time returns
you to the screen that was last displayed. The first screen looks like this:
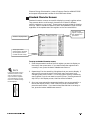
Setup screens are
discussed in subsequent
chapters.
Press the NEXT button to
view the next group of
eight display screens.
Press the button next to a
menu item to enter the
data display screen.
The keypad and other
buttons on the MGT are not
used to display data from
the factory-configured
displays.
Use the ESC button to exit
the screen you are in
and return to the last
screen you viewed.
The STATUS light is on when
the MGT is operational.
2-2
9700 POWER METER USER’S GUIDE
The 24 screens provided display data in a number of different formats.
The following paragraphs detail some of the important aspects of the
various display formats.
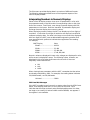
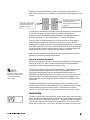
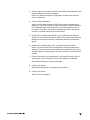
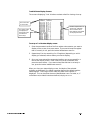
Interpreting Numbers in Numeric Displays
Eleven of the 24 display screens show up to 15 parameters in a list, with
the parameter name on the left, and the corresponding value on the right.
One of the screens, Total Power, uses a large character display with four
parameters on the screen. Both the ‘standard’ 15-parameter display and
the large character display show numeric values.
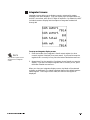
When displaying numeric values, the MGT can display up to four digits of
resolution. If more than four digits of resolution are required, use WinPM
software to display data. If a value is too large or too small to be displayed
with four digits, the MGT uses an abbreviated engineering notation that
uses standard metric prefixes to indicate the magnitude of the reading.
For example,
1+8(MWTPE]
:EPYI
12m40.................................. 0.0124
12K40................................... 12, 400
12M40.................................. 12, 400, 000
1G240 .................................. 1, 240, 000, 000
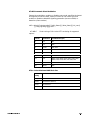
Numeric values are displayed in base units; voltages are displayed in volts,
while current is displayed in amps. The following values, however, are
displayed in kilo units rather than base units since kilo is the most
frequently used measurement:
♦
kW
♦
kVA
♦
kVAR
When viewing these parameters with the MGT, remember that the values
are already multiplied by 1000. For example, the reading below indicates
120, 000 kilowatts, not 120, 000 watts.
kW total...............................120K0
INVLD and N/A Messages
If the MGT is unable to read a numeric or status value from the 9700 Power
Meter, it will display either INVLD or N/A in place of the value. INVLD
indicates that the value received cannot be displayed because it is either
too large or too small (it is below 1m000 or above 9G999). N/A appears if
the register is not available.
DISPLAYING DATA
2-3
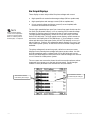
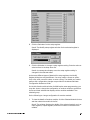
Bar Graph Displays
Three display screens are provided for phase voltage and current:
238)
Each of the MGT display
screens can be adjusted to
match your power system.
Refer to “Creating Custom
MGT Displays” in Chapter 4.
♦
High-speed line-to-neutral and average voltage (100 ms update rate)
♦
High-speed phase and average current (100 ms update rate)
♦
Line-to-neutral voltage and phase current (1 second update) with
minimum and maximum indicators.
The two high-speed displays use a four-channel bar graph that shows the
low limit, the parameter name (i.e. Vln a, meaning line-to-neutral voltage
on phase A), and the upper limit above the bar for each measurement.
The high-speed voltage display, called VOLTAGE HS BAR GRAPH, has fixed
limits of 0 to 400 volts. The high-speed current display, called CURRENT HS
BAR GRAPH, has fixed limits of 0 to 6000 Amps. If your voltage or current
values are above the fixed upper limits, the MGT will display OFF SCALE in
place of the bar. Similarly, the voltage bar graph displays OFF SCALE if you
have a Delta power system, as there are no line-to-neutral voltage values
available.
The phase voltage and current bar graph, called VOLTS/AMPS BAR GRAPH,
displays line-to-neutral phase voltage and phase current values. As with
the high-speed bar graphs, voltage limits of 0 to 400 Volts and current
limits of 0 to 6000 Amps are fixed, and line-to-neutral voltages will read OFF
SCALE if viewed in a Delta power system.
The VOLTS/AMPS BAR GRAPH also shows the minimum and maximum values
measured (since power-up or the last min/max reset). Small triangles
located on each parameter’s bar indicate the min/max values:
The minimum value is
indicated by this triangle.
2-4
The maximum value is
indicated by this triangle.
9700 POWER METER USER’S GUIDE
Trend Displays
Trend display screens are provided for total kW and total kVAR. Both
screens show the values for each parameter over the last 150 seconds.
The limits set for total kW and total kVAR are 0 to 2400. If the total kW or
total kVAR in your system are above this range, no trend graph will be
displayed.
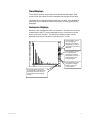
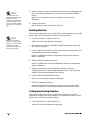
Harmonics Displays
Harmonics are displayed for each current phase. All harmonics from the
rd
fundamental to the 63 can be displayed at once, or harmonics can be
shown across two screens. The Harmonics display screens can be
adjusted to show even harmonics, odd harmonics, or both.
Press the button next to
ODD to display odd
harmonics (ODD will be
highlighted, as shown, if
odd harmonics are being
displayed).
Press the button next to
EVE to display even
harmonics (EVE will be
highlighted, as shown, if
even harmonics are
being displayed).
Press the button next to
this graphic to toggle
between one or two
screen displays.
This arrow appears if the twoscreen display is selected. Press
the button next to this arrow to
move between the two display
screens.
DISPLAYING DATA
2-5
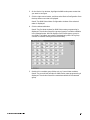
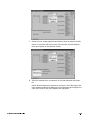
Display Screens Available under SETUP
There are five display screens available under the SETUP menu item. You
do not require password authorization to view these screens. The other
eight items in the setup menu are used to configure the 9700 Power Meter
and the MGT, and require password authority (setup functions are
described in the next chapter). Press SETUP on the main MGT screen to
display these options:
The three NAMEPLATE INFO
screens display
information about the
9700 Power Meter and its
settings.
Enter DISPLAY OPTIONS to
adjust the MGT’s
contrast, number
display format and
backlight timeout.
Choose DATE/TIME DISPLAY to
have the MGT display
date, time and time zone.
Display Options
The DISPLAY OPTIONS menu includes three options: Adjust Contrast,
Backlight Timeout and Numbers X.XXX.
Adjust Contrast allows you to change the contrast of the MGT’s display.
The MGT has a contrast scale of 0 to 15. Select Adjust Contrast, then use
the right and left arrow buttons to lighten or darken the display screen.
Backlight Timeout allows you to set the amount of time the MGT’s
backlighting stays on when the MGT is idle. The bulb that provides the
backlighting has a limited lifespan; to prolong the life of the bulb, you
should only have backlighting on when you are actively using the MGT.
Select Backlight Timeout, then enter the amount of time in seconds that
the light should stay on after a button has been pressed.
Numbers X.XXX lets you change the numeric display format to use either
a period or a comma character as the decimal delimiter when displaying
numbers.
Nameplate Info 1
Nameplate Info 1 displays the 9700 Power Meter’s manufactured location,
serial number, accuracy rating, and power system details.
2-6
9700 POWER METER USER’S GUIDE
Nameplate Info 2
238)
Additional information will
be displayed in the
Nameplate Info screens if
the MGT is used with
revenue-class 9700 Power
Meters.
Nameplate Info 2 displays the MGT’s acceptable operating temperature,
the amount of battery life left in the 9700 Power Meter, and the configured
demand settings.
Nameplate Info 3
Nameplate Info 3 displays the three lines of text that are written into the
9700 Power Meter’s Factory module. You can customize the text displayed
by configuring the Factory module’s Owner, Tag1 and Tag2 setup registers
in ION Designer. Nameplate Info 3 also shows the firmware revisions of
the 9700 Power Meter, the MGT and the XPRESS CARD (if one exists), as well
as the optional auxiliary I/O board’s voltage level and the total amount of
memory in the 9700 Power Meter.
Date/Time Display
The MGT can be set to display the date, time and timezone. To display the
data and time, press SETUP, then press DATE/TIME DISPLAY. You can exit the
date/time screen at any time by holding the ESC button down for two
seconds.
DISPLAYING DATA
2-7
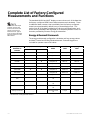
Complete List of Factory-Configured
Measurements and Functions
238)
The modules and output
registers used for each
function are listed in this
section to assist more
advanced users. Typical
users can ignore the three
right-hand columns in the
tables below.
The standard WinPM and MGT display screens show much of the data that
the factory-configured 9700 Power Meter measures and calculates. There
is additional data, however, that is available from the factory-configured
meter but not presented by default in any of these display tools. This
section lists all of the data provided by the factory-configured meter, and
shows which parameters are displayed or accessible by default in each of
the tools provided by Siemens Energy & Automation.
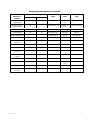
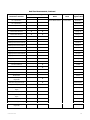
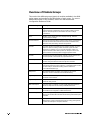
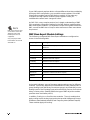
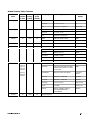
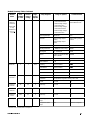
Energy & Demand Framework
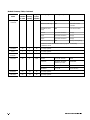
The energy and demand configuration calculates and logs energy values
and both Thermal and Sliding Window demand. External triggers are
included for operator reset of all values.
Description of
Parameter or
Function
Displayed/Accessible by Default
Module
Name
Module
Label
Output Register
Label
WinPM
MGT
Imported kWh
l
l
Integrator #1
kWh imp
kWh imp
Exported kWh
l
l
Integrator #2
kWh exp
kWh exp
Total kWh
l
l
Integrator #3
kWh tot
kWh tot
l
Integrator #4
kWh net
kWh net
Net kWh
Imported kVARh
l
l
Integrator #5
kVARh imp
kVARh imp
Exported kVARh
l
l
Integrator #6
kVARh exp
kVARh exp
Total kVARh
l
l
Integrator #7
kVARh tot
kVARh tot
l
Integrator #8
kVARh net
kVARh net
Net kVARh
kVAh
l
l
Integrator #9
kVAh
kVAh
kW thermal demand
(TD)
l
l
Thermal Demand
#1
kW td
kW td
kVAR TD
l
l
Thermal Demand
#2
kVAR td
kVAR td
kVA TD
l
l
Thermal Demand
#3
kVA td
kVA td
Average current TD
l
l
Thermal Demand
#4
I avg td
I avg td
* SW Demand = Sliding Window Demand
2-8
9700 POWER METER USER’S GUIDE
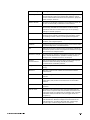
Energy and Demand Framework, Continued
Description of
Parameter or
Function
Displayed/Accessible by Default
WinPM
MGT
Energy / Demand
Logging trigger
Module
Name
Module
Label
Output Register
Label
Periodic Timer #1
EgyDmd Log
Trg
EgyDmd Log Trg
Energy / Demand
Recorder Enable
l
External Boolean #5
EgyDmd Log
Enbl
EgyDmd Log Enbl
Energy Calc Enable
l
External Boolean #3
Energy Enble
Energy Enble
kW SW Demand
l
l
SW Demand #1*
kW swd
kW swd
kW Predicted Demand
l
l
SW Demand #1
kW swd
kW pred swd
kVAR SW Demand
l
l
SW Demand #2
kVAR swd
kVAR swd
kVAR Predicted
Demand
l
l
SW Demand #2
kVAR swd
kVAR pred swd
kVA SW Demand
l
l
SW Demand #3
kVA swd
kVA swd
kVA Predicted Demand
l
l
SW Demand #3
kVA swd
kVA pred swd
Avg Current SW
Demand
l
l
SW Demand #4
I avg swd
I avg swd
Avg Current SW
Demand
l
l
SW Demand #4
I avg swd
I avg pred swd
Energy reset trigger
l
External Pulse #7
Energy Rset
Energy Rset
SWD reset trigger
l
External Pulse #3
SWDemand
Rset
SWDemand Rset
TD reset trigger
l
External Pulse #4
Tdemand Rset
Tdemand Rset
Energy / Demand
Recorder
l
Data Recorder #1
EgyDmd Log
EgyDmd Log
DISPLAYING DATA
2-9
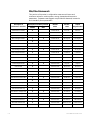
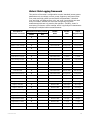
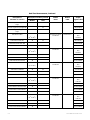
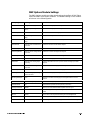
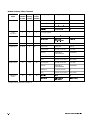
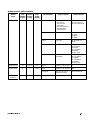
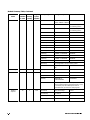
Min/Max Framework
This portion of the meter’s configuration measures minimum and
maximum values for various power, energy, demand and harmonics
parameters. Separate reset triggers are provided for demand, harmonics
and ‘standard’ power parameters.
Description of
Parameter or Function
2-10
Displayed/Accessible by Default
Module
Name
Module
Label
Output
Register Label
WinPM
MGT
Max Phase A L-N Volts
l
l
Maximum #1
Vln a mx
Vln a mx
Max Phase B L-N Volts
l
l
Maximum #2
Vln b mx
Vln b mx
Max Phase C L-N Volts
l
l
Maximum #3
Vln c mx
Vln c mx
Max Average L-N Volts
l
l
Maximum #4
Vln avg mx
Vln avg mx
Max L-L Volts AB
l
l
Maximum #5
Vll ab mx
Vll ab mx
Max L-L Volts BC
l
l
Maximum #6
Vll bc mx
Vll bc mx
Max L-L Volts CA
l
l
Maximum #7
Vll ca mx
Vll ca mx
Max Average L-L Volts
l
l
Maximum #8
Vll avg mx
Vll avg mx
Max Voltage Unbalance
l
l
Maximum #9
V unbal mx
V unbal mx
Max Phase A Current
l
l
Maximum #10
I a mx
I a mx
Max Phase B Current
l
l
Maximum #11
I b mx
I b mx
Max Phase C Current
l
l
Maximum #12
I c mx
I c mx
Max Average Current
l
l
Maximum #13
I avg mx
I avg mx
Max kW total
l
l
Maximum #14
kW tot mx
kW tot mx
Max kVAR total
l
l
Maximum #15
kVAR tot mx
kVAR tot mx
Max kVA total
l
Maximum #16
kVA tot mx
kVA tot mx
Max Phase A Current THD
l
l
Maximum #17
I1 THD mx
I1 THD mx
Max Phase B Current THD
l
l
Maximum #18
I2 THD mx
I2 THD mx
Max Phase C Current THD
l
l
Maximum #19
I3 THD mx
I3 THD mx
Max Frequency
l
Maximum #21
Freq mx
Freq mx
Max Power Factor Lead
l
Maximum #22
PF lead mx
PF lead mx
Max Power Factor Lag
l
Maximum #23
PF lag mx
PF lag mx
Max Phase A Voltage THD
l
l
Maximum #24
V1 THD mx
V1 THD mx
Max Phase B Voltage THD
l
l
Maximum #25
V2 THD mx
V2 THD mx
Max Phase C Voltage THD
l
l
Maximum #26
V3 THD mx
V3 THD mx
Max kW SW Demand
l
l
Maximum #27
kW swd mx
kW swd mx
Max kVAR SW Demand
l
l
Maximum #28
kVAR swd mx
kVAR swd mx
Max kVA SW Demand
l
l
Maximum #29
kVA swd mx
kVA swd mx
9700 POWER METER USER’S GUIDE
Min / Max Framework, Continued
Description of
Parameter or Function
Displayed/Accessible by Default
Module
Name
Module
Label
Output
Register Label
WinPM
MGT
Max kW Thermal Demand
l
l
Maximum #30
kW td mx
kW td mx
Max kVAR Therm. Demand
l
l
Maximum #31
kVAR td mx
kVAR td mx
Max kVA Thermal Demand
l
l
Maximum #32
kVA td mx
kVA td mx
Min Phase A L-N Volts
l
l
Minimum #1
Vln a mn
Vln a mn
Min Phase B L-N Volts
l
l
Minimum #2
Vln b mn
Vln b mn
Min Phase C L-N Volts
l
l
Minimum #3
Vln c mn
Vln c mn
Min Average L-N Volts
l
l
Minimum #4
Vln avg mn
Vln avg mn
Min kVA total
l
Minimum #16
kVA tot mn
kVA tot mn
Min L-L Volts AB
l
l
Minimum #5
Vll ab mn
Vll ab mn
Min L-L Volts BC
l
l
Minimum #6
Vll bc mn
Vll bc mn
Min L-L Volts CA
l
l
Minimum #7
Vll ca mn
Vll ca mn
Min Average L-L Volts
l
l
Minimum #8
Vll avg mn
Vll avg mn
Min Voltage Unbalance
l
l
Minimum #9
V unbal mn
V unbal mn
Min Phase A Current
l
l
Minimum #10
I a mn
I a mn
Min Phase B Current
l
l
Minimum #11
I b mn
I b mn
Min Phase C Current
l
l
Minimum #12
I c mn
I c mn
Min Average Current
l
l
Minimum #13
I avg mn
I avg mn
Min kW total
l
l
Minimum #14
kW tot mn
kW tot mn
Min kVAR total
l
l
Minimum #15
kVAR tot mn
kVAR tot mn
Min Power Factor Lag
l
Minimum #23
PF lag mn
PF lag mn
Min Phase A Voltage THD
l
l
Minimum #24
V1 THD mn
V1 THD mn
Min Phase B Voltage THD
l
l
Minimum #25
V2 THD mn
V2 THD mn
Min Phase C Voltage THD
l
l
Minimum #26
V3 THD mn
V3 THD mn
Min kW SW Demand
l
l
Minimum #27
kW swd mn
kW swd mn
Min kVAR SW Demand
l
l
Minimum #28
kVAR swd mn
kVAR swd mn
Min Phase C Current THD
l
l
Minimum #29
kVA td mn
kVA td mn
Min kW Thermal Demand
l
l
Minimum #30
kW td mn
kW td mn
DISPLAYING DATA
2-11
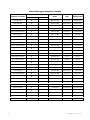
Min / Max Framework, Continued
Description of
Parameter or Function
2-12
Displayed/Accessible by Default
Module
Name
Module
Label
Output
Register Label
WinPM
MGT
Min Phase A Current THD
l
l
Minimum #17
I1 THD mn
I1 THD mn
Min Phase B Current THD
l
l
Minimum #18
I2 THD mn
I2 THD mn
Min Phase C Current THD
l
l
Minimum #19
I3 THD mn
I3 THD mn
Min Frequency
l
Minimum #21
Freq mn
Freq mn
Min Power Factor Lead
l
Minimum #22
PF lead mn
PF lead mn
Min kVAR Therm. Demand
l
l
Minimum #31
kVAR td mn
kVAR td mn
Min kVA Thermal Demand
l
l
Minimum #32
kVA td mn
kVA td mn
Min / Max Enable
l
External Boolean
#1
MnMx Enble
MnMx Enble
V/A/Power Min/Max Reset
l
External Pulse #5
MnMx Rset
MnMx Rset
Demand Min/Max Reset
l
External Pulse #1
Peak Dmd Rset
Peak Dmd Rset
Harmonics min/max Reset
l
External Pulse #10
Harm MnMx
Rset
Harm MnMx
Rset
9700 POWER METER USER’S GUIDE
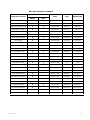
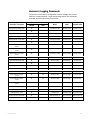
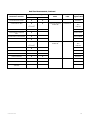
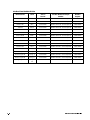
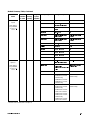
Historic Data Logging Framework
This portion of the meter’s configuration records ‘standard’ power system
parameters such as voltage, current, power, frequency and power factor.
Low, mean and high values are recorded for all parameters. Note that
‘low’ and ‘high’ are different from ‘min’ and ‘max’: low and high are reset
every 15 minutes, whereas min and max are typically long-term
measurements that are only reset by the operator. Similarly, ‘mean’ is
reset every 15 minutes, unlike ‘average’ which is typically an instantaneous
averaging of multiple real-time measurements.
Description of
Parameter or Function
Displayed/Accessible by Default
WinPM
MGT
Module
Name
Module
Label
Output
Register Label
Mean L-L Volts, AB
l
SW Demand #5
Vll ab mean
Vll ab mean
Mean L-L Volts, BC
l
SW Demand #6
Vll bc mean
Vll bc mean
Mean L-L Volts, CA
l
SW Demand #7
Vll ca mean
Vll ca mean
Mean L-L Volts, average
l
SW Demand #8
Vll avg mean
Vll avg mean
Mean Voltage Unbalance
l
SW Demand #9
V unbal mean
V unbal mean
Mean Phase A Current
l
SW Demand #10
I a mean
I a mean
Mean Phase B Current
l
SW Demand #11
I b mean
I b mean
Mean Phase C Current
l
SW Demand #12
I c mean
I c mean
Mean Average Current
l
SW Demand #13
I avg mean
I avg mean
Mean Neutral Current
l
SW Demand #14
I4 mean
I4 mean
Mean kW total
l
SW Demand #15
kW tot mean
kW tot mean
Mean kVAR total
l
SW Demand #16
kVAR tot mean
kVAR tot mean
Mean kVA total
l
SW Demand #17
kVA tot mean
kVA tot mean
Mean Power Factor lag
l
SW Demand #18
PF lag mean
PF lag mean
Mean Power Factor lead
l
SW Demand #19
PF lead mean
PF lead mean
Mean Frequency
l
SW Demand #20
Freq mean
Freq mean
High L-L Volts, AB
l
Maximum #20
Vll ab high
Vll ab high
High L-L Volts, BC
l
Maximum #55
Vll bc high
Vll bc high
High L-L Volts, CA
l
Maximum #56
Vll ca high
Vll ca high
High L-L Volts, average
l
Maximum #33
Vll avg high
Vll avg high
High Voltage Unbalance
l
Maximum #34
V unbal high
V unbal high
High Phase A Current
l
Maximum #35
I a high
I a high
High Phase B Current
l
Maximum #36
I b high
I b high
High Phase C Current
l
Maximum #37
I c high
I c high
High Average Current
l
Maximum #38
I avg high
I avg high
High Neutral Current
l
Maximum #39
I4 high
I4 high
DISPLAYING DATA
2-13
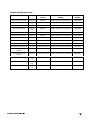
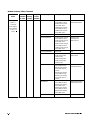
Historic Data Logging Framework, Continued
Description of
Parameter or Function
2-14
Displayed/Accessible by Default
WinPM
MGT
Module
Name
Module
Label
Output
Register Label
High kW total
l
Maximum #40
kW tot high
kW tot high
High kVAR total
l
Maximum #41
kVAR tot high
kVAR tot high
High kVA total
l
Maximum #42
kVA tot high
kVA tot high
High Power Factor lag
l
Maximum #43
PF lag high
PF lag high
High Power Factor lead
l
Maximum #44
PF lead high
PF lead high
High Frequency
l
Maximum #45
Freq high
Freq high
Low L-L Volts, AB
l
Minimum #20
Vll ab low
Vll ab low
Low L-L Volts, BC
l
Minimum #46
Vll bc low
Vll bc low
Low L-L Volts, CA
l
Minimum #47
Vll ca low
Vll ca low
Low L-L Volts, average
l
Minimum #33
Vll avg low
Vll avg low
Low Voltage Unbalance
l
Minimum #34
V unbal low
V unbal low
Low Phase A Current
l
Minimum #35
I a low
I a low
Low Phase B Current
l
Minimum #36
I b low
I b low
Low Phase C Current
l
Minimum #37
I c low
I c low
Low Average Current
l
Minimum #38
I avg low
I avg low
Low Neutral Current
l
Minimum #39
I4 low
I4 low
Low kW total
l
Minimum #40
kW tot low
kW tot low
Low kVAR total
l
Minimum #41
kVAR tot low
kVAR tot low
Low kVA total
l
Minimum #42
kVA tot low
kVA tot low
Low Power Factor lag
l
Minimum #43
PF lag low
PF lag low
Low Power Factor lead
l
Minimum #44
PF lead low
PF lead low
Low Frequency
l
Minimum #45
Freq low
Freq low
Historic Logging Trigger
l
Periodic Timer #2
Hist Log Trg
Hist Log Trg
Historic Logging Enable
l
External Boolean #2
Hist Log Enble
Hist Log Enble
High value Reset
l
Feedback #1
Reset Hist high
Reset Hist high
Low value Reset
l
Feedback #2
Reset Hist low
Reset Hist low
Mean value recorder
l
Data Recorder #2
Hist mean Log
Hist mean Log
High value recorder
l
Data Recorder #3
Hist high Log
Hist high Log
Low value recorder
l
Data Recorder #4
Hist low Log
Hist low Log
9700 POWER METER USER’S GUIDE
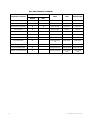
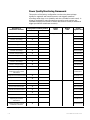
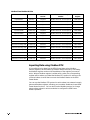
Harmonics Logging Framework
This portion of the factory configuration records voltage and current
harmonics measurements. Mean and average values are calculated,
recorded and then reset every 60 minutes.
Description of
Parameter or Function
Displayed/Accessible by Default
WinPM
MGT
Module
Name
Module
Label
Output
Register Label
Mean Phase A Voltage THD*
l
S W Demand #21
V1 THD* mean
V1 THD* mean
Mean Phase B Voltage THD
l
S W Demand #22
V2 THD mean
V2 THD mean
Mean Phase C Voltage THD
l
S W Demand #23
V3 THD mean
V3 THD mean
Mean Phase A Current THD
l
S W Demand #24
I1 THD mean
I1 THD mean
Mean Phase B Current THD
l
S W Demand #25
I2 THD mean
I2 THD mean
Mean Phase C Current THD
l
S W Demand #26
I3 THD mean
I3 THD mean
Mean Phase A Current K
Factor
l
S W Demand #27
I1 K Fac mean
I1 K Fac mean
Mean Phase B Current K
Factor
l
S W Demand #28
I2 K Fac mean
I2 K Fac mean
Mean Phase C Current K
Factor
l
S W Demand #29
I3 K Fac mean
I3 K Fac mean
High Phase A Voltage THD
l
Maximum #46
V1 THD* high
V1 THD* high
High Phase B Voltage THD
l
Maximum #47
V2 THD high
V2 THD high
High Phase C Voltage THD
l
Maximum #48
V3 THD high
V3 THD high
High Phase A Current THD
l
Maximum #49
I1 THD high
I1 THD high
High Phase B Current THD
l
Maximum #50
I2 THD high
I2 THD high
High Phase C Current THD
l
Maximum #51
I3 THD high
I3 THD high
High Phase A Current K
Factor
l
l
Maximum #52
I1 K Fac high
I1 K Fac high
High Phase B Current K
Factor
l
l
Maximum #53
I2 K Fac high
I2 K Fac high
High Phase C Current K
Factor
l
l
Maximum #54
I3 K Fac high
I3 K Fac high
Harmonics Logging trigger
l
Periodic Timer #3
Harm Log Trg
Harm Log Trg
Harmonics Logging enable
l
External Boolean #6
Harm Log Enble
Harm Log Enble
High Harmonics reset
l
Feedback #3
Rset Harm high
Rset Harm high
Mean Harmonics Recorder
l
Data Recorder #7
Harm mean Log
Harm mean Log
High Harmonics Recorder
l
Data Recorder #8
Harm high Log
Harm high Log
* THD = Total Harmonic Distortion
DISPLAYING DATA
2-15
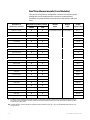
Power Quality Monitoring Framework
This portion of the factory configuration monitors the phase voltage
signals for sag/swell and transient events, and triggers waveform
recordings when they occur (statistics are also recorded for each event). A
trigger is provided for manual waveform recording, and counters are
included to display the number of events that have occurred (an additional
trigger provided to reset these counters).
Description of
Parameter or Function
Displayed/Accessible by Default
WinPM
MGT
Module
Name
Module
Label
Output
Register Label
Sag/Swell #1
Sag/Swell 1
SS1 DistDur
Sag or Swell Duration
l
Phase A min Voltage
l
SS1 DistV1Min
Phase A max Voltage
l
SS1 DistV1Max
Phase A average Voltage
l
SS1 DistV1Avg
Phase A Energy variance
l
SS1 DistV1Engy
Phase B min Voltage
l
SS1 DistV2Min
Phase B max Voltage
l
SS1 DistV2Max
Phase B average Voltage
l
SS1 DistV2Avg
Phase B Energy variance
l
SS1 DistV2Engy
Phase C min Voltage
l
SS1 DistV3Min
Phase C max Voltage
l
SS1 DistV3Max
Phase C average Voltage
l
SS1 DistV3Avg
Phase C Energy variance
l
SS1 DistV3Engy
Nominal Voltage at the
beginning of Sag or Swell
disturbance
l
SS1
DistNominal
Voltage level considered a Swell
l
SS1 Swell Lim *
Voltage level considered a Sag
l
SS1 Sag Lim *
Phase A Transient duration
l
Phase A Max Peak Transient
l
TR1 TranV1Max
Phase B Transient duration
l
TR1 TranV2Dur
Phase B Max Peak Transient
l
TR1 TranV2Max
Phase C Transient duration
l
TR1 TranV3Dur
Phase C Max Peak Transient
l
TR1 TranV3Max
Nominal Voltage at the
beginning of Transient
disturbance
l
TR1
TranNominal
Voltage fluctuation amount
considered a Transient
l
TR1 Threshold *
Transient #1
Transient 1
TR1 TranV1Dur
* These are setup registers, not output registers.
2-16
9700 POWER METER USER’S GUIDE
Power Quality Framework, Continued
Description of
Parameter or Function
Displayed/Accessible by Default
WinPM
MGT
Module
Name
Module
Label
Output
Register Label
Sag/Swell Data Recorder
l
Data Recorder #5
Sag/Swell Log
Sag/Swell Log
Transient Data Recorder
l
Data Recorder #6
Transient Log
Transient Log
Phase A Voltage Waveform
Rec.
l
Waveform Recorder
#1
Wfm Rec V1
Wfm Rec V1
Phase B Voltage Waveform
Rec.
l
Waveform Recorder
#2
Wfm Rec V2
Wfm Rec V2
Phase C Voltage Waveform
Rec.
l
Waveform Recorder
#3
Wfm Rec V3
Wfm Rec V3
Phase A Current Waveform
Rec.
l
l
Waveform Recorder
#4
Wfm Rec I1
Wfm Rec I1
Phase B Current Waveform
Rec.
l
l
Waveform Recorder
#5
Wfm Rec I2
Wfm Rec I2
Phase C Current Waveform
Rec.
l
l
Waveform Recorder
#6
Wfm Rec I3
Wfm Rec I3
Sag/Swell monitoring Enable
l
External Boolean #4
Sag/Swell Enble
Sag/Swell Enble
Transient monitoring Enable
l
External Boolean #10
Transient Enble
Transient Enble
Waveform Recording Enable
l
External Boolean #11
Wfm Rec Enble
Wfm Rec Enble
Disturbance Counter reset
l
External Pulse #8
Dist Count Rset
Dist Count Rset
Manual Waveform Rec trigger
l
External Pulse #12
Man Wfm Trg
Man Wfm Trg
Sag/Swell Counter
l
Counter #9
Sag/Swell
Count
Sag/Swell
Count
Transient Counter
l
Counter #10
Transient Count
Transient Count
Disturbance timestamp reset
l
Counter #11
Rset timestamp
Rset timestamp
Waveform trigger merge
l
Pulse Merge #1
Wfm Trg Merge
Wfm Trg Merge
DISPLAYING DATA
2-17
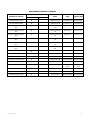
Setpoint Framework
This portion of the configuration provided setpoints to monitor phase
current, voltage unbalance and kW sliding window demand. Using
WinPM, upper limits are input for each parameter. If the measured value
goes above the specified limit for at least 30 seconds, WinPm annunciates
an alarm.
Description of
Parameter or Function
Displayed/Accessible by Default
WinPM
MGT
Module
Name
Module
Label
Output
Register Label
Over kW SW Demand
l
Relative Setpoint #1
Over kW swd
Over kW swd
Over Phase A Current
l
Relative Setpoint #2
Over I a
Over I a
Over Phase B Current
l
Relative Setpoint #3
Over I b
Over I b
Over Phase C Current
l
Relative Setpoint #4
Over I c
Over I c
Over Voltage Unbalance
l
Relative Setpoint #5
Over V unbal
Over V unbal
Nominal kW SW Demand
l
External Numeric #1
kW swd
nominal
kW swd
nominal
Nominal Phase A Current
l
External Numeric #2
I a nominal
I a nominal
Nominal Phase B Current
l
External Numeric #3
I b nominal
I b nominal
Nominal Phase C Current
l
External Numeric #4
I c nominal
I c nominal
Nominal Voltage unbalance
l
External Numeric #5
V unbal nominal
V unbal nominal
Over-demand monitoring
enable
l
External Boolean #7
Over kW Enble
Over kW Enble
Over-current monitoring
enable
l
External Boolean #8
Over Amp
Enble
Over Amp
Enble
Over-voltage unbalance
monitoring enable
l
External Boolean #9
Over Vunb
Enble
Over Vunb
Enble
2-18
9700 POWER METER USER’S GUIDE
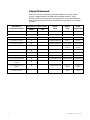
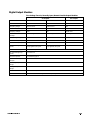
Digital Inputs Framework
This portion of the meter’s configuration monitors the status of the 7900
Power Meter’s on-board digital inputs, and counts the number of times
each input changes state.
Description of
Parameter or Function
Displayed/Accessible by Default
Module
Name
Module
Label
Output
Register Label
WinPM
MGT
Status of Digital Input 1
l
l
Digital Input #1
Digital In 1
S1
Status of Digital Input 2
l
l
Digital Input #2
Digital In 2
S2
Status of Digital Input 3
l
l
Digital Input #3
Digital In 3
S3
Status of Digital Input 4
l
l
Digital Input #4
Digital In 4
S4
Status of Digital Input 5
l
l
Digital Input #5
Digital In 5
S5
Status of Digital Input 6
l
l
Digital Input #6
Digital In 6
S6
Status of Digital Input 7
l
l
Digital Input #7
Digital In 7
S7
Status of Digital Input 8
l
l
Digital Input #8
Digital In 8
S8
Digital Input 1 status changes
l
Counter #1
S1 Counter
S1 Counter
Digital Input 2 status changes
l
Counter #2
S2 Counter
S2 Counter
Digital Input 3 status changes
l
Counter #3
S3 Counter
S3 Counter
Digital Input 4 status changes
l
Counter #4
S4 Counter
S4 Counter
Digital Input 5 status changes
l
Counter #5
S5 Counter
S5 Counter
Digital Input 6 status changes
l
Counter #6
S6 Counter
S6 Counter
Digital Input 7 status changes
l
Counter #7
S7 Counter
S7 Counter
Digital Input 8 status changes
l
Counter #8
S8 Counter
S8 Counter
Status change counter reset
l
External Pulse #6
S Count Rset
S Count Rset
DISPLAYING DATA
2-19
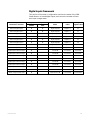
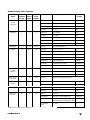
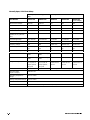
Real Time Measurements (Core Modules)
This portion of the factory configuration contains the real-time phase
voltage and current measurements, harmonics measurements,
symmetrical component data, and output from the device’s real-time
clock.
Description of
Parameter or Function
Module
Name
Module
Label
Output
Register Label
Power Meter Module
Power Meter *
Vln a *
WinPM
MGT
Phase A L-N Volts
l
l
Phase B L-N Volts
l
l
Vln b
Phase C L-N Volts
l
l
Vln c
Average L-N Volts
l
l
Vln avg
L-L Volts AB
l
l
Vll ab
L-L Volts BC
l
l
Vll bc
L-L Volts CA
l
l
Vll ca
Average L-L Volts
l
l
Vll avg
Phase A Current
l
l
Ia
Phase B Current
l
l
Ib
Phase C Current
l
l
Ic
Average Current
l
l
I avg
Phase A kW
l
l
kW a
Phase B kW
l
l
kW b
Phase C kW
l
l
kW c
kW total
l
l
kW tot
Phase A kVAR
l
l
kVAR a
Phase B kVAR
l
l
kVAR b
Phase C kVAR
l
l
kVAR c
kVAR total
l
l
kVAR tot
Phase A kVA
l
l
kVA a
Phase B kVA
l
l
kVA b
Phase C kVA
l
l
kVA c
kVA total
l
l
kVA tot
PF in Quadrant 1 **
Displayed/Accessible by Default
Quadrant 1
In addition to the standard Power Meter module, the 9700 Power Meter includes a HS (high-speed) Power Meter and a
MU (meter units) Power Meter modules. Module and output register labels from the HS and MU Power Meter modules
include an HS or MU prefix.
Quadrant Boolean values indicate the quadrant where the Power Factor lies. Only one Quadrant Boolean will be on at
any given time.
2-20
9700 POWER METER USER’S GUIDE
Real-Time Measurements, Continued
Description of
Parameter or Function
Displayed/Accessible by Default
WinPM
MGT
PF in Quadrant 2
Module
Name
Module
Label
Output
Register Label
Power Meter Module
Power Meter
Quadrant 2
PF in Quadrant 3
Quadrant 3
PF in Quadrant 4
Quadrant 4
Power Factor Phase A
l
l
PF sign a
Power Factor Phase B
l
l
PF sign b
Power Factor Phase C
l
l
PF sign c
Power Factor total
l
l
PF sign tot
Leading Power Factor Phase A
PF lead a
Leading Power Factor Phase B
PF lead b
Leading Power Factor Phase C
PF lead c
Leading Power Factor total
PF lead tot
Lagging Power Factor Phase A
PF lag a
Lagging Power Factor Phase B
PF lag b
Lagging Power Factor Phase C
PF lag c
Lagging Power Factor total
PF lag tot
Voltage Unbalance
l
V unbal
Current Unbalance
l
I unbal
Current Line 4
l
I4
Phase Revolution
Frequency Phase A
Phase Rev
l
Freq
Meter Event
Event
Volts zero sequence
magnitude
l
V ZeroSeqMag
Volts zero seq. phase angle
l
V ZeroSeqPhs
Volts positive seq. magnitude
l
V PosSeqMag
Volts positive seq. phase
angle
l
V PosSeqPhs
Volts negative seq. Magnitude
l
V NegSeqMag
Volts negative seq. phase
angle
l
V NegSeqPhs
Current zero seq. magnitude
l
I ZeroSeqMag
Current zero seq. phase angle
l
I ZeroSeqPhs
Current positive seq.
magnitude
l
I PosSeqMag
DISPLAYING DATA
2-21
Real-Time Measurements, Continued
Description of
Parameter or Function
Displayed/Accessible by Default
WinPM
MGT
Module
Name
Module
Label
Output
Register Label
Power Meter Module
Power Meter
I PosSeqPhs
Current positive seq. phase
angle
l
Current negative seq. Magnitude
l
I NegSeqMag
Current negative seq. phase
angle
l
I NegSeqPhs
l
Volts Phase A HDs
nd
Harmonics Analyzer
Module #1
V1 Harmonics
V1 HD 1
thru
th
(2 to 15 )
V1 HD 63
Volts Phase A total HDs
l
Volts Phase A total even HDs
l
V1 Tot EvenHD
Volts Phase A total odd HDs
l
V1 Tot OddHD
Volts Phase B HDs
l
nd
l
V1 Total HD
Harmonics Analyzer
Module #2
V2 Harmonics
V2 HD 1
thru
th
(2 to 15 )
V2 HD 63
Volts Phase B total HDs
l
Volts Phase B total even HDs
l
V2 Tot EvenHD
Volts Phase B total odd HDs
l
V2 Tot OddHD
Volts Phase C HDs
l
nd
l
V2 Total HD
Harmonics Analyzer
Module #3
V3 Harmonics
V3 HD 1
thru
th
(2 to 15 )
V3 HD 63
Volts Phase C total HDs
l
Volts Phase C total even HDs
l
V3 Tot EvenHD
Volts Phase C total odd HDs
l
V3 Tot OddHD
Current Phase A HDs
l
nd
l
l
V3 Total HD
Harmonics Analyzer
Module #4
I1 Harmonics
I1 HD 1
thru
th
(2 to 15 )
I1 HD 63
Current Phase A total HDs
l
Current Phase A total even HDs
l
I1 Tot EvenHD
Current Phase A total odd HDs
l
I1 Tot OddHD
Current Phase A K-Factor
l
l
Current Phase B HDs
l
l
nd
l
th
(2 to 15 )
I1 Total HD
I1 K Factor
Harmonics Analyzer
Module #5
I2 Harmonics
I2 HD 1
thru
I2 HD 63
Current Phase B total HDs
l
Current Phase B total even HDs
l
I2 Tot EvenHD
Current Phase B total odd HDs
l
I2 Tot OddHD
2-22
l
I2 Total HD
9700 POWER METER USER’S GUIDE
Real-Time Measurements, Continued
Description of
Parameter or Function
Displayed/Accessible by Default
WinPM
MGT
Current Phase B K-Factor
l
l
Current Phase C HDs
l
l
nd
Module
Name
Module
Label
Output
Register Label
I2 K Factor
Harmonics Analyzer
Module #6
I3 Harmonics
I3 HD 1
thru
th
(2 to 15 )
I3 HD 63
l
Current Phase C total HDs
l
Current Phase C total even
HDs
l
I3 Tot EvenHD
Current Phase C total odd HDs
l
I3 Tot OddHD
Current Phase C K-Factor
l
l
Current 4 HDs
l
l
nd
I3 Total HD
I3 K Factor
Harmonics Analyzer
Module #7
I4 Harmonics
I4 HD 1
thru
th
(2 to 15 )
I4 HD 63
l
Current 4 total HDs
l
Current 4 total even HDs
l
I4 Tot EvenHD
Current 4 total odd HDs
l
I4 Tot OddHD
Current 4 K-Factor
l
Daylight Savings Time
(ON/OFF)
DISPLAYING DATA
l
I4 K Factor
Clock Module
Universal Time (UTC)
Local Time
I4 Total HD
l
Clock
UnivTime
LocalTime
DSTFlag
2-23
2-24
9700 POWER METER USER’S GUIDE
3
Making Configuration
Changes
Once basic setup is performed, most users will find that the 9700 Power
Meter’s factory configuration provides all of the monitoring, logging and
control functionality they require. Depending on your application, you may
need to make minor changes to the factory configuration to make the device
“fit” your power system.
The 9700 Power Meter can be customized to perform virtually any power
monitoring and control functions. Creating custom functionality involves
dismantling the factory configuration and replacing it with your own module
links and settings. If you want to make significant changes to the operation
of the 9700 Power Meter, refer to Chapter 4.
-RXLMW'LETXIV
♦
Configuration Tools....................................................................................3–2
♦
Basics of the Architecture..........................................................................3–2
The Module.............................................................................................3–3
The Registers ..........................................................................................3–3
♦
Making Configuration Changes.................................................................3–4
♦
Configuring the 9700 Power Meter with the MGT ...................................3–4
The MGT’s Setup Menus.......................................................................3–4
Using the MGT’s Buttons ......................................................................3–6
Quick Setup.............................................................................................3–7
Parameter Reset .....................................................................................3–9
Configure ION .......................................................................................3–11
±
Configuration Tools
Different types of configuration changes can be made using the different
tools provided by Siemens Energy & Automation. Each of the tools
available has been designed to make basic configuration changes easy.
The configuration tools available and the types of configuration changes
you can make with them are as follows:
238)
Creating custom
functionality in the 9700
Power Meter is discussed
in the next chapter.
♦
WinPM software lets you change the settings for any function
performed by the meter. Everything from basic setup to creating
custom functionality can be performed using WinPM. The different
types of device functions are grouped together on the WinPM screen, so
you can quickly access the types of settings you want to change.
♦
The MGT also provides access to the settings of every meter function.
Special screens are provided for quick access to basic setup functions.
The MGT cannot be used to create custom functionality.
Any of the tools mentioned above are suitable for making minor changes to
the device’s configuration. If you plan to do more extensive changes later
on, use WinPM for device configuration — this software provides the most
comprehensive view of the 9700 Power Meter’s internal operation. Once
you have become comfortable with the WinPM interface, you will be better
prepared to make major changes later.
Basics of the Architecture
Before you begin altering the 9700 Power Meter’s operation, it is advisable
to familiarize yourself with the basics of how the device operates.
Understanding the basics of the architecture will help you understand how
to make different types of configuration changes.
The 9700 Power Meter and all other devices use the Integrated Object
Network as their architecture. This architecture applies the principles of
object-oriented software design to the creation of functionality inside your
devices. The object-oriented structure allows you to connect different
discrete objects, called modules, in different ways to define how
information is accessed, transferred, and manipulated inside the device and
across the power monitoring network.
Each device contains a number of modules that perform specific functions.
The modules are linked together to create frameworks, defining multiple
operations and logical pathways for power system information. The basic
structure of a module is the same for each module type, making it easy to
use new features once the basics are understood.
±
32:(50(7(586(5¶6*8,'(
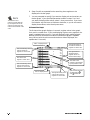
The Module
The module is the basic building block of the device’s architecture. A
module can be considered as a function box: it receives data from its inputs,
makes decisions based on the settings in its setup registers, and then
makes data available at its output registers. All functionality provided by a
device can be considered in terms of its modules and the linkages between
them.
There are approximately 50 types of modules in the architecture; the 9700
Power Meter has 18 different module types. Most devices can support
several instances of a certain module type (for example, the 9700 Power
Meter includes 32 Maximum modules, 16 Sliding Window Demand
modules, and eight External Boolean modules).
238)
More detail on the modules
and registers is provided in
Chapter 4.
The Registers
Each module has one or more output registers, and most modules have
setup registers. (A module’s inputs can be thought of as a link to the output
registers on other modules.)
There are different types of registers, classified by the type of data they
accept. When you want to change a module’s configuration, you must
supply the type of data that is appropriate for the register you are
configuring. All of the configuration tools discussed in this chapter prevent
you from entering the wrong type of data into a register, but they do not
prevent you from entering the wrong value. As any changes to a register’s
value alters the operation of the device, exercise caution when making
configuration changes.
0$.,1*&21),*85$7,21&+$1*(6
±
Making Configuration Changes
Regardless of the interface you use, when you make configuration changes
to a device you are either changing a value in a module’s setup register or
you are changing the linkage between two or more modules. The types of
configuration changes discussed in this chapter are changes to the settings
held in module setup registers.
The 9700 Power Meter is factory-configured for optimal operation. After
basic setup is performed, you do not need to make any modifications to
the device’s configuration for normal use.
Changing the settings in a module’s setup registers changes the way the
device operates. Carefully consider any change you intend to make before
proceeding.
Adding or deleting links between modules significantly alters the operation
of the device, and should only be performed by experienced personnel.
Configuring the 9700 Power Meter with
the MGT
The MGT provides device setup capability at the 9700 Power Meter’s
installed location. All of the 9700 Power Meter’s setup registers can be
configured moving through menus on the MGT’s screen. (module links
cannot be added or deleted using the MGT). The MGT also provides quick
access to parameter reset for common cumulative parameters.
The MGT’s Setup Menus
To access the MGT’s device configuration functions, press the button next
to the SETUP menu item (the top button on the left of the display screen). If
the SETUP menu item does not appear on the MGT’s display, press the
button next to the PREVIOUS menu item until the SETUP option becomes
available. Press SETUP to enter the MGT’s main Setup Menu:
±
32:(50(7(586(5¶6*8,'(
Use QUICK SETUP to change
PT/CT values, communications
setup and demand intervals.
allows you
to reset Status counters and
Min/Max, Energy and
Demand values.
PARAMETER RESET
CONFIGURE ION provides
access to the setup registers
of all modules.
OTHER SETTINGS accesses
the CHANGE PASSWORD
and PASSWORD TIMEOUT
screens.
is for
creating custom MGT
display screens (refer to
Chapter 4).
CONFIGURE BUTTONS
The DISPLAY OPTIONS, NAMEPLATE INFO and DATE/TIME DISPLAY menu items are
described in “Displaying Data with the MGT” in Chapter 2.
0$.,1*&21),*85$7,21&+$1*(6
±
Using the MGT’s Buttons
Move through the MGT’s menu items by pressing the buttons adjacent to
menu items on the screen. To enter data, use the numeric keypad and the
arrow keys to make a selection or enter a value (detailed below). Once a
selection is made or a value is entered, use the ENTER button to confirm the
input and send the data to the 9700 Power Meter. The BKSP button is used
to delete the values you have entered, one character at a time. The ESC
button moves you back to the previously viewed screen, discarding any
changes you have made.
Use the arrow keys to
move through options
presented on the screen.
Use the keypad to enter
numbers or letters when
prompted.
The BKSP key erases your input,
one character at a time.
Press the ESC key to return to
the previous screen without
making any changes.
Press ENTER to select a
highlighted menu item, or to
confirm an input you have made.
Making Selections and Entering Data
Many configuration changes are made by selecting options from a list. To
make a selection, use the arrow keys to highlight the item you want, then
press ENTER.
±
32:(50(7(586(5¶6*8,'(
Some procedures require that you enter a number or a word. When the
MGT wants input from you, it displays a representation of the keypad on the
screen:
The left side represents
the actual buttons on
the MGT keypad.
The right side shows what will
be entered when the
corresponding keypad button
is pressed.
The left side of the button assignment screen represents the actual buttons
on the MGT keypad. The right side of the display indicates which
characters each of the keypad buttons represent. In the display above, to
enter the character “G”, you would press “1” on the MGT keypad.
Press the right or left arrow buttons to scroll through all of the available
keypad button assignments. When the character you want to enter is
displayed on the right, press the corresponding keypad button on the left to
enter that character. The SHIFT key offers a shortcut for accessing characters
on other keypad screens: similar to the SHIFT key on a computer keyboard,
pressing SHIFT on the MGT changes the case of the characters.
After you have entered the characters you want, press the ENTER button to
send the command to the 9700 Power Meter.
Passwords and Password Timeout
All device configuration functions are password protected. The password is
factory set to zero (0). With the factory password you can penetrate the
menus and change the password to a custom value.
238)
If you forget your
password, contact Siemens
Energy & Automation with
your 9700 Power Meter
serial number.
The MGT also features a Password Timeout feature. This feature permits
you to make multiple changes without having to repeatedly enter a
password to authorize the change. Note that the timeout feature is
applicable only within a particular SETUP menu (i.e. within CONFIGURE ION or
PARAMETER RESET). You will be prompted for your password again if the
timeout elapses or if you attempt to make changes from a different SETUP
menu area.
To change the password or adjust the timeout value, choose the OTHER
SETTINGS menu. When you are prompted for your password, press 0 (zero)
on the keypad, then press the enter button. Choose either PASSWORD
TIMEOUT or CHANGE PASSWORD. Follow the instructions on the MGT screen.
Quick Setup
The MGT’s Quick Setup menu provides access to four basic setup functions:
PT/CT, Serial COM, Ethernet COM and Demand. These settings are all made
when the device is initially put into service — typically you will not need to
change these settings once the device is operational. To access a Quick
Setup menu, press SETUP, QUICK SETUP, and then the menu you want to use.
0$.,1*&21),*85$7,21&+$1*(6
±
PT/CT
The PT/CT menu accesses the Power Meter and Sag/Swell module setup
registers that are used for basic setup:
Setup
Register
Function
Volts Mode
The power system’s configuration – WYE, DELTA, Single, etc
PT Prim
The Potential Transformer’s primary winding rating for V1, V2 and V3
PT Sec
The Potential Transformer’s secondary winding rating for V1, V2 and V3
CT Prim
The Current Transformer’s primary winding rating for I1, I2 and I3
CT Sec
The Current Transformer’s secondary winding rating for I1, I2 and I3
I4 CT Prim
The Current Transformer’s primary winding rating for I4
I4 CT Sec
The Current Transformer’s secondary winding rating for I4
Nom Volts
The nominal power system voltage (used for power quality calculations)
Phase Lbls
The phase label format assigned to the outputs (ABC, RST, XYZ, RYB, RWB
or 123)
Serial COM
The Serial COM menu accesses the Communications modules that control
the 9700 Power Meter’s serial ports (Comm 1, and Comm 2/Comm 3 on the
optional XPRESS CARD).
*
±
Setup Register
Function
Comm Mode
Sets the Comm 1 serial port’s communications mode (RS-232 or RS-485)
Baud Rate *
Sets the communications speed, in bits/second) for the serial port
Unit ID *
Sets the 9700 Power Meter’s Unit ID — a unique Unit ID is required for
each device
Protocol *
Sets the communications protocol for the serial port.
These setup registers are available for each installed serial port. The MGT displays CM1,
CM2 or CM 3 to indicate communications ports 1, 2 or 3.
32:(50(7(586(5¶6*8,'(
Ethernet COM
The Ethernet COM menu accesses the Ethernet module’s setup registers.
The Ethernet module controls the 10Base-T and 10Base-FL ports on the
optional XPRESS CARD.
Setup Register
Function
Protocol
Sets the communications protocol for the Ethernet ports.
IP Address
Sets the IP Address for the 9700 Power Meter
Subnet Mask
Used if subnetting applies to your network – see your Network
Administrator
Gateway
Used in multiple network configurations – see your Network
Administrator
Typically your Network Administrator will provide you with the appropriate
IP Address for the 9700 Power Meter. The Subnet Mask and Gateway
settings are only required if you have communications between multiple
Ethernet networks, and if subnetting is implemented.
Demand
The Demand menu accesses some of the setup registers in the factoryconfigured Sliding Window Demand and Thermal Demand modules. These
setup registers control the timing of demand calculations.
*
Setup Register (module)
Function
Sub Intvl (Sliding Window) *
The time, in seconds, in the sliding window demand sub-interval
# SubIntvls (Sliding Window) *
The number of sub-intervals in the sliding window
Interval (Thermal) *
The time, in seconds, in the thermal demand interval
These setup registers are available for each demand module. The MGT displays SD1 to SD4 to
indicate Sliding Window Demand modules 1 through 4, and TD1 through TD4 to indicate
Thermal Demand modules 1 through 4.
Parameter Reset
The Parameter Reset menu allows you to reset various cumulative
parameters. To access Parameter Reset, press SETUP, PARAMETER RESET,
then use the up and down arrow keys to highlight the parameter you want
to reset. When the parameter you want is highlighted, press ENTER.
The first time you reset a parameter, the password screen appears – enter 0
(zero) or the user password you previously configured. The MGT displays
“…Done” next to the parameter name once it has been successfully reset.
The parameters that are reset by each menu selection are detailed below.
0$.,1*&21),*85$7,21&+$1*(6
±
Min/Max Reset
The minimum AND the maximum values for each the following parameters
are reset when Min/Max Rset is used:
♦
Phase and average Current (I a, I b, I c, and I avg)
♦
Frequency
♦
Line-to-line voltages (Vll ab, bc and ca, and Vll avg)
♦
PF lead and PF lag
♦
Line-to-neutral voltages (Vln a, b and c, and Vln avg)
♦
Total kW, kVAR and kVA
Sliding Window Demand Reset
The following Sliding Window Demand parameters are reset when
SWDemand Rset is used:
♦
Average Current SWD
♦
kW SWD
♦
kVAR SWD
♦
kVA SWD
Status Counter Reset
Each of the eight Status Counters that monitor the number of times each
Status input changes are reset when S Count Rset is used.
Thermal Demand Reset
The following Thermal Demand parameters are reset when TDemand Rset
is used:
♦
Average Current TD
♦
kW TD
♦
kVAR TD
♦
kVA TD
Energy Reset
The following energy parameters are reset when Energy Rset is used:
±
♦
kWh import, export, total and net
♦
kVARh import, export, total and net
♦
kVAh
32:(50(7(586(5¶6*8,'(
Configure ION
The Configure ION menu provides access to the setup registers of every ION
module in the 9700 Power Meter. To edit a module’s setup registers with
the MGT, press SETUP then CONFIGURE ION. The Feature Manager appears,
listing all of the module types available. Follow this procedure to access a
setup register:
1. Use the arrow buttons to highlight the type of module you want to
configure. The list of available modules occupies multiple MGT screens
— when you get to the bottom of a screen, press ENTER when the word
“more…” is highlighted to see the next group of module types. When
the type of module you want to configure is highlighted, press ENTER to
view the available modules of that type.
2. Use the arrow buttons to highlight the module you want to configure,
then press ENTER. The module’s setup registers appear, with their
current settings displayed on the right.
3. Use the arrow buttons to move through the setup register listing until
the register you want to configure is highlighted. Press ENTER, then
enter your password to access the register’s setting (use ‘0’ if you have
not configured a password). Press ENTER again after keying in your
password.
4. Use the keypad to enter the new value, or use the arrow buttons to
select the desired option from the list. Press ENTER to send the new
setup register value to the 9700 Power Meter. (Press ESC if you want to
leave the screen without making any changes.)
Refer to Chapter 5 in this guide for a listing of the supported ranges or
options for each module in the 9700 Power Meter.
0$.,1*&21),*85$7,21&+$1*(6
±
4
Using Advanced Features
The 9700 Power Meter provides many advanced features, including
comprehensive I/O, advanced interoperability support, and precision time
synchronization. In addition, the 9700 Power Meter’s functionality can be
customized to perform virtually any power monitoring and control
functions. Using advanced features often requires considerable
background knowledge — please be prepared to spend some time
familiarizing yourself with the information in this chapter and the Technical
Reference in Chapter 5.
This chapter discusses the creation of custom functionality, the use of I/O
and advanced communications protocols, and the creation of custom MGT
displays.
-RXLMW'LETXIV
♦
WinPM-Advanced 9000 Series Meter Programming..................................... 4–2
Basic Concepts ........................................................................................... 4–2
The Module................................................................................................. 4–2
Making Configuration Changes ................................................................ 4–4
Overview of Module Groups ................................................................... 4–14
♦
Using Onboard and Expansion I/O ............................................................... 4–16
♦
Using the Modbus RTU Protocol................................................................... 4–21
♦
Using the DNP 3.0 Protocol ........................................................................... 4–27
♦
Using the EtherGate Protocol ........................................................................ 4–30
♦
Using the Internal Modem ............................................................................. 4–30
Baud Rates................................................................................................ 4–31
ModemGate Functionality ....................................................................... 4–31
Connecting the Modem ........................................................................... 4–32
♦
Using Time Synchronization ......................................................................... 4–34
♦
Creating Custom MGT Displays .................................................................... 4–37
Overview of MGT Button Configuration................................................. 4–37
Using the MGT Display Formats............................................................. 4–38
±
WinPM-Advanced 9000 Series Meter
Programming
The factory configuration for 9000 series meters provides all of the
monitoring, logging and control functionality you normally require.
However, the 9000 series meters can be customized to perform virtually any
power monitoring and control function. Minor changes can be made to the
factory configuration allowing your device to be better suited to the
particular metering needs of your application. This chapter explains how to
make small changes to the factory configuration using WinPM.
You should dismantle the factory configuration and replace it with your own
module links and settings to create custom functionality. Advanced
configuration should be performed by only experienced personnel. If you
want to make significant changes to the operation of the 9000 series meters,
please contact Siemens Energy & Automation Customer Service in Siemens
at 800-427-2256.
Basic Concepts
Before you begin altering the 9000 series meter’s operation, you must learn
the basics of how the device operates. Understanding the basics of the
architecture will help you understand how to make different types of
configuration changes.
Each 9000 series device contains a number of modules that perform specific
functions. The modules are linked together to create frameworks.
Framework defines multiple operations and logical pathways for power
system information. The basic structure of a module is the same for each
module type, making it easy to use new features once the basics are
understood.
The Module
The 9000 series module is the basic building block of the 9000 device’s
operating software. A module can be considered as a function box: it
receives data from its inputs, makes decisions based on the settings in its
setup registers, and then makes data available at its output registers. All
functionality provided by a 9000 series device can be considered in terms of
its modules and linkages between them.
±
32:(50(7(586(5
6*8,'(
There are approximately 50 types of modules in the 9000 series meter
architecture; the 9000 series meter has 46 different types. Most 9000 series
meters can support several instances of a certain module type (for example,
the 9000 series meter supports 16 Thermal Demand modules, 20 Periodic
Timer modules and one Clock module).
The Registers
Each module has one or more output registers, and most modules have
Setup registers. (A module’s inputs can be thought of as a link to the output
registers on other modules.)
There are different types of registers, classified by the type of data they
accept. When you want to change a module’s configuration, you must
supply the type of data that is appropriate for the register you are
configuring. All of the configuration tools discussed in this chapter prevent
you from entering the wrong type of data into a register, but they do not
prevent you from entering the wrong value. As any changes to a register’s
value alters the operation of the device, exercise caution when making
configuration changes.
Module Linking
Module Linkage is a connection from the output of one module to the inputs
of other modules. You can link modules together by assigning the input of
one module to the output register of another module. Data received by the
module through a module's input is then processed.
Module Linking Restrictions
You can only link each module once; however, you can link one output to
one or more different inputs. Circular links are not permitted. You can not
link one module's output to its input, or to the input of any module
preceding it. The only exception to the circular linkage restriction is the
Feedback module. For more details, refer to the Advanced Meter
Configuration Reference Guide.
32:(50(7(586(5¶6*8,'(
±
An input of one module can be linked to the output registers of another
module only if they are of the same register class. For more on module
linking, see the section on Register Classes later in this chapter.
The ‘Not Available’ Value
If a module is not linked to anything, its output registers will not contain any
values and are set to Not Available. In addition, if a module has an input that
is invalid, its output register is also set to Not Available. This helps
distinguish between cases where a register contains a value like ’0’ (zero) or
Off, and cases where there is actually no value available.
If the inputs of a module are Not Available, its output registers are also Not
Available. The setting of Not Available propagates through linked modules.
Online and Offline Modules
The terms online and offline describe whether a module is currently active
or not. A module is described as online when it is functioning normally
(monitoring its input and updating its output registers). An offline module is
inactive.
When you configure a 9000 series meter, the affected modules are
temporarily taken offline while they are programmed with your changes.
Once they have been programmed, the modules are then placed back
online. When a module is created, the module is offline. To make it online,
you may link the module to other modules and/or configure setup registers
properly.
Normally, this is a routine procedure; however, certain circumstances may
prevent a module from returning online. For example, if the node lacks sufficient processing power to operate the module, or if the module has been
configured incorrectly, the module will remain offline.
Making Configuration Changes
When you make configuration changes to a 9000 series device, you are
either changing a value in a module’s setup register or you are changing the
linkage between two or more modules. The types of configuration changes
discussed in this chapter are changes to the settings held in module setup
registers.
Changing the settings in a module’s setup registers changes the way the
device operates. Carefully consider any change you intend to make before
proceeding. Adding or deleting links between modules significantly alters
the operation of the device, and should only be performed by experienced
personnel.
The 9000 series meter is factory-configured for use in most standard
applications. Aside from basic setup, you do not need to make any
modifications to the device’s configuration for normal use. The following
sections address advanced configuration.
±
32:(50(7(586(5
6*8,'(
Creating New Modules
This procedure describes how to use WinPM to create new modules in your
9000 series meter. Do the following to create a new module:
1. From the View Menu, select Device List.
Result: The Device List window is displayed.
2. On the Device List window, highlight the 9300 Power Meter.
3. Click the right mouse button, and select Device Configuration from the
drop-down button menu that is displayed.
Result: The 9300 Configuration window is displayed.
4. Click the Module Add/Remove button.
Result: The 9300 Power Meter Add/Remove window is displayed.
32:(50(7(586(5¶6*8,'(
±
238)
You should wait until
reloading the linkage to the
9000 series meter is
complete. If the maximum
number of modules in the
group is exceeded, WinPM
pops up an error message
box.
5. Select a group to which you want to add new module by highlighting an
item in the Manager Modules list. Then click the Create New Module
button.
Result: The confirmation window for creating a new module is
displayed.
6. Click the Yes button.
Result: WinPM creates a new module for you.
Deleting Modules
This procedure describes how to use WinPM to delete modules in your 9000
series meter. Do the following to delete an existing module:
238)
Before you can delete a
module, you must remove
all links. You cannot delete
a module if any other
modules depend upon the
output of the module.
1. From the View menu, select Device List.
Result: The Device List window is displayed.
2. On the Device List window, highlight the 9000 series power meter that
you want to configure.
3. Click the right mouse button, and then select Device Configuration from
the drop-down menu that is displayed.
Result: The 9000 Series Meter Configuration window of the selected
meter is displayed.
4. Click the Module Add/Remove button.
Result: The 9000 Series Modules Add/Remove window of the selected
meter is displayed.
5. Select a group that you want to delete an existing module by
highlighting an item in the Manager Modules list box. Then select the
module in the Selected Manager Owns list box.
6. Click the Delete Selected Module button.
Result: The confirmation window is displayed.
7. Click Yes to delete the module.
Result: WinPM deletes the existing module for you. You should wait
until the completion of reloading the linkage to the 9000 series meter
Configuring Existing Modules
This procedure describes how to use WinPM to configure the existing
modules by changing the setup registers in your 9000 series meter. Do the
following to configure an existing module:
1. From the View menu, select Device List.
Result: The Device List window is displayed.
±
32:(50(7(586(5
6*8,'(
2. On the Device List window, highlight the 9000 series power meter that
you want to configure.
3. Click the right mouse button, and then select Device Configuration from
the drop-down menu that is displayed.
Result: The 9000 Series Meter Configuration window of the selected
meter is displayed.
4. Click the Advanced button.
Result: The first level window for 9000 Series meter programming is
displayed. The window lists all the groups (types) of modules available
in the selected meter. WinPM displays each module type or group in
one folder. The folders are sorted in alphabetically order. Each group
consists of modules having similar functionality.
5. Double click a module group folder such as, Power Meter modules.
Result: The second level window for 9000 Series meter programming is
displayed. The window lists all the modules available in the selected
group.
32:(50(7(586(5¶6*8,'(
±
6. Double click a module group folder such as, Power Meter modules.
Result: The second level window for 9000 Series meter programming is
displayed. The window lists all the modules available in the selected
group.
7. Click the Configure button.
Result: The setup register window for the selected module is displayed.
The window shows a list of setup registers available for configuration.
The current value for each setup register is displayed in the window.
±
32:(50(7(586(5
6*8,'(
8. Click the Set button for the setup register.
Result: The Modify setup register window for the selected register is
displayed.
9. Click the Ok button to change a setup register setting. Enter the value or
select an item in the drop down list.
Result: A message box displays once the setup register setting is
changed in the selected meter.
As there are different types of data held in setup registers, the Modify
Register dialog box may be different. You may need to choose an option
from a list, enter a numeric value, or enter a string. The details you need to
perform the configuration changes are provided in the Advanced Meter
Configuration Reference Guide.
On the third level module window for 9000 series meter programming, you
may also view or change the configuration of another module or go back to
the second level window that displays all the modules available in the
selected group.
Do the following to change configuration for another module:
1. To view the details of another module, click the Selected Module list box
and then select the module in the list.
Result: The window displays the details of the selected module, such as
input registers, output registers, and other modules connected to the
module.
32:(50(7(586(5¶6*8,'(
±
2. To go back to the second level window for 9000 series meter
programming, click the Up A Level button.
Result: The second level window is displayed. The window lists all the
modules available in the selected group.
Linking Modules
This procedure describes how to use WinPM to link the input of one module
to the output of another module in your 9000 series meter. Do the following
to link modules:
1. From the View menu, select Device List.
Result: The Device List window is displayed.
2. On the Device List window, highlight the 9000 series power meter that
you want to configure.
3. Click the right mouse button, and then select Device Configuration from
the drop-down menu that is displayed.
Result: The 9000 Series Meter Configuration window of the selected
meter is displayed.
4. Click the Advanced button.
Result: The first level window for 9000 Series meter programming is
displayed. The window lists all the groups (types) of modules available
in the selected meter. WinPM displays each module type or group in
one folder. The folders are sorted in alphabetically order. Each group
consists of modules having similar functionality.
5. Double click a module group folder such as, Power Meter Modules.
Result: The second level window for 9000 Series meter programming is
displayed. The window lists all the modules available in the selected
group.
6. Double click a module folder such as, Power Meter module.
Result: The third level window for 9000 Series meter programming is
displayed. The window shows the details of the selected module, such
as input registers, output registers, and other modules connected to the
module.
±
32:(50(7(586(5
6*8,'(
7. Double click an output register that will be the input of another module.
Result: On the lower left-hand corner of the window, WinPM displays
the output register of the selected module.
8. Select the module to be connected to in the Select Module drop down
list.
Result: WinPM displays the module to connect to. If the data type of the
input registers matches the data type of the selected output register, the
color of the lines for the input registers are light green.
32:(50(7(586(5¶6*8,'(
±
9. Double click the input register to connect to.
Result: WinPM displays a warning message.
10. Click the Yes button.
Result: WinPM displays a confirmation message box.
11. Click the Yes button.
Result: WinPM creates the linkage between the two modules.
Deleting Links
This procedure describes how to use WinPM to delete links between two
modules in your 9000 series meter. Do the following to delete links:
1. From the View menu, select Device List.
Result: The Device List window is displayed.
2. On the Device List window, highlight the 9000 series power meter that
you want to configure.
±
32:(50(7(586(5
6*8,'(
3. Click the right mouse button, and then select Device Configuration from
the drop-down menu that is displayed.
Result: The 9000 Series Meter Configuration window of the selected
meter is displayed.
4. Click the Advanced button.
Result: The first level window for 9000 Series meter programming is
displayed. The window lists all the groups (types) of modules available
in the selected meter. WinPM displays each module type or group in
one folder. The folders are sorted in alphabetically order. Each group
consists of modules having similar functionality.
5. Double click a module group folder such as, SWinDemand Modules.
Result: The second level window for 9000 Series meter programming is
displayed. The window lists all the modules available in the selected
group.
6. Double click a module folder such as, SWinDemand 29 module.
Result: The third level window for 9000 Series meter programming is
displayed. The window shows the details of the selected module, such
as input registers, output registers and other modules connected to the
module.
7. Click the Select Not Connected button in the lower left-hand corner of
the window, and then double click the input register to be deleted.
Result: WinPM displays a warning message.
8. Click the Yes button.
Result: WinPM displays a confirmation message box.
9. Click the Yes button.
Result: The link is deleted.
32:(50(7(586(5¶6*8,'(
±
Overview of Module Groups
This section lists different groups (types) of modules available in the 9000
series meters and provides a brief description of each group. For a more
detailed description of any modules, refer to the Advanced Meter
Configuration Reference Guide.
±
Module Group
Description
Arithmetic
Applies mathematical formulas to several Boolean or numeric
values. Supports multiple formulas to provide a variety of result
outputs. Includes previous-value buffers for rate of change
calculations.
Clock
Enables you to specify time zone, daylight savings, and timesynchronization settings.
Communications
Sets up the communications interface on the device. Specifications
include communications standard, baud rate, handshake mode,
RTS/CTS levels, RTS delay, device ID and protocol.
Convert
Converts numeric or Boolean input to numeric, Boolean, or pulse
output. Useful for creating control and status signals for other
modules. For example, you can convert the Status output of a
setpoint module to two distinct pulses (an ON pulse and an OFF
pulse) and then use these pulses to trigger separate events.
Counter
Counts pulses to track the number of times a certain event occurs.
Counts upwards or downwards by a specified amount.
Data Acquisition
Converts the power signals received by a 9000 series device to a
numeric array format that can be used by other modules
Data Recorder
Logs time-stamped numeric values from multiple sources. Can be
activated by external, manual, setpoint, or schedule triggers. Useful
for fault analysis, historical trending, and the creation of
coincidental Min/Max logs.
Diagnostics
Provides data about the status, load, and errors for various
functions. Used in maintenance and troubleshooting.
Digital Input
Converts the state of a digital hardware port to a value that can be
used with other modules.
Digital Output
Outputs a continuous or pulse signal to a chosen hardware port.
Useful for relay control.
DNP Slave Export
Uses the value of a register to create a DNP (Distributed Network
Protocol) object that can be read by a DNP Master device.
DNP Slave Import
Takes the value of a DNP object (written by a DNP Master device)
and writes it into a register in a 9000 series device.
DNP Slave Options
Specifies the global options that support the DNP protocol on the
device. This module also indicates the remaining event buffer space
available.
Ethernet
Sets up communications for the node’s 10Base-T or 10Base-FL
Ethernet port. Used to integrate the node into energy-management
systems and enterprise computer networks.
32:(50(7(586(5
6*8,'(
32:(50(7(586(5¶6*8,'(
Module Group
Description
Event Log Controller
Monitors the node, and logs events as they occur. Logged events
include setpoints, resets, and communication problems. Can be
used to monitor breaker and transfer-switch operations, equipment
starts and stops, and more.
External Boolean
Provides a single Boolean register that can be defined as either ON
or OFF. Can be manually controlled via communications.
External Numeric
Provides a numeric register that can be set to a specified value. Can
be manually controlled via communications. Useful for testing
frameworks that have an initial numeric input, or for specifying
settings for external equipment.
External Pulse
Provides a pulse register that can be configured to pulse on
demand. Can be manually controlled via communications. Useful
for resetting counters or timers, or pulsing external equipment.
Factory
Contains system information including device type, revision, serial
numbers, and configured options.
Feedback
Outputs a pulse each time it receives a pulse. Can be used to create
a circular linkage within a module framework.
FFT
Performs Fast Fourier Transforms (FFT) on waveforms sampled by
the Data Acquisition module. This prepares the waveforms for input
into the Harmonics Analyzer module.
Harmonics Analyzer
Provides harmonic distortion percentages for individual, total, total
even, and total odd harmonics. Operates on voltage, current, or
analog source. Calculates K factor for current input.
Infrared
Communications
Sets up the infrared (IR) communications interface (optical port) of
the device. Defines all settings of the IR port, enabling
communications via Modbus protocols.
Integrator
Integrates any numeric value over time. Usually used to calculate
energy.
Maximum
Monitors a single numeric variable, and records the maximum
value reached.
Minimum
Monitors a single numeric variable, and records the minimum value
reached.
Modbus Slave
Converts data that has been measured or calculated by a 9000
series device, and provides it to master devices on the Modbus
network.
One-Shot Timer
Implements a time delay to postpone or control the length of an
operation.
Periodic Timer
Provides a running timer that pulses at programmable intervals.
When used in conjunction with other modules, the Periodic Timer
can trigger events on a regular basis; for example, when used with
a Recorder module, the Periodic Timer can trigger entries for a
snapshot log.
Power Harmonics
Provides an in-depth analysis of power system parameters for a
selected harmonic. Measures voltage and current levels for the
selected harmonic, and derives kW, kVAR, kVA, Voltage Angle,
Current Angle, and Phase Angle values for each phase.
±
Module Group
Description
Periodic Timer
Provides a running timer that pulses at programmable intervals.
When used in conjunction with other modules, the Periodic Timer
can trigger events on a regular basis; for example, when used with
a Recorder module, the Periodic Timer can trigger entries for a
snapshot log.
Power Meter
Performs calculations on sample waveforms of a three-phase or
single-phase power system. The Power Meter module is
automatically linked to the Data Acquisition module, and together
these modules serve as the link between all other modules and the
physical world.
Pulser
Sends pulses or state changes (KYZ mode) to the specified
hardware port.
Sliding Window
Demand
Calculates sliding window and predicted demand. Useful for
providing average power consumption over a specified time
interval.
Thermal Demand
Calculates thermal demand to provide average power consumption
over a specified time period. Provides a contemporary alternative to
thermal averaging (the traditional demand indicator in which an
element is heated in a watt-hour meter).
Using Onboard and Expansion I/O
The 9700 Power Meter is available with numerous I/O options. The standard
configuration includes eight onboard status inputs. Four onboard analog
inputs and two expansion boards, each with up to 15 I/O modules, are
available as ordering options.
Onboard Status Inputs
The eight onboard status inputs can be used for monitoring external
contacts or pulse counting applications. These inputs use a current sensing
technique to monitor contact status by providing an internal 30 VDC supply
for self-excitation. These inputs can be used for dry contact sensing, but
not for voltage sensing.
238)
The onboard status inputs
cannot be used for voltage
sensing applications.
±
The function of each status input is controlled by the Digital Input modules
1 through 8. These modules are preconfigured at the factory, together with
eight Counter modules for counting status changes, and an External Pulse
module for resetting the Counter modules.
32:(50(7(586(5
6*8,'(
Once you have connected the status inputs to the field equipment that they
monitor, check the 9700 Power Meter’s Digital Input modules to ensure they
are configured appropriately. The eight Digital Input modules are factory
configured as follows:
Setup Register
Factory Setting
Input Mode
Pulse (complete pulse as opposed to KYZ transition pulse)
Event Log Mode
Log Off (status changes are not logged)
Polarity
Inverting (hardware signal is inverted)
Debounce
0.010 (mechanical contact bounce, in seconds)
Port
STATUS1 to STATUS8 (specifies which hardware port the module
controls)
Auxiliary Analog Inputs
The 9700 Power Meter can be ordered with an optional analog input board
that provides four double-ended voltage or current inputs for direct interface
with transducers. The configuration and maximum input range depends on
the option ordered. The options are as follows:
Option
Input Impedance
Max Common Mode Voltage
0 – 1 mA
49.9 •
8V
0 – 20 mA
100 •
20 V
0–1V
>=50 k•
12 V
0 – 10 V
>= 50 k•
25 V
Note that each of the four analog inputs can be configured to monitor AC or
DC signals; however, all four inputs must be configured with the same input
rating. In other words, if you ordered the AUX 20mA option, all four inputs
must be configured as 0-20mA but some can be AC and some can be DC.
Analog Input modules control the function of each analog input. As the
analog input board is optional, no Analog Input modules are included in the
9700 Power Meter’s factory configuration.
Analog Input modules are configured by selecting the port they monitor,
and setting the scaling values used to normalize the incoming signal. Once
configured, you can link the output of the Analog Input module to any other
module that accepts numeric data.
32:(50(7(586(5¶6*8,'(
±
Expansion Boards
Do not use digital output modules on I/O Expansion Board B for control
applications.
False triggers may result when supply power to the board is lost.
Contact Siemens Energy & Automation Customer Service at 800-427-2256
for assistance if you want to use digital output modules on I/O Expansion
Board B for control purposes.
The external input and output capabilities of the 9700 Power Meter can be
expanded using up to two plug-in I/O expansion boards. Each expansion
board can provide multiple analog inputs, analog outputs, digital inputs,
and/or digital outputs. A list of the I/O devices supported by the 9700 Power
Meter is available in Appendix A under the section “Ordering Options”.
The functions of the I/O devices are controlled by Analog Input, Analog
Output, Digital Input, Digital Output, and Pulser modules. Input and Output
modules are configured by specifying the port they use to send or receive
signals (see page 4–20), and configuring other settings specific to the type
of operation they perform.
238)
Slots are numbered on the
expansion boards. Note that
slots 0–7 do not support
analog input devices, and
slot 15 is not used.
Each expansion board offers 15 slots you can plug I/O devices into. Slots 0
through 7 support digital input, digital output and analog output devices
only (analog input devices are not supported). Slots 8 through 14 support
digital input, digital output, analog input and analog output devices. Slot 15
is not supported. Other restrictions apply to the use of analog I/O devices,
as discussed below.
Slots 0 through 7
support DI, DO and AO
Devices in slots 0 through 7
must be ALL INPUTS or ALL
OUTPUTS
(do not mix inputs and outputs)
±
Slots 8 through 14
support DI, DO, AI and AO
Devices in slots 8 through 14
must be ALL INPUTS or ALL
OUTPUTS
(do not mix inputs and outputs)
32:(50(7(586(5
6*8,'(
Analog Device Restrictions — Power Supplies
Power requirements and hardware restrictions limit the number and
placement of analog devices on I/O expansion boards.
The allowable number of analog devices the 9700 Power Meter can support
increases significantly when two external power supplies are used to power
the expansion boards. The default configuration of Expansion Board A does
not include a power supply; it has to be purchased separately. If Expansion
Board A is powered directly from the 9700 Power Meter, then a maximum of
six analog devices can be installed on it. (A separate power supply is
required for Expansion Board B in any configuration.)
To use the maximum number of analog I/O devices, two power supplies
must be used (one for each expansion board). Note that if a separate power
supply is used with Expansion Board A, then the jumper must be removed
from the board. Failure to remove the jumper will void the 9700 Power
Meter’s warranty. (Refer to the 9700 Power Meter Installation & Basic Setup
Instructions for jumper location.)
Analog Device Restrictions — Direction (Input or Output)
The direction of all of the devices in slots 0 through 7 and slots 8 through 14
must be the same. You cannot mix inputs and outputs within these two
groups of slots; however, you can have all inputs in slots 0 through 7, and
all outputs in slots 8 through 14 (or vice versa).
As noted on the graphic above, only slots 8 through 14 support analog input
devices, thereby limiting the maximum number of these devices to seven
per board. Analog Output devices can populate both slot groups on the
expansion board, so a maximum of 15 of these devices can be used per
board.
If Expansion Board A is used without a separate power supply, only six
analog devices can be used in total, regardless of direction restrictions.
The following table summarizes the restrictions on analog I/O devices.
Max # of
Analog
Inputs
Max # of
Analog
Outputs
Max # of
Analog
Devices
Board A WITHOUT Optional
Power Supply (default
configuration)
6
6
6
Any combination up to 6 total
Board A WITH Optional Power
Supply
7
15
15
Board full
Board A WITHOUT Optional
Power Supply (default
configuration) + Board B
13
21
21
A: 6 AI; B: 7 AI, 8 AO
A: 6 AO; B: 7 AI, 8 AO
A: 6 AO; B: 15 AO
A: 6 AI; B: 15 AO
Board A WITH Optional Power
Supply + Board B
14
30
30
Both boards full
32:(50(7(586(5¶6*8,'(
Possible
Maximum
Configurations
±
Specifying a Port in an Module
The Analog Output, Digital Output and Pulser modules in the 9700 Power
Meter allow you to specify which port a signal is sent to. Similarly, the
Analog Input and Digital Input modules allow you to specify which port to
monitor for incoming signals.
When you access any of these module’s Port setup register, all expansion
board ports will be available selections, even if there is no expansion board
connected to the 9700 Power Meter. The AUX inputs will only appear in
Port setup registers if the optional analog input card is installed. The
following tables indicate what ports selections are available with the
different 9700 Power Meter I/O options.
Expansion Board
A
Expansion Board
B
Status Inputs
Aux Analog
Inputs
Port A-0
Port B-0
STATUS1
AUX1/optionalDC
Port A-1
Port B-1
STATUS2
AUX1/optionalAC
Port A-2
Port B-2
STATUS3
AUX2/optionalDC
Port A-3
Port B-3
STATUS4
AUX2/optionalAC
Port A-4
Port B-4
STATUS5
AUX3/optionalDC
Port A-5
Port B-5
STATUS6
AUX3/optionalAC
Port A-6
Port B-6
STATUS7
AUX4/optionalDC
Port A-7
Port B-7
STATUS8
AUX4/optionalAC
Port A-8
Port B-8
Port A-9
Port B-9
Port A-10
Port B-10
Port A-11
Port B-11
Port A-12
Port B-12
Port A-13
Port B-13
Port A-14
Port B-14
Auxiliary analog input options include 0-20mA, 0-1mA, 0-1V and 0-10V
Note that module setup registers will only display the ports that are not yet
assigned. As the 9700 Power Meter’s factory configuration makes use of all
eight status inputs, STATUS1 through STATUS8 will not appear in new
Digital Input modules you create. To make a STATUS port available, set the
Port setup register to NOT USED in one of the factory-configured Digital
Input modules.
±
32:(50(7(586(5
6*8,'(
Using the Modbus RTU Protocol
The 9700 Power Meter can make any real-time data available through the
Modicon Modbus RTU protocol. Modbus Master devices connected to the
9700 Power Meter can access this data. Modbus Master devices can also
write data into registers, making device configuration changes or initializing
control actions.
The 9700 Power Meter’s Factory Modbus
Configuration
The 9700 Power Meter makes data available to Modbus Master devices
using four Modbus Slave modules. These modules are linked to other
modules in the 9700 Power Meter that provide the energy, power and
demand data. Once a communications channel is configured to use
Modbus RTU protocol (refer to “Communications Setup” in Chapter 2), the
data is available to Modbus Master devices.
communications port is set
to Modbus RTU protocol
measured data is linked
to Modbus module’s input
Power Meter
Module
Vln a
Modbus Slave
Module
40011
data is available to
Modbus Master device
Modbus module outputs
data in Modbus format
9700 Power Meter
The data available through the Modbus Slave modules is in a specific
format, knowledge of the Modbus protocol and an understanding of the
settings used in the 9700 Power Meter are required to interpret the data
provided.
Changing the Modbus Configuration
If the factory Modbus configuration does not suit your needs, the existing
Modbus Slave modules can be relinked to other parameters that you want
to access through Modbus. There are only four Modbus Slave modules
available in the 9700 Power Meter, so you will have to delete some of the
preconfigured links if you want to make other parameters available to
Modbus Master devices.
If your Modbus Master device requires data in a format different than that
provided by the factory Modbus configuration, you can edit the setup
registers in the Modbus Slave modules. These setup registers specify the
Modbus format, scaling and base address settings.
32:(50(7(586(5¶6*8,'(
±
Modbus Slave Module Settings
The settings in the Modbus Salve module setup registers are shown in the
tables below.
Modbus Slave Module #1
Setup Register
Setting
Setup Register
Setting
Format
unsigned 16-bit
Format
signed 32-bit
Base Address
40011
Base Address
40027
Scaling
YES
Scaling
YES
In Zero
0
In Zero
-214748364
In Full
6553
In Full
214748364
Out Zero
0
Out Zero
-2147483640
Out Full
65530
Out Full
2147483640
Modbus Slave Module #3
±
Modbus Slave Module #2
Modbus Slave Module #4
Setup Register
Setting
Setup Register
Setting
Format
signed 32-bit
Format
signed 32-bit MFP
Base Address
40059
Base Address
40089
Scaling
YES
Scaling
NO
In Zero
-214748364
In Full
214748364
Out Zero
-2147483640
Out Full
2147483640
32:(50(7(586(5
6*8,'(
Modbus Slave Module Parameter Mapping
The following tables show which measurements are provided by each of the
four Modbus Slave modules. The source for each measurement is shown
(“Source Module”) so that you can easily delete parameters if you want to
access different data. Note that the Modbus Register remains the same if
you link a different parameter into one of the Modbus Slave module inputs
(i.e. any value you link to Modbus Slave module #1, Source Input #1 will use
Modbus Register 40011).
Modbus Slave Module #1 Links
Measurement
Label
Source
Module
Modbus Module and Input
Number
Modbus
Register
L-N Voltage Phase A
Vln a
Power Meter
Modbus Slave #1 – Source Input #1
40011
L-N Voltage Phase B
Vln b
Power Meter
Modbus Slave #1 – Source Input #2
40012
L-N Voltage Phase C
Vln c
Power Meter
Modbus Slave #1 – Source Input #3
40013
Average L-N Voltage
Vln avg
Power Meter
Modbus Slave #1 – Source Input #4
40014
L-L Voltage AB
Vll ab
Power Meter
Modbus Slave #1 – Source Input #5
40015
L-L Voltage BC
Vll bc
Power Meter
Modbus Slave #1 – Source Input #6
40016
L-L Voltage CA
Vll ca
Power Meter
Modbus Slave #1 – Source Input #7
40017
Average L-L Voltage
Vll avg
Power Meter
Modbus Slave #1 – Source Input #8
40018
Phase A Current
Ia
Power Meter
Modbus Slave #1 – Source Input #9
40019
Phase B Current
Ib
Power Meter
Modbus Slave #1 – Source Input #10
40020
Phase C Current
Ic
Power Meter
Modbus Slave #1 – Source Input #11
40021
Average Current
I avg
Power Meter
Modbus Slave #1 – Source Input #12
40022
Voltage Unbalance
V unbal
Power Meter
Modbus Slave #1 – Source Input #13
40023
Current Unbalance
I unbal
Power Meter
Modbus Slave #1 – Source Input #14
40024
Line Frequency
Freq
Power Meter
Modbus Slave #1 – Source Input #15
40025
Neutral Current
I4
Power Meter
Modbus Slave #1 – Source Input #16
40026
32:(50(7(586(5¶6*8,'(
±
Modbus Slave Module #2 Links
±
Measurement
Label
Source
Module
Modbus Module and Input
Number
Modbus
Register
Phase A kW
kW a
Power Meter
Modbus Slave #2 – Source Input #1
40027-40028
Phase B kW
kW b
Power Meter
Modbus Slave #2 – Source Input #2
40029-40030
Phase C kW
kW c
Power Meter
Modbus Slave #2 – Source Input #3
40031-40032
Total kW
kW tot
Power Meter
Modbus Slave #2 – Source Input #4
40033-40034
Phase A kVAR
kVAR a
Power Meter
Modbus Slave #2 – Source Input #5
40035-40036
Phase B kVAR
kVAR b
Power Meter
Modbus Slave #2 – Source Input #6
40037-40038
Phase C kVAR
kVAR c
Power Meter
Modbus Slave #2 – Source Input #7
40039-40040
Total kVAR
kVAR tot
Power Meter
Modbus Slave #2 – Source Input #8
40041-40042
Phase A kVA
kVA a
Power Meter
Modbus Slave #2 – Source Input #9
40043-40044
Phase B kVA
kVA b
Power Meter
Modbus Slave #2 – Source Input #10
40045-40046
Phase V kVA
kVA c
Power Meter
Modbus Slave #2 – Source Input #11
40047-40048
Total kVA
kVA tot
Power Meter
Modbus Slave #2 – Source Input #12
40049-40050
Phase A signed PF
PF sign a
Power Meter
Modbus Slave #2 – Source Input #13
40051-40052
Phase B signed PF
PF sign b
Power Meter
Modbus Slave #2 – Source Input #14
40053-40054
Phase C signed PF
PF sign c
Power Meter
Modbus Slave #2 – Source Input #15
40055-40056
Average signed PF
PF signed
tot
Power Meter
Modbus Slave #2 – Source Input #16
40057-40058
32:(50(7(586(5
6*8,'(
Modbus Slave Module #3 Links
Measurement
Label
Source
Module
Modbus Module and Input
Number
Modbus
Register
Maximum Avg L-L Voltage
Vll avg max
Maximum
Modbus Slave #3 – Source Input #1
40059-40060
Maximum Average Current
I avg max
Maximum
Modbus Slave #3 – Source Input #2
40061-40062
Maximum Total kW
kW tot max
Maximum
Modbus Slave #3 – Source Input #3
40063-40064
Maximum Total kVAR
kVAR tot
max
Maximum
Modbus Slave #3 – Source Input #4
40065-40066
Maximum Total kVA
kVA tot max
Maximum
Modbus Slave #3 – Source Input #5
40067-40068
Maximum Line Frequency
Freq max
Maximum
Modbus Slave #3 – Source Input #6
40069-40070
Minimum Avg L-L Voltage
Vll avg min
Minimum
Modbus Slave #3 – Source Input #7
40071-40072
Minimum Average Current
I avg min
Minimum
Modbus Slave #3 – Source Input #8
40073-40074
Minimum Line Frequency
Freq min
Minimum
Modbus Slave #3 – Source Input #9
40075-40076
kW Sliding Window Demand
kW swd
Sliding Win Demand
Modbus Slave #3 – Source Input #10
40077-40078
kVA Sliding Window
Demand
kVA swd
Sliding Win Demand
Modbus Slave #3 – Source Input #11
40079-40080
kVAR Sliding Window
Demand
kVAR swd
Sliding Win Demand
Modbus Slave #3 – Source Input #12
40081-40082
Maximum kW SW Demand
kW swd
max
Maximum
Modbus Slave #3 – Source Input #13
40083-40084
Maximum kVA SW Demand
kVA swd
max
Maximum
Modbus Slave #3 – Source Input #14
40085-40086
Maximum kVAR SW Demand
kVAR td
max
Maximum
Modbus Slave #3 – Source Input #15
40087-40088
32:(50(7(586(5¶6*8,'(
±
Modbus Slave Module #4 Links
Measurement
Label
Source
Module
Modbus Module and Input
Number
Modbus
Register
Imported kWh
kWh imp
Integrator
Modbus Slave #4 – Source Input #1
40089-40090
Exported kWh
kWh exp
Integrator
Modbus Slave #4 – Source Input #2
40091-40092
Total kWh
kWh tot
Integrator
Modbus Slave #4 – Source Input #3
40093-40094
Net kWh
kWh net
Integrator
Modbus Slave #4 – Source Input #4
40095-40096
Imported kVARh
kVARh imp
Integrator
Modbus Slave #4 – Source Input #5
40097-40098
Exported kVARh
kVARh exp
Integrator
Modbus Slave #4 – Source Input #6
40099-40100
Total kVARh
kVARh tot
Integrator
Modbus Slave #4 – Source Input #7
40101-40102
Net kVARh
kVARh net
Integrator
Modbus Slave #4 – Source Input #8
40103-40104
Total kVAh
kVAh
Integrator
Modbus Slave #4 – Source Input #9
40105-40106
Max Phase A Voltage THD
V1 THD max
Maximum
Modbus Slave #4 – Source Input #10
40107-40108
Max Phase B Voltage THD
V2 THD max
Maximum
Modbus Slave #4 – Source Input #11
40109-40110
Max Phase C Voltage THD
V3 THD max
Maximum
Modbus Slave #4 – Source Input #12
40111-40112
Max Phase A Current THD
I1 THD max
Maximum
Modbus Slave #4 – Source Input #13
40113-40114
Max Phase B Current THD
I2 THD max
Maximum
Modbus Slave #4 – Source Input #14
40115-40116
Max Phase C Current THD
I3 THD max
Maximum
Modbus Slave #4 – Source Input #15
40117-40118
Importing Data using Modbus RTU
It is possible to bring data into the 9700 Power Meter using Modbus.
Various registers can be written by Modbus Master devices by correlating
the Modbus register number with the address of the register you want to
write. When a Modbus register is written with a value, the corresponding
register will be written, provided the Modbus RTU protocol is active on the
communications channel that connects the Modbus Master to the 9700
Power Meter.
You can use the Modbus RTU protocol to write values into external numeric,
pulse and Boolean registers, allowing you to enable, disable and reset 9700
Power Meter functions. You can also use the Modbus protocol to change
setup register values in various modules to configure the 9700 Power
Meter’s operation.
±
32:(50(7(586(5
6*8,'(
Using the DNP 3.0 Protocol
238)
Complete DNP
documentation is available
through the DNP User’s
Group (on the web at
www.dnp.org).
This documentation
describes DNP 3.0
Transport Functions, the
Application Layer Protocol,
the Data Object Library,
Subset Definitions, and the
Data Link Layer Protocol
Description.
The Distributed Network Protocol Version 3.0 (DNP 3.0) is an open protocol
used in the electric utility industry for communications and interoperability
among substation computers, RTUs, IEDs, and Master Stations. The 9700
Power Meter can be integrated into a DNP network using the DNP Slave
Import, Export and Options modules.
The 9700 Power Meter’s Factory DNP 3.0
Configuration
The 9700 Power Meter’s factory configuration makes various parameters
available through DNP 3.0. There is no factory-configured functionality for
importing DNP 3.0 data into the 9700 Power Meter.
Modules are linked to DNP Slave Export modules which convert the data
into the appropriate DNP objects. These objects are available through the
9700 Power Meter communications port that is configured to use the DNP
3.0 protocol. The DNP Options module sets global options for all of the DNP
Slave Export modules.
DNP Options
Module
DNP Options module
sets global options
for all DNP modules
measured data is linked
to DNP module’s input
Power Meter
Module
Vln a
data is available
to DNP devices
DNP Export
Module
DNP objects
DNP module outputs
data as DNP objects
communications port is
set to DNP 3.0 protocol
9700 POWER METER
Changing the DNP Configuration
If the factory DNP configuration does not suit your needs, the existing DNP
Slave Export modules can be relinked to other parameters that you want to
access through DNP. Alternately you can add additional DNP Slave Export
modules and link the desired parameters to them. There are 16 DNP Slave
Export modules available on the 9700 Power Meter; of these, 14 are used by
the factory configuration.
32:(50(7(586(5¶6*8,'(
±
If your DNP network requires data in a format different than that provided by
the factory DNP configuration, you can edit the setup registers in the DNP
Slave Export modules and the DNP Options module. Do not make any
changes to the DNP Options module’s setup registers unless you
understand the effects each change will cause.
238)
DNP 3.0 can only be used
on the XPRESS CARD’s RS485 ports (COM 1 and
Ethernet ports are not
supported).
Only one port per 9700
Power Meter can be used
with DNP 3.0
As DNP 3.0 is a very complex protocol, an in-depth understanding of DNP
3.0 is required to interpret the settings in the DNP Options module and the
DNP Slave Export modules. It is beyond the scope of this guide to describe
DNP; consult the DNP User’s Group or other resources to learn more about
the protocol.
DNP Slave Export Module Settings
The 14 factory-configured DNP Slave Export modules are configured as
shown in the following table.
Setup Register
Setting
BasePoint
Varies – each analog input or binary counter has a different
BasePoint
StaticObj
11 modules are Analog Input; three are Binary Counter
EventObj
Disable Event Objects
Deadband
0
FrozStaObj
Disable Frozen Static Objects
FrozEvtObj
Disable Frozen Event Objects
EventClass
Class 1
Scaling
OFF (excluding Unbalx10 and Freqx10 which are ON)
SEAbusZero
0
SEAbusFull
0 (1000 for Unbalx10 and 100 for Freqx10)
DNPZero
0
DNPFull
0 (10000 for Unbalx10 and 1000 for Freqx10)
As the table indicates, some of the setup register settings vary for different
modules. Specifically, BasePoint will be different for each module within a
group (Analog Input and Binary Counter are groups), and StaticObj is set to
Analog Input for the 11 analog input points and Binary Counter for the three
binary counter points. (StatObj defines the type of DNP object the module
provides when the Master polls it.)
In addition, Scaling is OFF for all but two modules. The only modules that
apply scaling are the Analog Input points that provide Voltage and Current
Unbalance data (labeled Unbalx10) and Frequency data (Labeled Freqx10).
These modules apply x10 scaling.
±
32:(50(7(586(5
6*8,'(
DNP Options Module Settings
The DNP Options module provides global settings that affect all DNP Slave
Export and DNP Slave Import modules. The default settings in this module
are shown in the following table.
Setup Register
Setting
Function
BinInStatic
Single-bit Binary Input
variant for Binary Input Static objects
BinInEvents
Binary Input Change w/o
time
variant for Binary Input Event objects
BinInEvDepth
100
maximum number of Binary Input Events that can be stored
BinCntStatic
16-bit Binary Counter w/o
flag
variant for Binary Counter Static objects
FrzCntStatic
16-bit Frozen Counter w/o
flag
variant for Frozen Counter Static objects
FrzCntEvents
16-bit Frozen Counter Event
w/o time
variant for Frozen Counter Event objects
FrzCntEvDepth
100
maximum number of Frozen Counter Events that can be stored
CntChangeEvents
16-bit Counter Change Event
w/o time
variant for Counter Change Event objects
CntChangeEvDepth
100
maximum number of Counter Change Events that can be stored
AIStatic
16-bit Analog Input w/o flag
variant for Analog Input Static objects
FrzAIStatic
16-bit Frozen Analog Input
w/o flag
variant returned from Class 0 poll for Frozen Analog Input Static
objects
FrzAIEvents
16-bit Frozen Analog Event
w/o time
variant for Frozen Analog Input Event objects
FrzAIEvDepth
100
maximum number of Frozen Analog Input Events that can be stored
AIChangeEvents
16-bit Analog Input Change
Event w/o time
variant for Analog Input Change Event objects
AIChangeEvDepth
200
maximum number of Analog Input Change Events that can be
stored
AOStatic
16-bit Analog Output Status
variant for Analog Output Block objects
SelectTimeout
10
Select Before Operate timeout period (in seconds)
TimeSynchPeriod
86400
time (in seconds) between IED requests for time syncs
ALFragSize
2048
maximum application layer message size (in octets) that IED can
send
DLAck
Never
when device will request data link layer acknowledgements
DLTimeout
2
how long data link layer waits for acknowledgement from Master
DLNumRetries
0
how many times a data link layer packet is re-sent after failing
32:(50(7(586(5¶6*8,'(
±
Importing Data using DNP 3.0
Data can be imported into the 9700 Power Meter from a DNP control relay or
analog output device. DNP Slave Import modules are used to take a DNP
Analog output or Binary output object and map them into registers.
Using the EtherGate Protocol
The EtherGate protocol can be used on one or more of the XPRESS CARD’s
RS-485 ports, in place of SEAbus, Modbus RTU or DNP 3.0 protocols. The
EtherGate protocol allows the 9700 Power Meter to act as a gateway,
transferring data directly between Ethernet and RS-485 networks.
There are three ways EtherGate can be used to transfer data between
networks. Using the IP Address of the 9700 Power Meter, one of three IP
Service Port numbers (sockets) can be used to direct the flow of data as
follows:
♦
If the IP Service Port is set to 7800, Ethernet data is transferred to both
XPRESS CARD RS-485 ports.
♦
If the IP Service Port is set to 7802, Ethernet data is transferred to the
XPRESS CARD’S COM 2 RS-485 port only.
♦
If the IP Service Port is set to 7803, Ethernet data is transferred to the
XPRESS CARD’S COM 3 RS-485 port only.
Communicating 8LVSYKL the 9700 Power Meter
In the basic EtherGate configuration, your WinPM workstation connects to
the XPRESS CARD’s Ethernet port, and an RS-485 loop of devices connects to
the XPRESS CARD’s COM2 or COM3 RS-485 port (or both, if you have two RS485 loops). In this configuration you communicate with the RS-485 loop
through the 9700 Power Meter (the 9700 Power Meter acts as the gateway).
Using the Internal Modem
This section describes the operation of the 9700 Power Meter internal
modem. This section only applies if you have ordered the –MDM (or –
MDMC) option.
Before installing or using your 9700 Power Meter, make sure that you are
familiar with the FCC and Industry Canada warnings located at start of this
manual, as well as the Installation and Basic Setup Instructions included
with the device.
±
32:(50(7(586(5
6*8,'(
The cable that connects the modem to the telephone network must be
disconnected before opening the meter for servicing.
Baud Rates
The internal modem is capable of using all standard modem protocols from
300 bps to 33600 bps. The baud rate used between connected modems is
independent of the baud rate used for communication between the modem
and the 9700 Power Meter.
ModemGate Functionality
The 9700 Power Meter-MDM’s internal modem is multiplexed with the
Comm 1 communications port. This provides a connection between your
meter, your connected RS-485 loop, and your telephone network. This
connection, referred to as ModemGate, transfers all data received by the
internal modem to the RS-485 loop connected to Comm 1.
:LQ30ZRUNVWDWLRQZLWKPRGHP
7HOHSKRQH
1HWZRUN
&RPPDQG&RPP
DUHRQO\DYDLODEOHZLWK
Do not connect a WinPM
workstation or other master
device to the 9700 Power
Meter -MDM’s Comm 1 RS485 loop.
WKH;35(66&DUG
56ORRS
3RZHU0HWHU0'0&
32:(50(7(586(5¶6*8,'(
±
Connecting the Modem
238)
If your 9700 Power Meter has
the –MDMC option, connect
the bare wire cable included
with your meter to the
captured wire connector.
Connect the 9700 Power Meter-MDM modem via the RJ-11 jack located on
the top of the meter. An FCC compliant telephone cord is provided that has
two male RJ-11 plugs. Connect the meter to your telephone network using
the cable provided (if you use a different cable, ensure that it is FCC Part 68
compliant). Follow these steps to connect the modem to your telephone
network:
1. Install the meter into its mounting location and connect the power
supply, communications connections, and voltage and current inputs as
described in the Installation and Basic Setup Instructions shipped with
the meter.
2. Plug the telephone cord into the modem’s RJ-11 socket, located on the
top of the meter (labeled MODEM).
3. Plug the other end of the telephone cable into the telephone jack that
connects to the telephone network.
4. Power up the meter.
5. Using WinPM, configure the Comm 1 Communication’s module settings
(described below).
Communications Module Settings
The Comm 1 Communications module on the 9700 Power Meter has one
additional setup register labeled ModemInit. This string register defines the
initialization string for the internal modem, using a maximum of 47
characters.
Edit the ModemInit register and enter the initialization string desired. The
string is sent to the modem as soon as you download (Send & Save) the
Comm 1 module. Note that the string is also sent to the modem whenever
the meter is powered up, or whenever the baud rate in the Comm 1
Communications module is changed.
Any changes to the Modem Init or Baud Rate setup registers while the
modem is online will cause the modem to disconnect from the phone line.
Verifying Communications
There are four LEDs on the top of the 9700 Power Meter to help you verify
that the modem is communicating properly. Beside the RJ-11 (or captured
wire) connector marked MODEM, are two LEDs marked TXD and CD.
±
32:(50(7(586(5
6*8,'(
LED
Function
CD
This LED indicates the presence of a carrier signal. It should stay on as long as
there is an active connection to the modem.
TXD
This LED flashes to indicate the presence signals transmitted out on the telephone
line.
The two LEDs indicating traffic on COMM 1 are marked RXD and TXD.
LED
Function
RXD
This LED flashes as signals are received on Comm1 from the RS-485
loop.
TXD
This LED flashes as signals are transmitted from Comm1 to the RS-485
loop.
Modem Initialization String Examples
The modem supports various commands in the initialization string. The
examples below are for use when the modem is used to receive incoming
calls.
1. Enter the following string to force the modem to use the 1200 bps Bell
212A quick-connect (this ensures the modem will answer incoming calls
and connect within nine seconds):
AT&F0 +MS=69,0,1200,1200 \N0 S0=1
2. This string will set the modem back to its default state of connecting
with the fastest possible baud rate between modems:
AT&F0 S0=1
For any initialization string it is recommended that the &F0 be at the
beginning of the string. A list of compatible AT commands is provided in
Chapter 5: ”Technical Reference”.
32:(50(7(586(5¶6*8,'(
±
Using Time Synchronization
Time synchronization allows you to synchronize the internal clocks of
multiple networked Siemens Energy & Automation devices. When your
devices’ clocks are synchronized, all data logs will have timestamps that are
relative to a uniform time base. This allows you to perform accurate
sequence-of-events and power quality analyses.
238)
If the time on a device is out
by one second or more
when a time sync signal is
received, the device’s clock
is reset to the broadcast
time.
Time synchronization is achieved by broadcasting the time across the
network of IEDs. When the source of the time broadcast initially connects to
the devices, the time signal is interpreted as the absolute time, and the
devices’ clocks are reset. During normal operation time signals are sent out
periodically, and each 9700 Power Meter will continually assess its ability to
remain synchronized with the incoming broadcasts. Over a brief period of
time the 9700 Power Meter learns how its internal timing differs from that of
the broadcast source, and adjusts its timekeeping to compensate. Very
accurate time synchronization can be achieved with this method.
Devices that are not continuously connected to the time source (i.e. modem
sites) will be synchronized each time they are connected. The longer the
duration between connections, the larger the error in time synchronization
can be. In the extreme case this can result in missing or duplicated logs. If
this occurs, GPS receivers can be installed at the remote sites, a direct
WinPM connection can be implemented, or the time between connections
can be reduced. As a remote device’s clock is reset upon connection if its
clock is out of synchronization by one or more seconds, increasing the
frequency of connections will typically ensure records are not duplicated or
lost.
Time Synchronization Accuracy
Different time sync methods can be used to provide different levels of
accuracy. WinPM can be used for systems where time synchronization is
not critical. In this configuration, each device’s clock is synchronized to the
time broadcast by the WinPM Communications Server workstation. For
applications where highly accurate synchronization is required, an
additional serial network is installed at the site, and a GPS receiver is used
to broadcast the time synchronization signal.
Using a GPS receiver, the 9700 Power Meter can be synchronized to within ±
1ms of Universal Time, or within ± 2ms (typical) of other 9700 Power Meter
devices on the network.
±
32:(50(7(586(5
6*8,'(
Communications Ports and Protocols Used
238)
Time synchronization
accuracy cannot be
guaranteed on Ethernet
networks.
Time synchronization signals from WinPM or a GPS receiver are received
through the communications ports on the 9700 Power Meter base unit and
optional XPRESS CARD. Signals can be received on the device’s COM 1 RS232/RS-485 port, the XPRESS CARD’S COM 2 or COM 3 RS-485 ports, or the
XPRESS CARD’S 10BaseT and 10BaseFL Ethernet ports.
An XPRESS CARD is required if time synchronization from a GPS receiver is
implemented (two communications ports are required in this configuration),
and COM1 should be used to receive time synchronization signals.
Time synchronization can be achieved using SEAbus and DNP3.0 protocols
(note that DNP 3.0 can be used on only one XPRESS CARD port per device).
GPS time synchronization uses special protocols defined for the type of GPS
receiver you are using.
Configuring the 9700 Power Meter to Interpret Time Synchronization
Signals
To implement GPS time synchronization, use WinPM or the MGT to
configure the Clock module and the Communications or Ethernet module:
♦
Specify which port will receive time synchronization signals by setting
the Time Sync Source setup register in the 9700 Power Meter’s Clock
module. Only signals received on the port specified will be used for
synchronization.
♦
Specify the protocol you want to use by setting the Protocol setup
register in the 9700 Power Meter’s Communications module (or Ethernet
module) for the port that receives the signals.
You may need to modify the “Time Sync Type” setup register if a DNP
Master is sending time broadcasts in local time.
If you are using WinPM as the source for time synchronization signals, set
the Communications or Ethernet module’s Protocol setup register to
SEAbus. If you are using a GPS receiver as the time source, specify the
receiver type in the Protocol setup register that matches your receiver.
Various GPS receivers are supported by the 9700 Power Meter.
32:(50(7(586(5¶6*8,'(
±
Time Synchronization using a GPS Receiver
Use GPS receivers at each Site if you require time synchronization of your
9700 Power Meter devices to be within ±1ms of Universal Time. To
implement GPS time synchronization, each 9700 Power Meter must be
equipped with the optional XPRESS CARD, as two communications links are
required at each device. The highest possible accuracy can be achieved
using COM 1 to receive time signals; however, COM 2 and COM 3 can be
used for time synchronization with slightly less accuracy than COM 1.
Ethernet or RS-485 network for WinPM communications
XPRESS&ARD port
XPRESS&ARD SRUt
COM 1
COM 1
XPRESS&ARD port
COM 1
RS-232/RS-485
converter
dedicated RS-485 network for time synchronization signals
GPS Receiver
Either RS-232 or RS-485 networks can be used for time synchronization,
however, RS-485 is recommended if more than two devices are being
synchronized. (Ethernet cannot be used for GPS time synchronization.)
Supported GPS Receivers
As of 9700 Power Meter V200, the following GPS receivers are supported:
±
GPS Receiver
Comm Module Protocol Register Setting
True Time XL-DC series
GPS:TRUETIME/DATUM
Datum ExacTime Series
GPS:TRUETIME/DATUM
Arbiter 1092
GPS:ARBITER
Clark and Associates GPS-200-ASCII
GPS:TRUETIME/DATUM
32:(50(7(586(5
6*8,'(
Time Synchronization Diagnostics and Event Logging
The 9700 Power Meter’s Diagnostics module includes five output registers
that provide time synchronization diagnostics. Refer to the 9700 Power
Meter.
Events are logged by the 9700 Power Meter’s Clock module,
Communications modules and Diagnostics module in response to time
synchronization events. The following events will appear in the WinPM
Event Log:
♦
Time sync acquired — generated when the first time sync signal is
received (Diagnostics module’s Time Sync Status register goes ON).
♦
Time sync lost — generated if no time sync signals are received in two
times the average interval of the last five signals (Diagnostics module’s
Time Sync Status register goes OFF).
♦
GPS locked — generated when the GPS receiver locks onto a time
source (Diagnostics module’s GPS Status register goes ON).
♦
GPS unlocked — generated when the GPS receiver loses its lock on a
time source (Diagnostics module’s GPS Status register goes OFF).
♦
Time set — generated when a time synchronization signal is interpreted
as a time set, and the device’s clock is reset. Two events are recorded;
one with the timestamp before the clock was set, and one with the
timestamp after the clock was set.
Creating Custom MGT Displays
Custom MGT displays can be created showing any data the 9700 Power
Meter measures or calculates. To create a custom display, configure one of
the buttons adjacent to the MGT’s screen and specify the display format and
parameters to show on the screen. As the MGT’s buttons are factoryconfigured, an existing display is sacrificed when a custom display is
created.
The MGT displays data in 11 different formats: standard character screens,
large character screens, four and six-channel bar graphs, harmonics
screens, trending screens, integrator screens, and three types of status
screens. This section details the 11 different MGT display formats, and
shows how each is set up to display specific parameters.
Overview of MGT Button Configuration
To create a custom display, one of the user-configurable buttons is
reconfigured. All the user-configurable MGT buttons are set up as follows:
1. Press the SETUP button on the main menu, then press the button labeled
CONFIGURE BUTTONS.
2. Using the keypad, enter your password.
32:(50(7(586(5¶6*8,'(
±
238)
If the button you want to
configure resides on a
different screen, use the
buttons labeled NEXT and
PREVIOUS to scroll back and
forth between the screens
of configurable buttons.
Press the ESC button to
return to the main menu.
3. Press the button that you want to configure.
4. You will be prompted to enter the first line of the new button label you
want to define. Use the keypad to enter the first line of your new button
label, then press ENTER. (The first line of the label can be up to 10
characters long.) Pressing ENTER will keep the current button label.
5. Use the keypad to enter the second line of your new button label (again,
up to 10 characters) then press ENTER. The following screen appears:
6. Select the type of display screen you want to use, then press ENTER.
Depending on the screen type you have chosen, you will be prompted
for different information. Setting up each of the display screens is
described in detail in the sections that follow. Refer to these sections for
instructions about setting them up.
7. When you have specified all the necessary information for the display
screen you selected, press ENTER. You will return to the main menu
screens and the new button you have specified will appear in the main
menu.
Any time you want to view the data in the screen you have setup, press its
button in the main menu. To leave the screen and return to the main menu,
press the ESC button.
Using the MGT Display Formats
The following paragraphs describe the various display formats that the MGT
offers, and how each is configured. Refer to the register class symbol at the
start of each format description to determine what register classes can be
displayed in each screen (register classes are introduced on page 4-4).
Specifying Parameter Handles
When you create a custom screen, the MGT requests a parameter handle.
Parameter handles specify the memory location inside the 9700 Power
Meter where data is stored. Each register has a unique parameter handle.
Parameter handles are four-digit hexadecimal numbers, such as 71E4. To
determine a particular parameter handle, refer to the help file handles.pdf,
provided on all WinPM release CDs. If you do not have a release CD from
±
32:(50(7(586(5
6*8,'(
Siemens Energy & Automation, contact Customer Service at 800-427-2256
and request the parameter handles for the 9700 Power Meter.
Standard Character Screens
Standard character screens are used for displaying numeric register values.
They present data in small enough characters to include 15 different
numeric registers on one screen. These screens are best suited for viewing
close-up. Data in standard character screens are updated once per second,
regardless of the update rate of the register on the connected device.
The value in the
register is displayed
and updated once
per second.
The title is displayed here.
The programmable
register label is displayed
(or the register name if
no label has been setup).
To set up a standard character screen:
1. Enter the parameter handle of the first register you want to display on
the screen, then press ENTER. If you want to keep the register that is
currently in use, press the button labeled KEEP PREVIOUS.
238)
If you have already set up a
standard character screen
and you want to change
only some of the registers
you are displaying, use the
KEEP PREVIOUS button to keep
the old registers.
32:(50(7(586(5¶6*8,'(
2. Repeat step 1 for the remaining 14 registers that you want to display. If
at any point you want to return to the main menu and cancel your
changes, press the ESC button. You do not have to specify a handle for
every register if you do not want to use all 15 lines. Pressing ENTER will
skip a line; in the display screen, that line will be left blank.
3. Once you have entered the parameter handles, you are prompted for a
title for the display screen. Enter a title of up to 26 characters, then
press the ENTER button. If you want to keep the title that is currently in
use, press the button labeled KEEP PREVIOUS.
±
Large Character Screens
Large character screens are also used for displaying numeric register
values. They display up to four registers on one screen. The large
character format is well suited for viewing from a distance. Data in large
character screens are updated once per second, regardless of the update
rate of the register on the connected device.
The register label is
displayed (or the
register name if no
label has been setup).
The value in the
register is
displayed and
updated once per
second.
To set up a large character screen:
1. Enter the parameter handle of the first register you want to display on
the screen, then press ENTER. If you want to keep the register that is
currently in use, press the button labeled KEEP PREVIOUS.
2. Repeat step 1 for the remaining 3 registers that you want to display. If at
any point you want to return to the main menu, press the ESC button.
You do not have to specify a handle for every register if you do not want
to use all 4 lines. Pressing ENTER will skip a line; in the display screen,
that line will be left blank.
Bar Graph Screens
The MGT offers two different kinds of bar graph screens to display numeric
registers on the connected device (a 4-channel and a 6-channel display).
These displays offer a graphical representation of fluctuations in the register
values and they are suitable for viewing from a distance. For both the 4and 6-channel displays, you can define a minimum and a maximum
boundary of the bar graph and hence control the scale of the graph. If you
have linked any of the registers you are displaying to a Minimum or
Maximum module, you can also display the minimum and maximum values
attained by the register.
4-Channel Bar Graph
The 4-channel bar graph displays four numeric register values in bar graph
form. If you are displaying high-accuracy registers, the graph is updated
every second. If you are displaying high-speed registers without minimum
and maximum values indicated, the graph is updated every 100 msec (with
the minimum and maximum values displayed, the update rate is 1 second).
±
32:(50(7(586(5
6*8,'(
The value in the register
is represented by the
position of the bar. No
number is given.
The register label is
displayed (or the register
name if no label has been
setup).
The high boundary of
the scale is shown here.
The low boundary of the
scale is shown here.
If you have elected to show
min and max bars, they are
displayed as the symbols
and .
To set up a 4-channel bar graph screen:
1. Enter the parameter handle of the first register you want to display on
the screen, then press ENTER. If you want to keep the register that is
currently in use, press the button labeled KEEP PREVIOUS.
1. Enter the minimum boundary for the bar graph scale, then press ENTER.
Note that this value should be the lowest value you expect the register
to attain. For example, if your bar graph is to display the voltage on
phase a, and you expect the voltage to be around 1200 V, you may want
to enter 1000 as your minimum boundary. If you want to keep the value
that is currently in use, press the button labeled KEEP PREVIOUS.
2. Enter the maximum boundary for the bar graph scale, then press ENTER.
Note that this value should be the highest value you expect the register
to attain. For example, if your bar graph is to display the voltage on
phase a, and you expect the voltage to be around 1200 V, you may want
to enter 1400 as your maximum boundary. If you want to keep the value
that is currently in use, press the button labeled KEEP PREVIOUS.
3. Repeat steps 1 to 3 for the remaining 3 registers that you want to
display. If at any point you want to return to the main menu, press the
ESC button.
Parameter
5
6
7
8
9
10
11
12
=
=
=
=
=
=
=
=
Function
min for parameter 1
max for parameter 1
min for parameter 2
min for parameter 2
min for parameter 3
max for parameter 3
min for parameter 4
max for parameter 4
32:(50(7(586(5¶6*8,'(
4. The next value you are prompted for is the minimum value attained by
the first register in the display. If you have linked the first register you
are displaying to a Minimum module, you can display that minimum
value on your bar graph. To do so, enter the handle of the appropriate
Minimum module output register, then press ENTER. If you have not
linked to a Minimum module, just press ENTER to continue.
5. Next, you are prompted for the maximum value attained by the first
register in the display. If you have linked the first register you are
displaying to a Maximum module, you can display that maximum value
on your bar graph. To do so, enter the handle of the appropriate
Maximum module output register, then press ENTER. If you have not
linked to a Maximum module, just press ENTER to continue.
±
6. Steps 5 and 6 are repeated for the remaining three registers to be
displayed in the bar graph.
238)
The minimum and
maximum values attained
by the register are not the
same as the minimum and
maximum boundaries of the
scale.
7. You are prompted to specify if you want to display min and max bars on
the bar graph. If you specified parameter handles in steps 5 or 6 and
you want to display these values, select 1, then press ENTER. If you have
not linked to any Minimum or Maximum modules, or you do not want to
display these values, select 0 and press ENTER.
6-Channel Bar Graph
The 6-channel bar graph displays six numeric register values in bar graph
form, and in number form. If you are displaying high-accuracy registers, the
graph is updated every second. If you are displaying high-speed registers
without minimum and maximum values indicated, the graph is updated
every 100 ms (with the minimum and maximum values displayed, the
update rate is 1 second).
Title 1 is displayed here.
The high boundary of
the scale for the first 3
registers is shown here.
The low boundary of the
scale for the first 3
registers is shown here.
The register label is
displayed (or the
register name if no
label has been setup).
The value in the
register is shown here.
The value in the
register is represented
by the position of the
The low boundary of the
scale for the second 3
registers is shown here.
Title 2 is displayed here.
±
The high boundary of the
scale for the second 3
registers is shown here.
Optional min/max bars
are displayed as
and
symbols.
32:(50(7(586(5
6*8,'(
To set up a 6-channel bar graph screen:
1. Enter the parameter handle of the first register you want to display on
the screen, then press ENTER. If you want to keep the register that is
currently in use, press the button labeled KEEP PREVIOUS. Repeat this
step for the remaining 5 registers.
Parameter
7
8
9
10
11
12
13
14
15
16
17
18
=
=
=
=
=
=
=
=
=
=
=
=
Function
min for parameter 1
max for parameter 1
min for parameter 2
min for parameter 2
min for parameter 3
max for parameter 3
min for parameter 4
max for parameter 4
min for parameter 5
max for parameter 5
min for parameter 6
max for parameter 6
2. The next value you are prompted for is the minimum value attained by
the first register in the display. If you have linked the first register you
are displaying to a Minimum module, you can display that minimum
value on your bar graph. To do so, enter the handle of the appropriate
Minimum module output register, then press ENTER. If you have not
linked to a Minimum module, just press ENTER to continue.
3. Next, you are prompted for the maximum value attained by the first
register in the display. If you have linked the first register you are
displaying to a Maximum module, you can display that maximum value
on your bar graph. To do so, enter the handle of the appropriate
Maximum module output register, then press ENTER. If you have not
linked to a Maximum module, just press ENTER to continue.
4. Repeat steps 3 and 4 for the remaining 5 registers that you want to
display. If at any point you want to return to the main menu, press the
ESC button.
238)
The closer together your
min and max values are, the
more pronounced your
graph’s response will be to
changes in the register
value.
6. Enter the minimum boundary for the bar graph scale for the first three
registers, then press ENTER. Note that this value should be the lowest
value you expect any of these registers to attain.
7. Enter the maximum boundary for the bar graph scale for the first three
registers, then press ENTER. Note that this value should be the highest
value you expect any of these registers to attain. Enter the minimum
boundary for the bar graph scale for the second three registers, then
press ENTER
8. Enter the maximum boundary for the bar graph scale for the second
three registers, then press ENTER.
9. You are prompted to specify if you want to display min and max bars on
the bar graph. If you specified parameter handles in steps 2 or 3 and
you want to display these values, select 1, then press ENTER. If you have
not linked to any Minimum or Maximum modules, or you do not want to
display these values, select 0 and press ENTER.
10. Next, you are prompted for a title for the top three bar graphs (Title 1).
Enter a title of up to 9 characters, then press the ENTER button.
11. Next, you are prompted for a title for the bottom three bar graphs (Title
2). Enter a title of up to 9 characters, then press the ENTER button.
32:(50(7(586(5¶6*8,'(
±
Harmonics Screens
The harmonics screens allow you to display the values calculated by the
Harmonics Analyzer module. They appear in a histogram form to show the
harmonic spectrum of the input for which harmonics are being calculated.
To maximize the resolution of the display, the harmonic with the highest
amplitude is scaled to the top of the screen. The display is updated every
second.
This button toggles the display
of Odd harmonics on and off. It
is on when highlighted.
The title of the
screen is displayed
here.
This button toggles the display
of Even harmonics on and off. It
is on when highlighted.
This button toggles the display
between thick lines and thin
lines.
When thick lines are selected,
this button scrolls between
harmonics 1 - 31 and
To set up a harmonics screen:
-14368%28
You only need to enter the
parameter handle for the
first harmonic; the MGT
automatically reads the remaining harmonic registers.
If you enter an incorrect
handle for the first output
register, the rest of the
readings will be
unpredictable
±
1. Enter the handle of the first output register of the Harmonics Analyzer
module you want to view, then press ENTER. If you want to keep the
register that is currently in use, press the button labeled KEEP PREVIOUS.
2. Enter a title of up to 15 characters, then press the ENTER button. If you
want to keep the title that is currently in use, press the button labeled
KEEP PREVIOUS.
32:(50(7(586(5
6*8,'(
Parameter Trending Screens
The parameter trending screens plot the value of a register over time.
These real-time displays allow you to view a register value graphically. You
can specify the scale for the Y-axis of the graph (the register value) and the
X-axis (time). The maximum update rate for a parameter trending screen is
1 second.
The register label is
displayed (or the
register name if no
label has been setup).
The high boundary of
the scale is shown here.
The value in the
register is displayed
and updated once per
second.
The low boundary of
the scale is shown here.
This value depends
on the number of
seconds you specify
between each point.
To set up a parameter trending screen:
1. Enter the handle of the register you want to plot on the screen, then
press ENTER. If you want to keep the register that is currently in use,
press the button labeled KEEP PREVIOUS.
2. Enter the minimum boundary value you expect the register to attain,
then press ENTER. This value becomes the minimum boundary of the Yaxis of the trending graph. If you want to keep the value that is currently
in use, press the button labeled KEEP PREVIOUS.
3. Enter the maximum boundary value you expect the register to attain,
then press ENTER. This value becomes the maximum boundary of the Yaxis of the trending graph. If you want to keep the value that is currently
in use, press the button labeled KEEP PREVIOUS.
4. Enter the number of seconds you want to elapse between each point on
the graph. This determines the scale of the X-axis of the graph. For
example, if you specify 1 second between each point, the X-axis will
span 150 seconds. If you specify 2 seconds between each point, the Xaxis will span 300 seconds. If you want to keep the value that is
currently in use, press the button labeled KEEP PREVIOUS.
You do not need to specify a title for a parameter trending screen. It is preset to display the label of the selected register (or the register name if no
label has been defined). The present value of the selected register is also
displayed in numeric format at the top of the graph.
32:(50(7(586(5¶6*8,'(
±
Status Display Screens
Status display screens are used for displaying Boolean register values. The
data is presented using small enough characters to include 3, 7, or 14
different Boolean registers on one screen. Data in status display screens are
updated once per second, regardless of the updated rate of the register on
the connected device.
Large Status Display
The status display screens with three values use large characters and are
suitable for viewing from a distance.
To set up a large status display screen:
1. Enter the parameter handle of the first register whose status you want to
display on the screen, then press ENTER. If you want to keep the register
that is currently in use, press the button labeled KEEP PREVIOUS.
2. Repeat step 1 for the remaining 2 registers whose status you want to
display.
3. Once you have entered the parameter handles, you are prompted for a
title for the display screen. Enter a title of up to 26 characters, then
press the ENTER button. If you want to keep the title that is currently in
use, press the button labeled KEEP PREVIOUS.
When you view your status display screen, the labels of the selected
registers are displayed; if no labels have been defined, the default register
names appear. To the right of each label, the state of the register is
displayed. This can be either the associated Boolean ON or OFF label, or, if
no Boolean ON/OFF labels have been defined, simply ON or OFF.
±
32:(50(7(586(5
6*8,'(
7 and 14 Status Display Screens
The screens displaying 7 and 14 values are best suited for viewing close-up.
The screen title
is shown here.
Boolean register status is
shown here. If Boolean
ON or OFF label have
been defined, these labels
are displayed instead.
The register label
is displayed (or
the register name
if no label has
been setup).
To set up a 7 or 14 status display screen:
1. Enter the parameter handle of the first register whose status you want to
display on the screen, then press ENTER. If you want to keep the register
that is currently in use, press the button labeled KEEP PREVIOUS.
2. Repeat step 1 for the remaining 6 or 13 registers (depending on which
display you selected) whose status you want to display.
3. Once you have entered the parameter handles, you are prompted for a
title for the display screen. Enter a title of up to 26 characters, then
press the ENTER button. If you want to keep the title that is currently in
use, press the button labeled KEEP PREVIOUS.
When you view your status display screen, the labels of the selected
registers are displayed; if no labels have been defined, the default register
names appear. To the right of each label, the state of the register is
displayed. This can be either the associated Boolean ON or OFF label, or, if
no Boolean ON/OFF labels have been defined, simply ON or OFF.
32:(50(7(586(5¶6*8,'(
±
Waveform Display Screens
Waveform display screens allow you to display the output of a Waveform
Recorder module. They read the data from this module’s Wform Log output
register and display it graphically based on the scale you define. Depending
on how the waveform is formatted, your display may contain from 1 to 8
cycles of waveform data:
Waveform
Format
Cycles Appearing
on MGT
Resolution
(samples/cycle)
128 x 14
1
128
64 x 14, 64 x 28
2
64
32 x 12, 32 x 26,
4
32
8
16
32 x 40, 32 x 54
16 x 22, 16 x 48,
16 x 72, 16 x 96
As the MGT can only display 128 points at a time, it takes the most recent
set of waveforms in the Wform Log output register.
The title of the screen
is displayed here.
The register label is
displayed (or the register
name if no label has been
setup).
To set up a waveform display screen:
1. Enter the handle of a Waveform Recorder’s Wform Log output register,
then press ENTER. If you want to keep the register that is currently in
use, press the button labeled KEEP PREVIOUS.
2. Enter a title of up to 15 characters, then press the ENTER button. To keep
the title that is currently in use, press the button labeled KEEP PREVIOUS.
±
32:(50(7(586(5
6*8,'(
Integrator Screens
Integrator screens allow you to display numeric outputs with greater
resolution than other displays. They can display up to 4 output values on
the MGT at one time, with up to 11 digits of resolution. By default, the MGT
includes the ENERGY display and the outputs of Integrator modules #1
through #4.
To set up an integrator display screen:
238)
Any numeric register can be
displayed on an Integrator
screen.
1. Enter the handle of an Integrator’s Result output register (or other
numeric register if desired), then press ENTER. If you want to keep the
register that is currently in use, press the button labeled KEEP PREVIOUS.
2. Repeat step 1 for the remaining 3 registers whose Results you want to
display. If you want to keep the register that is currently in use, press
the button labeled KEEP PREVIOUS.
When you view your Integrator display screen, the labels of the selected
registers are displayed; if no labels have been defined, the default register
names appear. To the right of each label, the value of the register is
displayed.
32:(50(7(586(5¶6*8,'(
±
±
32:(50(7(586(5
6*8,'(
5
Technical Reference
The specifications that follow are subject to change without notice.
-RXLMW'LETXIV
♦
Module Summary.......................................................................................5–2
Measurements....................................................................................5–12
kW Measurement Accuracy ..............................................................5–13
High-Speed Measurements During Fault ........................................5–14
♦
Input Ratings .............................................................................................5–14
♦
Optional Input/Output Modules ..............................................................5–16
Analog Input Modules .........................................................................5–16
Analog Output Modules ......................................................................5–17
Digital Input Modules...........................................................................5–17
Digital Input Dry Contact Modules .....................................................5–18
Thermocouple Input Modules.............................................................5–18
RTD Input Modules ..............................................................................5–18
Digital Output Modules........................................................................5–19
♦
Additional Specifications .........................................................................5–21
♦
Compatible AT Commands......................................................................5–21
♦
Standards Compliance.............................................................................5–24
♦
Ordering Information ...............................................................................5–25
Internal Analog Input ...........................................................................5–26
External Input/Output Expansion........................................................5–26
Ordering Example ................................................................................5–27
♦
External Output Device Part Number Summary....................................5–28
♦
Warranty....................................................................................................5–29
Product Return Procedure.................................................................5–29
±
Module Summary
The following table (pages 5–2 through 5–11) lists all of the modules
available in the current version of the 9700 Power Meter. The table shows
how many of each module are available, how many of each are used in the
factory configuration, and how many are high-speed capable (high-speed
capable modules update every cycle; standard modules update every
second).
The Module Summary table also shows the ranges or options available for
each module’s setup registers and the setting each register holds when a
new module is created.
Setup Register Creation Defaults
It is important to note that the creation defaults shown in the table apply
only to new modules when they are created in the device. The setup
register settings shown do not apply to modules that are included in the
factory configuration. Many of the modules in the factory configuration
have been configured with custom settings.
Module Summary Table
Module
Name
Alert
±
Total
Available
in 9700
Used in
Factory
Config.
HighSpeed
Capable
10
none
10
Setup Registers
Range or Options
Creation Default
Message
Up to 120 characters
default message
Priority
0 to 255
128
Destination
Up to 50 characters
9,999-999-9999
Type
WinPM, alphanumeric
Pager, Numeric Pager or
ASCII
WinPM
Pager Num
Up to 16 characters
empty
Com Port
Com 1, Com 2, Com 3 or
Not a port
Not a port
Attempts
1 to 20
3
Retry Time
5 to 86400
15
Lockout Time
0 to 86400
0
Location
Up to 50 characters
meter’s network name
Modem Init
Up to 50 characters
AT Q0V1E0
32:(50(7(586(5¶6*8,'(
Module Summary Table, Continued
Module
Name
Total
Available
in 9700
Used in
Factory
Config.
HighSpeed
Capable
Analog Input
up to 18
none
none
Analog Output
AND/OR
up to 30
20
none
none
none
20
Setup Registers
Zero Scale
Range or Options
-1 x 10⁹ to 1 x 10⁹
9
9
Creation
Default
0
Full Scale
-1 x 10 to 1 x 10
1
Port
depends on I/O options
NOT USED
Zero Scale
-1 x 10⁹ to 1 x 10⁹
0
Full Scale
-1 x 10⁹ to 1 x 10⁹
1
Port
depends on I/O options
NOT USED
Mode
AND, OR, NAND or NOR
AND
EvLogMode
LOG ON or LOG OFF
LOG OFF
Arithmetic
4
none
N/A
Formula 1…8
Max 49 characters
empty
Clock *
1
1
N/A
TZ Offset
-43,200 to 46,800
0
DST Start
0 to 4.3 x 10⁹
0
Comm *
4
Comm 1,
Comm 2,
Comm 3,
and MGT
4
none
see also:
Ethernet
module
Convert
20
none
20
9
DST End
86400 to 4.3 x 10
86400
DST Offset
-10,800 to 10,800
0
Time Sync Source*
COM1, COM2, COM3, ETHERNET
COM1
Time Sync Type
UTC, Local
UTC
Comm Mode
RS485 or RS232
RS485
Baud Rate
1200, 2400, 4800, 9600 and 19200
(38400, 57600, 115200 for Comm2
and Comm3)
9600
HshakeMode
RTS/CTS or RTS WITH DELAY
RTS WITH
DELAY
RTS Level
NORMAL or INVERTED
NORMAL
CTS Level
NORMAL or INVERTED
NORMAL
RTS Delay
0 to 1.00 second
0.01 seconds
Unit ID
1 to 9999
Factory set
Protocol
SEAbus, MODBUS, DNP 3.0
GPS:TRUETIME/DATUM,
GPS:ARBITER
SEAbus
no setup registers
* denotes Core module (refer to Chapter 4)
7(&+1,&$/5()(5(1&(
±
Module Summary Table, Continued
Module
Name
Total
Available
in 9700
Used in
Factory
Config.
HighSpeed
Capable
Counter
30
11
none
Data
Acquisition*
1
1
1
Data Recorder
20
8
20
Setup Registers
Range or Options
0XOWLSOLHU
[ WR[
&RXQW0RGH
83RU'2:1
3UHVHW
[ WR[
5ROO9DOXH
[ WR[
Creation Default
83
no setup registers
'HSWK
WR[
5HFRUG0RGH
&,5&8/$5RU
&,5&8/$5
6723:+(1)8//
Diagnostics *
1
1
Digital Input
up to 38
8
Digital Output
DNP Slave
Export
30
16
none
14
N/A
38
30
16
no setup registers
Input Mode
PULSE, KYZ
PULSE
EvLog Mode
LOG ON or LOG OFF
LOG OFF
Polarity
INVERTING or
NON-INVERTING
INVERTING
Debounce
0 to 65.525 seconds
0
Port
depends on I/O options
NOT USED
EvLog Mode
LOG ON or LOG OFF
LOG OFF
Polarity
INVERTING or
NON-INVERTING
INVERTING
Debounce
0 to 65.525 seconds
0
Port
depends on I/O options
NOT USED
'133RLQW
WR
'132EM*US
$QDORJ2XWSXWRU
%LQDU\2XWSXW
%LQDU\2XWSXW
* denotes Core module (refer to Chapter 4)
±
32:(50(7(586(5¶6*8,'(
Module Summary Table, Continued
Module
Name
Total
Available
in 7700
Used in
Factory
Config.
HighSpeed
Capable
DNP Slave
Import
16
none
16
Note: DNP is
only available
on Com 2 or
Com 3
Setup Registers
Creation Default
%DVH3RLQW
WR
6WDWLF2EM
%LQDU\,QSXW%LQDU\
%LQDU\,QSXW
&RXQWHURU$QDORJ,QSXW
(YHQW2EM
(QDEOHRU'LVDEOH(YHQW
'LVDEOH(YHQW2EMHFWV
2EMHFWV
1
1
Note: DNP is
only available
on Com 2 or
Com 3
1
'HDGEDQG
WR[
)UR]6WD2EM
(QDEOHRU'LVDEOH)UR]HQ
'LVDEOH)UR]HQ6WDWLF
6WDWLF2EMHFWV
2EMHFW
(QDEOHRU'LVDEOH)UR]HQ
'LVDEOH)UR]HQ(YHQW
(YHQW2EMHFWV
2EMHFW
(YHQW&ODVV
&ODVVRU
&ODVV
6FDOLQJ
21RU2))
)UR](YW2EM
DNP Slave
Options *
Range or Options
2))
,21=HUR
[
,21)XOO
[
'13=HUR
[
'13)XOO
[
%LQ,Q6WDWLF
6LQJOH%LW%LQDU\,QSXWRU
WR[
WR[
WR[
WR[
6LQJOH%LW%LQDU\,QSXW
%LQDU\LQSXWZLWKVWDWXV
%LQ,Q(YHQWV
%LQDU\,QSXW&KDQJH
:LWKRXW7LPH
%LQDU\,QSXW&KDQJH
:LWKRXW7LPH
%LQDU\,QSXW&KDQJH:LWK
7LPH
%LQ,Q(Y'HSWK
)L[HGDW
BinCntStatic
• 32-Bit Binary Counter
• 32-Bit Binary Counter
Without Flag
• 16-Bit Binary Counter
• 16-Bit Binary Counter
Without Flag
16-Bit Binary Counter
Without Flag
FrzCntStatic
• 32-Bit Frozen Counter
• 32-Bit Frozen Counter
Without Flag
• 32-Bit Frozen Counter
With Time of Freeze
• 16-Bit Frozen Counter
• 16-Bit Frozen Counter
Without Flag
• 16-Bit Frozen Counter
With Time of Freeze
16-Bit Frozen Counter
Without Flag
* denotes Core module (refer to Chapter 4)
7(&+1,&$/5()(5(1&(
±
Module Summary Table, Continued
Module
Name
Total
Available
in 7700
Used in
Factory
Config.
HighSpeed
Capable
DNP Slave
Options *
continued
1
1
1
Setup Registers
Range or Options
Creation Default
FrzCntEvents
• 32-Bit Frozen Counter
Event Without Time
• 32-Bit Frozen Counter
Event With Time
• 16-Bit Frozen Counter
Event Without Time
• 16-Bit Frozen Counter
Event With Time
16-Bit Frozen Counter
Event Without Time
FrzCntEvDepth
Fixed at 100
100
CntChangeEvents
• 32-Bit Counter Change
Event Without Time
• 32-Bit Counter Change
Event With Time
• 16-Bit Counter Change
Event Without Time
• 16-Bit Counter Change
Event With Time
16-Bit Counter
Change Event
Without Time
CntChangeEvDepth
Fixed at 100
100
AIStatic
• 32-Bit Analog Input
• 32-Bit Analog Input
Without Flag
• 16-Bit Analog Input
• 16-Bit Analog Input
Without Flag
16-Bit Analog Input
Without Flag
FrzAIStatic
• 32-Bit Frozen Analog
Input Without Flag
• 32-Bit Frozen Analog
Input With Time of
Freeze
• 16-Bit Frozen Analog
Input Without Flag
• 16-Bit Frozen Analog
Input With Time of
Freeze
16-Bit Frozen Analog
Input Without Flag
FrzAIEvents
• 32-Bit Frozen Analog
Event Without Time
• 32-Bit Frozen Analog
Event With Time
• 16-Bit Frozen Analog
Event Without Time
• 16-Bit Frozen Analog
Event With Time
16-Bit Frozen Analog
Event Without Time
FrzAIEvDepth
Fixed at 100
100
Note: DNP is
only available
on Com 2 or
Com 3
* denotes Core module (refer to chapter 4)
±
32:(50(7(586(5¶6*8,'(
Module Summary Table, Continued
Module
Name
Total
Available
in 7700
Used in
Factory
Config.
HighSpeed
Capable
DNP Slave
Options *
continued
1
1
1
Setup Registers
AIChangeEvents
Note: DNP
is only
available on
Com 2 or
Com 3
Range or Options
• 32-Bit Analog Change
Event Without Time
• 32-Bit Analog Change
Event With Time
• 16-Bit Analog Change
Event Without Time
Creation Default
16-Bit Analog Change
Event Without Time
• 16-Bit Analog Change
Event With Time
Ethernet *
1
Event Log
Controller *
1
1
1
none
N/A
AIChangeEvDepth
100 to 200
200
AOStatic
32-bit Analog Output
Status/
16-bit Analog Output
Status
16-bit Analog Output
Status
SelectTimeout
0-10 seconds
10 seconds
TimeSynchPeriod
1- 86400 seconds (1 day)
86400
ALFragSize
15 – 2048 bytes
2048
DLAck
ALWAYS, MULTI-PACKET
ONLY, NEVER
NEVER
DLTimeout
100 msecs to 10 seconds
2 seconds
DLNumRetries
0-10
0
Gateway
valid IP address
1RQH
SubnetMask
valid IP address
1RQH
IP Address
valid IP address
1RQH
Protocol
SEAbus or MODBUS RTU
SEAbus
Depth
0 to 20 000
500
Protection
The Protection register is factory-set to 128.
Cutoff
0 to 255
5
External
Boolean
32
11
0
EvPriority
0 to 127
0
External
Numeric
20
5
0
EvPriority
0 to 127
0
External
Pulse
128
17
0
EvPriority
0 to 127
0
Factory *
1
1
N/A
Device Type (readonly)
N/A
9700 Power Meter
Compliance (readonly)
N/A
SEAbus-Compliant
* denotes Core module (refer to chapter 4)
7(&+1,&$/5()(5(1&(
±
Module Summary Table, Continued
Module
Name
Total
Available
in 7700
Used in
Factory
Config.
HighSpeed
Capable
Factory *
continued
1
1
N/A
Setup Registers
Range or Options
Creation Default
Options (read-only)
N/A
options purchased
Revision (read-only)
N/A
firmware revision
number
SerialNum (readonly)
N/A
unit serial number
Owner
up to 255 characters
empty
Tag 1
up to 255 characters
empty
Tag 2
up to 255 characters
empty
Nom Freq (read-only)
N/A
factory set frequency
Calibration Values: 39 additional read-only registers hold factory
calibration values
Feedback
10
3
10
no setup registers
FFT *
7
7
7
no setup registers
Harmonics
Analyzer *
7
7
none
no setup registers
Integrator
30
9
none
Divisor
0 to 1 x 10⁹ seconds
3600
Int Mode
FORWARD, REVERSE,
ABSOLUTE or NET
FORWARD
Valu/Pulse
0 to 1 x 10⁹
0
RollValue
0 to 1 x 10⁹
0 (no rollover)
Maximum
60
56
60
no setup registers
Minimum
60
47
60
no setup registers
* denotes Core module (refer to chapter 4)
±
32:(50(7(586(5¶6*8,'(
Module Summary Table, Continued
Module
Name
Total
Available
in 7700
Used in
Factory
Config.
HighSpeed
Capable
Modbus Slave
4
4
none
One-Shot Timer
12
none
12
Periodic Timer
90
3
none
Power
Harmonics
1
none
none
Setup Registers
Range or Options
Creation Default
Format
• Unsigned 16B
• Signed 16B
• Unsigned 32B
• Signed 32B
• Unsigned 32B-M10K
• Signed 32-M10K
• Packed Boolean
#1: Unsigned 16B
#2 & #3: Signed 32
#4: Signed 32B-M10K
Base Addr
400001 to 41800
#1: 40011
#2: 40027
#3: 40059
#4: 40089
Scaling
Yes or No
#1, #2 and #3: Yes
#4: No
In Zero, In Full
-1 x 1038 to 1 x 1038 *
#1: 0, 6553
#2: -214748364,
214748364
#3: -214748364,
214748364
#4: No Scaling
Out Zero, Out Full
-2147483647 to
2147483647 *
#1: 0, 65530
#2: -2147483640,
2147483640
#3: -2147483640,
2147483640
#4: No Scaling
Duration
0.010 to 2 x 10⁶ seconds
1
Period
0.010 to 2 x 10⁶ seconds
900
Sync Mode
NO TRIG ON SYNC or
TRIGGER ON SYNC
NO TRIG ON SYNC
Harmonic Number
1 to 63
1
* denotes Core module (refer to chapter 4)
7(&+1,&$/5()(5(1&(
±
Module Summary Table, Continued
Module
Name
Total
Available
in 7700
Used in
Factory
Config.
HighSpeed
Capable
Power Meter *
3
3
1
Setup Registers
Range or Options
Creation Default
Volts Mode
4W-WYE, 3W-WYE,
DELTA, SINGLE or DEMO
4W-WYE
PT Prim
1 to 999999
120/277/347 (depends
on ordering option)
PT Sec
1 to 999999
120/277/347 (depends
on ordering option)
CT Prim
1 to 999999
5
CT Sec
1 to 999999
5
I4 CT Prim
1 to 999999
5
I4 CT Sec
1 to 999999
5
V1Polarity
NORMAL or INVERTED
NORMAL
V2Polarity
NORMAL or INVERTED
NORMAL
V3Polarity
NORMAL or INVERTED
NORMAL
I1Polarity
NORMAL or INVERTED
NORMAL
I2Polarity
NORMAL or INVERTED
NORMAL
I3Polarity
NORMAL or INVERTED
NORMAL
I4Polarity
NORMAL or INVERTED
NORMAL
PhaseOrder
ABC or ACB
ABC
Nom Freq
not configurable - factory ordering option
Phase Lbls
ABC, RST, XYZ, RYB or
123
ABC
Pulse Merge
8
1
8
EvLog Mode
LOG ON or LOG OFF
LOG OFF
Pulser
10
none
none
PulseWidth
0 to 2 x 10⁶ seconds
1
OutputMode
PULSE or KYZ
PULSE
Polarity
INVERTING or
NON-INVERTING
INVERTING
Port
The Port option is variable, and depends on the
options ordered with the 9700 Power Meter. There
is no default port; the available ports will be
presented when you enter this setup register.
Eval Mode
Value, Percentage
Value
Over Pickup
0 to 1x10⁹ %
0
Relative
Setpoint
10
5
none
9
Over Dropout
0 to 1x10 %
0
Under Pickup
0 to 1x10⁹ %
0
* denotes Core module (refer to chapter 4)
±
32:(50(7(586(5¶6*8,'(
Module Summary Table, Continued
Module
Name
Total
Available
in 7700
Used in
Factory
Config.
HighSpeed
Capable
Relative
Setpoint
continued
10
5
1
Sag/Swell
1
1
1
Scheduler
1
none
none
Setpoint
24
none
24
Sliding
Window
Demand
40
29
none
Symmetrical
Components *
2
2
none
Thermal
Demand
16
4
16
Transient
Waveform
Recorder
1
14
1
6
1
14
Setup Registers
Range or Options
Creation
Default
Under Dropout
0 to 1x10⁹ %
0
SusUntlON
0 to 3600 seconds
0
SusUntlOFF
0 to 3600 seconds
0
EvPriority
0 to 255
128
Swell Limit
100 to 1000 %
106
Sag Limit
0 to 100 %
88
ChangeCrit
0 to 100 %
10
6
NomVoltage
1 to 1x10 Volts
1200
EvPriority
0 to 255
127
Calendar
refer to ION Reference
High Limit
-1 x 10⁹ to 1 x 10⁹
0
Low Limit
-1 x 10⁹ to 1 x 10⁹
0
SusUntlON
WR
0
SusUntlOFF
WR
0
Input Mode
Signed or Absolute
Signed
Eval Mode
GreaterThan or LessThan
GreaterThan
EvPriority
0 to 255
128
Sub Intvl
60 to 5940 seconds
1800
#SubIntvls
1 to 15
1
Pred Resp
0 to 99
70
Harmonic
fixed at the fundamental harmonic
Interval
60 to 5940 seconds
1800
Time Const
1 to 99%.
90%
Threshold
100 to 1000 %
125
EvPriority
0 to 255
128
Depth
0 to 2 x 10⁹
0
RecordMode
CIRCULAR or STOP-WHEN-FULL
CIRCULAR
Format
128x14, 64x14, 64x28, 32x12, 2x26,
32x40, 32x54, 16x22, 16x48, 16x72, 6x96
16x22
Record Delay
Cycles
0 to 2000
0
* denotes Core module (refer to chapter 4)
7(&+1,&$/5()(5(1&(
±
Measurements (@50 Hz/60 Hz @ 25°C) @1% to 125% Full Scale (FS) of input rating (50 mA to 6.25 A)
Parameter
Accuracy ±(%reading + %FS)
1 second
1 cycle
MGT Resolution (%FS)*
1 second
1 cycle
LSD†
Register Bounds
1 second
1 cycle
1x10⁶
0 to 1x10⁶
Voltage (L-N) in Wye;
Vab, Vbc in Delta
0.1% + 0.01%
0.5%+0.05%
0.1%
0.1% + 1
Voltage (L-N) in Wye;
Vca in Delta
0.5% + 0.01%
1.0%+0.1%
0.1%
0.1% + 1 LSD
0 to 2x10⁶
0 to 2x10⁶
Frequency
0.01%
0.1%
0.01 Hz
0.01 Hz
20 Hz to 70 Hz
20 Hz to 70 Hz
Current (<5% FS)
1.0%
2.0%
0.1%
0.1% + 1 LSD
0 to 1x10⁶
0 to 1x10⁶
0.1%+0.01%
0.5%+0.05%
0.1%
0.1% + 1 LSD
0 to 1x10⁶
0 to 1x10⁶
1.0%
2.0%
0.1%
0.1% + 1 LSD
0 to 3.3x10⁷
0 to 3.3x10⁷
kVA (5% το 125% FS)
0.2%+0.02%
1.0%
0.1%
0.1% + 1 LSD
0 to 3.3x10⁷
0 to 3.3x10⁷
kVAh
0.2% reading
–
0.1% of
reading
–
0 to 1038
–
kW (<5% FS)
1.0%
2.5%+0.25%
0.1%
0.1% + 1 LSD
0 to ± 3.3x10⁷
0 to ±3.3x10⁷
kW @ Unity PF
(5% to 25% FS)
0.5%
2.5%+0.25%
0.1%
0.1% + 1 LSD
0 to ± 3.3x10⁷
0 to ±3.3x10⁷
kW @ Unity PF
(25% to 125% FS)
0.3%
2.5%+0.25%
0.1%
0.1% + 1 LSD
0 to ± 3.3x10⁷
0 to ±3.3x10⁷
kW @ ±0.5 PF
(5% to 25% FS)
0.6%
5.0%+0.5%
0.1%
0.1% + 1 LSD
0 to ± 3.3x10⁷
0 to ±3.3x10⁷
kW @ ±0.5 PF
(25% to 125% FS)
0.4%
5.0%+0.5%
0.1%
0.1% + 1 LSD
0 to ± 3.3x10⁷
0 to ±3.3x10⁷
kVAR (<5% FS)
1.0%
2.5%+0.25%
0.1%
0.1% + 1 LSD
0 to ± 3.3x10⁷
0 to ±3.3x10⁷
0.55%+0.005%
2.5%+0.25%
0.1%
0.1% + 1 LSD
0 to ± 3.3x10⁷
0 to ±3.3x10⁷
kWh, kVARh @ Unity PF ‡
IEC 0.5 Class @ 25°C
–
0.1% of
reading
–
0 to ± 1038
–
kWh, kVARh @ ±0.5 PF ‡
IEC 0.5 Class @ 25°C
–
0.1% of
reading
–
0 to ± 1038
–
Harmonics (to 63rd)
1% Full Scale
–
0.1%
–
0.0001 to 100.00
–
K Factor
5% Full Scale
–
0.1%
–
0 to 1x10⁶
–
Power Factor @ Unity PF
0.55%+0.025%
3.5%+0.35%
0.01%
1%
-0.01 to –100.00,
100.00 to 0.01
-0 to 100 to 0
Power Factor @
.5 Lag & .5 Lead
0.75%+0.025%
6.0%+0.6%
0.01%
1%
-0.01 to –100.00,
100.00 to 0.01
-0 to 100 to 0
Symmetrical
Components
1% Full Scale
–
0.1%
–
Magnitude:
0 to 1x10⁶
Phase:
-180° to 180°
–
Current (5% to 125% FS)
kVA (<5% FS)
kVAR (5% to 125% FS)
0 to
* Resolutions given are from the MGT. Higher resolution can be obtained via communications.
‡ kWh Accuracy Specification meets or exceeds IEC 687 Class 0.5
† LSD = least significant digit
±
32:(50(7(586(5¶6*8,'(
kW Measurement Accuracy
The graphs below indicate the accuracy of the 9700 Power Meter’s kW
measurements at 25°C at Power Factor values of 1.0, 0.5 lead and 0.5 lag.
The graphs also compare 9700 Power Meter accuracy with the IEC 687 Class
0.5 specification.
Accuracy of kW Readings @ Unity PF @ 25°C
'%98-32
1.0
7700 ION Accuracy
0.9
IEC 687 Class 0.5
0.8
Increased Accuracy
0.7
% Reading
If the voltage on Phase A
drops to 20% or lower of
the rated nominal value,
frequency detection will not
function and measurement
accuracy will be impaired.
0.6
0.5
0.4
0.3
0.2
0.1
0.0
1
25
5
50
75
100
125
% Full Scale of Rated Load
Accuracy of kW Readings @ ± 0.5 PF @ 25°C
1.0
7700 ION Accuracy
0.9
IEC 687 Class 0.5
0.8
Increased Accuracy
% Reading
0.7
0.6
0.5
0.4
0.3
0.2
0.1
0.0
1
10
25
50
75
100
125
% Full Scale of Rated Load
7(&+1,&$/5()(5(1&(
±
High-Speed Measurements During Fault
(@125% to 2000% of Rated Input, 6.25 A to 100 A)
Parameter
Accuracy
±(%reading)
MGT Resolution
(%FS)
Range
Current (I1, I2 and I3 only)
5%
0.1%
0 to 106
kVA
5%
0.1%
0 to 3.3x10⁷
kW, kVAR @ Unity PF
5%
0.1%
0 to ± 3.3x10⁷
kW, kVAR @ 50 Lag and 50
Lead
5%
0.1%
0 to ± 3.3x10⁷
Power Factor @ Unity PF
10%
0.01%
-0.01 to -100.00, 100.00 to 0.01
Power Factor @ 0.5 Lag
and 0.5 Lead
10%
0.01%
-0.01 to -100.00, 100.00 to 0.01
Input Ratings
Input
Options
Specifications
Voltage
Inputs
-120 option:
120 VAC nominal F.S. input, 25% overrange. Barrier strip connector rated to 600 Volts line-to-line.
-277 option:
277 VAC nominal F.S. input, 25% overrange. Barrier strip connector rated to 600 Volts line-to-line.
-347 option:
347 VAC nominal F.S. input, 25% overrange. Barrier strip connector rated to 600 Volts line-to-line.
Overload withstand for all options: 1500 VAC continuous, 2500 VAC for 1 second, non-recurring
Input impedance for all options: 2 MΩ
Current
Inputs
Standard
5 Amp nominal F.S. input, 25% overrange
20x fault capture capability
Worst Case Burden (@ 6.25 Amps): 0.0625 VA
Overload withstand for all options: 15 Amps continuous, 300 Amps for 1 second non-recurring
Input Impedance: 2 mΩ
1 Amp Option
Onboard Digital Inputs
1 Amp AC Nominal F.S. input, 25% overrange
Standard self-excited, dry contact sensing, no external voltage source required.
+30 VDC differential SCOM output to S1 through S8 inputs.
Minimum Pulse Width: 1 msec, Maximum Pulse Rate: 20 pulses / sec.
Optional
Onboard
Analog
Inputs
0-1mA Option
1 mA AC/DC nominal full scale input (1.25 mA AC/DC max.)
Overload withstand: 50mA continuous, 100mA for 1 second non-recurring
Input Impedance 49.9kΩ
Accuracy: AC: ±0.25% F.S.; DC: ±(0.25% F.S. + 0.1% per Vcm*) total error
Maximum Common Mode: 8 V
* Vcm = Common mode voltage
±
32:(50(7(586(5¶6*8,'(
Input Ratings, continued
Optional
Onboard
Analog
Inputs
continued
0-20 mA
Option
20 mA AC/DC nominal full scale input (25 mA AC/DC max.)
Overload withstand: 35mA continuous, 70mA for 1 second non-recurring
Input Impedance 100Ω
Accuracy: AC: ±0.25% F.S.; DC: ±(0.25% F.S. + 0.1% per Vcm*) total error
Maximum Common Mode: 20 V
0-1 V Option
1.0 VAC/VDC nominal full scale input (1.25 VAC/VDC max.)
Overload withstand: 20 VAC/VDC continuous, 40 VAC/VDC for 1 second non-recurring
Input Impedance 49.9 kΩ
Accuracy:
AC: 60.25% F.S.
DC:6(0.25% F.S. + 0.13% per Vcm*) total error
Maximum Common Mode: 12 V
0-10 V Option
10.0 VAC/VDC nominal full scale input (12.5 VAC/VDC max.)
Overload withstand: 20 VAC/VDC continuous, 40 VAC/VDC for 1 second non-recurring
Input Impedance 49.9 kΩ
Accuracy: AC: ±0.25% F.S.; DC: ±(0.25% F.S. + 0.025% per Vcm) total error
Maximum Common Mode: 25 V
Power
Supply*
Standard
85-240VAC (47-440 Hz) or 110-300VDC, 1 Amp worst case loading (56 W) @ 100 VAC @ 25°C
-P24/ 48
option
20-60VDC @ 30 W worst case
Power supply fuse current rating, type and rupturing speed: 3 A slow blow
* Power supply ratings apply to both 9700 Power Meter and the external output boards.
7(&+1,&$/5()(5(1&(
±
Optional Input/Output Modules
Analog Input Modules
Voltage Inputs
±
Current
Inputs
Part Number
GAIVDC1
GAIVDC5
GAIVDC5B
GAIVDC10
GAIVDC10B
GAIIDC420
5DQJH
0 to 1 VDC
0 to 5 VDC
-5 to 5 VDC
0 to 10 VDC
-10 to 10 VDC
4 to 20 mA
5HVROXWLRQ
244.1 µV
1.22 mV
2.44 mV
2.44 mV
4.88 mV
3.91 µA
,QSXW,PSHGDQFH
1 MΩ
1 MΩ
1 MΩ
1 MΩ
1 MΩ
133 Ω
Isolation (Input to
Output):
2500 Vrms
Accuracy @ 25°C:
± 0.2%
Offset Drift:
± 50 ppm/°C
Gain Drift:
± 55 ppm/°C
Operating Temperature
Range:
0°C to 60°C
Storage Temperature
Range:
-25°C to 85°C
32:(50(7(586(5¶6*8,'(
Analog Output Modules
Voltage Outputs
Current Outputs
Part Number
GAOVDC5
GAOVDC5B
GAOVDC10
GAOVDC10B
GAOIDC420
Range
0 to 5 VDC
-5 to 5 VDC
0 to 10 VDC
-10 to 10 VDC
4 to 20 mA
Resolution
1.22 mV
2.44 mV
2.44 mV
4.88 mV
3.9 µA
Sourcing Capability
20 mA
max.@ 5 VDC
10 mA
max.@ 5 VDC
10 mA
max.@ 10
VDC
10 mA max.@
10 VDC
20 mA max.@ 330 Ω
max. loop resistance
Isolation (Input to Output):
2500 Vrms
Accuracy @ 25°C:
±0.6% range
Offset Drift:
±45 ppm/°C
Gain Drift:
±150 ppm/°C
Short Circuit Protection:
Output signal can be shorted to ground without damaging the module
Operating Temperature
Range:
0°C to 60°C
Storage Temperature Range:
-25°C to 85°C
Digital Input Modules
AC Inputs
DC Inputs
Part Number
GDIAC120
GDIAC240
GDIDC32
GDIDC32H
(High Speed)
Nominal Input Voltage:
120 VAC
240 VAC
32 VDC
32 VDC
Input Voltage Range:
90 to 140 VAC/VDC
180 to 280 VAC/VDC
3 to 32 VDC
3 to 32 VDC
Input Current @ Max Input
Voltage:
8 mA rms
6 mA rms
18 mA
18 mA
Nominal Input Resistance:
22 kΩ
60 kΩ
1.8 kΩ
1.8 kΩ
Pick Up Voltage:
> 90 VAC
> 180 VAC
> 3 VDC
> 3 VDC
Drop Out Voltage:
< 25 VAC
< 50 VAC
< 1 VDC
< 1 VDC
Turn-on Time
20 msec max.
20 msec max.
0.20 msec max.
0.050 msec max.
Turn-off Time
20 msec max.
20 msec max.
0.40 msec max.
0.075 msec max.
Optical Isolation (Input to
Output):
4000 VAC rms
Operating Temperature Range:
-40°C to 100°C
Storage Temperature Range:
-40°C to 125°C
Standards & Certification:
UL File # E58632, CSA File # LR38763, TUV Certificate #R9474066
Transient Protection:
Meets ANSI/IEEE C37.90-1989 Surge Withstand Capability Test
7700 Scan Time:
1 msec maximum, 5 msec minimum, max pulse rate = 20 pps
7(&+1,&$/5()(5(1&(
±
Digital Input Dry Contact Modules
Part Number
GDICC
Isolation, Input to Output
2500 VAC rms
Storage Temperature Range
-40°C to 125 °C
Operating Temperature Range
0°C to 60°C
Maximum Dry Contact Voltage
Rating
25 VDC
Minimum Dry Contact Current
Rating
5 mA
Maximum Turn-on Time
3.0 msec
Minimum Turn-off Time
3.0 msec
Standards and Certification:
UL File # E58632, CSA File # LR38763
Transient Protection:
Meets ANSI 37.90-1989 Surge Withstand Capability
Test
Thermocouple Input Modules
Thermocouple Type
Type J
Type K
Type R
Type T
Part Number
GAITCJ
GAITCK
GAITCR
GAITCT
Input Range
0 to 700°C
-100 to 924°C
0 to 960°C
-200 to 224°C
Resolution
0.18°C
0.25°C
0.23°C
0.10°C
Isolation (Input to Output):
2500 Vrms
Accuracy @ 25°C:
± 3°C
Offset Drift:
± 100 ppm/°C
Gain Drift:
± 55 ppm/°C
Operating Temperature Range:
0°C to 60°C
Storage Temperature Range:
-25°C to 85°C
RTD Input Modules
±
Part Number
GAIRTD
Input Range:
-50°C to 350°C
Resolution:
0.10°C
Accuracy, Across Range @ 25°C:
± 0.8°C
Isolation:
2500 VRMS
Operating Temperature Range:
0°C to 60°C
Storage Temperature Range:
-25°C to 85°C
32:(50(7(586(5¶6*8,'(
Digital Output Modules
Zero Voltage Turn-On, Normally Open, Manual Override Output Modules
AC Outputs
DC Outputs
Part Number
GDOAC120MO
GDOAC240MO
GDODC60MO
Nominal Line Voltage:
120 VAC
240 VAC
N/A
Frequency Range:
25 Hz to 70 Hz
25 Hz to 70 Hz
N/A
Maximum Line Voltage:
N/A
N/A
60 VDC
Clamping Voltage:
N/A
N/A
80 VDC max.
Maximum Off-state
Leakage
2 mA rms @ 60Hz
4 mA rms @ 60Hz
1.5 mA @ 60 VDC
Load Voltage Range:
24 to 140 VAC
24 to 280 VAC
3 to 60 VDC
Turn-on Time (60 Hz):
8.3 msec max.
8.3 msec max.
20 µsec max.
Turn-off Time (60 Hz):
8.3 msec max.
8.3 msec max.
50 µsec max.
Maximum Surge Current
(peak):
80 Amps @ 60 Hz, 1 cycle; 25
Amps @ 60 Hz, 60 cycles
80 Amps @ 60 Hz, 1 cycle; 25
Amps @ 60 Hz, 60 cycles
5 Amp for 1 second
Load Current Range (rms):
0.03 to 3.5 Amps
On-state Voltage Drop
(peak):
1.5 Volts max.
Power Dissipation:
1.0 Watt/Amp typical
Optical Isolation(Input to
Output):
4000 VAC rms
Operating Temperature
Range:
-40°C to +100°C
Storage Temperature
Range:
-40°C to +125°C
Standards and Certification:
UL File # E58632, CSA File # LR38763
Transient Protection:
Meets ANSI 37.90-1989 Surge Withstand Capability Test
7(&+1,&$/5()(5(1&(
±
Normally Open, Solid State Relays
AC Outputs (Zero Voltage Turn
On)
DC Outputs
Part Number
GDOAC120
GDOAC240
GDODC60
GDODC200
GDODC60L
(Low Leakage)
Nominal Line Voltage:
120 VAC
240 VAC
N/A
N/A
N/A
Load Power Factor:
0.4 min.
0.4 min.
N/A
N/A
N/A
Frequency Range:
25 Hz to 70 Hz
25 Hz to 70 Hz
N/A
N/A
N/A
Maximum Line Voltage:
N/A
N/A
60 VDC
200 VDC
60 VDC
Maximum Off-state Leakage
@ 60Hz (AC) or @ 60 VDC
(DC):
2 mA rms
4 mA rms
1.5 mA
0.01 mA
0.01 mA
Load Voltage Range:
24 to 140 VAC
24 to 280 VAC
3 to 60 VDC
4 to 200 VDC
3 to 60 VDC
On-state Voltage Drop:
1.5 Volts max.
1.5 Volts max.
1.2 Volts max.
1.75 Volts max.
1.2 Volts max.
Clamping Voltage:
N/A
N/A
80 VDC max.
360 VDC max.
80 VDC max.
Power Dissipation:
1.0 Watt/Amp
typ.
1.0 Watt/Amp
typ.
1.0 Watt/Amp
typ.
1.5 Watt/Amp
typ.
1.0 Watt/Amp
typ.
Load Current Range (RMS):
0.03 to 3.5 A
0.03 to 3.5 A
0.02 to 3.5 A
0.02 to 1.0 A
0.02 to 3.5 A
Turn-on Time:
8.3 msec max. @
60Hz
8.3 msec max.@
60Hz
20 µsec max.
75 µsec max.
75 µsec max.
Turn-off Time:
8.3 msec max. @
60Hz
8.3 msec max.@
60Hz
50 µsec max.
750 µsec max.
500 µsec max.
Surge Current (peak):
80 Amps @ 60
Hz, 1 cycle; 25
Amps @ 60 Hz,
60 cycles
80 Amps @ 60
Hz, 1 cycle; 25
Amps @ 60 Hz,
60 cycles
5 Amps
maximum for 1
second
5 Amps
maximum for 1
second
5 Amps
maximum for 1
second
Transient Power Dissipation:
N/A
N/A
400 Watts @ 1 msec non-recurring
Optical Isolation
(Input to Output):
4000 VAC rms
Operating Temperature
Range:
-40°C to +100°C
Storage Temperature Range:
-40°C to +125°C
Standards and Certification:
UL File # E58632, CSA File # LR38763
Transient Protection:
Meets ANSI 37.90-1989 Surge Withstand Capability Test
±
32:(50(7(586(5¶6*8,'(
Mechanical Relays
Part Number
GDODC100M
Maximum Line Voltage:
100 VDC/120 VAC maximum
Contact Rating:
10 Watts maximum
Switching Current:
0.5 A dc maximum. Inductive loads require diode suppression.
Carrying Current:
1.0 A maximum. Inductive loads require diode suppression.
Contact Resistance:
250 mΩ maximum
Turn-on Time:
1.0 msec maximum
Turn-off Time:
1.0 msec maximum
Off-state Leakage Current:
2 µA maximum @ 60Hz
Dielectric Isolation (Input to
Output):
1500 VAC rms
Operating Temperature Range:
-20°C to +85°C
Storage Temperature Range:
-40°C to +125°C
Transient Protection:
Meets ANSI 37.90-1989 Surge Withstand Capability Test
Additional Specifications
Operating Temp:
Storage Temp:
Humidity:
0°C to +50°C (+32°F to +122°F) ambient air.
(for TRAN model: -20°C to +50°C (-4°F to +122°F))
-30°C to +70°C (-22°F to +158°F)
5% to 95% non-condensing
Compatible AT Commands
The following AT commands are supported by the 9700 Power Meter –
MDM.
ATBn
ATSn
Select CCITT or BELL Mode
ATB0
CCITT Mode
ATB1
BELL Mode (default)
Read/Write S-Register
ATSn=v
7(&+1,&$/5()(5(1&(
Sets S-Register n to the value v
±
AT&Fn Restore Factory Configuration (Profile)
AT&F0
Restore factory configuration 0
AT&F1
Restore factory configuration 1
AT&GnSelect Guard Tone
AT&G0
Disables guard tone (default)
AT&G1
Disables guard tone
AT&G2
Selects 1800 Hz guard tone
AT%Cn Enable/Disable Data Compression
AT%C0
Disables data decompression
AT%C1
Enables MNP 5 data compression negotiation
AT%C2
Enables V.42 bis data compression
AT%C3
Enables both V.42 bis and MNp 5 data
compression
AT%En En/Disable Line Quality Monitor & Auto-Retrain Or Fallback/Fall Fwd
AT%E0
Disable line quality monitor and auto-retrain
AT%E1
Enable line quality monitor and auto-retrain
AT%E2
Enable line quality monitor and fallback/fall forward
AT\Nn Operating Mode
±
AT\N0
Normal speed buffered mode
AT\N1
Serial interface
AT\N2
Reliable (error-correction) mode
AT\N3
Auto reliable mode
AT\N4
LAPM error-correction mode
AT\N5
MNP error-correction mode
32:(50(7(586(5¶6*8,'(
AT+MSCommands Select Modulation
Selects the modulation; enables or disables auto-mode; specifies the lowest
and highest connection rates; selects m-Law or A-Law codec type, and
enables or disables robbed bit signaling generation (server modem) or
detection (client modem)
+MS= <Mod> [,[<Automode>] [,[<Min_Rate>] [,[<Max_Rate>] [,[<X_Law>]
[,[< Rb_Signaling>]]]]]] <CR>
%817!#
options
Send a string of info. to the DTE consisting of supported
<mod>
Modulation
Possible Rates (bps)
0
V.21
300
1
V.22
1200
2
V.22 bis
2400, 1200
3
V.23
1200
9
V.32
9600, 4800
10
V.32 bis
14400, 12000, 9600, 7200, 4800
11
V.34
33600, 31200, 28800, 26400, 24000, 21600, 19200
16800, 14400, 12000, 9600, 7200, 4800, 2400
64
Bell103
300
69
Bell212
1200
AT\An Select Maximum MNP Block Size
7(&+1,&$/5()(5(1&(
AT
String
Block Size
AT\A0
64 characters
AT\A1
128 characters (Default)
AT\A2
192 characters
AT\A3
256 characters
±
Standards Compliance
UL:
CSA:
International:
Surge Withstand:
FCC:
CE:
Quality Assurance:
±
Certified to UL 3111
Certified to CAN/CSA C22.2 No.1010-1
IEC 1010-1
Registered under CB Scheme to EN61010-1
Measuring inputs comply with Installation Category III
Power supply inputs comply with Installation Category II
All inputs pass ANSI/IEEE C37.90-1989 surge withstand
and fast transient tests
Part 15 of FCC Rules for a Class A Digital Device
approved
ISO 9002 certified by QMI
32:(50(7(586(5¶6*8,'(
Ordering Information
Basic Model
9700 Power Meter
With 85 - 240 VAC / 110 - 300 VDC power supply, MGT with
10 ft. (3.0 m) cable, a single optically isolated
RS232C/RS485 communications port and 512kB of onboard memory.
Revenue Metering Models
9700 Power Meter -RMICAN Meets Canadian revenue-metering standards (unsealed).
Rated for 0.1 to 10 Amp AC. With universal power supply,
MGT with 10 ft. (3.0 m) cable, 1024kB on-board memory,
and single optically isolated RS232/RS485 communications
card.
Approval #AE-0688.
9700 Power Meter -RMANSI
Accuracy meets ANSI C12.16 revenue-metering standard
(unsealed). Rated for 0.1 to 10 Amp AC. With universal
power supply, 1024kB on-board memory, MGT with 10 ft.
(3.0 m) cable, and optically isolated RS232/RS485
communications card.
Meter Options (must be WTIGMJMIH[MXL4S[IV1IXIV when ordering)
-RM
-120
-277
-347
-50Hz
-60Hz
-1Amp
-P24/48
-TROP
-TRAN
-XMEM
-XPRESS
-RMSEAL
-RMKEY
Revenue security enabled, 5 Amp current inputs.
For 69/120, 120/208, or 120/240 (single phase) Volts systems
For 240/416, or 277/480 Volts systems
For 347/600 Volts systems
For 50 Hz systems
For 60 Hz systems
1.0 Amp nominal full scale current inputs
20 to 60 VDC power supply (instead of
85 to 240 VAC / 110 to 300 VDC)
Tropicalization (conformal coating) treatment
No Modular Graphics Terminal (MGT)
Additional 512kB of NVRAM
Basic XPRESS card with two RS-485 ports and one
10BaseT Ethernet port
Factory-sealed meter (for RMICAN meters only).
Contact factory for RMSEAL checklist.
Hardware key for programming unsealed revenue
metering units.
Xpress Card Options
-FIBER
-1MEG
-2MEG
-3MEG
7(&+1,&$/5()(5(1&(
10BaseFL Ethernet port
Extra 1 MB of memory
Extra 2 MB of memory
Extra 3 MB of memory
±
Display
MGT
-50ft
-200ft
Modular Graphics Terminal with 10 ft. cable
(for ordering MGT separately)
50 ft. cable instead of 10 ft. cable
200 ft. cable instead of 10 ft. cable
Internal Analog Input Options
(Use separate line item on Purchase Order)
Auxiliary Analog Inputs Board
AUX 1mA
AUX 20mA
AUX 1V
AUX 10V
0 to 1mA Auxiliary Analog Input
0 to 20mA Auxiliary Analog Input
0 to 1VAC/VDC Auxiliary Analog Input
0 to 10VAC/VDC Auxiliary Analog Input
Note: All four on-board Analog Inputs must have the same range.
External Input/Output Expansion Options
(Use separate line item on Purchase Order)
IOCA
IOCB
-P24/48
I/O card for I/O Port A with ribbon cable (3 feet)
I/O card for I/O Port B with ribbon cable (3 feet), and
universal power supply (see power supply specifications) .
This option should be used for specifying a second I/O
board or a board that will be populated with more than 6
analog devices.
Power Supply Option for IOCA or IOCB
Analog Input Devices
GAIVDC1
GAIVDC5
GAIVDC5B
GAIVDC10
GAIVDC10B
GAIIDC420
0 to 1 VDC Analog Input Device
0 to 5 VDC Analog Input Device
-5 to 5 VDC Analog Input Device
0 to 10 VDC Analog Input Device
-10 to 10 VDC Analog Input Device
4 to 20 mA Analog Input Device
Thermocouple Devices
GAITCR
GAITCT
GAITCJ
GAITCK
GAIRTD
±
Type R
Type T
Type J
Type K
RTD
32:(50(7(586(5¶6*8,'(
Analog Output Devices
GAOVDC5
GAOVDC5B
GAOVDC10
GAOVDC10B
GAOIDC420
0 to 5 VDC Analog Output Device
-5 to 5 VDC Analog Output Device
0 to 10 VDC Analog Output Device
-10 to 10 VDC Analog Output Device
4 to 20 mA Analog Output Device
Digital Input Devices
GDIAC120
GDIAC240
GDIDC32
GDIDC32H
GDICC
120 VAC Digital Input Device
240 VAC Digital Input Device
32 VDC Digital Input Device
32 VDC High Speed Digital Input Device
Dry Contact Module
Digital Output Devices
GDOAC120
GDOAC120MO
GDOAC240
GDOAC240MO
GDODC60
GDODC60MO
GDODC200
GDODC60L
GDODC100M
120 VAC, 3.5A, N.O. Solid State Relay
120 VAC, 3.5A, Zero Voltage Turn On With Manual
Override
240 VAC, 3.5A, N.O. Solid State Relay
240 VAC, 3.5A, Zero Voltage Turn On With Manual
Override
60 VDC, 3.5A, N.O. Solid State Relay
60 VDC, 3.5A, Zero Voltage Turn On With Manual Override
200 VDC, 1.0A, N.O. Solid State Relay
60 VDC, 3.5A, Low Leakage, N.O. Solid Relay
100 VDC, 0.5A, N.O. Mechanical Relay
Ordering Example
This example specifies a 9700 Power Meter for a 347/600 Volts, 60 Hz
system. It includes an I/O card A with 60 VDC power supply, an I/O card B
with 60 VDC power supply, six 0 to 1 VDC Analog Input Devices, six 4 to 20
mA Analog Output Devices, eight 120VAC Digital Input Devices, and four
120VAC Digital Output Devices:
7(&+1,&$/5()(5(1&(
1
9700 Power Meter -347 -60Hz
1
IOCA -P24/48
1
IOCB -P24/48
6
GAIVDC1
6
GAOIDC420
8
GDIAC120
4
GDOAC120
±
External Output Device Part Number Summary
The following table summarizes the manufacturer’s part numbers for
external devices used with the 9700 Power Meter.
ORDERING OPTION
DESCRIPTION
MANF. PART #
Digital AC Outputs
GDOAC120
120 VAC, 3.5A, N.O. Solid State Relay
70G-OAC5
GDOAC120MO
120 VAC, 3.5A, N.O. Zero Voltage Turn-on, Manual
70G-OAC5MA
GDOAC240
240 VAC, 3.5A, N.O. Solid State Relay
70G-OAC5A
GDOAC240MO
240 VAC, 3.5A, N.O. Zero Voltage Turn-on, Manual
70G-OAC5AMA
GDODC60
60 VDC, 3.5 A, N.O. Solid State Relay
70G-ODC5
GDODC60L
60 VDC, 1.0 A, Low Leakage, N.O. Solid Relay
70G-ODC5B
GDODC60MO
60 VDC, 3.5 mA, Manual Override
70G-ODC5MA
GDODC200
200 VDC, 1.0A, N.O. Solid State Relay
70G-ODC5A
GDODC100M
100 VDC, 0.5A, N.O. Mechanical Relay
70G-ODC5R
GDIAC120
120 VAC Digital Input Device
70G-IAC5
GDIAC240
240 VAC Digital Input Device
70G-IAC5A
GDIDC32
32 VDC Digital Input Device
70G-IDC5
GDIDC32H
32 VDC High Speed Digital Input Device
70G-IDC5B
Dry Contact Digital Input Device
70G-IDC5S
GAOVDC5
0 to 5 VDC Analog Output Device
73G-OV5
GAOVDC5B
-5 to 5 VDC Analog Output Device
73G-OV5B
GAOVDC10
0 to 10 VDC Analog Output Device
73G-OV10
Digital DC Outputs
Digital AC Inputs
Digital DC Inputs
Dry Contact Inputs
GDICC
Analog Outputs
GAOVDC10B
-10 to 10 VDC Analog Output Device
73G-OV10B
GAOIDC420
4 to 20 mA Analog Output Device
73G-OI420
GAIVDC1
0 to 1 VDC Analog Input Device
73G-IV1
GAIVDC5
0 to 5 VDC Analog Input Device
73G-IV5
GAIVDC5B
-5 to 5 VDC Analog Input Device
73G-IV5B
GAIVDC10
0 to 10 VDC Analog Input Device
73G-IV10
Analog Inputs
GAIVDC10B
-10 to 10 VDC Analog Input Device
73G-IV10B
GAIIDC420
4 to 20 mA Analog Input Device
73G-II420
Thermocouple Units
±
GAITCJ
Type J Thermocouple Input Device
73G-ITCJ
GAITCK
Type K Thermocouple Input Device
73G-ITCK
GAITCR
Type R Thermocouple Input Device
73G-ITCR
GAITCT
Type T Thermocouple Input Device
73G-ITCT
GAIRTD
100 Ohm Platinum RTD Input Device
73G-ITR100
32:(50(7(586(5¶6*8,'(
Warranty
Siemens Energy & Automation, Inc. warrants that all equipment purchased
hereunder is warranted on a “RETURN TO FACTORY” basis against all
defects in workmanship and materials under normal and proper use and
service in its unmodified condition for a period of one (1) year from the data
of initial shipment. Siemens Energy & Automation, Inc.’s sole obligation
under this warranty shall be limited to furnishing parts and labor to remedy
such defects; either, at the option of Siemens Energy & Automation, Inc., by
replacing or repairing any defective parts which are returned to Siemens
Energy & Automation, Inc. factory or by making available at a Purchaser
designated facility a repaired or replaced part. All replaced equipment shall
become the property of Siemens Energy & Automation, Inc. The cost of
freight to and from Siemens Energy & Automation, Inc. Siemens Energy &
Automation, Inc. will be borne by the Purchaser. If Siemens Energy &
Automation, Inc. determines that the equipment returned to it for warranty
correction is not defective, as herein defined, Purchaser shall pay Siemens
Energy & Automation, Inc., all costs of service, parts, handling and
transportation.
Product Return Procedure
Contact Siemens Energy & Automation Customer Service at 800-427-2256
for information on the product return procedure.
7(&+1,&$/5()(5(1&(
±
±
32:(50(7(586(5¶6*8,'(
I
Index
9
9000 Series
’Not Available’ Value, 4-4
Module Linking, 4-3
Module Linking Restrictions, 4-3
Online and Offline Modules, 4-4
Overview of Module Groups,
4-14
The Registers, 4-3
9000 series module, 4-2
A
advanced features of the 9700, 4–1
advanced meter setup (RMD), 3-9
analog output modules, 5–17
architecture, 3-2
auxiliary analog inputs, 4–17, 4–20
B
bar graph displays (MGT), 2-4, 4–40
before you use this guide, 1-5
C
common applications, 1-1
communications options, new, 1-2
configuration changes, making,
3–1, 3–4
configuration tools, 3–2
D
data display screens (MGT), 2-2
data/time display (MGT), 2-7
demand setup (MGT), 3–9
digital inputs
framework, 2-19
displaying data, 2-1
with MGT, 2-2
DNP 3.0 protocol, 4–27
factory configuration, 4–27
importing data, 4–30
Options module settings, 4–29
Slave Export module settings,
4–28
dry contact modules (optional),
5–18
E
energy and demand
framework, 2-8
Ethergate
protocol, 4–30
Ethernet COM setup (MGT), 3–9
expansion boards and restrictions, 4–18
F
factory configuration, 1-2
factory configured frameworks, 2-8
digital inputs, 2-19
energy and demand, 2-8
harmonics logging, 2-15
historic data logging, 2-13
min/max, 2-10
power quality monitoring, 2-16
real-time (core modules), 2-20
setpoint, 2-18
frameworks. See also factory configured
G
getting more information, 1-5
GPS receivers supported, 4–36
GPS time synchronization, 4–34
Grayhill board. See expansion boards
H
harmonics
logging framework, 2-15
MGT displays, 2-5
MGT screens, 4–44
historic data logging
framework, 2-13
I
input ratings, 5–14
Input/Output, 1-4, 4–16
auxiliary analog inputs, 4–17, 4-20
expansion boards, 4–18
new options, 1-2
onboard status inputs, 4–16
optional modules, 5–16
inputs, module, 3–3
integrator screens (MGT), 4–49
INVLD and N/A messages, 2-3
I-1
M
measurements, preconfigured, 2-8
Modicon Modbus protocol, 4–21
factory configuration, 4–21
importing data, 4–26
module settings, 4–22
Slave module parameters, 4–23
Modular Graphics Terminal, 2-2,
3–4
bar graph screens, 2-4, 4–40
4-channel, 4–40
6-channel, 4–42
buttons, 3–5
Configure ION, 3–11
creating custom displays, 4–37
data display screens, 2-2
entering data, 3–6
harmonics displays, 2-5, 4–44
integrator screens, 4–49
interpreting numeric displays,
2-3
INVLD and N/A messages, 2-3
large character screens, 4–40
parameter reset, 3–9
energy, 3–10
min/max, 3–10
sliding window demand, 3–10
status counter, 3–10
thermal demand, 3–10
parameter trending screens, 4–45
passwords and timeout, 3–7
Quick Setup, 3–7
SETUP display screens, 2-6, 3–4
date/time display, 2-7
nameplate info, 2-6
standard character screens, 4–39
status display screens, 4–46
7 and 14, 4–47
large, 4–46
trend displays, 2-5
using display formats, 4–38
waveform display screens, 4–48
modules, 3-3
specifying a port, 4–20
technical summary, 5–2
modules, optional
analog output, 5–17
digital input, 5–17
digital input dry contact, 5–18
digital output, 5–19
RTD input, 5–18
I-2
N
N/A messages (MGT), 2-3
nameplate info. (MGT), 2-6
O
operator types, 1-4
ordering information, 5–25
outputs, Module, 3–3
owners, output registers, 4–14
P
parameter handles (MGT), 4–38
parameter trending (MGT), 4–45
passwords and timeout (MGT), 3–7
ports, specifying, 4–20
Power Meter module, accessing (RMD),
3–8
power quality framework, 2-16
product return procedure, 5–29
protocols, communications, 3–8
PT/CT setup (MGT), 3–8
Q
Quick Setup (MGT), 3–7
R
Registers, 3-3
S
security passwords (RMD), 3-6, 3-10
serial COM setup (MGT), 3–8
setpoints
framework, 2-28
SETUP display screens (MGT), 2-6
setup register creation defaults, 5–2
setup register, Module, 3–3
standards compliance, 5–24
status display screens (MGT), 4–46
status inputs, 4–16
32:(50(7(586(5¶6*8,'(
T
technical reference, 5–1
additional specifications, 5–21
external output device part no.
summary, 5–28
high-speed measurements, 5–14
input ratings, 5–14
module summary, 5–2
kW measurement accuracy, 5–13
measurements, 5–12
optional I/O modules, 5–16
setup register creation defaults,
5–2
standards compliance, 5–24
third-party protocols, 3–13
time synchronization, 4–34
diagnostics and event logging,
4–37
with GPS, 4–34, 4–36
transient module settings, 3–10
trend displays(MGT), 2-5
U
using this guide, 1-4
W
warranty, 5–29
waveform display screens (MGT),
4–48
WinPM
Configuring Existing Modules,
4-6
Creating New Modules, 4-5
Deleting Links, 4-12
Deleting Modules, 4-6
Linking Modules, 4-10
Making Configuration Changes,
4-4
X
XPress Card, 4–30
INDEX
I-3
Siemens Energy & Automation, Inc.
Power Management Technologies
3333 Old Milton Parkway
Alpharetta, GA 30005
For Nearest Sales Office
Siemens Energy & Automation, Inc.
Windows is a trademark and Microsoft is a registered
trademark of the Microsoft Corporation.
All others are of Siemens AG.
Siemens is a registered trademark of Siemens AG.
Specifications are subject to change without notice.
[[[WIEWMIQIRWGSQ
WEPIWWEPIWSJJMGILXQP
For More Information Visit
[[[WIEWMIQIRWGSQEGGIWW
Order No. XXIM-00108-0200
PDF 0200 Printed in the U.S.A.