1
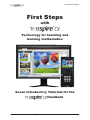
First Steps with TI-Nspire
™
First Steps
with
Technology for teaching and learning mathematics
Seven Introductory Tutorials for the
Handheld
© 2012 Texas Instruments Education Technology Page 1
First Steps with TI-Nspire
™
About this document
This document includes seven introductory tutorials to take new users through many key features of
TI-Nspire™ maths and science learning technology. This technology includes both handhelds and computer
software, providing teachers the flexibility to meet different classroom needs. However, the primary focus of
these tutorials is the handheld device. All activities are equally applicable to the computer software but screen
shots and key presses relate to the handheld.
About the tutorials
The tutorials are designed to be worked through in order, with later ones building on skills covered earlier.
The first time you meet a new technique, there are very detailed instructions about which keys to press –
but, as you would expect, the amount of detail is reduced when the technique is used subsequently.
In an Appendix you will find an example that links together several of the applications introduced separately in
the tutorials. As well as enabling you to revisit many of the techniques you met earlier, it provides an example
of the use of “multiple representations” of mathematical concepts.
References
In the tutorials you will find occasional references to documents that are supplied in electronic form with your
TI-Nspire handheld.
They are also available from http://education.ti.com/guides, choose TI-Nspire technology.
They are:
• Getting Started with the TI-Nspire™ CX / TI-Nspire™ CX CAS Handheld
• TI-Nspire™ Reference Guide
• TI-Nspire™ Technology Version 3.0 Release Notes
Key features of TI-Nspire™
• Multiple representations, dynamically linked, encouraging different approaches to solving problems and
expressing solutions.
• A complete set of mathematical tools for algebra, geometry, number, calculus, statistics, matrices and
vectors, finance and real-world data logging.
• Working documents which can be saved, recalled, edited, transferred between handheld and computer and
distributed electronically.
• A tool for key concept and key skill development across all the secondary school years.
First edition, November 2007.
Second edition, February 2008.
Third edition, August 2008.
Fourth edition, June 2010.
Fifth edition, September 2011.
Sixth edition, January 2012.
Page 2
© 2012 Texas Instruments Education Technology
First Steps with TI-Nspire
™
Contents
TI-Nspire Keypad Layout................................................................................................... Page 5
Tutorial 1........................................................................................................................... Page 6
TI-Nspire Documents: basic ideas
•
•
•
•
•
•
•
•
•
Memory
Battery Life
Documents, problems, pages, applications and home screen
Use of / key and keyboard shortcuts
Home Screen
Scratchpad
Document Browser to navigate around documents and folders
Page Sorter to navigate inside documents
Different menus in different contexts
• The Document menu
Tutorial 2......................................................................................................................... Page 15
The Calculator application: arithmetic and algebra
•
•
•
•
•
•
•
Basic calculations
Standard layout of expressions
Recalling previous expressions and results
Approximate (decimals) and exact (fractions) evaluations
Templates and menus
Document settings
Defining and using variables
• Working with Statistical Distributions
Tutorial 3......................................................................................................................... Page 22
The Notes application
• Purposes of the application
• Page layouts with split screens
• Templates for the Notes menu
• Using Interactive Notes
• Creating Questions using the Teacher Software
Tutorial 4......................................................................................................................... Page 27
Graphing
•
•
•
•
•
•
•
•
•
•
The work area, entry line, function history
Entering, editing, deleting and hiding functions
Grabbing and dragging labels
Setting the axes
Tracing along graphs
Marking and labelling points and coordinates
Using the Analyse Graph Tools
Transforming graphs and their functions manually
Using Sliders
Sequence Plotting
© 2012 Texas Instruments Education Technology Page 3
First Steps with TI-Nspire
™
Tutorial 5......................................................................................................................... Page 35
Geometry
• The Plane Geometry and Graphing views
• Lines, segments and rays
• Construction of parallel lines
• Drawing and labelling points on objects
• Construction of shapes
• Selecting and grabbing screen objects
• Making measurements and storing as variables
• Attributes which change the appearance and lock screen objects
Tutorial 6......................................................................................................................... Page 41
Lists and Spreadsheet
•
•
•
•
•
•
Entering and editing data and formulas
Lists and functions
Resizing cells
Ambiguous variable/cell names
Capturing data from the Graphs & Geometry application
Function tables
• Frequency Chart
Tutorial 7......................................................................................................................... Page 46
One- and two-variable statistics
•
•
•
•
Creating one- and two-variable statistical plots in the Data & Statistics application
Using boxplots to compare data sets
Using categorical data for pie charts
Manually fitting straight lines to data
• Automatically fitting linear-regression lines to data
Appendix......................................................................................................................... Page 53
• Multiple Representations – an example
Page 4
© 2012 Texas Instruments Education Technology
First Steps with TI-Nspire
™
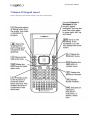
TI-Nspire CX Keypad Layout
Start by spending a few seconds looking at the layout of the keypad.
© 2012 Texas Instruments Education Technology Page 5
First Steps with TI-Nspire
Tutorial 1: TI-Nspire documents
™
Tutorial 1
TI-Nspire Documents
This first tutorial introduces some of the key features of TI-Nspire™ learning technology, in particular the
structure of TI-Nspire documents, with different applications operating on different pages. The various menus
are introduced, as well as creating and navigating around documents. The tutorial assumes that you are using
the TI-Nspire handheld device and the tutorial begins by drawing a comparison between this and other types
of technology.
Is it a calculator? Is it a computer? ….It’s a handheld device!
Pick up the TI-Nspire handheld device and, if you are used to using a calculator, particularly
a Texas Instruments TI-83 or TI-84 graphics calculator, you are likely to feel a certain reassuring familiarity:
there’s a screen and a keyboard laid out in a fairly familiar way. As with many calculators the on/off switch is in
the top right corner. So press c to switch on.
Nothing on the screen?
See Getting Started with the TI-Nspire Handheld, Recharging the Handheld
Please don’t worry about what’s on the screen for the moment, but think about how to switch it off. The c
key has “off” written in light blue above it so that’s the one to use after pressing the blue key marked /.
But just a minute, it was a key marked 2nd that you used on the calculators, and the change to the use of a ctrl
key is quite significant. The designers at TI have moved to making this device much more like a computer and
it has a ctrl key, /, and also a shift key g. Many of the main keys on the handheld have second functions
written in blue above the key and these are activated using the ctrl key. Notice for example q, p and h. The
ctrl key can be used in conjunction with the alphabetic keys to create keyboard shortcuts just as you are used to
doing on a computer. For example, you can copy and paste using /C and /V. There’s also that most useful
keyboard shortcut for undoing a previous action, /Z, which can also be activated by pressing /d(ª).
(See Getting Started guide, Using Keyboard Shortcuts for a full list).
Memory
Just like a computer, documents can be stored on the TI-Nspire CX handheld – The TI-Nspire™ CX handheld
comes equipped with 192 MB of memory Of the total memory, 128 MB is dedicated to document storage. As
documents are created and stored they take up space on the handheld’s memory so you may find that every
now and again you need to free space on memory after long-term use. If there isn’t enough memory on the
handheld, you can do one of the following:
• Back up documents and folders to a computer or another TI-Nspire CX
• Delete documents and folders you no longer use
• Reset the memory, which deletes all files and folders on the handheld
Page 6
© 2012 Texas Instruments Education Technology
First Steps with TI-Nspire
Tutorial 1: TI-Nspire documents
™
Battery Life
The TI-Nspire™ CX handheld comes with a rechargeable battery, which should be charged for at least six hours
before first use. The built-in rechargeable battery does not need to be removed from the handheld in order to
recharge it. The handheld will still work and can be used while it is charging.
With use of 2 hours per day at the default brightness level the battery should last for up to 10 days.
The handheld comes with the following cables:
• Standard mini-A to mini-B USB cable for transferring files between handhelds
• Standard A to mini-B USB cable for transferring files to and from a computer and for charging the battery via
the USB port
Charging the handheld
To charge the battery in the TI-Nspire™CX handheld:
• Connect the handheld to a computer using a standard A to mini-B USB cable. If the driver is not found when
the handheld is connected to the computer download the software that includes a driver from
http://education.ti.com/software.
OR
• Connect to a wall outlet using a TI wall adapter (sold separately).
OR
• Place the handheld or multiple handhelds in a TI-Nspire™ CX Docking Station.
© 2012 Texas Instruments Education Technology Page 7
First Steps with TI-Nspire
Tutorial 1: TI-Nspire documents
™
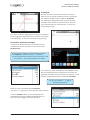
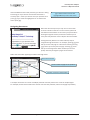
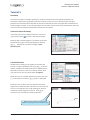
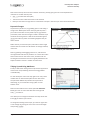
The Home Screen
When you switched on a calculator you expected to see
what was called the Home Screen and you’d be able to
start carrying out calculations right away. But the TI-Nspire
handheld is different in this respect too. Press c, the
home button, a black key at the top right of the keypad. You
should see a screen similar to this. Navigate to the various
icons on the Home Screen using the large square Touchpad
on the keypad. This behaves as both a touchpad (like using a
laptop), and as a navigational device as you can press on the
up, down, left and right arrows to move the selector around.
To click or select something you press the x square symbol in
the middle of the touchpad, or press the enter key. However
don’t select anything else yet!
Consider whether the TI-Nspire’s home screen is more reminiscent of a calculator or of a computer. When a
computer wakes up you first see the desktop and in many ways this TI-Nspire Home Screen is similar. With a
computer you have to choose an application to use -- a word-processor, spreadsheet or whatever. You then
must open a document within which you will be able to write text, do calculations, manipulate images etc.
Computer: Desktop Choose Application Open Document
In many ways working with TI-Nspire is similar. You always have to work within a document and you can use
different applications to calculate, draw graphs, , work with geometry, manipulate lists and spreadsheets, work
with data and statistics, add notes and perform data logging.
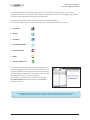
The TI-Nspire applications are:
• Calculator
• Graphs
• Geometry
• Lists & Spreadsheet
• Data & Statistics
• Notes
• Vernier DataQuest™
Page 8
© 2012 Texas Instruments Education Technology
First Steps with TI-Nspire
Tutorial 1: TI-Nspire documents
™
What is quite different from the computer is that within one document you can have multiple pages or
problems that can make use of the different applications. The spreadsheet on one page of a document can
interact seamlessly with calculations done on a calculator page and graphs drawn on another. You can also
have more than one different representation on one page.
This use of multiple representations is one of the many things that make the TI-Nspire such a powerful tool.
So with TI-Nspire you first open a document, or start a new one, and then choose an application.
TI-Nspire: Home screen New document Choose application
Tip: If you would like to return to the document you are working on without inserting
a new page, from the Home screen select option 4: Current.
You can do this by pressing 4 on the keypad.
© 2012 Texas Instruments Education Technology Page 9
First Steps with TI-Nspire
Tutorial 1: TI-Nspire documents
™
Scratchpad
Because there are some occasions when you really just
want to carry out a quick calculation or draw a quick graph
the TI-Nspire includes a feature called the Scratchpad.
The scratchpad is designed for those casual throw-away
calculations that need to be done from time to time, but
are not worth keeping in a full document. To access the
Scratchpad press ».
This opens a calculator page for performing quick calculations.
Pressing » again swaps between the calculator and a graph
scratchpad page. To close the Scratchpad simply press d.
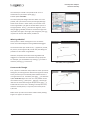
Documents, Problems and Pages
In order to see what documents are pre-loaded on your
handheld you need to use option 2 on the Home screen:
My Documents…
Either use the touchpad to move the selector down to
the 2: My Docs… option then press x to select it.
Or use the touchpad to move the cursor over option 2 and
x Or just press 2 key to select option the 2nd option.
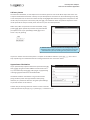
You should see a screen called the Document Browser and it
will be something like the one shown here. Documents are
organized into folders as they would be on a computer. A new
TI-Nspire handheld should have a folder called Examples:
Tip: You can use either x or · as
alternative key presses
Move the cursor to the folder entitled Examples.
Then press x or · or ¢ on the touchpad to open the folder.
Inside the Examples Folder on your handheld you will
probably find a document entitled ’Getting Started 3_0’.
Use ¤ to locate and · to open the document.
Page 10
© 2012 Texas Instruments Education Technology
First Steps with TI-Nspire
Tutorial 1: TI-Nspire documents
™
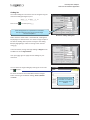
If the handheld has been used previously you will see a dialog
box asking you if you want to save the document that is
currently open. Unless you want to save your previous work
press e or ¢ to move the highlight to No. To confirm this
choice press ·.
e is often used to move to and
highlight different parts of the screen
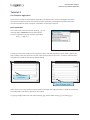
Navigating Documents
When the document opens you may see a screen similar
to the one shown on the left. For the moment, please do
not follow the instructions on the screen just yet! Continue
working through this tutorial, which will introduce you to
many of the key features of the TI-Nspire document model.
Among these key features are useful and easy ways to
navigate through documents. For example, pressing / ¢ will
take you to the next page in a document. Similarly, pressing
/¡ returns you to the previous page. Pressing /£ will
take you to the Page Sorter which enables you to move
quickly and easily through the pages of a document.
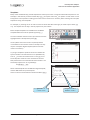
Notice the information typically provided on the Page Sorter:
Name of Document
Total number of pages in the problem
Number or Name of the Problem
A TI-Nspire document can consist of multiple problems and each problem can consist of multiple pages.
For example, the document shown here consists of at least two problems, with 5 and 9 pages respectively.
© 2012 Texas Instruments Education Technology Page 11
First Steps with TI-Nspire
Tutorial 1: TI-Nspire documents
™
Scroll downwards with the Touchpad and you will see all the problems in the document. If you move the
highlight onto Problem 2, say, and press ¡ the pages of that problem will close up. Pressing · or /¤ takes
you back to single page view on the page currently selected.
Each page of a document contains one (or more) of the TI-Nspire applications.
As a reminder, these are the same applications that can be accessed from the Home screen, i.e.:
• Calculator
• Graphs
• Geometry
• Lists & Spreadsheet
• Data & Statistics
• Notes
• Vernier DataQuest™
The use of each of the applications which you might want to
use for data logging is covered in the tutorials that follow. Any
page can be divided into as many as four work areas, allowing
up to four different applications to be used per page. To do this,
See ‘Splitting the Screen’ in Tutorial 3, page 23.
Shown here is a page that has been split into two with the
Lists & Spreadsheet application on the left, and the Notes
application beside it.
If the ‘Getting Started 3_0’ document is present on your handheld, work through it now as far
as page 2.5. This will allow you to revise what has been covered so far in this tutorial
Page 12
© 2012 Texas Instruments Education Technology
First Steps with TI-Nspire
Tutorial 1: TI-Nspire documents
™
Contextual Menus
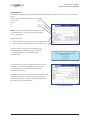
Return to the Home screen, and select 2: My Docs… to access
the document browser. Notice that within the document
browser new folders may be created or folders renamed.
Items that are grey, rather than black in a menu cannot be
chosen in the current environment. For example, on the
screen on the left, option 3: Save As… is unavailable.
Pressing d will always close
down a menu or dialog box.
To save a document under a new name press ~.
This opens a menu providing access to document management features. By pressing 1 and then 5 the
document can be saved under another filename.
© 2012 Texas Instruments Education Technology Page 13
First Steps with TI-Nspire
Tutorial 1: TI-Nspire documents
™
Then open a document in the browser and press b again. It
is important to realise that b will always provide access to
the features of the current environment. For example, within
the Notes application, this menu offers only the available
options for that application (as shown to the right).
There are a number of tools that are available for managing
documents when you choose the use the Document menu
by pressing the ~button. Several options are marked by
the symbol ¢ and pressing ¢ on the Touchpad opens their
submenus.
Within any application, this Document menu retains the same features but any options that are currently
unavailable are greyed out.
The next tutorial describes creating a new document and using a first TI-Nspire application.
Check list of some key points in Tutorial 1:
• Understanding, the terms document, problem, page, application, and home screen
• Use of the / key and keyboard shortcuts
• The Home Screen
• Scratchpad
• Memory
• Battery Life
• The Document Browser to navigate around documents and folders
• The Page Sorter to navigate inside documents
• The use of e and d
• Why b produces different menus in different contexts
• The Document menu
Page 14
© 2012 Texas Instruments Education Technology
First Steps with TI-Nspire
Tutorial 2: The Calculator Application
™
Tutorial 2
The Calculator Application
At the heart of TI-Nspire is the Calculator application, the workspace for numeric and algebra operations.
This tutorial introduces some of the key features of the application, starting with a new blank document.
This document will be saved, used again and added to in subsequent tutorials
Basic operations
First create a new blank document by pressing c and
choosing option 1: New Doc from the Home Screen.
To open a page which uses the calculator application:
press 1 or · or x.
Try keying in and entering expressions using the four basic arithmetic operations, square roots, negatives etc.
Look carefully at how the expressions as well as the results appear on the screen, in order to understand the
conventions the handheld uses with its default settings.
NB multiplication
and division.
What do you expect the result
of this calculation to be?
Notice that in many cases the layout of the expression changes when · is pressed—in particular watch how
the multiplication and division operations are handled.
Try typing a lengthy expression and, before pressing ·, see the effect of using . and then /..
© 2012 Texas Instruments Education Technology Page 15
First Steps with TI-Nspire
Tutorial 2: The Calculator Application
™
A History Lesson
You will have noticed that, as new expressions are entered, previous ones scroll off the top of the screen. The
TI-Nspire handheld will remember a history of up to 99 expressions and these can be recalled using the up key
on the Touchpad. Press and hold £ and see the way the highlight flicks back through previous expressions and
results. Stop at some point in the history and press ·. You should see either the previous expression or the
result copied to the entry line ready to be used as all or part of a new expression.
Notice that, after an expression has been evaluated, simply
pressing · again repeats the previous entry. What would
you expect to see if you repeatedly pressed · on this
screen? Try it by pressing
1·
lv1¢+1
···…
Notice how entering an operation at the beginning of an
expression (the power operation in this example) causes the
automatic entry of Ans, standing for the previous answer.
If you ever need to clear the history there is an option in the Actions submenu: press b15. This is also a
way of producing an uncluttered screen for making screenshots such as the one above.
Approximate Calculations
If you repeat the key sequence above but replace the first ·
with /· you get the rather different results shown here.
Try it and continue pressing · until you get an (apparently)
unchanging approximation for the Golden Ratio.
The default mode for calculations is to give exact results
(using fractions) rather than approximate results (using
decimals). It is possible to alter this using the system settings
as you will see later in this tutorial. Another way of choosing a decimal result is to enter a decimal
in the expression that you type, e.g. try entering 1 / 7 and then 1.0 / 7.
Page 16
© 2012 Texas Instruments Education Technology
First Steps with TI-Nspire
Tutorial 2: The Calculator Application
™
Templates
Many of the handheld’s keys provide templates to enable you to enter a range of mathematical expressions. For
example, in this tutorial you have used the keys /q for square roots and l for powers. In both cases a small
box appears in the expression inviting you to enter values. Some care is necessary when entering more complex
expressions using such templates.
For example, try entering √3+√5. In order to move out of the box after entering 3 you need to press either e
or ¢. This explains the use of ¢ in the key sequence in part b above.
More complex templates are available from the Maths
Templates Menu that can be opened by pressing t.
To make a selection from this menu you need to move the
highlight with the Touchpad and press ·.
A menu of maths templates
Those options which have a bold T superimposed are
not available on the numeric version of TI-Nspire as they
require a Computer Algebra System (which cannot be
used in most exams).
Try using a template to produce the sums of the first 20
square numbers. You will need to use an alphabetic key
such as N to enter the variable name. Press e or use
the Touchpad to move from one small box to the next.
Now produce the sums of the first 20 cubic numbers. The
easiest key sequence to use is (probably!):
££·¡¡.3·
Other useful templates are the definite integral template,
and the differential at a point template.
These can also be accessed from the Calculus Menu b4.
Derivative of
x2+2x-3 at x=5
© 2012 Texas Instruments Education Technology Integral of x2+2x-3
between 1 and 5
Page 17
First Steps with TI-Nspire
Tutorial 2: The Calculator Application
™
Getting Set
The mode settings for a document can be changed using the
document settings dialog box: press
c521 or ~721 or
Click on the
icon then press 21
With dialog boxes it is important to remember
that you need to press e to move through
the various options.
Document settings dialog box
Notice that here the first box is outlined bold, showing that
Display Digits is selected. Press ¤ to see the range of options
for fixed or floating decimal places. Change to the setting
Fix 2, by highlighting it and then moving to the next box
using e.
In the second box, change the angle setting to Degree and in
the fifth box choose Approximate.
Then press · again to apply the new settings to your
document. You can check the angle setting by hovering the cursor over
the
symbol.
Do some calculations to see the effect of these changes
before returning to the default settings, Float 6, Radian
and Auto.
In Approximate mode
all results are shown as
decimals rather than
fraction
The effect of changed settings
Page 18
© 2012 Texas Instruments Education Technology
First Steps with TI-Nspire
Tutorial 2: The Calculator Application
™
Some Algebra
The calculator application allows you to define variables as single numbers, functions, lists, matrices and even
strings.
There are three equivalent ways to store a variable.
You can use /h
(store),
or
/t(Ï)
or
Define
Define can be typed letter by letter, followed by a space
or alternatively it can be entered from the Catalogue:
press kD to find it.
Notice also you can:
• display multiple values in a list using curly brackets /);
• use a colon for multiple statements on the entry line º.
In the last entry the value of r was changed to 5 but
notice the difference between a and c(r): whereas
c is a defined function of r, a had been given a
particular value.
3 ways to define variables
What you type is not necessarily what
you get: above πr2 and 2πr were a
ctually typed as.
PIrRq
2PIrR
This screen illustrates the use of function notation on the
calculator screen. Notice that h(g(x)) can be evaluated
numerically but the TI-Nspire CAS would be able to
evaluate it algebraically.
You will see in Tutorial 4 that functions defined like this in the
Calculator application can then be used in the Graphs and
Geometry application. So please enter these definitions of
g(x) and h(x) on your handheld now.
Use of function notation
© 2012 Texas Instruments Education Technology Page 19
First Steps with TI-Nspire
Tutorial 2: The Calculator Application
™
The Calculator Menu
Press b and look at the extensive system of menus and
submenus available in the Calculator application. If you used
the TI-83 or TI-84 graphical calculators you will be familiar
with many of these expressions.
More details can be found in the Getting Started Guide.
This screen shows a simulation of 100 throws of two dice and
uses commands from the Probability and Statistics
sub-menus.
To enter randInt you can either press
b542
Lists of random integers
to navigate through the menus or you can spell it out, letter
by letter.
You will find the mean command by pressing
b633.
Notice that the expression d1+d2 produces a list of 100 sums of the corresponding
values from d1 and d2 i.e. 100 totals when 2 dice are thrown
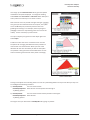
Statistical Distribution Tables
A useful feature of the TI-Nspire is the ability to work
with probability distributions such as the Binomial,
Poisson and Normal distributions. These can be found
by pressing b65.
These provide wizards which enable you to calculate
the probability for a given distribution instead of looking
up the value in a table.
Page 20
© 2012 Texas Instruments Education Technology
First Steps with TI-Nspire
Tutorial 2: The Calculator Application
™
Variables Linked to Documents
Press h and you will see a floating menu showing all the
variables that you have defined while using the current
document.
When you load a different document these definitions
will be replaced by those linked to that document. Make
sure your list includes the variables g, h, d1 and d2 and
then save the document, giving it the name FirstSteps.
The Save As.. option is in the Documents menu so press
~15, type the filename:
gFIRSTgSTEPS
and press ·.
List of defined variables
Check list of some key points in Tutorial 2:
• The layout of expressions often changes when they are evaluated
• Previous expressions and results can both be recalled for subsequent use
• Evaluation can be either approximate (decimals) or exact (fractions)
• How to use templates and menus
• Changing from default document settings
• Using Statistical Distribution functions
• Defining and using variables and functions
© 2012 Texas Instruments Education Technology Page 21
First Steps with TI-Nspire
Tutorial 3: The Notes application
™
Tutorial 3
The Notes Page
This very short tutorial introduces this simple, innovative application and deals with the process of splitting the
screen.
Why use Notes?
TI-Nspire documents may be readily shared with others, so
teachers can prepare and then distribute documents that are
a type of electronic worksheet. The Notes application allows
documents to include:
• text instructions for the user
• space for the user to document their own
mathematical activities
• a means of teacher-student and student-student
interaction.
Various text formatting
Instructions
Recording results
Making Notes
Open a FirstSteps document that you created previously.
Open a new page for notes in that document by pressing c and then selecting
.
Alternatively a Notes page can be added by pressing /~6 or by pressing (¿).
Enter some text using the alphanumeric keys. For upper case letters use the shift key, g.
Page 22
© 2012 Texas Instruments Education Technology
First Steps with TI-Nspire
Tutorial 3: The Notes application
™
Press b to see the various options available when using the
Notes application.
Try to format some text.
To select a block of text for formatting hold down the shift key,
g, while you move around the text using the Touchpad.
Splitting the Screen
In any application you can split the screen into two or more
parts using the Page Layout option in the Document menu.
The Format sub-menu
Press ~52 and you should see the various standard
options available. The icons on the left of the menu indicate
the way the screen will be split.
Choose any of the options to see your text appear on a split
screen.
Ways to split the screen
Important: to move from one
part of the screen to another
you need to press: /e
Add a Calculator application area to your page
and experiment with using Notes and Calculator
together.
You must press / e and then b
The option Custom Split enables you to change the width or height of sections of the page. It can be used
either when the page is first being split, or subsequently to edit an existing split page.
© 2012 Texas Instruments Education Technology Page 23
First Steps with TI-Nspire
Tutorial 3: The Notes application
™
More Options from the Notes Menu
Mathematical expressions can be entered (and evaluated)
on a Notes page.
In addition the menus in the Notes application provide:
• two templates for Q+A and Proofs
• teacher and reviewer comments
• small shapes such as ∆
Have a look at the examples of their use shown here. If you
want to explore them choose the relevant options after
pressing b.
Use of Q+A template
An inserted comment
Use of proof template and symbols
Interactive Notes
A powerful feature of the Notes page is something called
Interactive Notes. These enable you to create dynamic
calculations. Unlike the Calculator page, which when you
carry out a calculation gives an answer which will not
update, the MathsBox within the Notes page is dynamic.
Add a new Notes page by pressing:
/~6. For this simple example we will create a function
calculator.
To do this simply add a MathsBox (b31 or /M) and
enter the calculation exactly as you would have done on the
Calculator page (i.e. the bold text in the image). Now try
editing either the function or the input value, and see how
the output automatically updates.
Page 24
The MathsBox attributes (b51)
allows you to show just the input
or output if preferred
© 2012 Texas Instruments Education Technology
First Steps with TI-Nspire
Tutorial 3: The Notes application
™
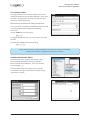
Asking Questions
If you also have access to TI-Nspire Teacher Software, then you also have the ability to insert questions in to
your documents. To do this you use the Insert menu and choose Question…
There are a number of different
question types which can be used
In this example we’ve chosen the Custom Choice question type, this is a multiple choice template.
© 2012 Texas Instruments Education Technology Page 25
First Steps with TI-Nspire
Tutorial 3: The Notes application
™
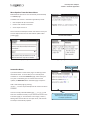
We then enter the question in the top box and answers in the
fields below. To add mathematical content insert a Maths
Box. To indicate the correct answer click on the Tick mark.
When viewed on the handheld the question this will look like
this. If the correct answer has been set then the question
can be either self-marked by pressing b2, or marked by
the teacher using TI Connect-to-Class or TI-Nspire Navigator
Teacher software.
Check list of some key points in Tutorial 3:
• Some possible uses for the Notes application
• Creating and editing page layouts with split screens
• Moving from one part of a split screen to another
• Accessing templates from the Notes menu
• Using Maths Boxes in Interactive Notes
• Creating question using the TI-Nspire software
Page 26
© 2012 Texas Instruments Education Technology
First Steps with TI-Nspire
Tutorial 4: Graphing
™
Tutorial 4
Graphing
The Graphs and Geometry applications are probably the most visually exciting of the TI-Nspire applications.
This tutorial introduces the Graphs application and then concentrates on its use for graphing and exploring
functions. The application’s use for creating and exploring geometrical shapes is covered in Tutorial 5.
Graphs & Geometry: Two Views
Start by opening the document FirstSteps4 that you created in Tutorial 3. Press c then select
to create a
new page with the Graphs application. You should see the Graphing View, with the coordinate axes defined by
the default window settings and an entry line at the bottom of the screen.
A Graphing page can be turned into a Plane Geometry page by pressing b2 to open the View menu and 2
to choose the Plane Geometry View. This view has no entry line or axes and is ideal for drawing geometrical
shapes. Tutorial 5 will explore this aspect of the Graphs & Geometry application.
Return to the View menu and notice that several options are now grey, indicating that they are not available in
this view. Choose b21 to return to the Graphing View.
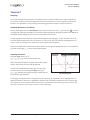
Graphing Functions
Alongside f1(x)= enter 0.2x2–3
(0^2Xq-3) to see the screen shown here.
Notice the label that appears alongside the function’s graph
and the way the entry line has now disappeared.
In Tutorial 2 you defined the function g(x):=x+4. Press e
to return the entry line and alongside f2(x)= enter g(x)
(G(X)) and draw the straight-line graph. Notice that the
entry line will again disappear.
The Graphing View
Pressing e once again will return the graph entry line, pressing e repeatedly and the highlight moves to
different locations on the screen. Highlight the double arrow in the bottom right-hand corner and press ·.
This enables you to see all the functions entered so far––the function history. Press d and you move to the
main work area with a cursor in the form of an arrow at the origin.
© 2012 Texas Instruments Education Technology Page 27
First Steps with TI-Nspire
Tutorial 4: Graphing
™
Grab and Drag Practice
Use the Touchpad to move the arrow around the work area, it behaves exactly like a trackpad on a laptop, so
you do not need to press down on the pad just let your finger lightly touch it.
As you move the cursor over the objects in the work area, three things may happen:
• the cursor changes shape
• the underlying object flashes
• labels of the various objects appear, e.g. axes, graph etc.
In some positions two or more screen objects overlap and
you are prompted to press the e key to toggle through the
labels of various overlapping objects. Move the cursor to the
position shown here.
Make certain that the open-hand (÷) icon is showing over the
highlighted label for f1(x) and grab the label by pressing and
holding x or by pressing /x.
Notice that the fingers of the hand close up ({) indicating that
you have successfully grabbed this label. Use the Touchpad
to drag the closed-hand icon and the function label to a
new position. Click again by pressing x or press d to stop
dragging. Being able to grab and drag items is one of the most
powerful features of the Graphs. However, some skill and
patience is often needed to grab exactly the right item and,
without care, mistakes can easily be made.
The open-hand cursor
If you do end up moving the wrong item,
remember that /Z or /d can be
used to undo the last change. As with a
computer / Y can be used to redo.
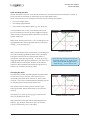
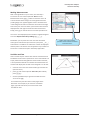
Changing the Axes
Get some more practice at grabbing objects as follows. Move
to a tick mark on the x-axis such as the one shown here
representing x=6. Make certain that you can see the openhand icon – if you see an upward pointing index finger (ø) you
are selecting the axis itself, not just the tick mark.
Grab the tick mark and move gently to the left or right
watching the effect. Notice that both the x- and y-axes are
rescaled.
Click again (x) or press d and /d to undo this and
return to the default set of axis.
Grabbed tick mark on the axes
Now grab the tick mark again and this time hold down the
shift key, g, while you move left or right. This time the
x-axis is scaled but the y-axis is unchanged.
Page 28
© 2012 Texas Instruments Education Technology
First Steps with TI-Nspire
Tutorial 4: Graphing
™
You have just used a direct method for changing the axes, but
there are a number of other ways to do this. Press b4 and
you will see this Window sub-menu. Option 1 allows you to
enter numerical values to determine the extremes of the axes,
while the Zoom options, as on the TI-83 and TI-84, provide
automatic rescaling.
The Zoom settings
It is worth mentioning one final very useful
way of changing the position of the axes,
but without rescaling them. Move the arrow
cursor to an empty part of the screen and
grab the vacant space. An appropriate icon
appears (ù) indicating that you are grabbing
the whole working area. Now you can use the
Touchpad to reposition the axes as you wish.
The grabbed-sheet icon
Reset the axes using the (default) Zoom-Standard
option from the Window menu before continuing.
Editing, Deleting or Hiding a Function
Suppose you wish to make f2(x)=x+8. As well as changing g(x)
in the Calculator application on page 1.1, you can make the
change in two ways on this page.
• In the work area, move the pointer to the label,
f2(x)=g(x) and, instead of grabbing it, double-click on
the label and an editable box opens up. Change the
definition and press · to update it.
• Press ee· to highlight the function history area
and scroll up to edit f2.
Functions may be deleted in similar ways, by simply deleting
their definition and pressing ·.
Changing f2 in the function history
To hide a function’s graph click
on the Hide/Show button ú
© 2012 Texas Instruments Education Technology Page 29
First Steps with TI-Nspire
Tutorial 4: Graphing
™
Tracing Graphs
Press b51 to choose the Graph Trace option.
Notice the Trace icon in the top left
corner of the work area. This is typical of
many of the options from the menus.
Trace picks out significant points
Press ¡ and ¢ to trace along the graph and see the coordinates
of current points in the lower right corner. For intricate
functions progress can be slow along the curve but you
can change the Trace Settings to increase the Trace Step:
press b53 and try a step of 0.5 or 1. To start tracing at
an integer value of x, in Graph Trace mode simply type the
integer and press ·.
The current value of the trace is
displayed in the bottom corner
Press £ or ¤ to move to the other graph. To trace through all
the visible functions at once use Trace All b52. Notice
that significant points such as maxima, minima and zeros are
automatically identified.
To stop tracing you need to press d. Check to see that the
Trace icon is no longer showing in the top left corner.
Points and coordinates
Here is the way to mark points of intersection of two lines.
• Press b73 to choose the Intersection Point(s) option.
Notice the icon has appeared in the top left corner.
• Move the cursor to the graph of f1(x). With the graph
highlighted click x.
• Move to the graph of f2(x). With the graph highlighted
click x.
Notice that the Intersection Points icon is still visible so you
can go on to mark more intersections. For example you could
try marking where the two graphs cross the y-axis.
Points of intersection
Now press d.
Page 30
© 2012 Texas Instruments Education Technology
First Steps with TI-Nspire
Tutorial 4: Graphing
™
Notice that all the intersections are added at once and that
their co-ordinates are automatically displayed.
We will now use the Text tool: b16. Try labelling one
of your fixed points by moving carefully to the point––make
quite certain that only the point is highlighted and not one
of the graphs or axes.
Points, lines and shapes can be drawn and manipulated on
the graphing work area and this will be explored in the next
tutorial. However, one more thing to try now is putting a grid
on the work area. Press b26.
Coordinates and labelled points
It’s easy to change the number of decimal
places displayed: move the cursor over a
displayed value and press - or +.
Analyse Graph Menu
As well as tracing graphs and using the Points tool, important
points on graphs can also be identified by using the Analyse
Graph tool. We will find the right-hand root of our quadratic
function by pressing b61 to activate the zero tool. Then
select the quadratic graph by clicking on it with x, you will
then be prompted to select a lower bound my moving the
cursor somewhere to the left of the desired root and click
(x) and then to the right of the root and click again (x).
Lower Bound
Upper Bound
There are number of features that can be identified using
the Analyse Graph tool, spend some time exploring the other
options available by pressing b6.
© 2012 Texas Instruments Education Technology Page 31
First Steps with TI-Nspire
Tutorial 4: Graphing
™
Manually Moving Graphs
You saw earlier that, when you change a function’s equation the graph changes. An innovative feature of
TI-Nspire is that you can also do the reverse, i.e. manually manipulate the graph and see the function’s
equation change. As the graph moves, all associated features such as points of intersection and their
coordinates also update.
First move the straight line graph, as follows.
Check that no icons are still showing in the top left corner of
the work area (press d if there is anything displayed) and
then move the pointer to the graph of the function f2(x)=x+2.
Alternative icons
The line should be highlighted and you will see one of the
two icons shown here, depending on where exactly you
are on the screen. Move along the line and you will
discover the other icon.
Near the middle of the graph the icon suggesting translation
appears, while the one suggesting rotation appears towards
the ends of the graph. Decide which you would like to use and
grab the line by pressing and holding x.
Use the Touchpad to move the graph around. Notice the way
that the function’s equation updates too.
Transformed graph and equation
Press d and try the other transformation.
Try manipulating a quadratic graph, and explore the
possible transformations available
Many of the techniques that have been introduced in this tutorial, in particular fixing points, grabbing and
labelling them, will be used again in Tutorial 5. In Tutorials 6 and 7 you will see how the Lists and Spreadsheets
application allows tables of values to be formed from functions defined in the Graphs application.
Using Sliders
Sliders are a powerful way of controlling the value of
constants in a graph or geometric construction. In this
example we will use a slider to explore the transformation
of a function. To do this, start by creating a new Graphs
page by pressing c then selecting
.
First enter the function f3(x)=x2, then insert a slider by
pressing b1A. v1 will be highlighted. Change it to d
by pressing D· ·.
Page 32
© 2012 Texas Instruments Education Technology
First Steps with TI-Nspire
Tutorial 4: Graphing
™
Next add a second function f4(x)=f3(x-d) by pressing
eF3(X-D)·, this function is a transformation of
the original function by d. Now grab the handle on the slider
and move it left and right and observe the effect on the graph.
Try changing the original function, or moving the position of d
in f4 to explore other transformations.
Sequence Plotting
We normally think of sequences as being lists of numbers,
but sometimes it is useful to look at them graphically. The
TI-Nspire makes this easy with the aid of its sequence plotting
mode. To do this, create a new Graphs page by pressing c
then selecting
.
Then press b351 to put the TI-Nspire in to sequence
mode. Enter the nth term of the sequence as u1(n)=2n-1 and
enter the Initial Terms as the first term in the sequence, 1,
and press ·.
Adjust the window setting by pressing b41 and change
the x-axis to go from -2 to 21 and the y-axis to go from -2
to 42. Now you can explore the sequence further by using
Graph Trace b51 or by displaying the sequence as a table
by pressing /T.
You can also use the sequence plotter to explore recursive
sequences. For example you could instead define
u1(n)=u1(n-1)+u1(n-2) and set the Initial Terms set to 1,1
(1,1) which would give you a Fibonacci sequence.
Finally save the document as FirstSteps5 so that you can
refer to these graphs later.
© 2012 Texas Instruments Education Technology Page 33
First Steps with TI-Nspire
Tutorial 4: Graphing
™
Check list of some key points in Tutorial 4:
• Items visible in the graphing view: the work area, the entry line, the function history,
the warning icons in the top-left corner
• Grabbing and dragging labels
• Setting the axes in three ways: by dragging, zooming and entering values
• Tracing along graphs
• Marking and labelling points and their coordinates
• Using the Analyse Graph menu
• Transforming graphs and their functions manually
• Using Sliders
Page 34
© 2012 Texas Instruments Education Technology
First Steps with TI-Nspire
Tutorial 1: TI-Nspire documents
™
Tutorial 5
Geometry
This tutorial introduces interactive geometry in TI-Nspire and builds upon the methods and features of
the Graphs and Geometry applications that were covered in Tutorial 4. You are led step by step through a
geometrical construction which illustrates the simple concept that the areas of triangles with a fixed base and
constant height are equal. As you work through the construction you will meet many of the features that make
this one of the most powerful and attractive components of TI-Nspire.
A View for Plane Geometry
If necessary open your FirstSteps5 document and use the
c key then select
to create a new Geometry page.
Much like with a Graphing page it is possible to convert the
Plane Geometry page in to a Graphing page by selecting
b21. However for now leave the page in Plane
Geometry View.
Two Parallel Lines
We will start by drawing a line segment to represent the
base of a triangle and labelling it BC: press b7 to see the
options available for drawing Points & Lines. Segments have
two distinct end points, lines are (in theory) infinite, while
rays have just one end. So choose option 5: Segment.
Move the cursor to a suitable position for point B. Then click
(x) to fix the point and then gB to give it a label of B.
Move the cursor to where you want the other end of the
segment to be. Mark the point and label it C in the same way.
The icon in the top left corner is still showing you that you
could draw another segment if you wish. Press d to
remove the icon and leave that mode of operation.
Notice that as usual the relevant icon
appears in the top left corner of the screen.
Drawing the base of the triangle
© 2012 Texas Instruments Education Technology Page 35
First Steps with TI-Nspire
Tutorial 5: Geometry
™
The next step is to draw a line parallel to BC. This is a
construction so you need to press bA.
Choose option 2: Parallel.
You must specify two things: the line to which it is to be
parallel, and a point the line must pass though (although
these can be chosen in either order). So move the cursor
to the segment BC––you will see its label when you are in
the right position. Click (x) to select the segment, move
away, dragging a dotted parallel line and when happy with
its position click again. Once again, don’t forget to press d,
if you do not want to add another parallel line.
Many options in the Construction menu
What’s grabbable?
At this point it is worth moving the cursor around the
screen to see which objects can be grabbed and dragged.
You should see the open hand cursor (÷) appear for point B,
for point C, for the segment BC, and for the point fixing the
parallel line. All of these are grabbable.
However, the parallel line itself cannot be grabbed and
dragged. It can however be selected for various purposes.
For example, you could delete it by clicking (x) to select it
and then pressing . to remove it.
Selectable, but not grabbable!
Construct the Triangle
First, a point A is needed on the parallel line. Later you will be
sliding this point along the line without moving the line itself,
so the point that you have already which defines the line is
not a good one to use. Therefore press b72 to select the
option: Point On. Move the cursor to a new position on the
line and then click (x) then press: gAd. The triangle
itself can be constructed using the Shapes menu (b92).
Check that the correct icon is showing in the top left corner,
and then carefully select, in any order, each of the points
A, B and C.
Make certain you don’t click until its label and the pointingfinger icon appears as shown here.
Page 36
Point A is ready to be selected
© 2012 Texas Instruments Education Technology
First Steps with TI-Nspire
Tutorial 5: Geometry
™
Making Measurements
With a triangle drawn on your screen, the next step is
to measure its area. Choose option 2: Area from the
Measurement menu (b8) and then move the cursor to
one of the sides of the triangle. The triangle label and the
pointing-finger icon appear together with a calculated area
in the background. Click to confirm the choice of the triangle,
then move your cursor to where you want the measurement
displayed then click again to show the measurement and
finally press d to remove the icon from the top left corner.
Measurement menu
The area is now displayed (to the number of significant figures
set in the Graphs & Geometry settings ~722).
Remember you can place the cursor over the calculated
value (you should see the open-hand icon) and press + or several times. The effect is to reduce the number of displayed
decimal places. This feature can be applied to any numbers on
the screen in either the Graph or Geometry application.
Notice the range of other
possible measurements available
from this menu.
Variables and Text
There are two ways to make it clear that the measurement at
the bottom of the screen represents an area. One method is to
simply add some text alongside the measurement. However,
a more powerful method is to allocate the measurement to a
variable and display the variable name alongside it. To do this:
• move the cursor over the measurement (you will see the
open-hand icon;
• press h and choose option 1: Store Var (Alternatively
press /h)
• use the alphabetic keys to give the variable the name
“area”. Press ·.
Storing the measurement as a variable
This variable may now be used on other pages of the
document. For example, if you move to a Calculator
page, type and enter area, the current value of the
area will be used.
© 2012 Texas Instruments Education Technology Page 37
First Steps with TI-Nspire
Tutorial 5: Geometry
™
Now move to the top of the screen and enter some text, perhaps giving the user some explanation or
instructions. You will need to press:
• b16 to select the Text option,
• Then click to start a box where text can be entered.
• Note you cannot do carriage returns in text boxes so do put in two lines you must use two text boxes!
Dynamic Changes
If you haven’t yet done so, try grabbing point A and sliding it
along its line. Make quite certain that you grab the point––
you must see its label. You may need to press e until the
point itself, rather than the triangle or label is selected. If you
do select the wrong item it is well worth remembering that
/d will undo any action if something happens that you
didn’t intend!
Notice that as you move the point, two sides of the triangle
and the label A all move too. What does not change however,
is the area.
Ready to grab A and slide it
Now try grabbing and dragging point B or C, and then the
line segment BC and the line parallel to it. In each case notice
which other items on the screen move, and which do not.
Thinking about how each item was originally defined should
explain whether it moves in relation to other items.
Tidying Up and Using Attributes
Finally it’s well worth seeing how to improve the appearance
of the screen and preventing items from being grabbed
unintentionally.
For this activity the scale in the top right corner may not be
needed. You can hide it with option 8 in the View menu.
The point that defines the parallel line may be rather
distracting, so you could hide it using option 3 in the
Actions menu.
Now from the Actions menu choose option 4: Attributes.
Move the cursor to one of the sides of the triangle and
click (x) to select it.
Changing the attributes of the triangle
This allows you to change the thickness and style of the line.
Press · to confirm your choices.
To change the shading of the shape, you need to ‘right-click’
on the triangle by placing the cursor over one of the edges
and pressing /b.
Page 38
© 2012 Texas Instruments Education Technology
First Steps with TI-Nspire
Tutorial 5: Geometry
™
This brings up the contextual menu which gives the options
available for the option displayed. To change the shading
select Colour then Line Colour or Fill Colour which will open a
colour picker from which you can choose a colour.
Now move the cursor to point B and right click again (/b).
This gives you the contextual menu for the point, one option
here is to Pin the point, which will prevent users from
grabbing and moving it. For example, there may be good
pedagogic reasons for only allowing point A to move in this
activity. For the moment pin points B and C.
To unpin an object just right-click on the object again and
select Unpin.
Continue to move the cursor around the screen and see
the options for changing the attributes of the parallel line
and also the area measurement. When you look at the
attributes for the area calculation you will see the option
of a padlock. Locking the measurement will fix the current
value constraining movement of other points accordingly.
Area is now locked
Locking some objects and unlocking others can have very interesting effects and if you have time you may care
to investigate the following situations.
a) Locked/Pinned:
The area measurement.
Unlocked/Unpinned: Points B and C and the parallel line through A.
Try Moving point B
b) Locked/Pinned:
The area measurement and the parallel line through A.
Unlocked/Unpinned: Points B and C.
Try Moving point B
Once again save your document as FirstSteps6 before going any further.
© 2012 Texas Instruments Education Technology Page 39
First Steps with TI-Nspire
Tutorial 5: Geometry
™
Check list of some key points in Tutorial 5:
• Use of the Plane Geometry View rather than the Graphing View
• Lines, segments and rays
• Constructing parallel lines
• Drawing points on objects and labelling them
• The construction of shapes
• The difference between selecting and grabbing screen objects
• Making a measurement and storing as a variable
• Attributes which change the appearance and locking/pinning screen objects
Page 40
© 2012 Texas Instruments Education Technology
First Steps with TI-Nspire
Tutorial 6: Lists & Spreadsheet
™
Tutorial 6
Lists & Spreadsheet
The Lists & Spreadsheet application is a very powerful means of manipulating data lists and works seamlessly
with the other applications to provide multiple representations of data. This tutorial introduces the application,
showing how to use it as a simple spreadsheet. It also shows how the Lists & Spreadsheet application handles
lists and functions defined in the Calculator, and Graphs applications.
In the next Tutorial you will see how Lists & Spreadsheet is used in conjunction with the Data & Statistics
application to produce charts and statistical summaries.
Entering Data as Lists
Open a document and press c then select
to add a
new page using the Lists & Spreadsheet application.
Enter some data similar to that shown here:
• column A represents male shoe sizes,
• column B has widths of hand spans in cm (paired data
with column A),
• column C is female shoe sizes.
You will need 20 or 30 pairs of similar data in columns A and B
and at least 15 values in column C.
Differences from a spreadsheet?
Notice the similarities and differences between this screen
and a traditional spreadsheet. In particular notice the two
areas coloured white and grey at the top of each column.
• The white area is for list names.
• The grey area is for formulas that will apply to all items
in the list below.
Move to the white space beside A, type mshoe and
press ·.
What you have just done is to define a new list. If you were
to move to a Calculator screen, pressing h would reveal
mshoe as one of the defined variables and lists,
and entering the name on that screen would produce the
result {11,8,7,12,9.5,…..}
Defining the list in column C
Lists can also be defined in the
Calculator application
Define the data in columns B and C as lists mhand and fshoe.
© 2012 Texas Instruments Education Technology Page 41
First Steps with TI-Nspire
Tutorial 6: Lists & Spreadsheet
™
Using Formulae
Suppose you wished to investigate the relationship between hand spans and shoe sizes. You might therefore
wish to divide every hand-span measurement by the corresponding shoe size. These ratios would best be
expressed in decimal rather than fractional format so change the Document Settings for Calculation Mode to
Approximate (~721).
There are 3 ways (at least!) of calculating the ratios on the TI-Nspire. Try one of the following now.
Either: in cell D1 type the expression =B1/A1. Select D1 and fill down the column by pressing b and
choosing the options 3: Data and 3: Fill Down.
Or: Or:
in the grey formula area at the top of column D enter =mhand/mshoe.
in the grey formula area enter =b/a.
Conflict resolution
One way to enter a formula
Press b and notice the various options
available in the Lists & Spreadsheet application.
TI-Nspire has most of the editing features that
you would expect from a spreadsheet including
selecting, inserting, moving and deleting rows,
columns and cells. Typical Spreadsheet Actions
You can also create absolute cell references in the usual way using $ chosen from the symbols key menu (º)
and you can sort data in columns (b16). To sort multiple columns at once by one column press £ until the
column is selected then hold down g and press ¡ or ¢ to select the columns you want before choosing Sort
from the Actions menu.
Page 42
© 2012 Texas Instruments Education Technology
First Steps with TI-Nspire
Tutorial 6: Lists & Spreadsheet
™
Capturing Data
A powerful feature of TI-Nspire is its ability to capture data from a Graphs or Geometry page. Follow
through these steps to see an example of how this works, using the measurement of the area of a triangle
from Tutorial 5.
• Create a new Lists & Spreadsheet page: (c then select
• Choose the Manual Data Capture option from the menus
(b322).
You should see in the entry line: =capture(var,0).
).
Instead of typing ‘area’ you can also press
h, highlight area and then press ·.
• Overtype var by typing the variable name area.
• Resize the column (b121).
• Move to cell A1 and capture the current value of area by pressing /^.
• Move to the page where you constructed the triangle. If necessary unpin point B and unlock the area
variable, then grab B and move it. Notice that this changes the area.
• Return to page 1.6 and in cell A2 press /^.
In the formula the second parameter, 0, indicates manual
capture was selected. An interesting variation involves using
automatic capture (i.e. =capture(area,1)). Either edit the
formula in column A or enter it in column B (b321).
Then grab and move point B around again and see the huge
amount of data that are generated. (See the Appendix for
more ideas about using this feature).
If you have time you may care to measure the base and height
of the triangle on the Geometry page and capture these
values on the Spreadsheet page. How could such features be
used to develop an understanding of triangle area?
Capturing data by hand
Capturing data by hand
Function Tables
It is quite possible to create from scratch a table of values for
functions that have been defined elsewhere in the current
document. For example, the screen shown here uses the
definitions of f1 and f2 that were used previously. Don’t
worry if the values you see are different from these.
A hand-made function table
© 2012 Texas Instruments Education Technology Page 43
First Steps with TI-Nspire
Tutorial 6: Lists & Spreadsheet
™
Because function tables are so useful, they can also be drawn
automatically. Follow through these steps.
• Create another Lists & Spreadsheet page and press
b51 to switch to a function table. Notice the different
layout of the screen and a box with a list of the currently
defined functions.
• Choose a function and scroll up and down.
• Press b5 again. These are the only options that are
available now: apart from the ability to resize columns.
• Experiment with using option 5: Edit Table Settings.
A simple function table
• Now use option 4: Edit Expression. You
will see the values in the table change
and any associated function will also
have changed.
Options for function tables
Having a function’s table on the same page as its graph can
clearly be a powerful learning tool and there is a very simple
way of arranging this on a split screen. On the relevant page
of your document choose option A in the View menu or
press /T.
The Function Table view is an
alternative for any Lists & Spreadsheet
page. You can toggle between the two
views using /T.
With a split screen of this nature it is as well to remove
all unnecessary clutter. Here the labels and unnecessary
functions have been deleted. Also the vertical split between
graph and table was set using the option Custom Split from
the Documents/Page layout menu. (~51).
You can refine the split further by pressing the outer
edge of the touchpad to move the window separator
and then press ·.
Graph and table side by side
Page 44
© 2012 Texas Instruments Education Technology
First Steps with TI-Nspire
Tutorial 6: Lists & Spreadsheet
™
Frequency Charts
Often due to the quantity of data it is more useful to work
with data in the form of a frequency chart, this can be for
either discrete or grouped data (using the midpoint). Let’s
look at some more shoe size data but this time as a frequency
chart. Create a new Lists & Spreadsheet page, then enter the
following data, with the headings gshoe (grouped shoe size)
and gfreq (grouped frequency). We’ll explore what we can do
with this data in the next section!
Once again save your document, now as FirstSteps7 before
going any further.
Check list of some key points in Tutorial 6:
• Entering and editing data and formulas
• Lists and functions defined in other sections of the document
• Resizing cells
• Coping with ambiguous variable/cell names
• Use of function tables
• Entering Frequency Tables
© 2012 Texas Instruments Education Technology Page 45
First Steps with TI-Nspire
Tutorial 7: One- and two-variable statistics
™
Tutorial 7
One and Two Variable Statistics
One of the six core applications of TI-Nspire is Data & Statistics, the workspace for presenting, interpreting and
manipulating statistical charts and graphs. This application works in combination with the Lists & Spreadsheet
application and this tutorial uses the data that were entered as a spreadsheet at the beginning of Tutorial 6.
Shoe Sizes and Hand Spans
Start by locating in your Document the page that you created
in the first part of Tutorial 6. There should be 20 or 30 pairs of
(probably fictitious) data in columns A and B and at least 15
values in column C.
• List mshoe in column A represents male shoe sizes.
• List mhand in column B has widths of hand spans in cm
(paired data with column A).
• List fshoe in column C represents female shoe sizes.
Charts with One Variable
To create a new page for the charts press c then select
.
Data entered in Tutorial 6
Randomly distributed points: no variables
have yet been assigned.
Move the cursor to the bottom of the screen where it says:
Click to add variable. Press x.
A list of currently defined lists opens up, so use the Touchpad
to select mshoe and press · or x.
Choosing a variable
Initially you will see a dot plot.
Press b1 to see the Plot Type menu, which gives nine
types of plot. Because you have only defined a single
numerical variable so far, there are only three alternative
plots including a boxplot and a histogram.
Try these options now.
Three plots for numerical data
Page 46
© 2012 Texas Instruments Education Technology
First Steps with TI-Nspire
Tutorial 7: One- and two-variable statistics
™
Display the boxplot and then move the cursor over the chart.
You will be able to see the median, quartiles, maximum and
minimum values and, possibly, outlier values.
Upper quartile displayed
Comparing Boxplots
This boxplot can be compared with a similar one representing
the female shoe sizes by displaying them, one above another.
To do this we add a second X Variable by pressing b24,
this will give you the choice of available lists.
This time select fshoe. The result is two side by side box plots
that can easily be compared.
This method can be used to add more box plots, up to five or
six can be easily compared on the same screen.
Comparing shoe sizes
Charts for Categorical Data
Create a new Data & Statistics page and choose the variable
mshoe for the x axis.
This variable contains a list of numerical data but they could
also be thought of as categorical data, in which case it would
be appropriate to use a Pie Chart. By using the option Force
Categorical X in the Plot Properties menu you can force the
handheld to treat the data in this way. Notice the way in
which the labels on the axis change.
A Pie Chart displaying categorical data
Now you can use the Plot Type menu to choose Pie Chart.
It is also possible to enter non-numerical categorical data in
a Lists & Spreadsheet page, e.g., favourite pets, sandwich
fillings etc. Such data must be entered in quotation marks
by pressing /r(Ó).
© 2012 Texas Instruments Education Technology Page 47
First Steps with TI-Nspire
Tutorial 7: One- and two-variable statistics
™
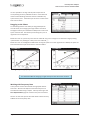
Charts with Two Variables
Create a new Data & Statistics page.
Notice both axes are marked Click to add variable.
As before select mshoe for the horizontal axis.
Move the cursor to the left edge of the screen, click x and
select the variable mhand for the vertical axis.
This displays the scatterplot.
Ready to add a 2nd variable
It may be that there is a positive correlation and a relationship
between hand span and shoe size, so it may be appropriate
to model this relationship with a linear function. The Analyze
menu provides a range of tools to use.
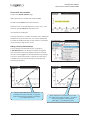
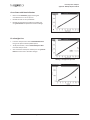
Fitting a Line by Hand and Eye
First try adding a line of best fit by eye, using option
2: Add Movable Line. This displays a straight line together
with a functional relationship between mshoe and mhand.
The line can be dragged into a best-fit position using the two
cursors for rotate and translate, in exactly the same way as
a straight line can be moved manually in the Graphs and
Geometry applications.
Translating the line
Move to the middle of the line to get the
translate cursor. Click and hold x to grab it.
Now move the line into position. Click again
x to release the cursor.
Page 48
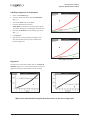
Powerful options in the Analyse menu
Rotating the line
Move towards one end of the line to show
the rotate cursor. Click and hold x to grab it.
Use the Touchpad to rotate the line.
Click again x to release the cursor.
© 2012 Texas Instruments Education Technology
First Steps with TI-Nspire
Tutorial 7: One- and two-variable statistics
™
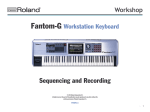
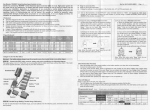
Drawing the Regression Line
The line that was fitted by hand and eye can be compared
with the calculated linear regression line using option 4 in the
Analyze menu. Pressing b461 will display a line with
equation of the form y=mx+b.
As usual, you can click and drag on the regression equation to
move it to a convenient place.
The calculated regression line
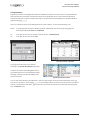
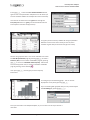
Getting the Stats
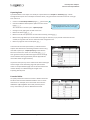
There are two methods for displaying summary statistics:
1. For a single statistic you can type its name and use
the h key to choose the variable, e.g. =median(fshoe).
=MEDIAN(h·
2. On a Lists & Spreadsheet page, you can enter a complete
set of statistics into spreadsheet cells.
Open a new Lists & Spreadsheet page and press b41
to see the range of statistical calculations. (Once again these
will be very familiar to users of the TI-83/4).
The Statistics Calculations menu
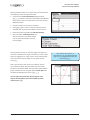
Choose option 1: One-Variable Statistics.
You have the option to display stats for more
than one list but for now choose 1 list and
then OK.
Choosing the data list can either be done
using the Touchpad, or you can type the
name.
Type the letter of the column where you
want the results to appear.
© 2012 Texas Instruments Education Technology Page 49
First Steps with TI-Nspire
Tutorial 7: One- and two-variable statistics
™
It is also possible to arrange side-by-side comparisons of
corresponding summary statistics for two or more data sets
and this makes drawing inferences from the statistics very
quick and very clear. The best way to do this is to select more
than one list above.
Dragging on the Charts
An interesting feature is the ability to drag plotted points
around charts, thus changing the original data. Go back to
the page on which you created the scatterplot for male hand
spans and shoe sizes. You left the plot showing the y=mx+b
Sets of statistics
regression line and equation.
Move the cursor to a point very near the line of best fit. The cursor changes to a hand with a finger pointing
upwards when it is pointing to a data point. Click and hold x.
Move the cursor to investigate the effect that moving this point has on the regression line. Below, the point has
been moved to the top of the screen for maximum effect.
The effect of moving a point from here …
… to here.
This shows the effect of changing a single hand-span value from 21cm to 32cm
Working with Frequency Data
In the previous tutorial we entered some grouped data for
shoe sizes. We will now explore some of the ways we can
work with that data using TI-Nspire. Start by returning to the
Lists & Spreadsheet page we created in the previous tutorial.
We can use the same process we used above to find summary
statistics for this frequency data.
Page 50
© 2012 Texas Instruments Education Technology
First Steps with TI-Nspire
Tutorial 7: One- and two-variable statistics
™
Press b411 to start the One-Variable Statistics wizard,
again choose 1 list (remember multiple lists are for when you
want to calculate statistics for multiple lists at the same time).
This time we set the X1 List to be ‘gshoe but change the
Frequency List from 1 to ‘gfreq, and set the Results Column
to be c (which is the first empty column).
This gives you the summary statistics for this grouped data –
Notice the mean comes out of to be just over 6, which
matches original data (as the shoe-sizes go from 4 to 8).
We can also graph this data. This can be achieved from either
the Lists & Spreadsheet page by pressing b35 to insert a
Summary Plot, or from a Data and Statistics page by pressing
b25 to insert an X Variable with Frequency. We will use
this second approach now, so create a new Data and Statics
page by pressing c then selecting
.
Then press b25, this will give you the Frequency
Plot wizard.
This will give you the following graph. This can also be
displayed as a box plot by pressing b12.
If you are dealing with grouped data you may need to adjust
the Bin Settings by pressing b222.
Save your document as FirstStepsComplete, so you can return to this if you want at a
later date.
© 2012 Texas Instruments Education Technology Page 51
First Steps with TI-Nspire
Tutorial 7: One- and two-variable statistics
™
Check list of some key points in Tutorial 7
• Creating one- and two-variable statistical plots in the Data & Statistics application
• Plotting categorical as opposed to numerical data
• Using boxplots to compare data sets
• Calculating and displaying summary statistics
• Manually fitting straight lines to data
• Automatically fitting linear-regression lines to data
• Dragging points on a scatterplot
• Working with Frequency Data
Page 52
© 2012 Texas Instruments Education Technology
First Steps with TI-Nspire
Appendix: Multiple Representations
™
Appendix
Multiple Representations
The previous seven tutorials have introduced many of the key features of TI-Nspire learning technology, with
each of the applications being discussed separately. However, one of the great strengths of TI-Nspire is that
it allows the applications to be linked dynamically, encouraging different approaches to problem solving.
This appendix offers an example of what is meant by “multiple representations”, showing how several of the
applications can be used to investigate a mathematical concept, in this case the relationship between a circle’s
diameter and circumference and between its radius and area.
By working through this appendix you will be able to revise many of the skills and techniques you met in the
tutorials. Here detailed instructions and key presses have been omitted though you will find back references
if you need to remind yourself about particular techniques. However, try to concentrate on the big picture
of what is going on, asking yourself how each of the multiple representations contributes to a deeper
understanding of the mathematics.
Draw and Measure a Circle
• Open a new document with a Geometry page.
• Construct a large circle on the screen.
• Construct a radius by drawing a segment from the
centre to the circumference.
• To construct a diameter first construct a line (not a
segment) from the centre to the circumference. Then
construct the Intersection Points of the line and the
circle: this generates the point on the opposite end
of the diameter.
• Now measure the lengths of the radius, the diameter
and the circumference. Also measure the area. In each
case change the number of decimal points displayed.
• Finally assign the measurements to variables. Click on
each measurement in turn. Press h. Type the letter
appropriate for each measurement (r, d, C and A) and
press ·.
A measured circle
• Check that the measurements all change when you
grab the edge of the circle and change its size.
© 2012 Texas Instruments Education Technology Page 53
First Steps with TI-Nspire
Appendix: Multiple Representations
™
A Spreadsheet for Data Capture
• Open a new Lists & Spreadsheet page.
• Type column headings for columns A to D.
• Click in the function entry line in column A (grey cell just
below the heading).
• From the Data menu choose Automated Data Capture.
Type r and press ·. This will capture values of the
radius in column A.
• Repeat for the other variables in columns B to D.
• Check that the data that appear are the same as the
current measurements on the previous page.
Beginning to capture data
Two Scatterplots
• Open a Data & Statistics page.
• Choose the variable diameter for the horizontal axis and
circum for the vertical axis.
• So far there is only one data pair and one point for the
Scatter Plot.
• Open another Data & Statistics page.
• Choose the variable radius for the horizontal axis and area
for the vertical axis.
Setting up a scatter plot
Collecting Just a Little Data
• Return to the Geometry page.
• Click and drag on the circumference of the circle to move
it in and out just a little bit.
• Review the amount of data you have collected in the
spreadsheet.
• Review the relationships shown on the two scatter plots.
• You may need to update the window settings using
the option Zoom–Data from the Window/Zoom
menu - b52.
Data capture is under way
Page 54
© 2012 Texas Instruments Education Technology
First Steps with TI-Nspire
Appendix: Multiple Representations
™
Go to Town with Data Collection
• Return to the Geometry page and drag the
circumference in as far as you can.
• Review the data in the spreadsheet.
• Review the diameter/circumference scatter plot,
using Zoom–Data to update the window settings.
A linear relationship
Fit a Straight Line
• From the Analyze menu choose Add Movable Line.
Drag it into place to fit the plotted points.
• To tidy the function, choose Lock Intercept at Zero
from the Analyze menu.
• Also review the radius/area scatter plot. Using Zoom–
Data here will create a dramatic change!
Moving a straight line by hand
Not a linear relationship!
© 2012 Texas Instruments Education Technology Page 55
First Steps with TI-Nspire
Appendix: Multiple Representations
™
A Different Approach to Scatterplots
• Open a new Graphs page.
• From the Graph Type menu choose Scatter Plot –
b34.
• Set x to be radius and y to be area.
• From the Window menu choose
Zoom–Data and hide the entry line to gain a good
view of the data points including the horizontal axis.
• Now choose Function from the Graph Type menu b31.
The basic quadratic ready for fitting…
• Enter f1(x)=x .
2
• Now you can click and drag the quadratic curve
into place to fit the data, just as you did earlier
for the straight line.
… and dragged into place
Regression
Go back to the each of the scatter plots on the Data &
Statistics pages in turn. From the Analyze menu choose
Regression and place appropriate lines on the data.
What other mathematical examples lend themselves to this sort of approach?
Page 56
© 2012 Texas Instruments Education Technology