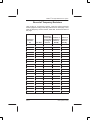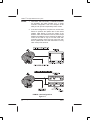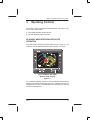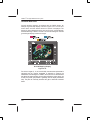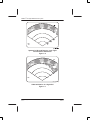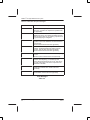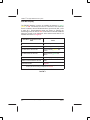
1
®
AD-54257@
Honeywell
Aerospace Electronic Systems
CES–Phoenix
P.O. Box 21111
Phoenix, Arizona 85036–1111
U.S.A.
TO:
HOLDERS OF THE PRIMUSR 660 DIGITAL WEATHER
RADAR SYSTEM PILOT’S MANUAL, HONEYWELL PUB.
NO. A28–1146–111
REVISION NO. 3 DATED AUGUST 2003
HIGHLIGHTS
Pages that have been revised are outlined below. Remove and insert
the affected pages listed. The revision number has been added to the
bottom of the revised pages and revision bars have been used to
indicate the revised or added text. Insert this highlights letter in the
manual in your possession ahead of page RR-1/RR-2, Record of
Revisions. The List of Effective Pages shows the order in which to insert
the attached new pages of front material into your manual.
Page No.
Description of Change
Title Page
Revised to reflect revision 3. Update Proprietary
Notice. Changed S99 to S2003 and changed
copyright from 1999 to 2003.
RR–1/RR–1
Revised to reflect revision 3.
LEP–1 thru
LEP–3/LEP–4
Revised to reflect revision 3.
6–1/6–2
Removed Inc. in Honeywell in paragraph above
figure. Replaced art in FIgure 6–1.
Highlights
Page 1 of 1
August 2003
Honeywell
Aerospace Electronic Systems
CES–Phoenix
P.O. Box 21111
Phoenix, Arizona 85036–1111
U.S.A.
PRIMUSR 660 Digital Weather
Radar System
Pilot’s Manual
Printed in U.S.A.
Pub. No. A28–1146–111–03
Revised August 2003
February 1998
PROPRIETARY NOTICE
This document and the information disclosed herein are proprietary
data of Honeywell. Neither this document nor the information contained
herein shall be used, reproduced, or disclosed to others without the
written authorization of Honeywell, except to the extent required for
installation or maintenance of recipient’s equipment.
NOTICE – FREEDOM OF INFORMATION ACT (5 USC 552) AND
DISCLOSURE OF CONFIDENTIAL INFORMATION GENERALLY
(18 USC 1905)
This document is being furnished in confidence by Honeywell. The
information disclosed herein falls within exemption (b) (4) of 5 USC 552
and the prohibitions of 18 USC 1905.
All rights reserved. No part of this book, CD, or PDF may be reproduced
or transmitted in any form or by any means, electronic or mechanical,
including photocopying, recording, or by any information storage and
retrieval system, without the written permission of Honeywell
International, except where a contractual arrangement exists between
the customer and Honeywell.
S2003
ASSOCIATE
MEMBER
E
Member of GAMA
General Aviation
Manufacturer’s Association
PRIMUS and LASEREF are U.S. registered trademarks of Honeywell
DATA NAV is a U.S. trademarks of Honeywell
E2003 Honeywell International Inc.
PRIMUSR 660 Digital Weather Radar System
Record of Revisions
Upon receipt of a revision, insert the latest revised pages and dispose
of superseded pages. Enter revision number and date, insertion date,
and the incorporator’s initials on the Record of Revisions. The typed
initials H are used when Honeywell is the incorporator.
Revision
Number
Revision
Date
Insertion
Date
By
1
Aug 1999
Aug 1999
HI
2
Dec 1999
Dec 1999
HI
3
Aug 2003
Aug 2003
H
A28–1146–111
REV 3
Record of Revisions
RR–1/(RR–2 blank)
PRIMUSR 660 Digital Weather Radar System
Record of Temporary Revisions
Upon receipt of a temporary revision, insert the yellow temporary
revision pages according to the filing instructions on each page. Then,
enter the temporary revision number, issue date, and insertion date on
this page.
Temporary
Revision
No.
Date the
Temporary
Revision Was
Incorporated
by a Regular
Revision
Insertion of
Temporary
Revision,
Date/By
Removal of
Temporary
Revision,
Date/By
ÁÁÁÁÁ
ÁÁÁÁ
ÁÁÁÁÁÁ
ÁÁÁÁÁ
ÁÁÁÁÁ
ÁÁÁÁÁ
ÁÁÁÁ
ÁÁÁÁÁÁ
ÁÁÁÁÁ
ÁÁÁÁÁ
ÁÁÁÁÁ
ÁÁÁÁ
ÁÁÁÁÁÁ
ÁÁÁÁÁ
ÁÁÁÁÁ
ÁÁÁÁÁ
ÁÁÁÁ
ÁÁÁÁÁÁ
ÁÁÁÁÁ
ÁÁÁÁÁ
ÁÁÁÁÁ
ÁÁÁÁ
ÁÁÁÁÁÁ
ÁÁÁÁÁ
ÁÁÁÁÁ
ÁÁÁÁ
ÁÁÁÁÁ
ÁÁÁÁÁÁ
ÁÁÁÁÁ
ÁÁÁÁÁ
ÁÁÁÁÁ
ÁÁÁÁ
ÁÁÁÁÁÁ
ÁÁÁÁÁ
ÁÁÁÁÁ
ÁÁÁÁÁ
ÁÁÁÁ
ÁÁÁÁÁÁ
ÁÁÁÁÁ
ÁÁÁÁÁ
ÁÁÁÁÁ
ÁÁÁÁ
ÁÁÁÁÁÁ
ÁÁÁÁÁ
ÁÁÁÁÁ
ÁÁÁÁÁ
ÁÁÁÁ
ÁÁÁÁÁÁ
ÁÁÁÁÁ
ÁÁÁÁÁ
ÁÁÁÁÁ
ÁÁÁÁ
ÁÁÁÁÁÁ
ÁÁÁÁÁ
ÁÁÁÁÁ
ÁÁÁÁÁ
ÁÁÁÁ
ÁÁÁÁÁÁ
ÁÁÁÁÁ
ÁÁÁÁÁ
ÁÁÁÁÁ
ÁÁÁÁ
ÁÁÁÁÁÁ
ÁÁÁÁÁ
ÁÁÁÁÁ
ÁÁÁÁÁ
ÁÁÁÁ
ÁÁÁÁÁÁ
ÁÁÁÁÁ
ÁÁÁÁÁ
ÁÁÁÁÁ
ÁÁÁÁ
ÁÁÁÁÁÁ
ÁÁÁÁÁ
ÁÁÁÁÁ
ÁÁÁÁÁÁÁÁÁ
ÁÁÁÁÁÁ
ÁÁÁÁÁ
ÁÁÁÁÁ
ÁÁÁÁÁ
ÁÁÁÁ
ÁÁÁÁÁÁ
ÁÁÁÁÁ
ÁÁÁÁÁ
ÁÁÁÁÁ
ÁÁÁÁ
ÁÁÁÁÁÁ
ÁÁÁÁÁ
ÁÁÁÁÁ
ÁÁÁÁÁ
ÁÁÁÁ
ÁÁÁÁÁÁ
ÁÁÁÁÁ
ÁÁÁÁÁ
ÁÁÁÁÁ
ÁÁÁÁ
ÁÁÁÁÁÁ
ÁÁÁÁÁ
ÁÁÁÁÁ
ÁÁÁÁÁ
ÁÁÁÁ
ÁÁÁÁÁÁ
ÁÁÁÁÁ
ÁÁÁÁÁ
ÁÁÁÁÁ
ÁÁÁÁ
ÁÁÁÁÁÁ
ÁÁÁÁÁ
ÁÁÁÁÁ
ÁÁÁÁÁ
ÁÁÁÁ
ÁÁÁÁÁÁ
ÁÁÁÁÁ
ÁÁÁÁÁ
A28–1146–111
REV 2
Issue Date
Record of Temporary Revisions
RTR–1/(RTR–2 blank)
PRIMUSR 660 Digital Weather Radar System
List of Effective Pages
Original
Revision
Revision
Revision
Subheading and Page
Revision
H
Title Page
3
Record of Revisions
H
RR–1/RR–2
..0
..1
..2
..3
3
Record of Temporary Revisions
RTR–1/RTR–2
0
List of Effective Pages
..
..
..
..
Feb 1998
Aug 1999
Dec 1999
Aug 2003
Subheading and Page
Revision
3–4
0
3–5
0
3–6
0
3–7
0
3–8
0
3–9
0
3–10
0
3–11
0
3–12
0
LEP–1
H
3
3–13
0
LEP–2
H
3
3–14
0
LEP–3/LEP–4
H
3
3–15
0
Table of Contents
3–16
0
3–17/3–18
0
TC–1
0
TC–2
1
TC–3
1
4–1
0
TC–4
1
4–2
0
TC–5
1
4–3
0
TC–6
1
4–4
0
TC–7/TC–8
1
4–5
0
4–6
0
Normal Operation
Introduction
1–1
0
Radar Facts
1–2
0
5–1
0
5–2
0
5–3
0
System Configurations
2–1
0
5–4
0
2–2
0
5–5
0
2–3
0
5–6
0
2–4
0
5–7
0
2–5/2–6
0
5–8
0
Operating Controls
5–9
0
5–10
0
3–1
0
5–11
0
3–2
0
5–12
0
3–3
0
H
F
A28–1146–111
REV 3
indicates changed, added or deleted pages.
indicates right foldout page with a blank back.
List of Effective Pages
LEP–1
PRIMUSR 660 Digital Weather Radar System
Subheading and Page
Revision
Radar Facts (cont)
Subheading and Page
Revision
Maximum Permissible Exposure Level
(MPEL)
5–13
0
5–14
0
5–15
0
5–16
0
5–17
0
7–1
0
0
7–2
0
5–19
0
7–3
0
5–20
0
7–4
0
5–21
0
7–5
0
5–22
0
7–6
0
5–23
0
7–7
0
5–24
0
7–8
0
5–25
0
7–9
0
5–26
0
7–10
0
5–27
0
7–11
0
5–28
0
7–12
0
5–29
0
7–13
0
5–30
0
7–14
0
5–31
0
7–15/7–16
0
5–32
0
5–33
0
5–34
0
5–18
5–35
0
5–36
0
5–37
0
5–38
0
5–39
0
5–40
0
5–41
0
5–42
0
5–43
0
5–44
0
5–45
0
5–46
0
5–47
0
5–48
0
5–49
0
5–50
0
5–51
0
5–52
0
5–53
0
5–54
0
5–55
0
5–56
0
5–57
0
5–58
0
List of Effective Pages
LEP–2
H
6–1/6–2
3
In–Flight Adjustments
In–Flight Troubelshooting
8–1
0
8–2
0
8–3
0
8–4
0
8–5
0
8–6
0
8–7
0
8–8
0
Honeywell Product Support
9–1
1
9–2
1
9–3
1
9–4
1
Abbreviations
10–1
1
10–2
1
10–3/10–4
1
Appendix A
A–1
0
A–2
0
A–3
0
A–4
0
A–5
0
A28–1146–111
REV 3
PRIMUSR 660 Digital Weather Radar System
Subheading and Page
Revision
Subheading and Page
Revision
Appendix A (cont)
A–6
0
A–7
0
A–8
0
A–9
0
A–10
0
A–11
0
A–12
0
A–13/A–14
0
Appendix B
B–1
1
B–2
1
B–3
1
B–4
1
B–5
1
B–6
1
Index–1
1
Index–2
1
Index–3
1
Index–4
1
Index–5
1
Index–6
1
Index–7
1
Index–8
1
Index
A28–1146–111
REV 3
List of Effective Pages
LEP–3/(LEP–4 blank)
PRIMUSR 660 Digital Weather Radar System
Table of Contents
Section
Page
1. INTRODUCTION . . . . . . . . . . . . . . . . . . . . . . . . . . . . .
1-1
2. SYSTEM CONFIGURATIONS . . . . . . . . . . . . . . . . .
2-1
3. OPERATING CONTROLS . . . . . . . . . . . . . . . . . . . .
3-1
WI–650/660 Weather Radar Indicator Operation . . .
WC–660 Weather Radar Controller Operation . . . . .
3-1
3-10
4. NORMAL OPERATION . . . . . . . . . . . . . . . . . . . . . . .
4-1
Preliminary Control Settings . . . . . . . . . . . . . . . . . . .
Standby . . . . . . . . . . . . . . . . . . . . . . . . . . . . . . . . . .
Radar Mode – Weather . . . . . . . . . . . . . . . . . . . .
Radar Mode – Ground Mapping . . . . . . . . . . . . .
Test Mode . . . . . . . . . . . . . . . . . . . . . . . . . . . . . . . .
4-1
4-4
4-4
4-5
4-6
5. RADAR FACTS . . . . . . . . . . . . . . . . . . . . . . . . . . . . . .
5-1
Radar Operation . . . . . . . . . . . . . . . . . . . . . . . . . . . . .
Tilt Management . . . . . . . . . . . . . . . . . . . . . . . . . . . . .
Stabilization . . . . . . . . . . . . . . . . . . . . . . . . . . . . . . . . .
Dynamic Error . . . . . . . . . . . . . . . . . . . . . . . . . . . .
Accelerative Error . . . . . . . . . . . . . . . . . . . . . . . . .
Antenna Mounting Error . . . . . . . . . . . . . . . . . . . .
Wallowing (Wing Walk and Yaw) Error . . . . . . . .
Roll Gain Error . . . . . . . . . . . . . . . . . . . . . . . . . . . .
Pitch Gain Error . . . . . . . . . . . . . . . . . . . . . . . . . . .
Interpreting Weather Radar Images . . . . . . . . . . . . .
Weather Display Calibration . . . . . . . . . . . . . . . . . . .
Variable Gain Control . . . . . . . . . . . . . . . . . . . . . . . . .
Rain Echo Attenuation Compensation Technique
(REACT) . . . . . . . . . . . . . . . . . . . . . . . . . . . . . . . . . .
Shadowing . . . . . . . . . . . . . . . . . . . . . . . . . . . . . . .
Turbulence Probability . . . . . . . . . . . . . . . . . . . . .
Hail Size Probability . . . . . . . . . . . . . . . . . . . . . . .
Spotting Hail . . . . . . . . . . . . . . . . . . . . . . . . . . . . . .
Azimuth Resolution . . . . . . . . . . . . . . . . . . . . . . . .
Radome . . . . . . . . . . . . . . . . . . . . . . . . . . . . . . . . . . . .
Weather Avoidance . . . . . . . . . . . . . . . . . . . . . . . . . . .
Configurations of Individual Echoes (Northern
Hemisphere) . . . . . . . . . . . . . . . . . . . . . . . . . . . .
Line Configurations . . . . . . . . . . . . . . . . . . . . . . . .
5-1
5-5
5-15
5-15
5-15
5-16
5-19
5-19
5-22
5-24
5-28
5-30
A28–1146–111
REV 2
5-31
5-34
5-34
5-36
5-37
5-41
5-42
5-43
5-47
5-52
Table of Contents
TC–1
PRIMUSR 660 Digital Weather Radar System
Table of Contents (cont)
Section
Page
5. RADAR FACTS (CONT)
Additional Hazards . . . . . . . . . . . . . . . . . . . . . . . .
Ground Mapping . . . . . . . . . . . . . . . . . . . . . . . . . . . . .
5-55
5-56
6. MAXIMUM PERMISSIBLE EXPOSURE LEVEL
(MPEL) . . . . . . . . . . . . . . . . . . . . . . . . . . . . . . . . . . . .
6-1
7. IN–FLIGHT ADJUSTMENTS . . . . . . . . . . . . . . . . . .
7-1
Pitch and Roll Trim Adjustments . . . . . . . . . . . . . . . .
Level Fight Stabilization Check . . . . . . . . . . . . . .
Roll Offset Adjustment . . . . . . . . . . . . . . . . . . . . . . . .
Pitch Offset Adjustment . . . . . . . . . . . . . . . . . . . . . . .
Roll Stabilization Check . . . . . . . . . . . . . . . . . . . . . . .
Roll Gain Adjustment . . . . . . . . . . . . . . . . . . . . . . . . .
Pitch Stabilization Check . . . . . . . . . . . . . . . . . . . . . .
Pitch Gain Adjustment . . . . . . . . . . . . . . . . . . . . . . . .
7-1
7-3
7-5
7-8
7-9
7-11
7-12
7-15
8. IN–FLIGHT TROUBLESHOOTING . . . . . . . . . . . . .
8-1
Test Mode With Text Faults Enabled . . . . . . . . . . . .
Pilot Event Marker . . . . . . . . . . . . . . . . . . . . . . . . . . . .
Fault Code and Text Fault Relationships . . . . . . . . .
8-2
8-4
8-5
9. HONEYWELL PRODUCT SUPPORT . . . . . . . . . .
9-1
Publication Ordering Information . . . . . . . . . . . . .
9-4
10. ABBREVIATIONS . . . . . . . . . . . . . . . . . . . . . . . . . . .
10-1
APPENDICES
A FEDERAL AVIATION ADMINISTRATION (FAA)
ADVISORY CIRCULARS . . . . . . . . . . . . . . . . . . . .
Subject: Recommended Radiation Safety Precautions
For Ground Operation Of Airborne Weather Radar
Purpose . . . . . . . . . . . . . . . . . . . . . . . . . . . . . . . . . .
Cancellation . . . . . . . . . . . . . . . . . . . . . . . . . . . . . .
Related Reading Material . . . . . . . . . . . . . . . . . . .
Background . . . . . . . . . . . . . . . . . . . . . . . . . . . . . .
Precautions . . . . . . . . . . . . . . . . . . . . . . . . . . . . . . .
Table of Contents
TC–2
A–1
A–1
A–1
A–1
A–1
A–2
A28–1146–111
REV 2
PRIMUSR 660 Digital Weather Radar System
Table of Contents (cont)
A FEDERAL AVIATION ADMINISTRATION (FAA)
ADVISORY CIRCULARS (CONT)
Subject: Thunderstorms . . . . . . . . . . . . . . . . . . . . . .
Purpose . . . . . . . . . . . . . . . . . . . . . . . . . . . . . . . . . .
Cancellation . . . . . . . . . . . . . . . . . . . . . . . . . . . . . .
Related Reading Material . . . . . . . . . . . . . . . . . . .
General . . . . . . . . . . . . . . . . . . . . . . . . . . . . . . . . . .
Hazards . . . . . . . . . . . . . . . . . . . . . . . . . . . . . . . . . .
National Severe Storms Laboratory (NSSL)
Thunderstorm Research . . . . . . . . . . . . . . . . . .
A–10
B ENHANCED GROUND–PROXIMITY WARNING
SYSTEM (EGPWS) . . . . . . . . . . . . . . . . . . . . . . . . .
System Operation . . . . . . . . . . . . . . . . . . . . . . . . . . . .
EGPWS Controls . . . . . . . . . . . . . . . . . . . . . . . . . .
Related EGPWS System Operation . . . . . . . . . .
EGPWS Operation . . . . . . . . . . . . . . . . . . . . . . . .
EGPWS Display . . . . . . . . . . . . . . . . . . . . . . . . . .
EGPWS Test . . . . . . . . . . . . . . . . . . . . . . . . . . . . .
B–1
B–1
B–1
B–3
B–3
B–4
B–6
A–3
A–3
A–3
A–3
A–3
A–4
INDEX . . . . . . . . . . . . . . . . . . . . . . . . . . . . . . . . . . . . . . . . . . . . . Index–1
List of Illustrations
Figure
Page
PRIMUSR
2–1
660 Configurations . . . . . . . . . . . . . . . . . .
2–2 Typical PRIMUSR 660 Weather Radar
Components| . . . . . . . . . . . . . . . . . . . . . . . . . . . . . . .
3–1 Typical PRIMUSR 660 Digital
Weather Radar Display . . . . . . . . . . . . . . . . . . . . . .
3–2 WI–650/660 Weather Radar Indicator Front Panel
View . . . . . . . . . . . . . . . . . . . . . . . . . . . . . . . . . . . . . .
3–3 WI–650/660 Weather Radar Indicator Display
Screen Features . . . . . . . . . . . . . . . . . . . . . . . . . . . .
3–4 WC–660 Weather Radar Controller
Configurations . . . . . . . . . . . . . . . . . . . . . . . . . . . . . .
4–1 EFIS Test Pattern (Typical) 120° Scan Shown . . . .
4–2 Indicator Test Pattern 120° Scan (WX), With
TEXT FAULT Enabled . . . . . . . . . . . . . . . . . . . . . . .
A28–1146–111
REV 2
2-2
2-5
3-1
3-2
3-5
3-10
4-3
4-3
Table of Contents
TC–3
PRIMUSR 660 Digital Weather Radar System
Table of Contents (cont)
List of Illustrations (cont)
Figure
Page
5–1 Positional Relationship of an Airplane and Storm
Cells Ahead as Displayed on Indicator . . . . . . . . .
5–2 Antenna Beam Slicing Out Cross Section of Storm
During Horizontal Scan . . . . . . . . . . . . . . . . . . . . . .
5–3 Sea Returns . . . . . . . . . . . . . . . . . . . . . . . . . . . . . . . . .
5–4 Radar Beam Illumination High Altitude
12–Inch Radiator . . . . . . . . . . . . . . . . . . . . . . . . . . .
5–5 Radar Beam Illumination High Altitude
18–Inch Radiator . . . . . . . . . . . . . . . . . . . . . . . . . . .
5–6 Radar Beam Illumination Low Altitude
12–Inch Radiator . . . . . . . . . . . . . . . . . . . . . . . . . . .
5–7 Radar Beam Illumination Low Altitude
18–Inch Radiator . . . . . . . . . . . . . . . . . . . . . . . . . . .
5–8 Ideal Tilt Angle . . . . . . . . . . . . . . . . . . . . . . . . . . . . . . .
5–9 Earth’s Curvature . . . . . . . . . . . . . . . . . . . . . . . . . . . .
5–10 Convective Thunderstorms . . . . . . . . . . . . . . . . . . . .
5–11 Unaltered Tilt . . . . . . . . . . . . . . . . . . . . . . . . . . . . . . . .
5–12 Proper Tilt Technique . . . . . . . . . . . . . . . . . . . . . . . . .
5–13 Tilt Management With Heading Changes . . . . . . . .
5–14 Fast Developing Thunderstorm . . . . . . . . . . . . . . . . .
5–15 Low Altitude Tilt Management . . . . . . . . . . . . . . . . . .
5–16 Antenna Size and Impact on Tilt Management . . . .
5–17 Rules of Thumb . . . . . . . . . . . . . . . . . . . . . . . . . . . . . .
5–18 Symmetrical Ground Returns . . . . . . . . . . . . . . . . . .
5–19 Ground Return Indicating Misalignment
(Upper Right) . . . . . . . . . . . . . . . . . . . . . . . . . . . . . . .
5–20 Ground Return Indicating Misalignment
(Upper Left) . . . . . . . . . . . . . . . . . . . . . . . . . . . . . . . .
5–21 Symmetrical Ground Returns – Good Roll
Stabilization . . . . . . . . . . . . . . . . . . . . . . . . . . . . . . . .
5–22 Understabilization in a Right Turn . . . . . . . . . . . . . . .
5–23 Overstabilization in a Right Turn . . . . . . . . . . . . . . . .
5–24 Roll Stabilization Inoperative in a Turn . . . . . . . . . . .
5–25 Symmetrical Ground Returns – Good Pitch
Stabilization . . . . . . . . . . . . . . . . . . . . . . . . . . . . . . . .
5–26 Understabilized in Pitch–Up . . . . . . . . . . . . . . . . . . . .
5–27 Overstabilized in Pitch–Up . . . . . . . . . . . . . . . . . . . . .
5–28 Weather Radar Images . . . . . . . . . . . . . . . . . . . . . . .
5–29 Radar and Visual Cloud Mass . . . . . . . . . . . . . . . . . .
5–30 Squall Line . . . . . . . . . . . . . . . . . . . . . . . . . . . . . . . . . .
5–31 REACT ON and OFF Indications . . . . . . . . . . . . . . .
Table of Contents
TC–4
5-2
5-3
5-4
5-5
5-5
5-6
5-6
5-10
5-10
5-11
5-11
5-12
5-12
5-13
5-13
5-14
5-14
5-17
5-18
5-18
5-20
5-20
5-21
5-21
5-22
5-23
5-23
5-24
5-26
5-27
5-33
A28–1146–111
REV 2
PRIMUSR 660 Digital Weather Radar System
Table of Contents (cont)
List of Illustrations (cont)
Figure
Page
5–32 Probability of Turbulence Presence in a Weather
Target . . . . . . . . . . . . . . . . . . . . . . . . . . . . . . . . . . . . .
5–33 Hail Size Probability . . . . . . . . . . . . . . . . . . . . . . . . . .
5–34 Rain Coming From Unseen Dry Hail . . . . . . . . . . . .
5–35 Familiar Hailstorm Patterns . . . . . . . . . . . . . . . . . . . .
5–36 Overshooting a Storm . . . . . . . . . . . . . . . . . . . . . . . .
5–37 Short– and Long–Blind Alley . . . . . . . . . . . . . . . . . . .
5–38 Azimuth Resolution in Weather Modes . . . . . . . . . .
5–39 Weather Display . . . . . . . . . . . . . . . . . . . . . . . . . . . . .
5–40 Typical Hook Pattern . . . . . . . . . . . . . . . . . . . . . . . . .
5–41 V–Notch Echo, Pendant Shape . . . . . . . . . . . . . . . .
5–42 The Classic Pendant Shape . . . . . . . . . . . . . . . . . . .
5–43 Rain Gradients . . . . . . . . . . . . . . . . . . . . . . . . . . . . . . .
5–44 Crescent Shape . . . . . . . . . . . . . . . . . . . . . . . . . . . . . .
5–45 Line Echo Wave Pattern (LEWP) . . . . . . . . . . . . . . .
5–46 Bow–Shaped Line of Thunderstorms . . . . . . . . . . . .
5–47 Ground Mapping Display . . . . . . . . . . . . . . . . . . . . . .
5-35
5-37
5-38
5-38
5-39
5-40
5-41
5-43
5-48
5-49
5-50
5-51
5-52
5-53
5-54
5-56
6–1 MPEL Boundary . . . . . . . . . . . . . . . . . . . . . . . . . . . . .
6-1
7–1
7–2
7–3
7–4
7–5
7–6
7-4
7-4
7-5
7-7
7-7
7–7
7–8
7–9
7–10
7–11
Symmetrical Ground Returns . . . . . . . . . . . . . . . . . .
Ground Return Indicating Misalignment (Right) . . .
Ground Return Indicating Misalignment (Left) . . . .
Roll Offset Adjustment Display – Initial . . . . . . . . . .
Roll Offset Adjustment Display – Final . . . . . . . . . .
Symmetrical Ground Returns, Level Flight and
Good Roll Stabilization . . . . . . . . . . . . . . . . . . . . . .
Understabilization in a Right Roll . . . . . . . . . . . . . . .
Overstabilization in a Right Roll . . . . . . . . . . . . . . . .
Level Flight and Good Pitch Stabilization . . . . . . . .
Understabilized in Pitch Up . . . . . . . . . . . . . . . . . . . .
Overstabilized in Pitch Up . . . . . . . . . . . . . . . . . . . . .
7-10
7-10
7-11
7-13
7-14
7-14
8–1 Fault Annunciation on Weather Indicator With
TEXT FAULT Fields . . . . . . . . . . . . . . . . . . . . . . . . .
8–2 Fault Code on EFIS Weather Display With
TEXT FAULTS Disabled . . . . . . . . . . . . . . . . . . . . .
8–3 Radar Indication With Text Fault Enabled
(On Ground) . . . . . . . . . . . . . . . . . . . . . . . . . . . . . . .
8-4
A–1 Schematic Cross Section of a Thunderstorm . . . . .
A–6
A28–1146–111
REV 2
8-3
8-3
Table of Contents
TC–5
PRIMUSR 660 Digital Weather Radar System
Table of Contents (cont)
List of Illustrations (cont)
Figure
Page
B–1 EHSI Display Over KPHX Airport With the
EGPWS Display . . . . . . . . . . . . . . . . . . . . . . . . . . . .
B–2 EGPWS Test Display . . . . . . . . . . . . . . . . . . . . . . . . .
B–5
B–6
List of Tables
Table
Page
2–1 Dual Control Mode Truth Table . . . . . . . . . . . . . . . . .
2–2 PRIMUSR 660 Weather Radar Equipment List . . . . .
3–1
3–2
3–3
3–4
2-3
2-4
Target Alert Characteristics . . . . . . . . . . . . . . . . . . . .
Rainfall Rate Color Coding . . . . . . . . . . . . . . . . . . . .
WC–660 Controller Target Alert Characteristics . . .
Rainfall Rate Color Coding . . . . . . . . . . . . . . . . . . . .
3-4
3-6
3-12
3-14
4–1 PRIMUSR 660 Power–Up Procedure . . . . . . . . . . .
4-1
5–1 Approximate Tilt Setting for Minimal Ground Target
Display 12–Inch Radiator . . . . . . . . . . . . . . . . . . . .
5–2 Approximate Tilt Setting for Minimal Ground Target
Display 18–Inch Radiator . . . . . . . . . . . . . . . . . . . .
5–3 Stabilization in Straight and Level Flight Check
Procedure . . . . . . . . . . . . . . . . . . . . . . . . . . . . . . . . .
5–4 Stabilization in Turns Check Procedure . . . . . . . . . .
5–5 Pitch Stabilization In–Flight Check Procedure . . . .
5–6 Display Levels Related to dBZ Levels (Typical) . . . .
5–7 VIP Levels Related to dBZ . . . . . . . . . . . . . . . . . . . .
5–8 Turbulence Levels (From Airman’s Information
Manual) . . . . . . . . . . . . . . . . . . . . . . . . . . . . . . . . . . .
5–9 Severe Weather Avoidance Procedures . . . . . . . . .
5–10 TILT Setting for Maximal Ground Target Display
12–Inch Radiator . . . . . . . . . . . . . . . . . . . . . . . . . . .
5–11 TILT Setting for Maximal Ground Target Display
18–Inch Radiator . . . . . . . . . . . . . . . . . . . . . . . . . . .
7–1 Pitch and Roll Trim Adjustments Criteria . . . . . . . . .
7–2 Stabilization in Straight and Level Flight Check
Procedure . . . . . . . . . . . . . . . . . . . . . . . . . . . . . . . . .
7–3 In–Flight Roll Offset Adjustment Procedure . . . . . .
Table of Contents
TC–6
5-8
5-9
5-17
5-19
5-22
5-29
5-30
5-36
5-43
5-57
5-58
7-1
7-3
7-5
A28–1146–111
REV 2
PRIMUSR 660 Digital Weather Radar System
Table of Contents (cont)
List of Tables (cont)
Table
Page
7–4 Pitch Offset Adjustment Procedure . . . . . . . . . . . . .
7–5 Roll Stabilization (While Turning) Check
Procedure . . . . . . . . . . . . . . . . . . . . . . . . . . . . . . . . .
7–6 Roll Gain Adjustment Procedure . . . . . . . . . . . . . . .
7–7 Pitch Stabilization Check Procedure . . . . . . . . . . . .
7–8 Pitch Gain Adjustment Procedure . . . . . . . . . . . . . .
7-9
7-11
7-12
7-15
8–1 Fault Data Fields . . . . . . . . . . . . . . . . . . . . . . . . . . . . .
8–2 Text Faults . . . . . . . . . . . . . . . . . . . . . . . . . . . . . . . . . .
8–3 Pilot Messages . . . . . . . . . . . . . . . . . . . . . . . . . . . . . .
8-2
8-5
8-8
B–1 EGPWS Obstacle Display Color Definitions . . . . . .
B–4
A28–1146–111
REV 2
7-8
Table of Contents
TC–7/(TC–8 blank)
PRIMUSR 660 Digital Weather Radar System
1.
Introduction
The PRIMUSR 660 Digital Weather Radar System is a lightweight,
X–band digital radar with alphanumerics designed for weather detection
(WX) and ground mapping (GMAP).
The primary purpose of the system is to detect storms along the
flightpath and give the pilot a visual indication in color of their rainfall
intensity. After proper evaluation, the pilot can chart a course to avoid
these storm areas.
WARNING
THE
SYSTEM
PERFORMS
THE
FUNCTIONS
OF
WEATHER DETECTION OR GROUND MAPPING. IT SHOULD
NOT BE USED NOR RELIED UPON FOR PROXIMITY
WARNING OR ANTICOLLISION PROTECTION.
In weather detection mode, storm intensity levels are displayed in
four bright colors contrasted against a deep black background.
Areas of very heavy rainfall appear in magenta, heavy rainfall in red,
less severe rainfall in yellow, moderate rainfall in green, and little or no
rainfall in black (background). If selected at installation, the antenna
sweep position indicator is a yellow band at the top of the display.
Range marks and identifying numerics, displayed in contrasting colors,
are provided to facilitate evaluation of storm cells.
Selection of the GMAP function causes the system parameters to be
optimized to improve resolution and enhance identification of
small targets at short ranges. The reflected signal from ground
surfaces is displayed as magenta, yellow, or cyan (most to least
reflective).
NOTE:
Section 5, Radar Facts, describes a variety of radar operating
topics. It is recommended that you read Section 5, Radar
Facts, before learning the specific operational details of the
PRIMUSR 660 Digital Weather Radar System.
A28–1146–111
REV 2
Introduction
1-1
PRIMUSR 660 Digital Weather Radar System
The radar indicator is equipped with the universal digital interface (UDI).
This feature expands the use of the radar indicator to display
information such as checklists, short and long range navigation
displays (when used with a Honeywell DATA NAVt system) and
electrical discharge data from Honeywell’s LSZ–850 Lightning Sensor
System (LSS).
NOTE:
Introduction
1-2
Refer to Honeywell Pub. 28–1146–54, LSZ–850 Lightning
Sensor System Pilot’s Handbook, for more information.
A28–1146–111
REV 2
PRIMUSR 660 Digital Weather Radar System
2.
System Configurations
The PRIMUSR 660 Digital Weather Radar System can be operated in
many configurations to display weather or ground mapping information
on a radar indicator, electronic flight instrument system (EFIS) display,
multifunction display (MFD), or on a combination of these displays. The
various system configurations are summarized in the following
paragraphs and shown in figure 2–1.
NOTE:
Other configurations are possible but not illustrated.
The stand–alone configuration consists of two units: receiver
transmitter antenna (RTA), and a dedicated radar indicator. In this
configuration, the radar indicator contains all the controls to operate the
PRIMUSR 660 Digital Weather Radar System. A single or dual
Honeywell EFIS can be added to the stand–alone configuration. In such
a case the electronic horizontal situation indicator (EHSI) repeats the
data displayed on the radar indicator. System control remains with
the radar indicator.
The second system configuration uses an RTA, and single or dual
controllers. The single or dual EFIS is the radar display. Since there is
no radar indicator in this configuration, the radar system operating
controls are located on the controller. With a single controller, all cockpit
radar displays are identical.
The dual configuration gives the appearance of having two radar
systems on the aircraft. In the dual configuration, the pilot and copilot
each select independent radar mode, range, tilt, and gain settings for
display on their respective display. The dual configuration time shares
the RTA. On the right–to–left antenna scan, the system switches to the
mode, range, tilt, and gain selected by the left controller and updates
the left display. On the reverse antenna scan, the system switches to
the mode, range, tilt, and gain setting selected by the right controller
and updates the right display. Either controller can be slaved to the
other controller to show identical images on both sides of the cockpit.
A28–1146–111
REV 2
System Configurations
2-1
PRIMUSR 660 Digital Weather Radar System
NOTES:
1. When WAIT, SECTOR SCAN, or FORCED STANDBY
are activated, the radar operates as if in single
controller configuration. This is an exception to the
ability of each pilot to independently select modes.
2. In the dual configuration, the pilots can use the slave
feature to optimize the update rate of each side’s
weather radar display to meet the needs of the
situation. With one controller turned off, both cockpit
displays are updated on every sweep of the radar, but
control of the radar is only on one side. With each
controller operating, each side has control but each
side is updated with new radar information on every
other sweep of the antenna.
PULL
VAR
MIN
GAIN
MAX
PULL
VAR
MIN
GAIN
MAX
WX
STBY
OFF
OFF
OFF
RCT
STAB
GMAP
FP
TEST
RADAR
WX
STBY
OFF
SECT
+
PULL
ACT
0
SLV
OFF
RCT
STAB
GMAP
FP
TEST
SLV
15
–
TILT
OFF
RADAR
TGT
TGT
PULL
ACT
0
TILT
SECT
+
15
–
PRIMUSR 660 Configurations
Figure 2–1
System Configurations
2-2
A28–1146–111
REV 2
PRIMUSR 660 Digital Weather Radar System
The third system configuration is similar to the second except that a
Honeywell multifunction display (MFD) system is added. As before,
single or dual controllers can be used. When a single controller is used,
all displays show the same radar data. Dual controllers are used to
operate in the dual mode. The MFD can be slaved to either controller
to duplicate the data displayed on the selected side. Table 2–1 is a truth
table for dual control modes.
Left
Controller
Mode
Right
Controller
Mode
OFF
OFF
OFF
OFF
OFF
OFF
Standby
”SLV”
Standby
Standby
Standby
Standby
OFF
Standby
”SLV”
Standby
Standby
OFF
ON
”SLV” ON
ON
ON
ON
OFF
ON
”SLV” ON
ON
Standby
ON
Standby/
2
ON/2
ON
ON
Standby
ON/2
Standby/2
ON
ON
ON
ON/2
ON/2
ON
Standby
Standby
Standby
Standby
Standby
Left Side Right Side
(NOTE 1) (NOTE 1)
RTA
Mode
Dual Control Mode Truth Table
Table 2–1
NOTES:
A28–1146–111
REV 2
1. ON is used to indicate any selected radar mode.
2. “SLV” means that displayed data is controlled by
opposite side controller. That is, the one controller that
is operating is controlling both sweeps of the antenna.
3. XXX/2 means that display is controlled by appropriate
on–side control for the antenna sweep direction
associated with that control. (/2 implies two controllers
are ON.)
4. In standby, the RTA is centered in azimuth with 15_
upward tilt. Video data is suppressed. The transmitter
is inhibited.
5. The MFD, if used, can repeat either left– or right–side
data, depending upon external switch selection.
System Configurations
2-3
PRIMUSR 660 Digital Weather Radar System
Equipment covered in this manual is listed in table 2–2 and shown in
figure 2–2.
Model
Unit
Part No.
Cockpit Mounted Options
WI–650/660
Weather Radar Indicator
7007700–VAR
WC–660
Weather Radar Controller
7008471–VAR
Remote Mounted Equipment
WU–660
NOTES:
Receiver Transmitter Antenna
7021450–601
1. Typically, either the indicator or one of the remote controllers (one or
two) is installed.
2. Typical installed antenna sizes range from 12 to 18 inches in diameter.
PRIMUSR 660 Weather Radar Equipment List
Table 2–2
NOTE:
A WC–650 Weather Radar Controller can be installed.
Except as noted, its operation is identical to the WC–660
Weather Radar Controller.
System Configurations
2-4
A28–1146–111
REV 2
PRIMUSR 660 Digital Weather Radar System
WU–660 RECEIVER/
TRANSMITTER/ANTENNA
WI–650/660 WEATHER RADAR
INDICATOR
WC–660 WEATHER RADAR
CONTROLLER
AD–51768@
Typical PRIMUSR 660 Weather Radar Components
Figure 2–2
A28–1146–111
REV 2
System Configurations
2-5/(2-6 blank)
PRIMUSR 660 Digital Weather Radar System
3.
Operating Controls
There are two basic controllers that are described in this section. They
are (in order of description):
WI–650/660 Weather Radar Indicator
WC–660 Weather Radar Controller.
WI–650/660 WEATHER RADAR INDICATOR
OPERATION
All controls used to operate the system display shown in figure 3–1, are
located on the WI–650/660 Weather Radar Indicator front panel.
AUTO
TILT
+1.0
50
40
30
20
1
2
3 4 T
10
AD–51769–R1@
Typical PRIMUSR 660 Digital
Weather Radar Display
Figure 3–1
The controls and display features of the WI–650/660 Weather Radar
Indicator are indexed and identified in figure 3–2. Brightness levels for
all legends and controls on the indicator are controlled by the dimming
bus for the aircraft panel.
A28–1146–111
REV 2
Operating Controls
3-1
PRIMUSR 660 Digital Weather Radar System
WI–650/660 Weather Radar Indicator Front Panel View
Figure 3–2
1
WX (WEATHER)
The WX button is used to select the weather mode of operation. When
WX is pushed, the system is fully operational and all internal
parameters are set for enroute weather detection.
Alphanumerics are white, and WX is displayed in the mode field.
If WX is selected prior to the expiration of the initial RTA warm up period,
the white WAIT legend is displayed in the mode field. In wait mode, the
transmitter and antenna scan is inhibited and the memory is erased.
Upon completion of the warmup period, the system automatically
switches to WX mode.
WX can only be selected when the function switch is in the ON position.
2
GMP (GROUND MAPPING) OR MAP
GMP button selects the ground mapping mode. The system is fully
operational and all parameters are set to enhance returns from ground
targets.
NOTE:
REACT or TGT modes are not selectable in GMP.
Operating Controls
3-2
A28–1146–111
REV 2
PRIMUSR 660 Digital Weather Radar System
WARNING
WEATHER TYPE TARGETS ARE NOT CALIBRATED WHEN THE
RADAR IS IN THE GMAP MODE. BECAUSE OF THIS, DO NOT USE
THE GMAP MODE FOR WEATHER DETECTION.
As a constant reminder the GMP is selected, the alphanumerics are
changed to green, the GMP legend is shown in the mode field, and the
color scheme is changed to cyan, yellow, and magenta. Cyan
represents the least reflective return, yellow is a moderated return, and
magenta is a strong return.
If GMP is selected before the initial RTA warmup period is complete, the
white WAIT legend is shown in the mode field. In wait mode, the
transmitter and antenna scan are inhibited and the memory is erased.
When the warmup period is complete, the system automatically
switches to the GMP mode.
GMP can only be selected when the function switch is in the ON
position.
3
RCT (RAIN ECHO ATTENUATION
TECHNIQUE (REACT))
COMPENSATION
The RCT switch is an alternate–action switch that enables and
disables REACT.
The REACT circuitry compensates for attenuation of the radar signal
as it passes through rainfall. The cyan field indicates areas where
further compensation is not possible. Any target detected within
the cyan field cannot be calibrated and should be considered
dangerous. All targets in the cyan field are displayed as fourth level
precipitation, magenta.
REACT is available in the WX mode only, and selecting REACT forces
the system to preset gain. When engaged, the white RCT legend is
displayed in the REACT field.
NOTES:
1. REACT’S three main functions (attenuation
compensation, cyan field, and forcing targets to
magenta) are switched on and off with the RCT switch.
2. Refer to Section 5, Radar Facts, for a description of
REACT.
A28–1146–111
REV 2
Operating Controls
3-3
PRIMUSR 660 Digital Weather Radar System
4
TGT (TARGET)
The TGT button is an alternate–action switch that enables and
disables the radar target alert feature. Target alert is selectable in all but
the 300–mile range. When selected, target alert monitors beyond the
selected range and 7.5° on each side of the aircraft heading. If a return
with target alert characteristics is detected in the monitored area, the
target alert legend changes from the green T armed condition to the
yellow TGT warning condition. (See the target alert characteristics in
table 3–1 for a target description.) These annunciations advise the pilot
of potentially hazardous targets directly in front of the aircraft that are
outside the selected range. When a yellow warning is received, the pilot
should select longer ranges to view the questionable target. (Note that
target alert is inactive within the selected range.)
Selecting target alert forces the system to preset gain. Target alert can
be selected only in the WX or FP (flight plan) modes.
NOTE:
In order to activate the target alert warning, the target must
have the depth and range characteristics described in table
3–1.
Selected Range
(NM)
Minimum Target
Depth (NM)
Target Range
(NM)
5
5
5–55
10
5
10–60
25
5
25–75
50
5
50–100
100
5
100–150
200
5
200–250
300
N/A
N/A
FP (Flight Plan)
5
5–55
Target Alert Characteristics
Table 3–1
Operating Controls
3-4
A28–1146–111
REV 2
PRIMUSR 660 Digital Weather Radar System
5
DISPLAY AREA
See figure 3–3 and the associated text that explains the alphanumeric
display.
AD–51771@
WI–650/660 Weather Radar Indicator Display Screen Features
Figure 3–3
6
FUNCTION SWITCH
A rotary switch is used to select the following functions:
OFF– This position turns off the radar system.
SBY (Standby) – This position places the radar system in standby,
a ready state, with the antenna scan stopped, the transmitter
inhibited, and the display memory erased. STBY, in white, is shown
in the mode field.
If SBY is selected before the initial RTA warmup period is complete
(approximately 90 seconds), the white WAIT legend is shown in the
mode field. When warmup is complete, the system changes the
mode field to SBY.
A28–1146–111
REV 2
Operating Controls
3-5
PRIMUSR 660 Digital Weather Radar System
ON – Places the system in the operational mode selected by the WX
or MAP (GMP) button. When WX is selected, the system is fully
operational and all internal parameters are set for enroute weather
detection. The alphanumerics are white and WX is shown in the
mode field.
If ON is selected before the initial RTA warmup period is over
(approximately 90 seconds), the white WAIT legend is displayed
in the mode field. In wait mode, the transmitter and antenna scan
are inhibited and the display memory is erased. When the warmup
is complete, the system automatically switches to the WX (or MAP)
mode, as selected.
The system, in preset gain, with WX selected, is calibrated as listed
in table 3–2.
ÁÁÁÁÁÁ
ÁÁÁÁÁÁ
ÁÁÁÁÁÁ
ÁÁÁÁÁÁ
ÁÁÁÁÁÁ
ÁÁÁÁÁ
ÁÁÁÁÁÁÁÁÁÁ
ÁÁÁÁÁÁÁÁÁÁÁ
ÁÁÁÁÁÁÁÁÁÁ
ÁÁÁÁÁÁ
ÁÁÁÁÁ
ÁÁÁÁÁÁÁÁÁÁ
Rainfall Rate
Color
in/hr
mm/hr
.04–.16
1–4
Green
.16–.47
4–12
Yellow
.47–2
12–50
Red
>2
>5 0
Magenta
Rainfall Rate Color Coding
Table 3–2
FP (Flight Plan) – The FP position puts the radar system in the flight
plan mode, that clears the screen of radar data so ancillary data can
be displayed. Examples of this data are:
-
Electronic checklists
Navigation displays
Electrical discharge (lightning) data.
NOTE:
In the FP mode, the radar RTA is put in standby, the
alphanumerics are changed to cyan, and the FLTPLN
(flight plan) legend is shown in the mode field.
Operating Controls
3-6
A28–1146–111
REV 2
PRIMUSR 660 Digital Weather Radar System
The TGT alert mode can be used in the FP mode. With target alert
on and the FP mode selected, the target alert armed annunciation
(green TGT) is displayed. The RTA searches for a hazardous
target from 5 to 55 miles and ±7.5° of the aircraft heading. No radar
targets are displayed. If a hazardous target is detected, the target
alert armed annunciation switches to the alert annunciation (yellow
TGT). This advises the pilot that a hazardous target is in his
flightpath and the WX mode should be selected to view it.
NOTE:
The TGT function is inoperative when a checklist is
displayed.
TST (Test) – The TST position selects the radar test mode. A
special test pattern is displayed to verify system operation. The
TEST legend is shown in the mode field. Refer to Section 4, Normal
Operations, for a description of the test pattern.
WARNING
IN THE TEST MODE THE TRANSMITTER IS ON AND RADIATING
X–BAND MICROWAVE ENERGY. REFER TO SECTION 6,
MAXIMUM PERMISSIBLE EXPOSURE LEVEL (MPEL), AND THE
APPENDIX, FEDERAL AVIATION ADMINISTRATION (FAA)
ADVISORY CIRCULARS, TO PREVENT POSSIBLE HUMAN BODY
DAMAGE.
FSBY (FORCED STANDBY)
FSBY is an automatic, nonselectable radar mode. As an installation
option, the indicator can be wired to the weight–on–wheels (WOW)
squat switch. When wired, the RTA is in the FSBY mode when the
aircraft is on the ground. In FSBY mode, the transmitter and antenna
scan are both inhibited, and the forced standby legend is displayed in
the mode field.
The FSBY mode is a safety feature that inhibits the transmitter on the
ground to eliminate the X–band microwave radiation hazard. Refer to
Section 6, Maximum Permissible Exposure Level (MPEL).
When in FSBY mode, you can restore normal operation by pulling the
tilt control out, pushing it in, pulling it out, and pushing it in within three
seconds.
WARNING
STANDBY OR FORCED STANDBY MODE MUST BE VERIFIED
FOR GROUND OPERATION BY THE OPERATOR TO ENSURE
SAFETY FOR GROUND PERSONNEL.
A28–1146–111
REV 2
Operating Controls
3-7
PRIMUSR 660 Digital Weather Radar System
7
GAIN
The GAIN knob is a single–turn rotary control and push/pull switch that
is used to control the receiver gain. Push in on the GAIN switch to enter
the system into the preset calibrated gain mode. Calibrated gain is the
normal mode and is used for weather avoidance. In calibrated gain, the
rotary portion of the GAIN control does nothing. In calibrated gain, the
color bar legend is labeled 1,2,3,4 in WX mode or 1,2,3 in GMAP mode.
Pull out on the GAIN switch to enter the system into the variable gain
mode with VAR (variance) displayed in the color bar. Variable gain is
useful for additional weather analysis and for ground mapping. In WX
mode, variable gain can increase receiver sensitivity over the calibrated
level to show very weak targets or it can be reduced below the
calibrated level to eliminate weak returns.
WARNING
HAZARDOUS TARGETS CAN BE ELIMINATED FROM THE DISPLAY WITH LOW SETTINGS OF VARIABLE GAIN.
In the GMAP mode, variable gain is used to reduce the level of the
typically very strong returns from ground targets to allow details to be
seen.
Minimum gain is with the control at its full counterclockwise (ccw)
position. Gain increases as the control is rotated cw from full ccw . At
full clockwise (cw) position, the gain is at maximum.
In variable gain, the color bar legend contains the variable gain (VAR)
annunciation. Selecting RCT or TGT forces the system into calibrated
gain.
8
TILT
The TILT knob is a rotary control that is used to select the tilt angle of
the antenna beam with relation to the horizon. CW rotation tilts beam
upward to +15; ccw rotation tilts beam downward to –15.
WARNING
TO AVOID FLYING UNDER OR OVER STORMS, FREQUENTLY ADJUST THE TILT TO SCAN BOTH ABOVE AND BELOW YOUR
FLIGHT LEVEL.
Stabilization is normally ON. It can be turned OFF by pulling out the
TILT knob. The knob is also used to operate the hidden modes. Refer
to Section 8, In–Flight Troubleshooting
The radar antenna is normally attitude stabilized. It automatically
compensates for roll and pitch maneuvers (refer to Section 5, Radar
Facts, for a description of stabilization). The STAB OFF annunciator is
displayed on the screen.
Operating Controls
3-8
A28–1146–111
REV 2
PRIMUSR 660 Digital Weather Radar System
9
BRT (Brightness) or BRT/LSS (Lightning Sensor System)
The BRT knob is a single–turn control that adjusts the brightness of the
display. CW rotation increases display brightness and ccw rotation
decreases brightness.
An optional BRT/LSS four–position rotary switch selects the separate
LSZ–850 Lightning Sensor System (LSS) operating modes and the
brightness control on some models. Its LSS control switch positions are
as follows:
OFF – This position removes all power from the LSS.
SBY (Standby) – This position inhibits the display of LSS data, but
the system accumulates data in this mode.
LX (Lightning Sensor System) – In this position the LSS is fully
operational and data is being displayed on the indicator.
CLR/TST (Clear/Test) – In this position accumulated data is cleared
from the memory of the LSS. After 3 seconds the test mode is
initiated in the LSS. Refer to the LSZ–850 Lightning Sensor System
Pilot’s Handbook, for a detailed description of LSS operation.
10
SCT (SCAN SECTOR)
The SCT button is an alternate–action switch that is used to select
either the normal 12 looks/minute 120 scan or the faster update 24
looks/minute 60 sector scan.
11
AZ (AZIMUTH)
The AZ button is an alternate–action switch that enables and disables
the electronic azimuth marks. When enabled, azimuth marks at 30°
intervals are displayed. The azimuth marks are the same color as the
other alphanumerics.
12
RANGE
The RANGE buttons are two momentary–contact buttons used to
select the operating range of the radar. The range selections are from
5 to 300 NM full scale. In FP mode, additional ranges of 500 and 1000
NM are available. The up arrow selects increasing ranges, and the
down arrow selects decreasing ranges. Each of the five range rings on
the display has an associated marker that annunciates its range.
A28–1146–111
REV 2
Operating Controls
3-9
PRIMUSR 660 Digital Weather Radar System
WC–660 WEATHER RADAR CONTROLLER OPERATION
The controls and display features of the WC–660 Weather Radar
Controller are indexed and identified in figure 3–4. Brightness levels for
all legends and controls on the indicator are controlled by the dimming
bus for the aircraft panel.
OFF
OFF
RCT
STAB
TGT
SECT
+
0
15
–
AD–51772@
WC–660 Weather Radar Controller Configurations
Figure 3–4
NOTES:
1. A WC–650 Weather Radar Controller can be installed
in the aircraft. Consult the aircraft installed equipment
configuration listing for details. Except as noted,
operation of the WC–650 Weather Radar Controller is
identical to the WC–660 Weather Radar Controller.
2. Controllers are available with and without the LSS
function.
3. When single or dual radar controllers are used, the
radar data is displayed on the EFIS, and/or an MFD or
navigation display (ND).
Operating Controls
3-10
A28–1146–111
REV 2
PRIMUSR 660 Digital Weather Radar System
1
RANGE
The RANGE switches are two momentary contact buttons that are used
to select the operating range of the radar (and LSS if installed). The
system permits selection of ranges in WX mode from 5 to 300 NM full
scale. In the flight plan (FPLN) mode, additional ranges of 500 and
1000 miles are permitted. The up arrow selects increasing ranges,
while the down arrow selects decreasing ranges. One–half the
selected range is annunciated at the one–half scale range mark on the
EHSI.
NOTE:
2
Some integrated avionics systems incorporate radar range
with the map display range control on a MFD/ND display.
RCT (RAIN ECHO ATTENUATION
TECHNIQUE REACT))
COMPENSATION
This switch position turns on RCT.
The REACT circuitry compensates for attenuation of the radar signal
as it passes through rainfall. The cyan field indicates areas where
further compensation is not possible. Any target detected within the
cyan field cannot be calibrated and should be considered dangerous.
All targets in the cyan field are displayed as fourth level precipitation,
magenta.
RCT is a submode of the WX mode and selecting RCT forces the
system to preset gain. When RCT is selected, the RCT legend is
displayed on the EFIS/MFD.
NOTES:
1. REACT’S three functions (attenuation compensation,
cyan field, and forcing targets to magenta) are
switched on and off with the RCT switch.
2. Refer to Section 5, Radar Facts, for a description of
REACT.
3
STAB (STABILIZATION)
The STAB button turns the pitch and roll stability ON and OFF. It is also
used with the hidden modes.
NOTE:
Some controllers annunciate OFF when stabilization is OFF.
A28–1146–111
REV 2
Operating Controls
3-11
PRIMUSR 660 Digital Weather Radar System
4
TGT (TARGET)
The TGT switch is an alternate–action, button that enables and disables
the radar target alert feature. Target alert is selectable in all but the
300–mile range. When selected, target alert monitors beyond the selected
range and 7.5 on each side of the aircraft heading. If a return with certain
characteristics is detected in the monitored area, the target alert changes
from the green armed condition to the yellow TGT warning condition. This
annunciation advises the pilot that a potentially hazardous target lies
directly in front and outside of the selected range. When this warning is
received, the pilot should select longer ranges to view the questionable
target. Note that target alert is inactive within the selected range.
Selecting target alert forces the system to preset gain. Target alert can
only be selected in the WX and FP modes.
In order to activate target alert, the target must have the depth and
range characteristics described in table 3–3.
Selected Range
(NM)
Minimum Target
Depth (NM)
Target Range
(NM)
5
5
5–55
10
5
10–60
25
5
25–75
50
5
50–100
100
5
100–150
200
5
200–250
300
N/A
N/A
FP (Flight Plan)
5
5–55
WC–660 Controller Target Alert Characteristics
Table 3–3
NOTE:
5
When on the ground, in FSBY mode, pushing STAB
four times in three seconds, overrides forced standby.
SECT (SCAN SECTOR)
The SECT switch is an alternate–action button that is used to select
either the normal 12 looks/minute 120 scan or the faster update 24
looks/minute 60 sector scan.
Operating Controls
3-12
A28–1146–111
REV 2
PRIMUSR 660 Digital Weather Radar System
6
TILT
The TILT knob is a rotary control that is used to select the tilt angle of
antenna beam with relation to the horizon. CW rotation tilts beam upward
0 to 15; ccw rotation tilts beam downward 0 to –15. The range
between +5 and –5 is expanded for ease of setting. A digital readout
of the antenna tilt angle is displayed on the EFIS.
WARNING
TO AVOID FLYING UNDER OR OVER STORMS, FREQUENTLY
ADJUST THE TILT TO SCAN BOTH ABOVE AND BELOW YOUR
FLIGHT LEVEL.
7
LSS (LIGHTNING SENSOR SYSTEM) (OPTIONAL)
The LSS switch is an optional four–position rotary switch that selects
the LSS operating modes described below:
OFF – In this position all power is removed from the LSS.
SBY (Standby) –In this position the display of LSS data is inhibited,
but the LSS still accumulates data.
LX (Lightning Sensor System) –In this position the LSS is fully
operational and it displays LSS data on the indicator.
CLR/TST (Clear/Test) –In this position, accumulated data is
cleared from the memory of the LSS. After 3 seconds the test mode
is initiated in the LSS.
8
SLV (SLAVE) (DUAL INSTALLATIONS ONLY)
The SLV annunciator is only used in dual controller installations. With
dual controllers, one controller can be slaved to the other by selecting
OFF on that controller only, with the RADAR mode switch. This slaved
condition is annunciated with the SLV annunciator. The slave mode
allows one controller to set the modes of the RTA for both sweep
directions. In the slave mode, all EFIS WX displays are indentical and
updated on each sweep.
With dual controllers, both controllers must be off before the radar
system turns off.
A28–1146–111
REV 2
Operating Controls
3-13
PRIMUSR 660 Digital Weather Radar System
9
RADAR
This rotary switch is used to select one of the following functions.
OFF – This position turns off the radar system.
STBY (Standby) – This position places the radar system in
standby; a ready state, with the antenna scan stopped, the
transmitter inhibited, and the display memory erased. STBY is
displayed on the EFIS/MFD.
WX (Weather) – This position selects the weather detection mode.
The system is fully operational and all internal parameters are set
for enroute weather detection.
If WX is selected before the initial RTA warmup period is complete
(approximately 45 to 90 seconds), the WAIT legend is displayed on
the EFIS/MFD. In WAIT mode, the transmitter and antenna scan are
inhibited and the display memory is erased. When the warmup is
complete, the system automatically switches to the WX mode.
The system, in preset gain, is calibrated as described in table 3–4.
ÁÁÁÁÁÁ
ÁÁÁÁÁÁ
ÁÁÁÁÁÁ
ÁÁÁÁÁÁ
ÁÁÁÁÁÁ
ÁÁÁÁÁ
ÁÁÁÁÁÁÁÁÁÁ
ÁÁÁÁÁÁ
ÁÁÁÁÁÁ
ÁÁÁÁÁ
ÁÁÁÁÁÁÁÁÁÁ
Rainfall Rate
Color
in/hr
mm/hr
.04–.16
1–4
Green
.16–.47
4–12
Yellow
.47–2
12–50
Red
>2
>5 0
Magenta
Rainfall Rate Color Coding
Table 3–4
GMAP (Ground Mapping) – The GMAP position puts the radar
system in the ground mapping mode. The system is fully
operational and all parameters are set to enhance returns from
ground targets.
NOTE:
REACT or TGT modes are not selectable in GMAP.
WARNING
WEATHER TYPE TARGETS ARE NOT CALIBRATED WHEN
THE RADAR IS IN THE GMAP MODE. BECAUSE OF THIS, DO NOT
USE THE GMAP MODE FOR WEATHER DETECTION.
Operating Controls
3-14
A28–1146–111
REV 2
PRIMUSR 660 Digital Weather Radar System
As a constant reminder that GMAP is selected, the GMAP legend is
displayed in the mode field, and the color scheme is changed to cyan,
yellow, and magenta. Cyan represents the least reflective return,
yellow is a moderate return, and magenta is a strong return.
If GMAP is selected before the initial RTA warmup period is complete
(approximately 45 to 90 seconds), the white WAIT legend is displayed
in the mode field. In wait mode, the transmitter and antenna scan are
inhibited and the memory is erased. When the warmup period is
complete, the system automatically switches to the GMAP mode.
NOTE:
Some installations have controllers that have a WX/GMAP
select switch. In this case, the radar mode switch provides an
ON selection. The separate WX/GMAP switch is used to
select either WX (weather) or GMAP (ground mapping).
FP (Flight Plan) – The FP position puts the radar system in the flight
plan mode, that clears the screen of radar data. This allows the radar
controller to select a range for display (on EFIS) of mapping
information at very long ranges.
NOTE:
In the FP mode, the radar RTA is put in standby, and the
FLTPLN legend is displayed in the mode field.
The target alert mode can be used in the FP mode. With target alert
on and the FP mode selected, the target alert armed annunciation
(green TGT) is displayed. The RTA searches for a hazardous
target from 5 to 55 miles and ±7.5 degrees of dead ahead. No radar
targets are displayed. If a hazardous target is detected, the target
alert armed annunciation switches to the alert annunciation (amber
TGT). This advises the pilot that a hazardous target is in his
flightpath and he should select the WX mode to view it.
NOTE:
When displaying checklist, the TGT function is inoperative.
TST (Test) – The TST position selects the radar test mode. A
special test pattern is displayed to verify system operation. The
TEST legend is displayed in the mode field. Refer to Section 4,
Normal Operation, for a description of the test pattern.
WARNING
IN THE TEST MODE, THE TRANSMITTER IS ON AND RADIATING
X–BAND MICROWAVE ENERGY. REFER TO SECTION 6, MAXIMUM PERMISSIBLE EXPOSURE LEVEL (MPEL).
A28–1146–111
REV 2
Operating Controls
3-15
PRIMUSR 660 Digital Weather Radar System
FSBY (FORCED STANDBY)
FSBY is an automatic, nonselectable radar mode. As an installation
option, the RTA can be wired to the weight–on–wheels (WOW) squat
switch. When wired, the RTA is in the FSBY mode when the aircraft is
on the ground. In FSBY mode, the transmitter and antenna scan are
both inhibited, the display memory is erased, and the FSBY legend is
displayed in the mode field. When in the FSBY mode, pushing the STAB
button four times in three seconds restores normal operation.
NOTE:
If a WC–650 Weather Radar Controller is installed, FSBY is
overridden by simultaneously pushing both range arrow
buttons.
The FSBY mode is a safety feature that inhibits the transmitter on the
ground to eliminate the X–band microwave radiation hazard. Refer to
Section 6, Maximum Permissible Exposure Level (MPEL).
WARNING
STANDBY OR FORCED STANDBY MODE MUST BE VERIFIED IN
GROUND OPERATIONS BY THE OPERATOR TO ENSURE
SAFETY FOR GROUND PERSONNEL.
In installations with two radar controllers, it is only necessary to override
forced standby from one controller.
If either controller is returned to standby mode while weight is on
wheels, the system returns to the forced standby mode.
10
GAIN
The GAIN is a single turn rotary control and push/pull switch that is used
to control the receiver gain. When the GAIN switch is pushed, the
system enters the preset, calibrated gain mode. Calibrated gain is the
normal mode and is used for weather avoidance. In calibrated gain, the
rotary portion of the GAIN control does nothing.
When the GAIN switch is pulled out, the system enters the variable
gain mode. Variable gain is useful for additional weather analysis and
for ground mapping. In WX mode, variable gain can increase receiver
sensitivity over the calibrated level to show weak targets or it can
be reduced below the calibrated level to eliminate weak returns.
WARNING
LOW VARIABLE GAIN SETTINGS CAN ELIMINATE HAZARDOUS
TARGETS FROM THE DISPLAY.
Operating Controls
3-16
A28–1146–111
REV 2
PRIMUSR 660 Digital Weather Radar System
In GMAP mode, variable gain is used to reduce the level of strong
returns from ground targets.
Minimum gain is attained with the control at its full ccw position. Gain
increases as the control is rotated in a cw direction from full ccw at full
cw position, the gain is at maximum.
The VAR legend annunciates variable gain. Selecting RCT or TGT
forces the system into calibrated gain.
NOTE:
Some controllers have a preset position on the rotary knob.
Rotating the knob to PRESET provides calibrated gain
functions. Rotating the knob out of the PRESET position
allows variable gain operation.
A28–1146–111
REV 2
Operating Controls
3-17/(3-18 blank)
PRIMUSR 660 Digital Weather Radar System
4.
Normal Operation
PRELIMINARY CONTROL SETTINGS
Table 4–1 gives the power–up procedure for the PRIMUSR 660 Digital
Weather Radar System.
Step
1
Procedure
Verify that the system controls are in the positions
described below before powering up the radar system.
Mode control: Off
GAIN control: Preset Position
TILT control:
+15
2
Take the following precautions if the radar system is operated
in any mode other than standby or forced standby while the
aircraft is on the ground:
D
Direct nose of aircraft so that antenna scan sector is
free of large metallic objects, such as hangars or other
aircraft for a minimum distance of 100 feet (30 meters),
and tilt the antenna fully upwards.
D
Do not operate the radar system during aircraft refueling or
during refueling operations within 100 feet (30 meters).
Do not operate the radar if personnel are standing too
close to the 120_ forward sector of aircraft. (Refer to
Section 6, Maximum Permissible Exposure Level, in this
manual.)
Operating personnel should be familiar with FAA AC
20–68B, which is reproduced in Appendix A of this
manual.
D
D
3
If the system is being used with an EFIS display, power–up
by selecting the weather display on the EHSI. Apply power
to the radar system using either the indicator or controller
power controls.
4
Select either standby or test mode, as shown in figure 4–1.
PRIMUSR 660 Power–Up Procedure
Table 4–1 (cont)
A28–1146–111
REV 2
Normal Operation
4-1
PRIMUSR 660 Digital Weather Radar System
Step
Procedure
5
When power is first applied, the radar is in WAIT for
approximately 90 seconds to allow the magnetron to warm
up. Power interruptions lasting less than 3 seconds result
in a 6–second wait period.
NOTE: If forced standby is incorporated, it is necessary to exit forced
standby.
WARNING
OUTPUT POWER IS RADIATED IN TEST MODE.
6
After the warm–up, select the test mode and verify that the
test pattern is displayed, as shown in figure 4–2. If the
radar is being used with an EFIS, the test pattern is similar.
The antenna position indicator (API) is shown as a yellow
arc at the top of the display.
NOTE: The API (a strap option) paints and unpaints on alternate sweeps to
supply a continuous indication of picture bus activity. The color of the
text does not change on alternate sweeps.
7
Verify that the azimuth marks, target alert (TGT), and
sector scan controls are operational.
PRIMUSR 660 Power–Up Procedure
Table 4–1
Normal Operation
4-2
A28–1146–111
REV 2
PRIMUSR 660 Digital Weather Radar System
TGT OR VAR ANNUNCIATOR
TGT::
P660 WX
MODE
ANNUNCIATIONS
WX RANGE
RINGS
(WHITE)
STBY (GREEN)
TEST (GREEN)
WX (GREEN)
RCT (GREEN)
GMAP (GREEN)
WAIT (AMBER)
FAIL ”N” (AMBER)
FPLN
DTRK
315
VAR::
MAG1
321
TARGET ALERT
– GREEN–SELECTED
– AMBER TGT DETECTED
VARIABLE GAIN (AMBER)
TGT
TGT ALERT ON:
RED
TGT ALERT OFF:
BLACK AND
NOISE BAND
FMS1
130 NM
TEST
+11
TEXT AREA
ANTENNA
TILT
ANGLE
V
GRAY
VOR1
MAGENTA
50
REACT OFF:
BLACK
REACT ON:
CYAN
VOR2
HDG
319
BLUE
25
15
GSPD
260 KTS
YELLOW
RED
WX RANGE
ANNUNCIATOR
(WHITE)
NOTES:
GREEN
1. IF THE BITE DETECTS A FAULT IN TEST MODE, FAIL ”N” WILL BE SHOWN.
”N” IS A FAULT CODE.
2. ANY FAULT CODE CAN ALSO BE DISPLAYED IN THE MAINTENANCE MODE.
IN THAT CASE, IT REPLACES THE ANTENNA TILT ANGLE.
AD–51774@
EFIS Test Pattern (Typical) 120_ Scan Shown
Figure 4–1
AD–51773@
Indicator Test Pattern 120_ Scan (WX),
With TEXT FAULT Enabled
Figure 4–2
A28–1146–111
REV 2
Normal Operation
4-3
PRIMUSR 660 Digital Weather Radar System
NOTES:
1. Refer to the specific EFIS manual for a detailed
description.
2. The example shown is for installations with TEXT
FAULT disabled.
Standby
When Standby is selected, and the radar is not in dual control mode
(refer to table 2–1, dual control mode truth table, for dual control
operation), the antenna is stowed in a tilt–up position and is neither
scanning nor transmitting.
Standby should be selected when the pilot wants to keep power applied
to the radar without transmitting.
Radar Mode – Weather
For purposes of weather avoidance, pilots should familiarize
themselves with FAA Advisory Circular AC 00–24B (1–20–83).Subject:
”Thunderstorms.” The advisory circular is reproduced in Appendix A of
this manual.
To help the pilot categorize storms as described in the advisory circular
referenced above, the radar receiver gain is calibrated in the WX mode
with the GAIN control in the preset position. The radar is not calibrated
when variable gain is being used, but calibration is restored if RCT or
target alert (TGT) is selected.
To aid in target interpretation, targets are displayed in various colors.
Each color represents a specific target intensity. The intensity levels
chosen are related to the National Weather Service (NWS) video
integrated processor (VIP) levels.
In the WX mode, the system displays five levels as black, green, yellow,
red, and magenta in increasing order of intensity.
If RCT is selected, the radar receiver adjusts the calibration
automatically to compensate for attenuation losses, as the radar pulse
passes through weather targets on its way to illuminate other targets.
There is a maximum extent to which calibration can be adjusted. When
this maximum value is reached, REACT compensation ceases. At this
point, a cyan field is added to the display to indicate that no further
compensation is possible.
Normal Operation
4-4
A28–1146–111
REV 2
PRIMUSR 660 Digital Weather Radar System
In the absence of intervening targets, the range at which the cyan field
starts is approximately 290 NM with a 12–inch antenna. For the 18–inch
antenna, the cyan field starts beyond 300 NM and therefore is not seen
if there are no intervening targets.
The RCT feature includes attenuation compensation (Refer to Section
5, Radar Facts, for a description of attenuation compensation.). Rainfall
causes attenuation and attenuation compensation modifies the color
calibration to maintain calibration regardless of the amount of
attenuation. Modifying the color calibration results in a change in the
point where calibration can no longer keep the radar system calibrated
for red level targets. The heavier the rainfall, the greater the attenuation
and the shorter the range where extended sensitivity time control
(XSTC) runs out of control. Therefore, the range at which the cyan
background starts varies depending on the amount of attenuation. The
greater the attenuation, the closer the start of the cyan field.
The radar’s calibration includes a nominal allowance for radome losses.
Excessive losses in the radome seriously affect radar calibration. One
possible means of verification are signal returns from known targets.
Honeywell recommends that the pilot report evidence of weak returns
to ensure that radome performance is maintained at a level that does
not affect radar calibration.
Target alert can be selected in any WX range. The target alert circuit
monitors for hazardous targets within ±7.5_ of the aircraft centerline.
Radar Mode – Ground Mapping
NOTE:
Refer to Tilt Management in Section 5, Radar Facts, for
additional information on the use of tilt control.
Ground–mapping operation is selected by setting the controls
to GMAP. The TILT control is turned down until a usable amount of
navigable terrain is displayed. The degree of down–tilt depends on the
aircraft altitude and the selected range.
The receiver sensitivity time control (STC) characteristics are altered
to equalize ground–target reflection versus range. As a result, selecting
preset GAIN generally creates the desired mapping display. However,
the pilot can control the gain manually (by selecting manual gain and
rotating the GAIN control) to help achieve an optimum display.
With experience, the pilot can interpret the color display patterns that
indicate water regions, coast lines, hilly or mountainous regions, cities,
or even large structures. A good learning method is to practice
ground–mapping during flights in clear visibility where the radar display
can be visually compared with the terrain.
A28–1146–111
REV 2
Normal Operation
4-5
PRIMUSR 660 Digital Weather Radar System
Test Mode
The PRIMUSR 660 Digital Weather Radar System has a self–test mode
and a maintenance function.
In the self–test (TST) mode a special test pattern is displayed as
illustrated earlier in this section. The functions of this pattern are as
follows:
D
Color Bands – A series of black/green/yellow/red/cyan/white/
magenta/blue bands, indicate that the signal to color conversion
circuits are operating normally.
The maintenance function lets the pilot or the line maintenance
technician determine the major fault areas. The fault data can be
displayed in one of two ways (selected at the time of installation):
- TEXT FAULT – A plain English text indicating the failure is placed
in the test band
- FAULT CODE – A fault code is displayed, refer to the
maintenance manual for an explanation.
The indicator or EFIS display indicates a fault as noted below.
D
Dedicated Radar Indicator – A FAIL annunciation is shown at the
top left corner of the test pattern. It indicates that the built–in test
equipment (BITE) circuitry is detecting a malfunction. The exact
nature of the malfunction can be seen by selecting TEST. (Refer to
Section 8, In–Flight Troubleshooting.)
D
EFIS/MFD/ND –Faults are normally shown when test is selected.
NOTES:
1. Some weather failures on EFIS are annunciated
with an amber WX.
2. Some EFIS installations can power up with an
amber WX if weather radar is turned off.
3. If the fault code option is selected, they are shown
with the FAIL annunciation (e.g., FAIL 13).
Normal Operation
4-6
A28–1146–111
REV 2
PRIMUSR 660 Digital Weather Radar System
5.
Radar Facts
RADAR OPERATION
The PRIMUSR 660 Digital Weather Radar works on an echo principle.
The radar sends out short bursts of electromagnetic energy that travel
through space as a radio wave. When the traveling wave of energy
strikes a target, some of the energy reflects back to the radar receiver.
Electronic circuits measure the elapsed time between the transmission
and the reception of the echo to determine the distance to the target
(range). Because the antenna beam is scanning right and left in
synchronism with the sectoring sweep on the indicator, the bearing of
the target is found, as shown in figure 5–1.
The indicator with the radar is called a plan–position indicator (PPI)
type. When an architect makes a drawing for a house, one of the views
he generally shows is a plan view, a diagram of the house as viewed
from above. The PPI aboard an airplane presents a cross sectional
picture of the storm as though viewed from above. In short, it is NOT
a horizon view of the storm cells ahead but rather a MAP view. This
positional relationship of the airplane and the storm cells, as displayed
by the indicator, is shown in figure 5–1.
A28–1146–111
REV 2
Radar Facts
5-1
PRIMUSR 660 Digital Weather Radar System
AIRCRAFT HEADING
100
80
60
40
+0.6
WX
20
AD–12055–R2@
Positional Relationship of an Airplane and
Storm Cells Ahead as Displayed on Indicator
Figure 5–1
The drawing is laid out to simulate the face of the indicator with the
semicircular range marks. To derive a clearer concept of the picture that
the indicator presents, imagine that the storm is a loaf of sliced bread
standing on end. From a point close to the surface of earth, it towers
to a high–altitude summit. Without upsetting the loaf of bread, the radar
removes a single slice from the middle of the loaf, and places this slice
flat upon the table. Looking at the slice of bread from directly above, a
cross section of the loaf can be seen in its broadest dimension. In the
same manner, the radar beam literally slices out a horizontal cross
section of the storm and displays it as though the viewer was looking
at it from above, as shown in figure 5–2. The height of the slice selected
for display depends upon the altitude and also upon the upward or
downward TILT adjustment made to the antenna.
Radar Facts
5-2
A28–1146–111
REV 2
PRIMUSR 660 Digital Weather Radar System
ANTENNA
THUNDERSTORM
TRANSMITTER
INDICATOR
SWEEP ORIGIN
THUNDERSTORM
SCAN
AD–17716–R2@
Antenna Beam Slicing Out Cross Section of Storm
During Horizontal Scan
Figure 5–2
Weather radar can occasionally detect other aircraft, but it is not
designed for this purpose and should never be considered a
collision–avoidance device. Nor is weather radar specifically designed
as a navigational aid, but it can be used for ground mapping by tilting
the antenna downward. Selecting the GMAP mode enhances returns
from ground targets.
A28–1146–111
REV 2
Radar Facts
5-3
PRIMUSR 660 Digital Weather Radar System
When the antenna is tilted downward for ground mapping, two
phenomena can occur that can confuse the pilot. The first is called ”The
Great Plains Quadrant Effect” that is seen most often when flying over
the great plains of central United States. In this region, property lines
(fences), roads, houses, barns, and power lines tend to be laid out in
a stringent north–south/east–west orientation. As a result, radar
returns from these cardinal points of the compass tend to be more
intense than returns from other directions and the display shows these
returns as bright north/south/east/west spokes overlaying the ground
map.
The second phenomenon is associated with radar returns from water
surfaces (generally called sea clutter), as shown in figure 5–3. Calm
water reflects very low radar returns since it directs the radar pulses
onward instead of backward (i.e. the angle of incidence from mirrored
light shone on it at an angle). The same is true when viewing choppy
water from the upwind side. The downwind side of waves, however, can
reflect a strong signal because of the steeper wave slope. A relatively
bright patch of sea return, therefore, indicates the direction of surface
winds.
REFLECTION
CALM WATER OR WATER WITH
SWELLS DOES NOT PROVIDE
GOOD RETURN.
CHOPPY WATER PROVIDES
GOOD RETURN FROM
DOWNWIND SIDE OF WAVES
WIND DIRECTION AT
SURFACE OF WATER
PATCH
OF SEA
RETURNS
AD–12056–R2@
Sea Returns
Figure 5–3
Radar Facts
5-4
A28–1146–111
REV 2
PRIMUSR 660 Digital Weather Radar System
TILT MANAGEMENT
The pilot can use tilt management techniques to minimize ground
clutter when viewing weather targets.
Assume the aircraft is flying over relatively smooth terrain that is
equivalent to sea level in altitude. The pilot must make adjustments for
the effects of mountainous terrain.
The figures below help to visualize the relationship between tilt angle,
flight altitude, and selected range. Figures 5–4 and 5–5 show the
distance above and below aircraft altitude that is illuminated by the
flat–plate radiator during level flight with 0_ tilt. Figures 5–6 and 5–7
show a representative low altitude situation, with the antenna adjusted
for 2.8_ up–tilt.
ELEVATION IN FEET
80,000
70,000
60,000
41,800 FT
ZERO TILT
50,000
ÎÎ
ÎÎ
ÎÎ
ÎÎ
10,500 FT
10,500 FT
30,000
7.9
20,000
10,000
0
0
20,000 FT
Î
ÎÎ
CENTER OF RADAR BEAM
20,000 FT
41,800 FT
25
50
100
RANGE NAUTICAL MILES
AD–35693@
Radar Beam Illumination High Altitude
12–Inch Radiator
Figure 5–4
ELEVATION IN FEET
80,000
70,000
ZERO TILT
60,000
7,400 FT
50,000
30,000
10,000
0
ÎÎÎ
ÎÎ
ÎÎ
ÎÎ
5.6
20,000
0
7,400 FT
25
29,000 FT
14,800 FT
CENTER OF RADAR BEAM
14,800 FT
29,000 FT
50
RANGE NAUTICAL MILES
ÎÎÎÎ
ÎÎÎÎ
100
AD–17717–R1@
Radar Beam Illumination High Altitude
18–Inch Radiator
Figure 5–5
A28–1146–111
REV 2
Radar Facts
5-5
PRIMUSR 660 Digital Weather Radar System
Radar Beam Illumination Low Altitude
12–Inch Radiator
Figure 5–6
AD54258@
Radar Beam Illumination Low Altitude
18–Inch Radiator
Figure 5–7
Radar Facts
5-6
A28–1146–111
REV 2
PRIMUSR 660 Digital Weather Radar System
Tables 5–1 and 5–2 give the approximate tilt settings that the ground
targets begin to be displayed on the image periphery for 12– and
18–inch radiators. The range that the ground targets can be observed
is affected by the curvature of the earth, the distance from the aircraft
to the horizon, and altitude above the ground. As the tilt control is
rotated downward, ground targets first appear on the display at less
than maximum range.
To find the ideal tilt angle after the aircraft is airborne, adjust the TILT
control so that groundclutter does not interfere with viewing of weather
targets. Usually, this can be done by tilting the antenna downward in 1_
increments until ground targets begin to appear at the display periphery.
Ground returns can be distinguished from strong storm cells by
watching for closer ground targets with each small downward increment
of tilt. The more the downward tilt, the closer the ground targets that
are displayed.
When ground targets are displayed, move the tilt angle upward in 1_
increments until the ground targets begin to disappear. Proper tilt
adjustment is a pilot judgment, but typically the best tilt angle lies where
ground targets are barely visible or just off the radar image.
Tables 5–1 and 5–2 give the approximate tilt settings required for
different altitudes and ranges. If the altitude changes or a different
range is selected, adjust the tilt control as required to minimize ground
returns.
A28–1146–111
REV 2
Radar Facts
5-7
PRIMUSR 660 Digital Weather Radar System
RANGE
SCALE
(NM)
5
10
300
LINE OF
SIGHT
(NM)
25
50
100
200
–12
–4
–1
+1
246
–10
–3
0
+1
230
–8
–2
0
+1
–6
–1
+1
–4
0
+1
(TILT LIMITED
REGION)
40,000
35,000
30,000
25,000
20,000
15,000
–11
–2
+1
+2
10,000
–6
–0
+2
+2
5,000
–5
–1
+2
+2
4,000
–4
0
+2
+3
3,000
–2
+1
+3
+3
2,000
0
+2
+3
+3
1,000
+2
+3
+3
(LINE OF SIGHT LIMITED REGION)
ALTITUDE
(FEET)
213
195
174
151
123
87
78
67
55
39
AD–29830–R2@
Approximate Tilt Setting for Minimal Ground Target Display
12–Inch Radiator
Table 5–1
Tilt angles shown are approximate. Where the tilt angle is not listed, the
operator must exercise good judgment.
NOTE:
Radar Facts
5-8
The line of sight distance is nominal. Atmospheric conditions
and terrain offset this value.
A28–1146–111
REV 2
PRIMUSR 660 Digital Weather Radar System
RANGE
SCALE
(MILES)
5
10
25
50
100
200
LINE OF
SIGHT
(MILES)
–13
–5
–2
–1
246
–11
–4
–1
0
230
–9
–3
–1
0
213
–7
–2
0
–5
–1
0
35,000
30,000
25,000
20,000
15,000
–12
–3
–1
+1
10,000
–7
–1
0
+1
5,000
–7
–2
0
+1
4,000
–5
–1
+1
+2
3,000
–3
0
+1
+2
2,000
–1
+1
+2
+2
1,000
+1
+2
+2
195
(LINE OF
SIGHT LIMITED REGION)
40,000
(TILT LIMITED
REGION)
ALTITUDE
(FEET)
174
151
123
87
78
67
55
39
AD–35711@
Approximate Tilt Setting for Minimal Ground Target Display
18–Inch Radiator
Table 5–2
Tilt angles shown are approximate. Where the tilt angle is not listed, the
operator must exercise good judgment.
NOTE:
The line of sight distance is nominal. Atmospheric conditions
and terrain offset this value.
A28–1146–111
REV 2
Radar Facts
5-9
PRIMUSR 660 Digital Weather Radar System
Tilt management is often misunderstood. It is crucial to safe operation
of airborne weather radar. If radar tilt angles are not properly managed,
weather targets can be missed or underestimated.
The upper levels of convective storms are the most dangerous because
of the probability of violent windshears and large hail. But hail and
windshear are not very reflective because they lack reflective liquid
water.
The figures that follow show the relationship between flight situations
and the correct tilt angle. The first describes a high altitude situation; the
second describes a low altitude situation.
D
The ideal tilt angle shows a few ground targets at the edge of the
display as shown in see figure 5–8.
GROUND
RETURN
AD–35694@
Ideal Tilt Angle
Figure 5–8
D
Earth’s curvature can be a factor if altitude is low enough, or if the
selected range is long enough, as shown in figure 5–9.
GROUND
RETURN
AD–35695@
Earth’s Curvature
Figure 5–9
Radar Facts
5-10
A28–1146–111
REV 2
PRIMUSR 660 Digital Weather Radar System
D
Convective thunderstorms become much less reflective above the
freezing level. This reflectivity decreases gradually over the first
5000 to 10,000 feet above the freezing level, as shown in figure
5–10.
FREEZING LEVEL
AD–35696@
Convective Thunderstorms
Figure 5–10
The aircraft in figure 5–10 has a clear radar indication of the
thunderstorm, probably with a shadow in the ground returns behind
it.
D
If the tilt angle shown in figure 5–11 is not altered, the thunderstorm
appears to weaken as the aircraft approaches it.
FREEZING LEVEL
AD–35697@
Unaltered Tilt
Figure 5–11
A28–1146–111
REV 2
Radar Facts
5-11
PRIMUSR 660 Digital Weather Radar System
D
Proper tilt management demands that tilt be changed continually
when approaching hazardous weather so that ground targets are
not painted by the radar beam, as shown in figure 5–12.
FREEZING
LEVEL
AD–35698@
Proper Tilt Technique
Figure 5–12
D
After heading changes in a foul weather situation, the pilot should
adjust the tilt to see what was brought into the aircraft’s flightpath by
the heading changes, as shown in figure 5–13.
DISPLAY BEFORE
TURN
DISPLAY AFTER
TURN
THUNDERSTORM WAS OUT
OF DISPLAY BEFORE TURN
AND IS NOW UNDER BEAM
AD–30429@
Tilt Management With Heading Changes
Figure 5–13
Radar Facts
5-12
A28–1146–111
REV 2
PRIMUSR 660 Digital Weather Radar System
D
Under the right conditions, a dangerous thunder bumper can
develop in 10 minutes, and can in fact spawn and mature under the
radar beam as the aircraft approaches it, as shown in figure 5–14.
If flying at 400 kt groundspeed (GSPD), a fast developing thunderstorm
that spawns 67 NM in front of the aircraft can be large enough to
damage the aircraft by the time it arrives at the storm.
THUNDERSTORM MATURES
AS IT APPROACHES
FREEZING
LEVEL
AD–35699@
Fast Developing Thunderstorm
Figure 5–14
D
At low altitude, the tilt should be set as low as possible to get ground
returns at the periphery only, as shown in figure 5–15.
CORRECT
WRONG
FREEZING
LEVEL
AD–35700@
Low Altitude Tilt Management
Figure 5–15
Excess up–tilt should be avoided as it can illuminate weather above
the freezing level.
NOTE:
A28–1146–111
REV 2
The pilot should have freeze level information as a part of
the flight planning process.
Radar Facts
5-13
PRIMUSR 660 Digital Weather Radar System
D
The antenna size used on the aircraft alters the best tilt settings by
about 1_. However, tilt management is the same for either size, as
shown in figure 5–16.
AD–46703@
Antenna Size and Impact on Tilt Management
Figure 5–16
NOTE:
D
The 10– and 24–inch antennas are shown for illustration
purposes only.
Some of the rules of thumb are described below and shown in figure
5–17.
-
A 1_ look down angle looks down 100 ft per mile.
Bottom of beam is 1/2 beam width below tilt setting.
A 12–inch antenna grazes the ground at 100 NM if set to 0_ tilt
at 40,000 ft.
TILT
BEAM WIDTH
AD–35702@
Rules of Thumb
Figure 5–17
Radar Facts
5-14
A28–1146–111
REV 2
PRIMUSR 660 Digital Weather Radar System
STABILIZATION
The purpose of the stabilization system is to hold the elevation of the
antenna beam relative to the earth’s surface constant at all azimuths,
regardless of aircraft bank and pitch maneuvers. The stabilization
system uses the aircraft attitude source as a reference.
Several sources of error exist in any stabilization system.
Dynamic Error
Dynamic error is the basis of the stabilization system. Stabilization is
a corrective process. It logically follows that there must first be some
error to correct. In stabilization, this error is called dynamic. An
example of dynamic error occurs when a gust lifts the right wing and the
pilot instinctively raises the right aileron and lowers the left. In this
action, the pilot detects a changing (dynamic) error in aircraft attitude
and corrects it.
As the gust lifts the wing, the aircraft attitude source sends a continuous
stream of attitude change information to stabilization circuits that, in
turn, control the motors that raise and lower the beam. In short, a
dynamic error in aircraft attitude (as seen by the radar) is detected, and
the antenna attitude is corrected for it. Extremely small errors of less
than 1_ can be detected and compensated. However, the point is
ultimately reached where dynamic error is too small to be detected.
Without detection, there is no compensation.
Accelerative Error
One of the most common forms of error seen in a radar–antenna
stabilization system results from forces of acceleration on the aircraft
equipped with a vertical gyroscope. Acceleration forces result from
speeding up, slowing down, or turning. Radar stabilization
accuracy depends upon the aircraft vertical gyroscope. Therefore,
any gyroscopic errors accumulated through acceleration are
automatically imparted to the antenna stabilization system.
NOTE:
LASEREFR vertical reference systems do not suffer from
these acceleration effects.
A28–1146–111
REV 2
Radar Facts
5-15
PRIMUSR 660 Digital Weather Radar System
A vertical gyroscope contains a gravity–sensitive element, a
heavily dampened pendulous device that enables the gyro to erect
itself to earth gravity at the rate of approximately 2_/min. The pendulous
device is unable to differentiate between earth gravity and an
acceleration force. It tends to rest at a false–gravity position where the
forces of gravity and acceleration are equal. As long as the
acceleration force persists, the gyroscope precesses toward a
false–gravity position at the rate of approximately 2_/min. The radar
follows the gyroscope into error at the same rate. When the
acceleration force ceases, the gyroscope precesses back to true
gravity erection at the same rate.
Some vertical gyroscopes have provisions for deactivating the roll–
erection torque motor (whenever the airplane banks more
than approximately 6_) to reduce the effect of lateral
acceleration during turns. To some extent, stabilization error is
displayed in the radar image after any speed change and/or turn
condition. If the stabilization system seems to be in error because the
radar begins ground mapping on one side and not the other, or
because it appears that the tilt adjustment has slipped, verify
that aircraft has been in nonturning, constant–speed flight long enough
to let the gyroscope erect on true earth gravity.
When dynamic and acceleration errors are taken into account,
maintaining accuracy of 1/2 of 1_ or less is not always possible. Adjust
the antenna tilt by visually observing the ground return. Then, slowly
tilt the antenna upward until terrain clutter no longer enters the display,
except at the extreme edges.
Antenna Mounting Error
If the radar consistently displays more ground returns on one side or the
other during level flight over level ground, the antenna is probably
scanning on a slight diagonal, rather than level with the earth. The usual
cause is that the radar antenna is physically mounted slightly rotated
from the vertical axis of the aircraft. The procedure in table 5–3 and
figures 5–18, 5–19, and 5–20 can help you identify this type of problem.
On a vertical gyro equipped aircraft, the condition could be caused by
mistrim flying one wing low. The gyro erects to this condition and the
stabilization is not able to compensate.
Radar Facts
5-16
A28–1146–111
REV 2
PRIMUSR 660 Digital Weather Radar System
LEVEL FLIGHT STABILIZATION CHECK
Check stabilization in level flight using the procedure in table 5–3.
ÁÁÁÁ
ÁÁÁÁÁÁÁÁÁÁÁÁÁÁÁÁÁÁ
ÁÁÁÁ
ÁÁÁÁÁÁÁÁÁÁÁÁÁÁÁÁÁÁ
ÁÁÁÁ
ÁÁÁÁÁÁÁÁÁÁÁÁÁÁÁÁÁÁ
Step
Procedure
1
Trim the aircraft for straight and level flight in smooth,
clear air over level terrain.
2
Select the 50–mile range.
3
Rotate the tilt control until a band of ground returns
starts at the 40 NM range arc.
4
After several antenna sweeps, verify that ground
returns are equally displayed (figure 5–18). If returns
are only on one side of the radar screen or uneven
across the radar screen, a misalignment of the radar
antenna mounting is indicated.
ÁÁÁÁ
ÁÁÁÁÁÁÁÁÁÁÁÁÁÁÁÁÁÁ
ÁÁÁÁ
ÁÁÁÁÁÁÁÁÁÁÁÁÁÁÁÁÁÁ
ÁÁÁÁÁÁÁÁÁÁÁÁÁÁÁÁÁÁÁÁÁÁ
ÁÁÁÁÁÁÁÁÁÁÁÁÁÁÁÁÁÁÁÁÁÁ
ÁÁÁÁÁÁÁÁÁÁÁÁÁÁÁÁÁÁÁÁÁÁ
Stabilization in Straight and Level Flight Check Procedure
Table 5–3
NOTE:
Refer to Section 7, In–Flight Adjustments, for procedures to
adjust pitch and roll offsets.
Symmetrical Ground Returns
Figure 5–18
A28–1146–111
REV 2
Radar Facts
5-17
PRIMUSR 660 Digital Weather Radar System
100
80
60
40
wx
20
AD–17721–R2@
Ground Return Indicating Misalignment (Upper Right)
Figure 5–19
100
80
60
40
wx
20
AD–17722–R2@
Ground Return Indicating Misalignment (Upper Left)
Figure 5–20
Radar Facts
5-18
A28–1146–111
REV 2
PRIMUSR 660 Digital Weather Radar System
Wallowing (Wing Walk and Yaw) Error
A condition where the greatest intensity of ground targets wanders
around the screen over a period of several minutes should not be
confused with antenna mounting error. This phenomenon is caused by
the tendency for many aircraft to slowly wallow (roll and yaw axes
movement) with a cycle time of several minutes. The erection circuits
of the gyro chasing the wallow can intensify the effect of wandering
ground targets. IRS–equipped aircraft are less likely to show this
condition.
Roll Gain Error
If, when the aircraft is in a turn, you see ground returns on one side or
the other that are not present in level flight, the roll gain is most likely
misadjusted. The procedure in table 5–4, and figures 5–21, 5–22, and
5–23 can help you identify this type of problem. Figure 5–24 shows a
total lack of roll stabilization in a turn.
ROLL STABILIZATION (WHILE TURNING) CHECK
Once proper operation is established in level flight, verify stabilization
in a turn using this procedure.
ÁÁÁÁ
ÁÁÁÁÁÁÁÁÁÁÁÁÁÁÁÁÁÁ
ÁÁÁÁ
ÁÁÁÁÁÁÁÁÁÁÁÁÁÁÁÁÁÁ
ÁÁÁÁÁÁÁÁÁÁÁÁÁÁÁÁÁÁ
ÁÁÁÁ
ÁÁÁÁ
ÁÁÁÁÁÁÁÁÁÁÁÁÁÁÁÁÁÁ
ÁÁÁÁ
ÁÁÁÁÁÁÁÁÁÁÁÁÁÁÁÁÁÁ
ÁÁÁÁ
ÁÁÁÁÁÁÁÁÁÁÁÁÁÁÁÁÁÁ
ÁÁÁÁ
ÁÁÁÁÁÁÁÁÁÁÁÁÁÁÁÁÁÁ
ÁÁÁÁ
ÁÁÁÁÁÁÁÁÁÁÁÁÁÁÁÁÁÁ
ÁÁÁÁ
ÁÁÁÁÁÁÁÁÁÁÁÁÁÁÁÁÁÁÁÁÁ
ÁÁÁÁÁÁÁÁÁÁÁÁÁÁÁÁÁÁ
ÁÁÁÁÁÁÁÁÁÁÁÁÁÁÁÁÁÁÁÁÁ
ÁÁÁÁÁÁÁÁÁÁÁÁÁÁÁÁÁÁÁÁÁ
Step
Procedure
1
Place the aircraft in 20° roll to the right.
2
Note the radar display. It should contain appreciably no
more returns than found during level flight. See figure
5–24.
3
If returns display on the right side of radar indicator;
the radar system is understabilizing.
4
Targets on the left side of the radar display indicate the
system is overstabilizing. See figure 5–23.
NOTE: Proper radar operation in turns depends on the accuracy and stability of the
installed attitude source.
Stabilization in Turns Check Procedure
Table 5–4
A28–1146–111
REV 2
Radar Facts
5-19
PRIMUSR 660 Digital Weather Radar System
Symmetrical Ground Returns – Good Roll Stabilization
Figure 5–21
100
80
60
40
wx
20
AD–17721–R2@
Understabilization in a Right Turn
Figure 5–22
Radar Facts
5-20
A28–1146–111
REV 2
PRIMUSR 660 Digital Weather Radar System
100
80
60
40
wx
20
AD–17722–R2@
Overstabilization in a Right Turn
Figure 5–23
100
80
60
40
wx
20
AD–17723–R2@
Roll Stabilization Inoperative in a Turn
Figure 5–24
A28–1146–111
REV 2
Radar Facts
5-21
PRIMUSR 660 Digital Weather Radar System
Pitch Gain Error
If the aircraft is in a pitch maneuver and you see ground returns that are
not present in level flight, the pitch gain is most likely misadjusted. The
procedure in table 5–5 and figures 5–25, 5–26, and 5–27 can help you
identify this type of problem.
PITCH STABILIZATION CHECK
Once proper operation of the roll stabilization is established, verify pitch
stabilization using the procedure in table 5–5 and figures 5–25, 5–26,
and 5–27.
ÁÁÁÁÁ
ÁÁÁÁÁÁÁÁÁÁÁÁÁÁÁÁÁ
ÁÁÁÁÁ
ÁÁÁÁÁÁÁÁÁÁÁÁÁÁÁÁÁ
ÁÁÁÁÁ
ÁÁÁÁÁÁÁÁÁÁÁÁÁÁÁÁÁ
ÁÁÁÁÁ
ÁÁÁÁÁÁÁÁÁÁÁÁÁÁÁÁÁ
ÁÁÁÁÁ
ÁÁÁÁÁÁÁÁÁÁÁÁÁÁÁÁÁ
ÁÁÁÁÁ
ÁÁÁÁÁÁÁÁÁÁÁÁÁÁÁÁÁ
ÁÁÁÁÁ
ÁÁÁÁÁÁÁÁÁÁÁÁÁÁÁÁÁ
ÁÁÁÁÁ
ÁÁÁÁÁÁÁÁÁÁÁÁÁÁÁÁÁ
Step
Procedure
1
Complete the steps listed in table 5–3.
2
Place the aircraft between 5 and 10° pitch up.
3
Note the radar display. If it is correctly stabilized, there
is very little change in the ground returns.
4
If the display of ground returns resembles figure 5–26,
the radar is understabilized.
5
If the display of ground returns resembles figure 5–27,
the radar is overstabilized.
Pitch Stabilization In–Flight Check Procedure
Table 5–5
Symmetrical Ground Returns – Good Pitch Stabilization
Figure 5–25
Radar Facts
5-22
A28–1146–111
REV 2
PRIMUSR 660 Digital Weather Radar System
100
80
60
40
GMAP
20
AD–53797@
Understabilized in Pitch–Up
Figure 5–26
100
80
60
40
GMAP
20
AD–53798@
Overstabilized in Pitch–Up
Figure 5–27
Refer to Section 7, In–Flight Adjustments, for adjustment procedures.
A28–1146–111
REV 2
Radar Facts
5-23
PRIMUSR 660 Digital Weather Radar System
INTERPRETING WEATHER RADAR IMAGES
From a weather standpoint, hail and turbulence are the principal
obstacles to a safe and comfortable flight. Neither of these conditions
is directly visible on radar. The radar shows only the rainfall patterns that
these conditions are associated.
The weather radar can see water best in its liquid form, as shown in
figure 5–28 (not water vapor; not ice crystals; not hail when small and
perfectly dry). It can see rain, wet snow, wet hail, and dry hail when its
diameter is about 8/10 of the radar wavelength or larger. (At X–band,
this means that dry hail becomes visible to the radar at about 1–in.
diameter.)
REFLECTIVE LEVELS
WILL NOT REFLECT
WET HAIL – GOOD
VAPOR
RAIN – GOOD
ICE CRYSTALS
WET SNOW – GOOD
DRY HAIL – POOR
DRY SNOW – VERY POOR
SMALL DRY HAIL
AD–46704–R1@
Weather Radar Images
Figure 5–28
Radar Facts
5-24
A28–1146–111
REV 2
PRIMUSR 660 Digital Weather Radar System
The following are some truths about weather and flying, as shown in
figure 5–29.
D
Turbulence results when two air masses at different temperatures
and/or pressures meet.
D
This meeting can form a thunderstorm.
D
The thunderstorm produces rain.
D
The radar displays rain (thus revealing the turbulence).
D
In the thunderstorm’s cumulus stage, echoes appear on the display
and grow progressively larger and sharper. The antenna can be
tilted up and down in small increments to maximize the echo pattern.
D
In the thunderstorm’s mature stage, radar echoes are sharp and
clear. Hail occurs most frequently early in this stage.
D
In the thunderstorm’s dissipating stage, the rain area is largest and
shows best with a slight downward antenna tilt.
Radar can be used to look inside the precipitation area to spot zones
of present and developing turbulence. Some knowledge of meteorology
is required to identify these areas as being turbulent. The most
important fact is that the areas of maximum turbulence occur where
the most abrupt changes from light or no rain to heavy rain occur. The
term applied to this change in rate is rain gradient. The greater the
change in rainfall rate, the steeper the rain gradient. The steeper the
rain gradient, the greater the accompanying turbulence. More
important, however, is another fact: storm cells are not static or stable,
but are in a constant state of change. While a single thunderstorm
seldom lasts more than an hour, a squall line, shown in figure 5–30, can
contain many such storm cells developing and decaying over a much
longer period. A single cell can start as a cumulus cloud only 1 mile in
diameter, rise to 15,000 ft, grow within 10 minutes to 5 miles in
diameter and tower to an altitude of 60,000 feet or more. Therefore,
weather radar should not be used to take flash pictures of weather, but
to keep weather under continuous surveillance.
A28–1146–111
REV 2
Radar Facts
5-25
PRIMUSR 660 Digital Weather Radar System
VISIBLE CLOUD MASS
RAIN AREA
(ONLY THIS IS
VISIBLE ON RADAR)
RAINFALL RATE
RED ZONE
WITHIN
RAIN AREA
RED LEVEL*
0
20
40
60
NAUTICAL MILES
80
AD–12057–R3@
Radar and Visual Cloud Mass
Figure 5–29
As masses of warm, moist air are hurled upward to meet the colder air
above, the moisture condenses and builds into raindrops heavy
enough to fall downward through the updraft. When this precipitation is
heavy enough, it can reverse the updraft. Between these downdrafts
(shafts of rain), updrafts continue at tremendous velocities. It is not
surprising, therefore, that the areas of maximum turbulence are near
these interfaces between updraft and downdraft. Keep these facts in
mind when tempted to crowd a rain shaft or to fly over an
innocent–looking cumulus cloud.
Radar Facts
5-26
A28–1146–111
REV 2
PRIMUSR 660 Digital Weather Radar System
To find a safe and comfortable route through the precipitation area,
study the radar image of the squall line while closing in on the
thunderstorm area. In the example shown in figure 5–30, radar
observation shows that the rainfall is steadily diminishing on the left
while it is very heavy in two mature cells (and increasing rapidly in a third
cell) to the right. The safest and most comfortable course lies to the left
where the storm is decaying into a light rain. The growing cell on the
right should be given a wide berth.
AREAS OF MAXIMUM TURBULENCE
DECAYING
CELLS
GROWING
CELLS
MATURE CELLS
OUTLINE OF RAIN AREA VISIBLE TO RADAR
BEST DETOUR
AD–12058–R1@
Squall Line
Figure 5–30
A28–1146–111
REV 2
Radar Facts
5-27
PRIMUSR 660 Digital Weather Radar System
WEATHER DISPLAY CALIBRATION
Ground based Nexrad radars of the National Weather Service display
rainfall levels in dBZ, a decibel scaling of an arbitrary reflectivity factor
(Z). The formula for determining dBZ is: dBZ = 16 log R + 23, where R
is the rainfall rate in millimeters per hour. The Nexrad radar displays
rainfall in 15 color coded levels of 5 dBZ per step.
There is a close correspondence in rainfall rates between the colors in
the PRIMUSR airborne radars and color families in a Nexrad display. To
help the pilot in comparing them, table 5–6 shows PRIMUSR radar
colors, rainfall rates, and dBZ.
The dBZ rainfall intensity scale replaces the video integrated processor
(VIP) intensity scale used in the previous generation ground based
radars. Table 5–7 compares the classic VIP levels, rainfall rates, and
storm categories with the new dBZ levels. Refer to Section 6 of FAA
Advisory Circular AC–00–24B for additional information on VIP levels.
Table 5–6 also shows maximum calibrated range for each color level.
This is the maximum range where the indicated rainfall rate can be
detected if there is no intervening radar signal attenuation caused by
other precipitation. Beyond calibrated range, the precipitation appears
at a lower color level than it actually is. For example, (with a 12–inch
antenna) a red level storm can appear as a green level at 200 miles, as
you fly closer it becomes yellow, and then red at 130 miles. As covered
in the RCT description, intervening rainfall reduces the calibrated range
and the radar can incorrectly depict the true cell intensity.
The radar calibration includes a nominal allowance for radome losses.
Excessive losses in the radome seriously affect radar calibration. One
possible means of verification is signal returns from known ground
targets. It is recommended that you report evidence of weak returns to
ensure that radome performance is maintained at a level that does not
affect radar calibration.
To test for a performance loss, note the distance that the aircraft’s base
city, a mountain, or a shoreline can be painted from a given altitude.
When flying in familiar surroundings, verify that landmarks can still be
painted at the same distances.
Any loss in performance results in the system not painting the reference
target at the normal range.
Radar Facts
5-28
A28–1146–111
REV 2
PRIMUSR 660 Digital Weather Radar System
300 NAUTICAL MILES
DISPLAY
LEVEL
RAINFALL
RATE
MM/HR
RAINFALL
RATE
IN./HR
dBZ
MAXIMUM
CALIBRATE
D RANGE
(NM) 10–IN
AND 12–IN
FLAT–PLATE
4
(MAGENTA
)
GREATER
THAN
50
GREATER
THAN
2
GREATER
THAN
53
232
GREATER
THAN
300
GREATER
THAN
300
3
(RED)
12 – 50
0.5 – 2
40 – 53
130
190
230
2
(YELLOW
4 – 12
0.17 – 0.5
33 – 40
90
130
160
1
(GREEN)
1–4
0.04 – 0.17
23 – 33
55
80
100
0
(BLACK)
LESS THAN
1
LESS THAN
0.04
LESS THAN
23
–
–
–
MAXIMUM
CALIBRATE
D RANGE
(NM) 18–IN
FLAT–PLATE
MAXIMUM
CALIBRATE
D RANGE
(NM) 24–IN
FLAT–PLATE
ÁÁÁ
ÁÁÁÁ
ÁÁÁÁ
ÁÁÁÁ
ÁÁÁÁ
ÁÁÁÁ
ÁÁÁÁ
ÁÁÁ
ÁÁÁÁ
ÁÁÁÁ
ÁÁÁÁ
ÁÁÁÁ
ÁÁÁÁ
ÁÁÁÁ
ÁÁÁ
ÁÁÁÁ
ÁÁÁÁ
ÁÁÁÁ
ÁÁÁÁ
ÁÁÁÁ
ÁÁÁÁ
ÁÁÁ
ÁÁÁÁ
ÁÁÁÁ
ÁÁÁÁ
ÁÁÁÁ
ÁÁÁÁ
ÁÁÁÁ
ÁÁÁ
ÁÁÁÁ
ÁÁÁÁ
ÁÁÁÁ
ÁÁÁÁ
ÁÁÁÁ
ÁÁÁÁ
ÁÁÁ
ÁÁÁÁ
ÁÁÁÁ
ÁÁÁÁ
ÁÁÁÁ
ÁÁÁÁ
ÁÁÁÁ
ÁÁÁ
ÁÁÁÁ
ÁÁÁÁ
ÁÁÁÁ
ÁÁÁÁ
ÁÁÁÁ
ÁÁÁÁ
ÁÁÁÁ
ÁÁÁÁ
ÁÁÁÁ
ÁÁÁ
ÁÁÁÁ
ÁÁÁÁ
ÁÁÁÁ
ÁÁÁ
ÁÁÁÁ
ÁÁÁÁ
ÁÁÁÁ
ÁÁÁÁ
ÁÁÁÁ
ÁÁÁÁ
ÁÁÁÁ
ÁÁÁÁ
ÁÁÁÁ
ÁÁÁ
ÁÁÁÁ
ÁÁÁÁ
ÁÁÁÁ
ÁÁÁ
ÁÁÁÁ
ÁÁÁÁ
ÁÁÁÁ
ÁÁÁÁ
ÁÁÁÁ
ÁÁÁÁ
ÁÁÁ
ÁÁÁÁÁÁÁÁ
ÁÁÁÁÁÁÁÁ
ÁÁÁÁÁÁÁÁ
Display Levels Related to dBZ Levels (Typical)
Table 5–6
WARNING
THE RADAR IS CALIBRATED FOR CONVECTIVE WEATHER.
STRATIFORM STORMS AT OR NEAR THE FREEZING LEVEL
CAN SHOW HIGH REFLECTIVITY. DO NOT PENETRATE SUCH
TARGETS.
A28–1146–111
REV 2
Radar Facts
5-29
PRIMUSR 660 Digital Weather Radar System
Rainfall rate in
mm/hr
Storm
Category
6
Greater than
125
Extreme
Greater than
57
5
50 – 125
Intense
50 – 57
4
25 – 50
Very Strong
45 – 50
3
12 – 25
Strong
40 – 45
2
2.5 – 12
Moderate
29 – 40
1
0.25 – 2.5
Weak
13 – 29
ÁÁÁÁÁÁ
ÁÁÁÁÁÁ
ÁÁÁÁÁÁ
ÁÁÁÁÁÁ
ÁÁÁÁÁÁ
ÁÁÁÁÁÁ
ÁÁÁÁÁÁ
ÁÁÁÁÁÁ
ÁÁÁÁÁÁ
ÁÁÁÁÁÁ
ÁÁÁÁÁÁ
ÁÁÁÁÁÁ
ÁÁÁÁÁÁ
ÁÁÁÁÁÁ
ÁÁÁÁÁÁ
ÁÁÁÁÁÁ
ÁÁÁÁÁÁ
ÁÁÁÁÁÁ
ÁÁÁÁÁÁ
ÁÁÁÁÁÁ
ÁÁÁÁÁÁ
ÁÁÁÁÁÁ
ÁÁÁÁÁÁ
ÁÁÁÁÁÁ
ÁÁÁÁÁÁ
ÁÁÁÁÁÁ
ÁÁÁÁÁÁ
ÁÁÁÁÁÁ
ÁÁÁÁÁÁ
ÁÁÁÁÁÁ
ÁÁÁÁÁÁ
ÁÁÁÁÁÁ
ÁÁÁÁÁÁ
ÁÁÁÁÁÁ
ÁÁÁÁÁÁ
ÁÁÁÁÁÁ
VIP Level
dBZ Level
VIP Levels Related to dBZ
Table 5–7
VARIABLE GAIN CONTROL
The PRIMUSR 660 Digital Weather Radar variable gain control is a
single turn rotary control and a push/pull switch that is used to control
the radar’s receiver gain. With the switch pushed in, the system is in the
preset, calibrated gain mode. In calibrated gain, the rotary control does
nothing.
When the GAIN switch is pulled out, the system enters the variable gain
mode. Variable gain is useful for additional weather analysis. In the WX
mode, variable gain can increase receiver sensitivity over the calibrated
level to show very weak targets or it can be reduced below the
calibrated level to eliminate weak returns.
WARNING
LOW VARIABLE GAIN SETTINGS CAN ELIMINATE HAZARDOUS
TARGETS.
Radar Facts
5-30
A28–1146–111
REV 2
PRIMUSR 660 Digital Weather Radar System
RAIN ECHO ATTENUATION COMPENSATION
TECHNIQUE (REACT)
Honeywell’s REACT feature has three separate, but related functions.
D
Attenuation Compensation – As the radar energy travels through
rainfall, the raindrops reflect a portion of the energy back toward the
airplane. This results in less energy being available to detect
raindrops at greater ranges. This process continues throughout the
depth of the storm, resulting in a phenomenon known as
attenuation. The amount of attenuation increases with an increase
in rainfall rate and with an increase in the range traveled through the
rainfall (i.e., heavy rain over a large area results in high levels of
attenuation, while light rain over a small area results in low levels of
attenuation).
Storms with high rainfall rates can totally attenuate the radar energy
making it impossible to see a second cell hidden behind the first cell.
In some cases, attenuation can be so extreme that the total depth
of a single cell cannot be shown.
Without some form of compensation, attenuation causes a single
cell to appear to weaken as the depth of the cell increases.
Honeywell has incorporated attenuation compensation
that
adjusts the receiver gain by an amount equal to the amount of
attenuation. That is, the greater the amount of attenuation, the
higher the receiver gain and thus, the more sensitive the receiver.
Attenuation compensation continuously calibrates the display of
weather targets, regardless of the amount of attenuation.
With attenuation compensation, weather target calibration is
maintained throughout the entire range of a single cell. The
cell behind a cell remains properly calibrated, making proper
calibration of weather targets at long ranges possible.
D
Cyan REACT Field – From the description of attenuation, it can be
seen that high levels of attenuation (caused by cells with heavy
rainfall) causes the attenuation compensation circuitry to increase
the receiver gain at a fast rate.
Low levels of attenuation (caused by cells with low rainfall rates)
cause the receiver gain to increase at a slower rate.
A28–1146–111
REV 2
Radar Facts
5-31
PRIMUSR 660 Digital Weather Radar System
The receiver gain is adjusted to maintain target calibration. Since
there is a maximum limit to receiver gain, strong targets (high
attenuation levels) cause the receiver to reach its maximum gain
value in a short time/short range. Weak or no targets (low
attenuation levels) cause the receiver to reach its maximum gain
value in a longer time/longer range. Once the receiver reaches its
maximum gain value, weather targets can no longer be calibrated.
The point where red level weather target calibration is no longer
possible is highlighted by changing the background field from black
to cyan.
Any area of cyan background is an area where attenuation has
caused the receiver gain to reach its maximum value, so further
calibration of returns is not possible. Extreme caution is
recommended in any attempt to analyze weather in these
cyan areas. The radar cannot display an accurate picture of what
is in these cyan areas. Cyan areas should be avoided.
NOTE:
If the radar is operated such that ground targets are
affecting REACT, they could cause REACT to give invalid
indications.
Any target detected inside a cyan area is automatically forced to a
magenta color indicating maximum severity. Figure 5–31 shows the
same storm with REACT OFF and with REACT ON.
Radar Facts
5-32
A28–1146–111
REV 2
PRIMUSR 660 Digital Weather Radar System
AD–51778–R1@
With REACT Selected
AD–54262@
Without REACT
REACT ON and OFF Indications
Figure 5–31
A28–1146–111
REV 2
Radar Facts
5-33
PRIMUSR 660 Digital Weather Radar System
Shadowing
An operating technique similar to the REACT blue field is shadowing.
To use the shadowing technique, tilt the antenna down until ground is
being painted just in front of the storm cell(s). An area of no ground
returns behind the storm cell has the appearance of a shadow behind
the cell. This shadow area indicates that the storm cell has totally
attenuated the radar energy and the radar cannot show any additional
targets (WX or ground) behind the cell. The cell that produces a radar
shadow is a very strong and dangerous cell. It should be avoided by 20
miles.
WARNING
DO NOT FLY INTO THE SHADOW BEHIND THE CELL.
Turbulence Probability
The graph of turbulence probability is shown in figure 5–32. This graph
shows the following:
D
There is a 100% probability of light turbulence occurring in any area
of rain
D
A level one storm (all green) has virtually no chance of containing
severe or extreme turbulence but has between a 5% and 20%
chance that moderate turbulence exists
D
A level two storm (one containing green and yellow returns) has
virtually no probability of extreme turbulence but has a 20% to 40%
chance of moderate turbulence and up to a 5% chance of severe
turbulence
D
A level three storm (green, yellow, and red radar returns) has a 40%
to 85% chance of moderate turbulence, a 5% to 10% chance of
severe turbulence, and a slight chance of extreme turbulence
D
A level four storm (one with a magenta return) has moderate
turbulence, a 10% to 50% chance of severe turbulence, and a slight
to 25% chance of extreme turbulence.
WARNING
THE AREAS OF TURBULENCE CAN NOT BE ASSOCIATED WITH
THE MAXIMUM RAINFALL AREAS. THE PROBABILITIES OF
TURBULENCE ARE STATED FOR THE ENTIRE STORM AREA,
NOT JUST THE HEAVY RAINFALL AREAS.
Radar Facts
5-34
A28–1146–111
REV 2
PRIMUSR 660 Digital Weather Radar System
Although penetrating a storm with a red (level three) core appears to be
an acceptable risk, it is not. At the lower end of the red zone, there is
no chance of extreme turbulence, a slight chance of severe turbulence,
and a 40% chance of moderate turbulence. However, the radar lumps
all of the rainfall rates between 12 mm to 50 mm per hour into one group
– a level three (red). Once the rainfall rate reaches the red threshold,
it masks any additional information about the rainfall rate until the
magenta threshold is reached. A red return covers a range of
turbulence probabilities and the worst case must be assumed,
especially since extreme, destructive turbulence is born in the red zone.
Therefore, once the red threshold is reached, the risk in penetration
becomes totally unacceptable.
Likewise, once the magenta threshold is reached, it must be
assumed that more severe weather is being masked.
LEVEL 1
GREEN
100%
LEVEL 2
YELLOW
LEVEL 3
RED
LEVEL 4
MAGENTA
LIGHT
90%
TURBULENCE PROBABILITY
80%
70%
60%
50%
40%
30%
20%
10%
0%
(4 mm / Hr)
(12 mm / Hr)
(50 mm / Hr)
RAINFALL RATE
AD–15357–R3@
Probability of Turbulence Presence
in a Weather Target
Figure 5–32
A28–1146–111
REV 2
Radar Facts
5-35
PRIMUSR 660 Digital Weather Radar System
Turbulence levels are listed and described in table 5–8.
ÁÁÁÁÁ
ÁÁÁÁÁÁÁÁÁÁ
ÁÁÁÁÁÁÁÁ
ÁÁÁÁÁ
ÁÁÁÁÁÁÁÁÁÁ
ÁÁÁÁÁÁÁÁ
ÁÁÁÁÁ
ÁÁÁÁÁÁÁÁÁÁ
ÁÁÁÁÁÁÁÁ
ÁÁÁÁÁ
ÁÁÁÁÁÁÁÁÁÁ
ÁÁÁÁÁÁÁÁ
ÁÁÁÁÁ
ÁÁÁÁÁÁÁÁÁÁ
ÁÁÁÁÁÁÁÁ
ÁÁÁÁÁ
ÁÁÁÁÁÁÁÁÁÁ
ÁÁÁÁÁÁÁÁ
ÁÁÁÁÁ
ÁÁÁÁÁÁÁÁÁÁ
ÁÁÁÁÁÁÁÁ
ÁÁÁÁÁ
ÁÁÁÁÁÁÁÁÁÁ
ÁÁÁÁÁÁÁÁ
ÁÁÁÁÁ
ÁÁÁÁÁÁÁÁÁÁ
ÁÁÁÁÁÁÁÁ
ÁÁÁÁÁ
ÁÁÁÁÁÁÁÁÁÁ
ÁÁÁÁÁÁÁÁ
ÁÁÁÁÁ
ÁÁÁÁÁÁÁÁÁÁ
ÁÁÁÁÁÁÁÁ
ÁÁÁÁÁ
ÁÁÁÁÁÁÁÁÁÁ
ÁÁÁÁÁÁÁÁ
ÁÁÁÁÁ
ÁÁÁÁÁÁÁÁÁÁ
ÁÁÁÁÁÁÁÁ
INTENSITY
AIRCRAFT REACTION
REACTION INSIDE
AIRCRAFT
Turbulence that momentarily causes
slight, erratic changes in altitude and/or
attitude (pitch, roll, yaw).
Occupants can feel a slight
strain against seat belts or
shoulder straps. Unsecured
objects can be displaced
slightly.
MODERATE
Turbulence that is similar to light
turbulence but of greater intensity.
Changes in altitude and/or attitude
occur but the aircraft remains in
positive control at all times. It usually
causes variations in indicated
airspeed.
Occupants feel definite
strains against seat belts or
shoulder straps. Unsecured
objects are dislodged.
SEVERE
Turbulence that causes large abrupt
changes in altitude and/or attitude. It
usually causes large variations in
indicated airspeed. Aircraft can be
momentarily out of control.
Occupants are forced
violently against seat belts
or shoulder straps.
Unsecured objects are
tossed about.
LIGHT
Turbulence Levels (From Airman’s Information Manual)
Table 5–8
Hail Size Probability
Whenever the radar shows a red or magenta target, the entire storm cell
should be considered extremely hazardous and must not be
penetrated. Further support for this statement comes from the hail
probability graph, shown in figure 5–33. The probability of destructive
hail starts at a rainfall rate just above the red level three threshold.
Like precipitation, the red and magenta returns should be considered
as a mask over more severe hail probabilities.
By now, it should be clear that the only safe way to operate in areas of
thunderstorm activity is to AVOID ALL CELLS THAT HAVE RED OR
MAGENTA RETURNS.
Radar Facts
5-36
A28–1146–111
REV 2
PRIMUSR 660 Digital Weather Radar System
100%
1/4” HAIL
RELATIVE FREQUENCY
80%
60%
40%
1/2” HAIL
20%
3/4” AND LAGER HAIL
0%
LEVEL 2
YELLOW
LEVEL 3
RED
LEVEL 4
MAGENTA
AD–15358–R1@
Hail Size Probability
Figure 5–33
Spotting Hail
As previously stated, dry hail is a poor reflector, and therefore
generates deceptively weak or absent radar returns. When flying above
the freezing level, hail can be expected in regions above and around wet
storm cells found at lower altitudes. The hail is carried up to the
tropopause by strong vertical winds inside the storm. In large storms,
these winds can easily exceed 200 kt, making them very dangerous.
Since the core of such a storm is very turbulent, but largely icy, the red
core on the radar display is weak or absent and highly mobile. The
storm core can be expected to change shapes with each antenna scan.
On reaching the tropopause, the hail is ejected from the storm and falls
downward to a point where it is sucked back into the storm. When the hail
falls below the freezing level, however, it begins to melt and form a thin
surface layer of liquid detectable by radar. A slight downward tilt of the
antenna toward the warmer air shows rain coming from unseen dry hail
that is directly in the flightpath, as shown in figure 5–34. At lower altitudes,
the reverse is sometimes true. The radar can be scanning below a rapidly
developing storm cell, that the heavy rain droplets have not had time to
fall through the updrafts to the flight level. Tilting the antenna up and down
regularly produces the total weather picture.
A28–1146–111
REV 2
Radar Facts
5-37
PRIMUSR 660 Digital Weather Radar System
Using a tilt setting that has the radar look into the area of maximum
reflectivity (5000 to 20,000 ft) gives the strongest radar picture.
However the tilt setting must not be left at this setting. Periodically, the
pilot should look up and down from this setting to see the total picture
of the weather in the flightpath.
Often, hailstorms generate weak but characteristic patterns like those
shown in figure 5–35. Fingers or hooks of cyclonic winds that radiate from
the main body of a storm usually contain hail. A U shaped pattern is also
(frequently) a column of dry hail that returns no signal but is buried in a
larger area of rain that does return a strong signal. Scalloped edges on a
pattern also indicate the presence of dry hail bordering a rain area.
Finally, weak or fuzzy protuberances are not always associated with hail,
but should be watched closely; they can change rapidly.
DRY HAIL
BEAM IN
DOWNWARD
TILT POSITION
WET HAIL
AND RAIN
AD–12059–R1@
Rain Coming From Unseen Dry Hail
Figure 5–34
FINGER
HOOK
U–SHAPE
AD–35713@
Familiar Hailstorm Patterns
Figure 5–35
Radar Facts
5-38
A28–1146–111
REV 2
PRIMUSR 660 Digital Weather Radar System
The more that is learned about radar, the more the pilot is an
all–important part of the system. The proper use of controls is essential
to gathering all pertinent weather data. The proper interpretation of that
data (the displayed patterns) is equally important to safety and comfort.
This point is illustrated again in figure 5–36. When flying at higher
altitudes, a storm detected on the long–range setting can
disappear from the display as it is approached. The pilot should not be
fooled into believing the storm has dissipated as the aircraft approaches
it. The possibility exists that the radiated energy is being directed from
the aircraft antenna above the storm as the aircraft gets closer. If this
is the case, the weather shows up again when the antenna is tilted
downward as little as 1_. Assuming that a storm has dissipated during
the approach can be quite dangerous; if this is not the case, the
turbulence above a storm can be as severe as that inside it.
OVERFLYING A STORM
HAIL
AD–12061–R1@
Overshooting a Storm
Figure 5–36
A28–1146–111
REV 2
Radar Facts
5-39
PRIMUSR 660 Digital Weather Radar System
Another example of the pilot’s importance in helping the radar serve its
safety/comfort purpose is shown in figure 5–37. This is the blind alley
or box canyon situation. Pilots can find themselves in this situation if
they habitually fly with the radar on the short range. The short–range
returns show an obvious corridor between two areas of heavy rainfall,
but the long–range setting shows the trap. Both the near and far
weather zones could be avoided by a short–term course change of
about 45_ to the right. Always switch to long range before entering such
a corridor.
THE BLIND ALLEY
40
20
20
LONG RANGE
SHORT RANGE
AD–12062–R1@
Short– and Long–Blind Alley
Figure 5–37
Radar Facts
5-40
A28–1146–111
REV 2
PRIMUSR 660 Digital Weather Radar System
Azimuth Resolution
When two targets, such as storms, are closely adjacent at the
same range, the radar displays them as a single target, as shown in
figure 5–38. However, as the aircraft approaches the targets, they
appear to separate. In the illustration, the airplane is far away from the
targets at position A. At this distance, the beam width is spreading. As
the beam scans across the two targets, there is no point that the beam
energy is not reflected, either by one target or the other, because the
space between the targets is not wide enough to pass the beam width.
In target position B, the aircraft is closer to the same two targets; the
beam width is narrower, and the targets separate on the display.
100
80
60
A
20
40
INDICATOR DISPLAY A
50
40
B
10
20
30
INDICATOR DISPLAY B
AD–35705@
Azimuth Resolution in Weather Modes
Figure 5–38
A28–1146–111
REV 2
Radar Facts
5-41
PRIMUSR 660 Digital Weather Radar System
RADOME
Ice or water on the radome does not generally cause radar failure, but
it hampers operation. The radome is constructed of materials that pass
the radar energy with little attenuation. Ice or water increases the
attenuation making the radar appear to have less sensitivity. Ice can
cause refractive distortion, a condition characterized by loss of image
definition. If the ice should cause reverberant echoes within the
radome, the condition might be indicated by the appearance of
nonexisting targets.
The radome can also cause refractive distortion, that would make it
appear that the TILT control was out of adjustment, or that bearing
indications were somewhat erroneous.
A radome with ice or water trapped within its walls can cause significant
attenuation and distortion of the radar signals. This type of attenuation
cannot be detected by the radar, even with REACT on, but it can, in
extreme cases, cause blind spots. If a target changes significantly in
size, shape, or intensity as aircraft heading or attitude change, the
radome is probably the cause.
Radar Facts
5-42
A28–1146–111
REV 2
PRIMUSR 660 Digital Weather Radar System
WEATHER AVOIDANCE
Figure 5–39 illustrates a typical weather display in WX mode.
Recommended procedures when using the radar for weather
avoidance are given in table 5–9. The procedures are given in bold face,
explanations of the procedure follow in normal type face.
AD–51780@
Weather Display
Figure 5–39
ÁÁÁ
ÁÁÁÁÁÁÁÁÁÁÁÁÁÁÁÁÁÁÁ
ÁÁÁ
ÁÁÁÁÁÁÁÁÁÁÁÁÁÁÁÁÁÁÁ
ÁÁÁ
ÁÁÁÁÁÁÁÁÁÁÁÁÁÁÁÁÁÁÁ
ÁÁÁ
ÁÁÁÁÁÁÁÁÁÁÁÁÁÁÁÁÁÁÁ
ÁÁÁ
ÁÁÁÁÁÁÁÁÁÁÁÁÁÁÁÁÁÁÁ
ÁÁÁ
ÁÁÁÁÁÁÁÁÁÁÁÁÁÁÁÁÁÁÁ
ÁÁÁÁÁÁÁÁÁÁÁÁÁÁÁÁÁÁÁÁÁÁ
ÁÁÁ
ÁÁÁÁÁÁÁÁÁÁÁÁÁÁÁÁÁÁÁ
ÁÁÁ
ÁÁÁÁÁÁÁÁÁÁÁÁÁÁÁÁÁÁÁ
ÁÁÁ
ÁÁÁÁÁÁÁÁÁÁÁÁÁÁÁÁÁÁÁÁÁÁ
ÁÁÁÁÁÁÁÁÁÁÁÁÁÁÁÁÁÁÁ
Step
Procedure
1
Keep TGT alert enabled when using short ranges to be
alerted if a new storm cell develops in the aircraft’s
flightpath.
2
Keep the gain in preset. The gain control should be in
preset except for brief periods when variable gain is used
for detailed analysis. Immediately after the analysis, switch
back to preset gain.
WARNING
DO NOT LEAVE THE RADAR IN VARIABLE GAIN. SIGNIFICANT WEATHER CAN NOT BE DISPLAYED.
Severe Weather Avoidance Procedures
Table 5–9 (cont)
A28–1146–111
REV 2
Radar Facts
5-43
PRIMUSR 660 Digital Weather Radar System
Step
Procedure
3
Any storm with reported tops at or greater than 20,000 feet
must be avoided by 20 NM.
ÁÁÁÁ
ÁÁÁÁÁÁÁÁÁÁÁÁÁÁÁÁÁÁ
ÁÁÁÁ
ÁÁÁÁÁÁÁÁÁÁÁÁÁÁÁÁÁÁ
ÁÁÁÁ
ÁÁÁÁÁÁÁÁÁÁÁÁÁÁÁÁÁÁ
ÁÁÁÁ
ÁÁÁÁÁÁÁÁÁÁÁÁÁÁÁÁÁÁ
ÁÁÁÁ
ÁÁÁÁÁÁÁÁÁÁÁÁÁÁÁÁÁÁ
ÁÁÁÁ
ÁÁÁÁÁÁÁÁÁÁÁÁÁÁÁÁÁÁ
ÁÁÁÁ
ÁÁÁÁÁÁÁÁÁÁÁÁÁÁÁÁÁÁ
ÁÁÁÁ
ÁÁÁÁÁÁÁÁÁÁÁÁÁÁÁÁÁÁ
ÁÁÁÁ
ÁÁÁÁÁÁÁÁÁÁÁÁÁÁÁÁÁÁ
ÁÁÁÁ
ÁÁÁÁÁÁÁÁÁÁÁÁÁÁÁÁÁÁ
ÁÁÁÁ
ÁÁÁÁÁÁÁÁÁÁÁÁÁÁÁÁÁÁ
ÁÁÁÁ
ÁÁÁÁÁÁÁÁÁÁÁÁÁÁÁÁÁÁ
ÁÁÁÁ
ÁÁÁÁÁÁÁÁÁÁÁÁÁÁÁÁÁÁ
ÁÁÁÁ
ÁÁÁÁÁÁÁÁÁÁÁÁÁÁÁÁÁÁ
ÁÁÁÁ
ÁÁÁÁÁÁÁÁÁÁÁÁÁÁÁÁÁÁ
ÁÁÁÁ
ÁÁÁÁÁÁÁÁÁÁÁÁÁÁÁÁÁÁ
ÁÁÁÁ
ÁÁÁÁÁÁÁÁÁÁÁÁÁÁÁÁÁÁ
ÁÁÁÁ
ÁÁÁÁÁÁÁÁÁÁÁÁÁÁÁÁÁÁ
ÁÁÁÁ
ÁÁÁÁÁÁÁÁÁÁÁÁÁÁÁÁÁÁ
ÁÁÁÁ
ÁÁÁÁÁÁÁÁÁÁÁÁÁÁÁÁÁÁ
ÁÁÁÁ
ÁÁÁÁÁÁÁÁÁÁÁÁÁÁÁÁÁÁ
ÁÁÁÁ
ÁÁÁÁÁÁÁÁÁÁÁÁÁÁÁÁÁÁ
ÁÁÁÁ
ÁÁÁÁÁÁÁÁÁÁÁÁÁÁÁÁÁÁ
ÁÁÁÁ
ÁÁÁÁÁÁÁÁÁÁÁÁÁÁÁÁÁÁ
ÁÁÁÁ
ÁÁÁÁÁÁÁÁÁÁÁÁÁÁÁÁÁÁ
ÁÁÁÁ
ÁÁÁÁÁÁÁÁÁÁÁÁÁÁÁÁÁÁ
ÁÁÁÁ
ÁÁÁÁÁÁÁÁÁÁÁÁÁÁÁÁÁÁ
ÁÁÁÁ
ÁÁÁÁÁÁÁÁÁÁÁÁÁÁÁÁÁÁ
ÁÁÁÁ
ÁÁÁÁÁÁÁÁÁÁÁÁÁÁÁÁÁÁ
ÁÁÁÁ
ÁÁÁÁÁÁÁÁÁÁÁÁÁÁÁÁÁÁ
WARNING
DRY HAIL CAN BE PREVALENT AT HIGHER ALTITUDES
WITHIN, NEAR, OR ABOVE STORM CELLS, AND SINCE
ITS RADAR REFLECTIVITY IS POOR, IT can NOT BE
DETECTED.
4
For brief periods use increased gain (rotate GAIN control
to its maximum cw position) when flying near storm tops.
This helps display the normally weaker returns that could
be associated with hail.
5
When flying at high altitudes, tilt downward frequently
to avoid flying above storm tops.
Studies by the National Severe Storms Laboratory (NSSL)
of Oklahoma have determined that thunderstorms
extending to 60,000 ft show little variation of turbulence
intensity with altitude.
Ice crystals are poor reflectors. Rain water at the lower
altitudes produce a strong echo, however at higher
altitudes, the nonreflective ice produces a week echo as
the antenna is tilted up. Therefore, though the intensity of
the echo diminishes with altitude, it does not mean the
severity of the turbulence has diminished.
NOTE:
6
If the TILT control is left in a fixed position at the higher flight
levels, a storm detected at long range can appear to become
weaker and actually disappear as it is approached. This occurs
because the storm cell that was fully within the beam at 100 NM
gradually passes out of and under the radar beam.
When flying at low altitudes rotate tilt upward
frequently to avoid flying under a thunderstorm.
There is some evidence that maximum turbulence exists at
middle heights in storms (20,000 to 30,000 ft); however,
turbulence beneath a storm is not to be minimized.
However, the lower altitude can be affected by strong
outflow winds and severe turbulence where thunderstorms
are present. The same turbulence considerations that
apply to high altitude flight near storms apply to low
altitude flight.
Severe Weather Avoidance Procedures
Table 5–9 (cont)
Radar Facts
5-44
A28–1146–111
REV 2
PRIMUSR 660 Digital Weather Radar System
Step
Procedure
ÁÁÁ
ÁÁÁÁÁÁÁÁÁÁÁÁÁÁÁÁÁÁÁ
ÁÁÁ
ÁÁÁÁÁÁÁÁÁÁÁÁÁÁÁÁÁÁÁ
ÁÁÁÁÁÁÁÁÁÁÁÁÁÁÁÁÁÁÁÁÁÁ
ÁÁÁ
ÁÁÁÁÁÁÁÁÁÁÁÁÁÁÁÁÁÁÁ
ÁÁÁ
ÁÁÁÁÁÁÁÁÁÁÁÁÁÁÁÁÁÁÁ
ÁÁÁ
ÁÁÁÁÁÁÁÁÁÁÁÁÁÁÁÁÁÁÁ
ÁÁÁ
ÁÁÁÁÁÁÁÁÁÁÁÁÁÁÁÁÁÁÁ
ÁÁÁ
ÁÁÁÁÁÁÁÁÁÁÁÁÁÁÁÁÁÁÁ
ÁÁÁÁÁÁÁÁÁÁÁÁÁÁÁÁÁÁÁ
ÁÁÁ
ÁÁÁ
ÁÁÁÁÁÁÁÁÁÁÁÁÁÁÁÁÁÁÁ
ÁÁÁÁÁÁÁÁÁÁÁÁÁÁÁÁÁÁÁÁÁÁ
ÁÁÁÁÁÁÁÁÁÁÁÁÁÁÁÁÁÁÁÁÁÁ
ÁÁÁ
ÁÁÁÁÁÁÁÁÁÁÁÁÁÁÁÁÁÁÁ
ÁÁÁÁÁÁÁÁÁÁÁÁÁÁÁÁÁÁÁÁÁÁ
ÁÁÁ
ÁÁÁÁÁÁÁÁÁÁÁÁÁÁÁÁÁÁÁ
ÁÁÁ
ÁÁÁÁÁÁÁÁÁÁÁÁÁÁÁÁÁÁÁ
ÁÁÁÁÁÁÁÁÁÁÁÁÁÁÁÁÁÁÁÁÁÁ
ÁÁÁ
ÁÁÁÁÁÁÁÁÁÁÁÁÁÁÁÁÁÁÁ
ÁÁÁ
ÁÁÁÁÁÁÁÁÁÁÁÁÁÁÁÁÁÁÁ
ÁÁÁÁÁÁÁÁÁÁÁÁÁÁÁÁÁÁÁÁÁÁ
ÁÁÁ
ÁÁÁÁÁÁÁÁÁÁÁÁÁÁÁÁÁÁÁ
ÁÁÁÁÁÁÁÁÁÁÁÁÁÁÁÁÁÁÁÁÁÁ
ÁÁÁ
ÁÁÁÁÁÁÁÁÁÁÁÁÁÁÁÁÁÁÁ
ÁÁÁÁÁÁÁÁÁÁÁÁÁÁÁÁÁÁÁÁÁÁ
ÁÁÁ
ÁÁÁÁÁÁÁÁÁÁÁÁÁÁÁÁÁÁÁ
ÁÁÁ
ÁÁÁÁÁÁÁÁÁÁÁÁÁÁÁÁÁÁÁ
ÁÁÁÁÁÁÁÁÁÁÁÁÁÁÁÁÁÁÁÁÁÁ
ÁÁÁÁÁÁÁÁÁÁÁÁÁÁÁÁÁÁÁÁÁÁ
7
Avoid all rapidly moving echoes by 20 miles.
A single thunderstorm echo, a line of echoes, or a cluster
of echoes moving 40 knots or more often contain severe
weather. Although nearby, slower moving echoes can
contain more intense aviation hazards, all rapidly moving
echoes warrant close observation. Fast moving, broken–
to solid–line echoes are particularly disruptive to aircraft
operations.
8
Avoid, the entire cell if any portion of the cell is red or
magenta by 20 NM.
The stronger the radar return, the greater the frequency
and severity of turbulence and hail.
9
Avoid all rapidly growing storms by 20 miles.
When severe storms and rapid development are evident,
the intensity of the radar return can increase by a huge
factor in a matter of minutes. Moreover, the summit of the
storm cells can grow at 7000 ft/min. The pilot cannot
expect a flightpath through such a field of strong storms
separated by 20 to 30 NM to be free of severe turbulence.
10
Avoid all storms showing erratic motion by 20 miles.
Thunderstorms tend to move with the average wind that
exists between the base and top of the cloud. Any motion
differing from this is considered erratic and can indicate the
storm is severe. There are several causes of erratic
motion. They can act individually or in concert. Three of
the most important causes of erratic motion are:
1. Moisture Source. Thunderstorms tend to grow toward a
layer of very moist air (usually south or southeast in the
U.S.) in the lowest 1500 to 5000 ft above the earth’s
surface. Moist air generates most of the energy for the
storm’s growth and activity. Thus, a thunderstorm can
tend to move with the average wind flow around it, but
also grow toward moisture. When the growth toward
moisture is rapid, the echo motion often appears erratic.
On at least one occasion, a thunderstorm echo moved in
direct opposition to the average wind!
Severe Weather Avoidance Procedures
Table 5–9 (cont)
A28–1146–111
REV 2
Radar Facts
5-45
PRIMUSR 660 Digital Weather Radar System
Step
Procedure
ÁÁÁÁ
ÁÁÁÁÁÁÁÁÁÁÁÁÁÁÁÁÁÁ
ÁÁÁÁ
ÁÁÁÁÁÁÁÁÁÁÁÁÁÁÁÁÁÁ
ÁÁÁÁ
ÁÁÁÁÁÁÁÁÁÁÁÁÁÁÁÁÁÁ
ÁÁÁÁ
ÁÁÁÁÁÁÁÁÁÁÁÁÁÁÁÁÁÁ
ÁÁÁÁ
ÁÁÁÁÁÁÁÁÁÁÁÁÁÁÁÁÁÁ
ÁÁÁÁ
ÁÁÁÁÁÁÁÁÁÁÁÁÁÁÁÁÁÁ
ÁÁÁÁ
ÁÁÁÁÁÁÁÁÁÁÁÁÁÁÁÁÁÁ
ÁÁÁÁ
ÁÁÁÁÁÁÁÁÁÁÁÁÁÁÁÁÁÁ
ÁÁÁÁ
ÁÁÁÁÁÁÁÁÁÁÁÁÁÁÁÁÁÁ
ÁÁÁÁ
ÁÁÁÁÁÁÁÁÁÁÁÁÁÁÁÁÁÁ
ÁÁÁÁ
ÁÁÁÁÁÁÁÁÁÁÁÁÁÁÁÁÁÁ
ÁÁÁÁ
ÁÁÁÁÁÁÁÁÁÁÁÁÁÁÁÁÁÁ
ÁÁÁÁ
ÁÁÁÁÁÁÁÁÁÁÁÁÁÁÁÁÁÁ
ÁÁÁÁ
ÁÁÁÁÁÁÁÁÁÁÁÁÁÁÁÁÁÁ
ÁÁÁÁ
ÁÁÁÁÁÁÁÁÁÁÁÁÁÁÁÁÁÁ
ÁÁÁÁ
ÁÁÁÁÁÁÁÁÁÁÁÁÁÁÁÁÁÁ
ÁÁÁÁ
ÁÁÁÁÁÁÁÁÁÁÁÁÁÁÁÁÁÁ
ÁÁÁÁ
ÁÁÁÁÁÁÁÁÁÁÁÁÁÁÁÁÁÁ
ÁÁÁÁ
ÁÁÁÁÁÁÁÁÁÁÁÁÁÁÁÁÁÁ
ÁÁÁÁ
ÁÁÁÁÁÁÁÁÁÁÁÁÁÁÁÁÁÁ
ÁÁÁÁ
ÁÁÁÁÁÁÁÁÁÁÁÁÁÁÁÁÁÁ
ÁÁÁÁ
ÁÁÁÁÁÁÁÁÁÁÁÁÁÁÁÁÁÁ
ÁÁÁÁ
ÁÁÁÁÁÁÁÁÁÁÁÁÁÁÁÁÁÁ
ÁÁÁÁ
ÁÁÁÁÁÁÁÁÁÁÁÁÁÁÁÁÁÁ
ÁÁÁÁ
ÁÁÁÁÁÁÁÁÁÁÁÁÁÁÁÁÁÁ
ÁÁÁÁ
ÁÁÁÁÁÁÁÁÁÁÁÁÁÁÁÁÁÁ
ÁÁÁÁ
ÁÁÁÁÁÁÁÁÁÁÁÁÁÁÁÁÁÁ
ÁÁÁÁ
ÁÁÁÁÁÁÁÁÁÁÁÁÁÁÁÁÁÁ
ÁÁÁÁ
ÁÁÁÁÁÁÁÁÁÁÁÁÁÁÁÁÁÁ
ÁÁÁÁ
ÁÁÁÁÁÁÁÁÁÁÁÁÁÁÁÁÁÁ
ÁÁÁÁ
ÁÁÁÁÁÁÁÁÁÁÁÁÁÁÁÁÁÁ
10
2. Disturbed Wind Flow. Sometimes thunderstorm
(cont)
updrafts block winds near the thunderstorm and act much
like a rock in a shallow river bed. This pillar of updraft
forces the winds outside the storm to flow around the
storm instead of carrying it along. This also happens in
wake eddies that often form downstream of the blocking
updraft
3. Interaction With Other Storms. A thunderstorm that is
located between another storm and its moisture source
can cause the blocked storm to have erratic motion.
Sometimes the blocking of moisture is effective enough
to cause the thunderstorm to dissipate.
Three of the most common erratic motions are:
1. Right Turning Echo. This is the most frequently
observed erratic motion. Sometimes a thunderstorm
echo traveling the same direction and speed as nearby
thunderstorm echoes, slows, and turns to the right of its
previous motion. The erratic motion can last an hour or
more before it resumes its previous motion. The storm
should be considered severe while this erratic motion is
in progress.
2. Splitting Echoes. Sometimes a large (20–mile or larger
diameter) echo splits into two echoes. The southernmost
echo often slows, turns to the right of its previous motion,
and becomes severe with large hail and extreme
turbulence.
If a tornado develops, it is usually at the right rear portion
of the southern echo. When the storm weakens, it usually
resumes its original direction of movement. The northern
echo moves left of the mean wind, increases speed and
often produces large hail and extreme turbulence.
3. Merging Echoes. Merging echoes sometimes become
severe, but often the circulation of the merging cells
interfere with each other preventing intensification. The
greatest likelihood of aviation hazards is at the right rear
section of the echo.
Severe Weather Avoidance Procedures
Table 5–9 (cont)
Radar Facts
5-46
A28–1146–111
REV 2
PRIMUSR 660 Digital Weather Radar System
Step
Procedure
ÁÁÁ
ÁÁÁÁÁÁÁÁÁÁÁÁÁÁÁÁÁÁÁ
ÁÁÁ
ÁÁÁÁÁÁÁÁÁÁÁÁÁÁÁÁÁÁÁ
ÁÁÁÁÁÁÁÁÁÁÁÁÁÁÁÁÁÁÁÁÁÁ
ÁÁÁ
ÁÁÁÁÁÁÁÁÁÁÁÁÁÁÁÁÁÁÁ
ÁÁÁ
ÁÁÁÁÁÁÁÁÁÁÁÁÁÁÁÁÁÁÁ
ÁÁÁ
ÁÁÁÁÁÁÁÁÁÁÁÁÁÁÁÁÁÁÁ
ÁÁÁÁÁÁÁÁÁÁÁÁÁÁÁÁÁÁÁÁÁÁ
ÁÁÁÁÁÁÁÁÁÁÁÁÁÁÁÁÁÁÁÁÁÁ
ÁÁÁ
ÁÁÁÁÁÁÁÁÁÁÁÁÁÁÁÁÁÁÁ
ÁÁÁ
ÁÁÁÁÁÁÁÁÁÁÁÁÁÁÁÁÁÁÁ
ÁÁÁÁÁÁÁÁÁÁÁÁÁÁÁÁÁÁÁÁÁÁ
ÁÁÁÁÁÁÁÁÁÁÁÁÁÁÁÁÁÁÁÁÁÁ
ÁÁÁ
ÁÁÁÁÁÁÁÁÁÁÁÁÁÁÁÁÁÁÁ
ÁÁÁÁÁÁÁÁÁÁÁÁÁÁÁÁÁÁÁÁÁÁ
11
Never continue flight towards or into a radar shadow
or the blue REACT field.
WARNING
STORMS SITUATED BEHIND INTERVENING RAINFALL
CAN BE MORE SEVERE THAN DEPICTED ON THE DISPLAY.
If the radar signal can penetrate a storm, the target
displayed seems to cast a shadow with no visible returns.
This indicates that the storm contains a great amount of
rain, that attenuates the signal and prevents the radar from
seeing beyond the cell under observation.
The REACT blue field shows areas where attenuation
could be hiding severe weather. Both the shadow and the
blue field are to be avoided by 20 miles. Keep the REACT
blue field turned on. The blue field forms fingers that point
toward the stronger cells.
Severe Weather Avoidance Procedures
Table 5–9
Configurations of Individual Echoes (Northern
Hemisphere)
Sometimes a large echo develops configurations that are associated
with particularly severe aviation hazards. Several of these are
discussed below.
AVOID HOOK ECHOES BY 20 MILES
The hook is probably the best known echo associated with severe
weather. It is an appendage of a thunderstorm echo and usually only
appears on weather radars. Figure 5–40 shows a hook echo.
A28–1146–111
REV 2
Radar Facts
5-47
PRIMUSR 660 Digital Weather Radar System
N
AD–15560–R1@
Typical Hook Pattern
Figure 5–40
The hooks are located at the right rear side of the thunderstorm echo’s
direction of movement (usually the southwest quadrant).
The hook is not the tornado echo! A small scale low pressure area is
centered at the right rear side of the thunderstorm echo near its edge.
The low usually ranges from about 3 to 10 miles in diameter.
Precipitation is drawn around the low’s cyclonic circulation to form the
characteristic hook shape. Tornadoes form within the low near hook.
According to statistics from the NSSL, almost 60 percent of all observed
hook echoes have tornadoes associated with them. A tornado is always
suspected when a hook echo is seen.
A hook can form with no tornadoes and vice versa. However, when a
bona fide hook is observed on a weather radar, moderate or greater
turbulence, strong shifting surface winds, and hail are often nearby and
aircraft should avoid them.
There are many patterns on radar that resemble hook echoes but are
not associated with severe weather. Severe weather hook echoes last
at least 5 minutes and are less than 25 miles in diameter. The favored
location for hook echoes is to the right rear of a large and strong cell,
however, in rare cases tornadoes occur with hooks in other parts of the
cell.
Radar Facts
5-48
A28–1146–111
REV 2
PRIMUSR 660 Digital Weather Radar System
AVOID V–NOTCH BY 20 MILES
A large isolated echo sometimes has the configuration that is shown
in figure 5–41. This echo is called V–notch or flying eagle although
some imagination may be needed by the reader to see the eagle.
V–notch echoes are formed by the wind pattern at the leading edge (left
front) of the echo. Thunderstorm echoes with V–notches are often
severe, containing strong gusty winds, hail, or funnel clouds, but not all
V–notches indicate severe weather. Again, severe weather is most
likely at S in figure 5–41.
N
v
s echo movement
AD–15561–R1@
V–Notch Echo, Pendant Shape
Figure 5–41
A28–1146–111
REV 2
Radar Facts
5-49
PRIMUSR 660 Digital Weather Radar System
AVOID PENDANT BY 20 MILES
The pendant shape shown in figure 5–42, represents one of the
most severe storms – the supercell. One study concluded that, in
supercells:
D
The average maximum size of hail is over 2 inches (5.3 cm)
D
The average width of the hail swath is over 12.5 miles (20.2 km)
D
Sixty percent produce funnel clouds or tornadoes.
The classic pendant shape echo is shown in figure 5–42. Note the
general pendant shape, the hook, and the steep rain gradient. This
storm is extremely dangerous and must be avoided.
STORM MOTION
N
AD–35706@
The Classic Pendant Shape
Figure 5–42
Radar Facts
5-50
A28–1146–111
REV 2
PRIMUSR 660 Digital Weather Radar System
AVOID STEEP RAIN GRADIENTS BY 20 MILES
Figure 5–43 shows steep rain gradients. Refer to the paragraph,
Interpreting Weather Radar Images, in this section, for a detailed
explanation of weather images.
AD–51781–R1@
Rain Gradients
Figure 5–43
AVOID ALL CRESCENT SHAPED ECHOES BY 20 MILES
A crescent shaped echo, shown in figure 5–44, with its tips pointing
away from the aircraft indicates a storm cell that has attenuated the
radar energy to the point where the entire storm cell is not displayed.
This is especially true if the trailing edge is very crisp and well defined
with what appears to be a steep rain gradient.
When REACT is selected, the area behind the steep rain gradient fills
in with cyan.
A28–1146–111
REV 2
Radar Facts
5-51
PRIMUSR 660 Digital Weather Radar System
50
40
30
20
10
AD–22161–R1@
Crescent Shape
Figure 5–44
Line Configurations
AVOID THUNDERSTORM ECHOES AT THE SOUTH END OF A
LINE OR AT A BREAK IN A LINE BY 20 MILES
The echo at the south end of a line of echoes is often severe and so too
is the storm on the north side of a break in line. Breaks frequently fill in
and are particularly hazardous for this reason. Breaks should be
avoided unless they are 40 miles wide. This is usually enough room to
avoid thunderstorm hazards.
The above two locations favor severe thunderstorm formation since
these storms have less competition for low level moisture than others
nearby.
Radar Facts
5-52
A28–1146–111
REV 2
PRIMUSR 660 Digital Weather Radar System
AVOID LINE ECHO WAVE PATTERNS (LEWP) BY 20 MILES
One portion of a line can accelerate and cause the line to
assume a wave–like configuration. Figure 5–45 is an example of an
LEWP. The most severe weather is likely at S. LEWPs form solid or
nearly solid lines that are dangerous to aircraft operations and
disruptive to normal air traffic flow.
N
S
AD–15562–R1@
Line Echo Wave Pattern (LEWP)
Figure 5–45
The S indicates the location of the greatest hazards to aviation. The
next greatest probability is anywhere along the advancing (usually east
or southeast) edge of the line.
A28–1146–111
REV 2
Radar Facts
5-53
PRIMUSR 660 Digital Weather Radar System
AVOID BOW–SHAPED LINE OF ECHOES BY 20 MILES
Sometimes a fast moving, broken to solid thunderstorm line becomes
bow–shaped, as shown in figure 5–46. Severe weather is most
likely along the bulge and at the north end, but severe weather can
occur at any point along the line. Bow–shaped lines are particularly
disruptive to aircraft operations because they are broken to solid and
can accelerate to speeds in excess of 70 knots within an hour.
S
N
VIP 1
100 mi
VIP 3
VIP 5
AD–15563–R1@
Bow–Shaped Line of Thunderstorms
Figure 5–46
Radar Facts
5-54
A28–1146–111
REV 2
PRIMUSR 660 Digital Weather Radar System
Additional Hazards
TURBULENCE VERSUS DISTANCE FROM STORM CORE
The stronger the return, the further the turbulence is encountered from
the storm core at any altitude. Severe turbulence is often found in the
tenuous anvil cloud 15 to 20 miles downwind from a severe storm core.
Moreover, the storm cloud is only the visible portion of a turbulent
system whose up and down drafts often extend outside of the storm
proper.
TURBULENCE VERSUS DISTANCE FROM STORM EDGE
Severe clear–air turbulence can occur near a storm, most often on the
downwind side. Tornadoes are located in a variety of positions with
respect to associated echoes, but many of the most intense and
enduring occur on the up–relative–wind side. The air rising in a tornado
can contribute to a downwind area of strong echoes, while the tornado
itself can or can not return an echo. Echo hooks and appendages,
though useful indexes of tornadoes, are not infallible guides.
The appearance of a hook warns the pilot to stay away, but just because
the tornado cannot be seen is no assurance that there is no tornado
present.
Expect severe turbulence up to 20 NM away from severe storms; this
turbulence often has a well–defined radar echo boundary. This
distance decreases somewhat with weaker storms that display
less well–defined echo boundaries.
Appendix A, Federal Aviation Administration (FAA) Advisory Circulars,
of this manual contains several advisory circulars. It is recommended
that you become familiar with them.
A28–1146–111
REV 2
Radar Facts
5-55
PRIMUSR 660 Digital Weather Radar System
GROUND MAPPING
Ground mapping operation is selected with the GMAP button. An
example of ground map display is shown in figure 5–47. Turn the TILT
control down until the desired amount of terrain is displayed. The
degree of down–tilt depends upon the type of terrain, aircraft altitude,
and selected range. Tables 5–10 and 5–11 show tilt settings for maximal
ground target display at selected ranges.
AD–51782–R1@
Ground Mapping Display
Figure 5–47
For the low ranges (5, 10, 25, and 50 NM), the transmitter pulsewidth is
narrowed and the receiver bandwidth is widened to enhance the
identification of small targets. In addition, the receiver STC characteristics
are altered to better equalize ground target reflections versus range. As
a result, the preset gain position is generally used to display the desired
map. The pilot can manually decrease the gain to eliminate unwanted
clutter.
Radar Facts
5-56
A28–1146–111
REV 2
PRIMUSR 660 Digital Weather Radar System
RANGE
SCALE
(NM)
10
25
200
LINE OF
SIGHT
(NM)
50
100
40,000
–12
–8
246
35,000
–11
–8
230
–10
–7
–13
–9
–7
–11
–8
–6
–10
–7
–6
–5
25,000
20,000
15,000
10,000
–13
–8
–6
5,000
–9
–6
–5
4,000
–8
–6
–5
3,000
–7
–5
–5
2,000
–6
–5
–4
1,000
–5
–4
(LINE OF SIGHT LIMITED REGION)
30,000
(TILT LIMITED
REGION)
ALTITUDE
(FEET)
213
195
174
151
123
87
78
67
55
39
TILT Setting for Maximal Ground Target Display
12–Inch Radiator
Table 5–10
NOTE:
The line of sight distance is nominal. Atmospheric conditions
and terrains offset this value.
A28–1146–111
REV 2
Radar Facts
5-57
PRIMUSR 660 Digital Weather Radar System
RANGE
SCALE
(MILES)
5
10
25
50
100
200
LINE OF
SIGHT
(MILES)
–11
–7
–6
246
–10
–7
–5
230
–9
–6
–5
213
–8
–6
–7
–5
35,000
30,000
25,000
20,000
–8
–6
–5
–12
–7
–5
–4
15,000
10,000
5,000
–12
–8
–7
–4
4,000
–11
–7
–5
–4
3,000
–8
–6
–4
–3
2,000
–6
–5
–4
–3
1,000
–5
–4
–3
195
(LINE OF
SIGHT LIMITED REGION)
40,000
(TILT LIMITED
REGION)
ALTITUDE
(FEET)
174
151
123
87
78
67
55
39
AD–12041@
TILT Setting for Maximal Ground Target Display
18–Inch Radiator
Table 5–11
NOTE:
Radar Facts
5-58
The line of sight distance is nominal. Atmospheric conditions
and terrains offset this value.
A28–1146–111
REV 2
PRIMUSR 660 Digital Weather Radar System
6.
Maximum Permissible Exposure
Level (MPEL)
Heating and radiation effects of weather radar can be hazardous to life.
Personnel should remain at a distance greater than R from the radiating
antenna in order to be outside of the envelope in which radiation
exposure levels equal or exceed 10 mW/cm2, the limit recommended
in FAA Advisory Circular AC No. 20–68B, August 8, 1980, Subject:
Recommended Radiation Safety Precautions for Ground Operation of
Airborne Weather Radar. The radius, R, to the maximum permissible
exposure level boundary is calculated for the radar system on the basis
of radiator diameter, rated peak–power output, and duty cycle. The
greater of the distances calculated for either the far–field or near–field
is based on the recommendations outlined in AC No. 20–68B. The
advisory circular is reproduced without Appendix 1 in Appendix A of this
manual.
The IEEE Standard for Safety Level with Respect to Human Exposure
to Radio Frequency Electronic Fields 3kHz to 300 GHz (IEEE
C95.1–1991), recommends an exposure level of no more than 6
mW/cm2.
Honeywell recommends that operators follow the 6 mW/cm2 standard.
Figure 6–1 shows MPEL for both exposure levels.
MPEL Boundary
Figure 6–1
A28–1146–111
REV 3
Maximum Permissible Exposure Level (MPEL)
6-1/(6-2 blank)
PRIMUSR 660 Digital Weather Radar System
7.
In–Flight Adjustments
PITCH AND ROLL TRIM ADJUSTMENTS
The PRIMUSR 660 is delivered from the Honeywell factory or repair
facility adjusted for correct pitch and roll stabilization and should be
ready for use. However, due to the tolerances of some vertical
reference sources, make a final adjustment whenever the radar or
vertical reference is replaced on the aircraft, or if stabilization problems
are observed in flight.
The four trim adjustments and their effects are summarized in table
7–1.
Trim
Adjustment
Effect On Ground
Return Display (Over
Level Terrain)
ÁÁÁÁÁÁ
ÁÁÁÁÁÁÁÁ
ÁÁÁÁÁÁÁÁÁ
ÁÁÁÁÁÁ
ÁÁÁÁÁÁÁÁ
ÁÁÁÁÁÁÁÁÁ
ÁÁÁÁÁÁ
ÁÁÁÁÁÁÁÁ
ÁÁÁÁÁÁÁÁÁ
ÁÁÁÁÁÁÁÁÁÁÁÁÁÁÁÁÁÁÁÁÁÁÁ
ÁÁÁÁÁÁ
ÁÁÁÁÁÁÁÁ
ÁÁÁÁÁÁÁÁÁ
ÁÁÁÁÁÁ
ÁÁÁÁÁÁÁÁ
ÁÁÁÁÁÁÁÁÁ
ÁÁÁÁÁÁ
ÁÁÁÁÁÁÁÁ
ÁÁÁÁÁÁÁÁÁ
ÁÁÁÁÁÁ
ÁÁÁÁÁÁÁÁ
ÁÁÁÁÁÁÁÁÁ
ÁÁÁÁÁÁ
ÁÁÁÁÁÁÁÁ
ÁÁÁÁÁÁÁÁÁ
ÁÁÁÁÁÁÁÁÁÁÁÁÁÁÁÁÁÁÁÁÁ
ÁÁÁÁÁÁÁÁÁÁÁÁÁÁÁÁÁÁÁÁÁ
ÁÁÁÁÁÁÁÁÁÁÁÁÁÁÁÁÁÁÁÁÁ
Flight Condition
Roll offset
Straight and level
Nonsymmetrical display
Pitch offset
Straight and level
Ground displays do not
follow contour of range
arcs.
Roll gain
Constant roll angle
>20°
Nonsymmetrical display
Pitch gain
Constant pitch angle Ground displays do not
>5°
follow contour of range
arcs.
NOTE:
Generally, it is recommended to perform trim adjustments only if noticeable
effects are being observed.
Pitch and Roll Trim Adjustments Criteria
Table 7–1
A28–1146–111
REV 2
In–Flight Adjustments
7-1
PRIMUSR 660 Digital Weather Radar System
NOTES:
1. Depending on the installation, not all of the
adjustments shown in table 7–1 are available. If STAB
TRIM ENABLE programming pin is open, only the roll
offset adjustment is available. If STAB TRIM ENABLE
programming pin is grounded, all four adjustments are
available. Consult the installation configuration
information for details.
2. After any adjustment procedure is completed, monitor
the ground returns displayed by the radar during
several pitch and roll maneuvers. Verify that the
ground returns stay somewhat constant during
changes in aircraft orientations. If not, repeat the
adjustment procedure.
3. After the trim adjustment feature is selected, more
than one adjustment can be made. They are available
in the sequence shown in table 7–2, and can be done
in the sequence of first finishing one adjustment, then
proceeding to do the next by pushing the STAB button.
4. The in–flight stabilization adjustment range is limited.
If you cannot achieve a satisfactory adjustment
in–flight, a ground adjustment is required.
5. Proper radar stabilization depends on the accuracy
and stability of the installed attitude source.
6. The procedures in tables 7–3, 7–4, 7–6, and 7–8 that
instruct you to “push the STAB button” assume that
you are using a controller rather than an indicator. If
you are using an indicator, pulling the TILT knob out or
pushing it in is equal to pushing the STAB button on a
controller.
7. When you finish the in–flight stabilization procedures,
the STAB can be OFF ( stab light on), an additional
push of the button is required to turn stab back on.
In–Flight Adjustments
7-2
A28–1146–111
REV 2
PRIMUSR 660 Digital Weather Radar System
Level Fight Stabilization Check
Follow the procedure in table 7–2 to determine if you need to perform
the roll offset adjustment.
ÁÁÁ
ÁÁÁÁÁÁÁÁÁÁÁÁÁÁÁÁÁÁÁ
ÁÁÁ
ÁÁÁÁÁÁÁÁÁÁÁÁÁÁÁÁÁÁÁ
ÁÁÁ
ÁÁÁÁÁÁÁÁÁÁÁÁÁÁÁÁÁÁÁ
ÁÁÁÁÁÁÁÁÁÁÁÁÁÁÁÁÁÁÁÁÁÁ
Step
Procedure
1
Trim the aircraft for straight and level flight in smooth, clear
air over level terrain at an altitude of at least 10,000 feet
AGL.
2
Select the 50–mile range and GMAP mode.
3
Adjust the tilt control until your radar display shows a solid
band of ground returns starting at the 40–mile range arc.
4
After several antenna sweeps, verify that ground returns
follow the range arc closely and are equally displayed on
both sides as shown in figure 7–1. If the ground returns are
not equally displayed on both sides (see examples in
figures 7–2 and 7–3), perform the roll offset adjustment
shown in table 7–3.
ÁÁÁ
ÁÁÁÁÁÁÁÁÁÁÁÁÁÁÁÁÁÁÁ
ÁÁÁ
ÁÁÁÁÁÁÁÁÁÁÁÁÁÁÁÁÁÁÁ
ÁÁÁÁÁÁÁÁÁÁÁÁÁÁÁÁÁÁÁÁÁÁ
ÁÁÁ
ÁÁÁÁÁÁÁÁÁÁÁÁÁÁÁÁÁÁÁ
ÁÁÁÁÁÁÁÁÁÁÁÁÁÁÁÁÁÁÁÁÁÁ
ÁÁÁÁÁÁÁÁÁÁÁÁÁÁÁÁÁÁÁÁÁÁ
Stabilization in Straight and Level Flight Check Procedure
Table 7–2
NOTE:
A condition where the strongest ground targets move from
side to side over a period of several minutes, can be caused
by the gyro erection circuits chasing a slow wingwalk in the
flightpath. Roll offset adjustment cannot compensate for this
condition.
A28–1146–111
REV 2
In–Flight Adjustments
7-3
PRIMUSR 660 Digital Weather Radar System
Symmetrical Ground Returns
Figure 7–1
100
80
60
40
wx
20
AD–17721–R2@
Ground Return Indicating Misalignment (Right)
Figure 7–2
In–Flight Adjustments
7-4
A28–1146–111
REV 2
PRIMUSR 660 Digital Weather Radar System
100
80
60
40
wx
20
AD–17722–R2@
Ground Return Indicating Misalignment (Left)
Figure 7–3
ROLL OFFSET ADJUSTMENT
You can make an in–flight adjustment when level flight stabilization
errors are detected. This procedure is done by either the WC–660
Weather Radar Controller or the WI–650/660 Weather Radar Indicator.
During this procedure, described in table 7–3, the GAIN control acts as
roll offset control. After the procedure the GAIN control reverts to acting
as a gain control.
Step
Procedure
1
If two controllers are installed, one must be turned off.
If an indicator is used as the controller, the procedure is
the same as given below.
2
Fly to an altitude of 10,000 feet above ground level (AGL),
or greater.
3
Set range to 50 NM.
In–Flight Roll Offset Adjustment Procedure
Table 7–3 (cont)
A28–1146–111
REV 2
In–Flight Adjustments
7-5
PRIMUSR 660 Digital Weather Radar System
Step
Procedure
4
Adjust the tilt down until a solid band of ground returns are
shown on the screen. Then adjust the tilt until the green
region of the ground returns start at about 40 NM.
5
Select STAB (STB) 4 times within 3 seconds. A display
with text instructions is displayed. See figure 7–4. The
radar unit is in the roll offset adjustment mode.
6
Pull out the GAIN knob to make a roll offset adjustment.
See figure 7–5 for a typical display. The offset range is
from –2.0° to +2.0° and is adjustable by the GAIN knob.
The polarity of the GAIN knob is such that clockwise
rotation of the knob causes the antenna to move down
when scanning on the right side.
7
While flying straight and level, adjust the GAIN knob until
ground clutter display is symmetrical.
8
Push in the GAIN knob. When the GAIN knob is pushed in,
the display returns to the previous message.
9
Push the STAB (STB) button to exit, or to go to the next
menu (pitch offset), if the full stab trim mode is enabled in
your installation.
ÁÁÁÁ
ÁÁÁÁÁÁÁÁÁÁÁÁÁÁÁÁÁÁ
ÁÁÁÁ
ÁÁÁÁÁÁÁÁÁÁÁÁÁÁÁÁÁÁ
ÁÁÁÁ
ÁÁÁÁÁÁÁÁÁÁÁÁÁÁÁÁÁÁ
ÁÁÁÁ
ÁÁÁÁÁÁÁÁÁÁÁÁÁÁÁÁÁÁ
ÁÁÁÁ
ÁÁÁÁÁÁÁÁÁÁÁÁÁÁÁÁÁÁ
ÁÁÁÁÁÁÁÁÁÁÁÁÁÁÁÁÁÁÁÁÁ
ÁÁÁÁÁÁÁÁÁÁÁÁÁÁÁÁÁÁÁÁÁ
ÁÁÁÁÁÁÁÁÁÁÁÁÁÁÁÁÁÁÁÁÁ
NOTE:
Once set, the roll compensation is stored in nonvolatile memory in the RTA.
It is remembered when the system is powered down.
In–Flight Roll Offset Adjustment Procedure
Table 7–3
In–Flight Adjustments
7-6
A28–1146–111
REV 2
PRIMUSR 660 Digital Weather Radar System
WX
AD–51776@
Roll Offset Adjustment Display – Initial
Figure 7–4
WX
AD–51777–R1@
Roll Offset Adjustment Display – Final
Figure 7–5
A28–1146–111
REV 2
In–Flight Adjustments
7-7
PRIMUSR 660 Digital Weather Radar System
PITCH OFFSET ADJUSTMENT
This in–flight adjustment is made in straight and level flight when the
ground returns do not follow the contours of the radar display range
arcs. The procedure is listed in table 7–4.
Step
Procedure
1
If two controllers are installed, one must be turned off.
If an indicator is used, the procedure is the same as given
below.
2
Fly to an altitude of 10,000 feet AGL or greater.
3
Set range to 50 NM.
4
Adjust the tilt down until a solid band of ground returns are
shown on the screen. Then adjust the tilt until the green
region of the ground returns start at about 40 NM.
5
Select STAB (STB) 4 times within 3 seconds. The roll
offset display is shown.
6
From the roll offset entry menu, push the STAB (STB)
button once more to bring up the pitch offset entry menu.
7
To change the pitch offset value, pull out the GAIN knob
and rotate it. The offset range is from –2.0° to +2.0°.
8
When flying straight and level, adjust so the contour of the
ground returns follow the contour of the range arcs as
closely as possible.
9
When change is completed, push in the GAIN knob. The
display returns to the previous message.
10
Push the STAB (STB) button to go to the next menu (roll
gain).
ÁÁÁÁ
ÁÁÁÁÁÁÁÁÁÁÁÁÁÁÁÁÁÁ
ÁÁÁÁ
ÁÁÁÁÁÁÁÁÁÁÁÁÁÁÁÁÁÁ
ÁÁÁÁ
ÁÁÁÁÁÁÁÁÁÁÁÁÁÁÁÁÁÁ
ÁÁÁÁ
ÁÁÁÁÁÁÁÁÁÁÁÁÁÁÁÁÁÁ
ÁÁÁÁ
ÁÁÁÁÁÁÁÁÁÁÁÁÁÁÁÁÁÁ
Pitch Offset Adjustment Procedure
Table 7–4
In–Flight Adjustments
7-8
A28–1146–111
REV 2
PRIMUSR 660 Digital Weather Radar System
ROLL STABILIZATION CHECK
Once proper operation in level flight has been established, you can
verify correct roll stabilization using the procedures in table 7–5.
ÁÁÁ
ÁÁÁÁÁÁÁÁÁÁÁÁÁÁÁÁÁÁÁ
ÁÁÁ
ÁÁÁÁÁÁÁÁÁÁÁÁÁÁÁÁÁÁÁ
ÁÁÁ
ÁÁÁÁÁÁÁÁÁÁÁÁÁÁÁÁÁÁÁ
ÁÁÁ
ÁÁÁÁÁÁÁÁÁÁÁÁÁÁÁÁÁÁÁ
ÁÁÁ
ÁÁÁÁÁÁÁÁÁÁÁÁÁÁÁÁÁÁÁ
ÁÁÁ
ÁÁÁÁÁÁÁÁÁÁÁÁÁÁÁÁÁÁÁ
ÁÁÁ
ÁÁÁÁÁÁÁÁÁÁÁÁÁÁÁÁÁÁÁ
ÁÁÁ
ÁÁÁÁÁÁÁÁÁÁÁÁÁÁÁÁÁÁÁ
ÁÁÁ
ÁÁÁÁÁÁÁÁÁÁÁÁÁÁÁÁÁÁÁ
ÁÁÁÁÁÁÁÁÁÁÁÁÁÁÁÁÁÁÁ
ÁÁÁ
ÁÁÁ
ÁÁÁÁÁÁÁÁÁÁÁÁÁÁÁÁÁÁÁ
ÁÁÁ
ÁÁÁÁÁÁÁÁÁÁÁÁÁÁÁÁÁÁÁ
ÁÁÁ
ÁÁÁÁÁÁÁÁÁÁÁÁÁÁÁÁÁÁÁ
ÁÁÁ
ÁÁÁÁÁÁÁÁÁÁÁÁÁÁÁÁÁÁÁ
ÁÁÁ
ÁÁÁÁÁÁÁÁÁÁÁÁÁÁÁÁÁÁÁ
ÁÁÁ
ÁÁÁÁÁÁÁÁÁÁÁÁÁÁÁÁÁÁÁ
ÁÁÁ
ÁÁÁÁÁÁÁÁÁÁÁÁÁÁÁÁÁÁÁ
ÁÁÁÁÁÁÁÁÁÁÁÁÁÁÁÁÁÁÁÁÁÁ
Step
Procedure
1
Trim the aircraft for straight and level flight in smooth, clear
air over level terrain at an altitude of at least 10,000 feet
AGL.
2
Select the 50–mile range and GMAP mode.
3
Adjust the TILT control until your radar display shows a
solid band of ground returns starting at the 40–mile range
arc. See figure 7–6.
4
Place the aircraft in a 20–degree (or greater) roll to the
right. If there is little change to the arc of ground returns,
the roll stabilization is good.
5
If ground returns come in closer on the right side and go
out on the left side, the roll is understabilized. See figure
7–7.
6
If the ground returns go out on the right side and come in
closer on the left side, the roll is overstabilized. See figure
7–8.
7
If the roll is understabilized or overstabilized, you can
perform an in–flight roll gain adjustment as shown in table
7–6.
Roll Stabilization (While Turning) Check Procedure
Table 7–5
A28–1146–111
REV 2
In–Flight Adjustments
7-9
PRIMUSR 660 Digital Weather Radar System
Symmetrical Ground Returns, Level Flight
and Good Roll Stabilization
Figure 7–6
100
80
60
40
wx
20
AD–17721–R2@
Understabilization in a Right Roll
Figure 7–7
In–Flight Adjustments
7-10
A28–1146–111
REV 2
PRIMUSR 660 Digital Weather Radar System
100
80
60
40
wx
20
AD–17722–R2@
Overstabilization in a Right Roll
Figure 7–8
ROLL GAIN ADJUSTMENT
This in–flight adjustment is made in a bank when the ground returns do
not remain symmetrical during turns. The procedure is listed in table
7–6.
ÁÁÁ
ÁÁÁÁÁÁÁÁÁÁÁÁÁÁÁÁÁÁÁ
ÁÁÁ
ÁÁÁÁÁÁÁÁÁÁÁÁÁÁÁÁÁÁÁ
ÁÁÁ
ÁÁÁÁÁÁÁÁÁÁÁÁÁÁÁÁÁÁÁ
ÁÁÁ
ÁÁÁÁÁÁÁÁÁÁÁÁÁÁÁÁÁÁÁ
ÁÁÁ
ÁÁÁÁÁÁÁÁÁÁÁÁÁÁÁÁÁÁÁ
ÁÁÁ
ÁÁÁÁÁÁÁÁÁÁÁÁÁÁÁÁÁÁÁ
ÁÁÁ
ÁÁÁÁÁÁÁÁÁÁÁÁÁÁÁÁÁÁÁ
ÁÁÁ
ÁÁÁÁÁÁÁÁÁÁÁÁÁÁÁÁÁÁÁ
ÁÁÁ
ÁÁÁÁÁÁÁÁÁÁÁÁÁÁÁÁÁÁÁ
ÁÁÁ
ÁÁÁÁÁÁÁÁÁÁÁÁÁÁÁÁÁÁÁ
ÁÁÁ
ÁÁÁÁÁÁÁÁÁÁÁÁÁÁÁÁÁÁÁ
Step
Procedure
1
If two controllers are installed, one must be turned off. If an
indicator is used as the controller, the procedure is the
same as given below.
2
Fly to an altitude of 10,000 feet AGL or greater.
3
Set range to 50 NM.
4
Adjust the tilt down until a solid band of ground returns are
shown on the screen. Then adjust the tilt until the green
region of the ground returns start at about 40 NM.
5
Select STAB (STB) 4 times within 3 seconds. A display
with text instructions for roll offset is shown.
Roll Gain Adjustment Procedure
Table 7–6 (cont)
A28–1146–111
REV 2
In–Flight Adjustments
7-11
PRIMUSR 660 Digital Weather Radar System
Step
Procedure
ÁÁÁÁ
ÁÁÁÁÁÁÁÁÁÁÁÁÁÁÁÁÁÁ
ÁÁÁÁ
ÁÁÁÁÁÁÁÁÁÁÁÁÁÁÁÁÁÁ
ÁÁÁÁ
ÁÁÁÁÁÁÁÁÁÁÁÁÁÁÁÁÁÁ
ÁÁÁÁ
ÁÁÁÁÁÁÁÁÁÁÁÁÁÁÁÁÁÁ
ÁÁÁÁ
ÁÁÁÁÁÁÁÁÁÁÁÁÁÁÁÁÁÁ
ÁÁÁÁ
ÁÁÁÁÁÁÁÁÁÁÁÁÁÁÁÁÁÁ
ÁÁÁÁ
ÁÁÁÁÁÁÁÁÁÁÁÁÁÁÁÁÁÁ
ÁÁÁÁ
ÁÁÁÁÁÁÁÁÁÁÁÁÁÁÁÁÁÁ
ÁÁÁÁ
ÁÁÁÁÁÁÁÁÁÁÁÁÁÁÁÁÁÁ
ÁÁÁÁ
ÁÁÁÁÁÁÁÁÁÁÁÁÁÁÁÁÁÁ
ÁÁÁÁ
ÁÁÁÁÁÁÁÁÁÁÁÁÁÁÁÁÁÁ
ÁÁÁÁ
ÁÁÁÁÁÁÁÁÁÁÁÁÁÁÁÁÁÁ
6
From the roll offset entry menu, push the STAB (STB)
button twice more to bring up the roll gain entry menu.
7
To change the roll gain value, pull out the GAIN knob and
rotate it. The roll gain adjustment range is from 90 to
110%.
8
While flying with a steady roll angle of at least 20°, adjust
for symmetrical display of ground returns at the 40–NM
range arc..
9
When change is completed, push in the GAIN knob. The
display returns to the previous message.
10
Push the STAB (STB) button to go to the next menu (pitch
gain).
Roll Gain Adjustment Procedure
Table 7–6
PITCH STABILIZATION CHECK
This in–flight adjustment is made in a bank when the ground returns do
not remain symmetrical during turns. The procedure is listed in table
7–7.
Step
Procedure
1
Trim the aircraft for straight and level flight in smooth, clear
air over level terrain at an altitude of at least 10,000 feet
AGL.
2
Select the 50–mile range and GMAP mode.
3
Adjust the TILT control until your radar display shows a
solid band of ground returns starting at the 40–mile range
arc. See figure 7–9.
4
Place the aircraft between 5 and 10° pitch up. If there is
little change to the arc of ground returns, the pitch
stabilization is good.
ÁÁÁÁ
ÁÁÁÁÁÁÁÁÁÁÁÁÁÁÁÁÁÁ
ÁÁÁÁ
ÁÁÁÁÁÁÁÁÁÁÁÁÁÁÁÁÁÁ
ÁÁÁÁ
ÁÁÁÁÁÁÁÁÁÁÁÁÁÁÁÁÁÁ
ÁÁÁÁ
ÁÁÁÁÁÁÁÁÁÁÁÁÁÁÁÁÁÁ
ÁÁÁÁ
ÁÁÁÁÁÁÁÁÁÁÁÁÁÁÁÁÁÁ
ÁÁÁÁ
ÁÁÁÁÁÁÁÁÁÁÁÁÁÁÁÁÁÁ
ÁÁÁÁ
ÁÁÁÁÁÁÁÁÁÁÁÁÁÁÁÁÁÁ
ÁÁÁÁ
ÁÁÁÁÁÁÁÁÁÁÁÁÁÁÁÁÁÁ
ÁÁÁÁ
ÁÁÁÁÁÁÁÁÁÁÁÁÁÁÁÁÁÁ
ÁÁÁÁ
ÁÁÁÁÁÁÁÁÁÁÁÁÁÁÁÁÁÁ
Pitch Stabilization Check Procedure
Table 7–7 (cont)
In–Flight Adjustments
7-12
A28–1146–111
REV 2
PRIMUSR 660 Digital Weather Radar System
Step
Procedure
5
If the display of ground returns goes out in range, the pitch
is understabilized. See figure 7–10.
6
If the display of ground returns comes in closer in range,
the pitch is overstabilized. See figure 7–11.
7
If the pitch is understabilized or overstabilized, you can
wish to perform an in–flight pitch gain adjustment as
shown in table 7–8.
ÁÁÁ
ÁÁÁÁÁÁÁÁÁÁÁÁÁÁÁÁÁÁÁ
ÁÁÁ
ÁÁÁÁÁÁÁÁÁÁÁÁÁÁÁÁÁÁÁ
ÁÁÁ
ÁÁÁÁÁÁÁÁÁÁÁÁÁÁÁÁÁÁÁ
ÁÁÁ
ÁÁÁÁÁÁÁÁÁÁÁÁÁÁÁÁÁÁÁ
ÁÁÁ
ÁÁÁÁÁÁÁÁÁÁÁÁÁÁÁÁÁÁÁ
ÁÁÁ
ÁÁÁÁÁÁÁÁÁÁÁÁÁÁÁÁÁÁÁ
ÁÁÁÁÁÁÁÁÁÁÁÁÁÁÁÁÁÁÁÁÁÁ
Pitch Stabilization Check Procedure
Table 7–7
Level Flight and Good Pitch Stabilization
Figure 7–9
A28–1146–111
REV 2
In–Flight Adjustments
7-13
PRIMUSR 660 Digital Weather Radar System
100
80
60
40
WX
20
AD–53802@
Understabilized in Pitch Up
Figure 7–10
Overstabilized in Pitch Up
Figure 7–11
In–Flight Adjustments
7-14
A28–1146–111
REV 2
PRIMUSR 660 Digital Weather Radar System
PITCH GAIN ADJUSTMENT
This in–flight adjustment is made in a bank when the ground returns do
not follow the contours of the range arcs during turns. The procedure
is listed in table 7–8.
ÁÁÁ
ÁÁÁÁÁÁÁÁÁÁÁÁÁÁÁÁÁÁÁ
ÁÁÁ
ÁÁÁÁÁÁÁÁÁÁÁÁÁÁÁÁÁÁÁ
ÁÁÁÁÁÁÁÁÁÁÁÁÁÁÁÁÁÁÁÁÁÁ
ÁÁÁ
ÁÁÁÁÁÁÁÁÁÁÁÁÁÁÁÁÁÁÁ
ÁÁÁ
ÁÁÁÁÁÁÁÁÁÁÁÁÁÁÁÁÁÁÁ
ÁÁÁ
ÁÁÁÁÁÁÁÁÁÁÁÁÁÁÁÁÁÁÁ
ÁÁÁ
ÁÁÁÁÁÁÁÁÁÁÁÁÁÁÁÁÁÁÁ
ÁÁÁ
ÁÁÁÁÁÁÁÁÁÁÁÁÁÁÁÁÁÁÁ
ÁÁÁÁÁÁÁÁÁÁÁÁÁÁÁÁÁÁÁ
ÁÁÁ
ÁÁÁ
ÁÁÁÁÁÁÁÁÁÁÁÁÁÁÁÁÁÁÁ
ÁÁÁ
ÁÁÁÁÁÁÁÁÁÁÁÁÁÁÁÁÁÁÁ
ÁÁÁ
ÁÁÁÁÁÁÁÁÁÁÁÁÁÁÁÁÁÁÁ
ÁÁÁ
ÁÁÁÁÁÁÁÁÁÁÁÁÁÁÁÁÁÁÁ
ÁÁÁ
ÁÁÁÁÁÁÁÁÁÁÁÁÁÁÁÁÁÁÁ
ÁÁÁ
ÁÁÁÁÁÁÁÁÁÁÁÁÁÁÁÁÁÁÁ
ÁÁÁ
ÁÁÁÁÁÁÁÁÁÁÁÁÁÁÁÁÁÁÁ
ÁÁÁ
ÁÁÁÁÁÁÁÁÁÁÁÁÁÁÁÁÁÁÁ
ÁÁÁ
ÁÁÁÁÁÁÁÁÁÁÁÁÁÁÁÁÁÁÁ
ÁÁÁ
ÁÁÁÁÁÁÁÁÁÁÁÁÁÁÁÁÁÁÁ
ÁÁÁ
ÁÁÁÁÁÁÁÁÁÁÁÁÁÁÁÁÁÁÁ
ÁÁÁ
ÁÁÁÁÁÁÁÁÁÁÁÁÁÁÁÁÁÁÁ
ÁÁÁÁÁÁÁÁÁÁÁÁÁÁÁÁÁÁÁÁÁÁ
Step
Procedure
1
If two controllers are installed, one must be turned off. If an
indicator is used as the controller, the procedure is the
same as given below.
2
Fly to an altitude of 10,000 feet AGL or greater.
3
Set range to 50 NM.
4
Adjust the tilt down until a solid band of ground returns are
shown on the screen. Then adjust the tilt until the green
region of the ground returns start at about 40 NM.
5
Push STAB (STB) 4 times within 3 seconds. A display with
text instruction is shown.
6
From the roll offset entry menu, push the STAB (STB)
button 3 more times to bring up the pitch gain entry menu.
7
To change the pitch gain value, pull out the GAIN knob and
rotate it. The pitch gain adjustment range is from 90 to
110%.
8
While flying with a steady pitch angle of >5°, adjust so the
contour of the ground returns follow the contour of the
range arcs as closely as possible.
9
When change is completed, push in the GAIN knob. The
display returns to the previous message.
10
Push the STAB button to exit the mode and save the value
in nonvolatile memory.
Pitch Gain Adjustment Procedure
Table 7–8
A28–1146–111
REV 2
In–Flight Adjustments
7-15/(7-16 blank)
PRIMUSR 660 Digital Weather Radar System
8.
In–Flight Troubleshooting
The PRIMUSR 660 Digital Weather Radar System can provide
troubleshooting information on one of two formats:
D
Fault codes
D
Text faults.
The selection is made at the time of installation. This section describes
access and use of this information.
If the fault codes option is selected, they are shown in place of the tilt
angle. The text fault option provides English text as well as fault codes
in the radar test pattern areas.
Critical functions in the receiver transmitter antenna (RTA) are
continuously monitored. Each fault condition has a corresponding
2–digit fault code (FC). Additionally, a fault name, a pilot message, and
a line maintenance message are associated with each fault condition.
Faults can be accessed on the ground, or while airborne.
D
Display, indicator, or RTA malfunction
D
FAIL annunciation on weather indicator or EFIS display.
If the feature TEXT FAULTS is enabled, the radar test pattern area
displays plain English text fault information. If it is not enabled, only the
fault code is shown (one at a time) on the indicator or EFIS display.
The PRIMUSR 660 also contains a feature called “Pilot Event Marker”
that enables the pilot to record a full set of BITE parameters at any time,
typically if the radar seems to be malfunctioning.
NOTES:
1. In some EFIS installations, radar failures are only
annunciated with an amber WX if faults are not
enabled..
2. In EFIS installations, with TEXT FAULTS enabled, the
fault codes are also presented as part of the FAIL
annunciation (e.g., FAIL 13).
A28–1146–111
REV 2
In–Flight Troubleshooting
8-1
PRIMUSR 660 Digital Weather Radar System
TEST MODE WITH TEXT FAULTS ENABLED
When airborne, if the radar is switched to TEST mode, any current
faults are displayed.
When on the ground (weight on wheels active) and the radar is switched
to TEST mode, any current faults are displayed, followed by up to 32
faults from the last 10 power on cycles. The historic faults are displayed
going from the most recent to the oldest and are cycled every two
antenna sweeps (approximately 8 seconds). The POC number
indicates how many power on counts back into the history the fault
occurred. After the last fault, an END OF LIST message is displayed.
To recycle through the list again, exit and re–enter the TEST mode.
Table 8–1 describes the six fault data fields that are displayed in figure
8–1.
ÁÁÁÁÁÁ
ÁÁÁÁÁÁÁÁÁÁÁ
ÁÁÁÁÁÁ
ÁÁÁÁÁÁÁÁÁÁÁ
ÁÁÁÁÁÁ
ÁÁÁÁÁÁÁÁÁÁÁ
ÁÁÁÁÁÁ
ÁÁÁÁÁÁÁÁÁÁÁ
ÁÁÁÁÁÁÁÁÁÁÁ
ÁÁÁÁÁÁ
ÁÁÁÁÁÁ
ÁÁÁÁÁÁÁÁÁÁÁ
ÁÁÁÁÁÁ
ÁÁÁÁÁÁÁÁÁÁÁ
ÁÁÁÁÁÁ
ÁÁÁÁÁÁÁÁÁÁÁÁÁÁÁÁ
ÁÁÁÁÁÁÁÁÁÁÁ
ÁÁÁÁÁÁÁÁÁÁÁÁÁÁÁÁ
ÁÁÁÁÁÁÁÁÁÁÁÁÁÁÁÁ
ÁÁÁÁÁÁÁÁÁÁÁÁÁÁÁÁ
ÁÁÁÁÁÁÁÁÁÁÁÁÁÁÁÁ
ÁÁÁÁÁÁÁÁÁÁÁÁÁÁÁÁ
ÁÁÁÁÁÁÁÁÁÁÁÁÁÁÁÁ
Field No.
NOTES:
Description
1
Pilot message
2
Line maintenance message
3
Fault code/power–on count
4
Fault name
5
Transmit ON/OFF
6
Strap code
1. If airborne, only fault fields 1, 2, and 3 are
displayed.
2. Airborne, only the current faults are displayed.
3. Strap codes indicate the configuration that was
done at the time of installation. Refer to the
System Description and Installation manual for
further explanation.
Fault Data Fields
Table 8–1
In–Flight Troubleshooting
8-2
A28–1146–111
REV 2
PRIMUSR 660 Digital Weather Radar System
PILOT
MESSAGE
FIELD
FAULT CODE/
POWER ON
COUNT
TRANSMIT
ON/OFF
100
FAULT
DISPLAY
MESSAGE
DIVIDER
80
LINE
MAINTENANCE
MESSAGE
60
40
TEST
1
2
FAULT
NAME
3
4
STRAP
CODE
20
AD–46709@
WEATHER INDICATOR
Fault Annunciation on Weather Indicator
With TEXT FAULT Fields
Figure 8–1
Figure 8–2 shows the fault codes displayed on EFIS with text faults
disabled.
Fault Code on EFIS Weather Display
With TEXT FAULTS Disabled
Figure 8–2
A28–1146–111
REV 2
In–Flight Troubleshooting
8-3
PRIMUSR 660 Digital Weather Radar System
Radar Indication With Text Fault Enabled (On Ground)
Figure 8–3
PILOT EVENT MARKER
At any time a full set of BITE parameters can be recorded by going in
and out of variable gain four times (pull GAIN knob for VAR, push for
preset, pull for VAR, and push for preset) within three seconds. There
is no annunciation on the display after this operation.
This feature can be useful if the radar appears to be malfunctioning and
a fail annunciation is not shown on the display. If the pilot event marker
is used, it is best to record several sets of data during the period of
misoperation. Refer to the PRIMUSR 660 System Description and
Installation Manual for information on constructing an interconnect
cable for accessing this information.
In–Flight Troubleshooting
8-4
A28–1146–111
REV 2
PRIMUSR 660 Digital Weather Radar System
FAULT CODE AND TEXT FAULT RELATIONSHIPS
Table 8–2 lists the relationship between:
D
Fault codes (FC)
D
Pilot/Maintenance (MAINT) Messages
D
Fault Name/type/description/cross reference (XREF).
FC
01
02
XREF
FAULT DESCRIPTION
4808
Startup Code CRC
4809
IOP Code CRC
4810
DSP Code CRC
4904
CONFIG Table CRC
4905
FPGA Firmware CRC
4846
2V ADC Reference
4903
IOP Ready
4908
INT ARINC 429
Loopback
4910
Spurious ARINC
Interrupt
4913
4806
03
FAULT NAME
FLASH CRC
PILOT
MSG
LINE
MAINT
RADAR
FAIL
PULL
RTA
FAULT TYPE
POWER ON
CONTINUOUS
IOP
RADAR
FAIL
PULL
RTA
POWER ON
IOP
CONTINUOUS
RADAR
FAIL
ARINC 429 INT
Coupling
IOP
EEPROM Timer CRC
FLASH CRC
PULL
RTA
POWER ON
POWER ON
RADAR
FAIL
PULL
RTA
4811
EEPROM POC
4842
STAB Trim CRC
EEPROM
REDO
STAB
TRIM
REDO
STAB
TRIM
4912
Calibration CRC
IOP
RADAR
FAIL
PULL
RTA
4812
IOP Mailbox
MAILBOX RAM
4818
DSP Mailbox
RADAR
FAIL
PULL
RTA
POWER ON
POWER ON
04
POWER ON
Text Faults
Table 8–2 (cont)
A28–1146–111
REV 2
In–Flight Troubleshooting
8-5
PRIMUSR 660 Digital Weather Radar System
PILOT
MSG
LINE
MAINT
FPGA
RADAR
FAIL
PULL
RTA
POWER ON
STC Monitor
STC DAC
RADAR
FAIL
PULL
RTA
POWER ON
4830
HVPS Monitor
HVPS MON
RADAR
FAIL
PULL
RTA
CONTINUOUS
4816
DSP RAM
4817
DSP Video RAM
POWER ON
4855
DSP Watchdog
CONTINUOUS
4900
Mailbox Miscompare
4901
DSP HOLDA Asserted
4902
DSP HOLDA Not
Asserted
4825
Filament Monitor
4827
Severe Magnetron
4829
PFN Trim Monitor
HVPS MON
12
4831
Pulse Width
PULSE WIDTH
RADAR
UNCAL
PULL
RTA
CONTINUOUS
13
4832
Elevation Error
EL POSITION
TILT
UNCAL
CHK
RADOME
/RTA
CONTINUOUS
14
4833
Azimuth Error
AZ POSITION
AZIMUTH
UNCAL
CHK
RADOME
/RTA
CONTINUOUS
15
4836
Over TEMP
OVER–TEMP
RADAR
CAUTION
PULL
RTA
CONTINUOUS
16
4837
XMITTER Power
XMTR POWER
RADAR
UNCAL
PULL
RTA
CONTINUOUS
4839
No SCI Control
CHK
CNTL
SRC
CHK
CNTL
SRC
FC
XREF
FAULT DESCRIPTION
4813
Timing FPGA RAM
4814
Timing FPGA REG
4815
IO FPGA RAM
4828
FPGA Download
4906
IO FPGA REG
06
4847
07
05
10
FAULT NAME
DSP
RADAR
FAIL
PULL
RTA
POWER ON
MAGNETRON
11
LATCHED
RADAR
FAIL
20
NO CNTL IN
4911
FAULT TYPE
No ARINC 429 Control
PULL
RTA
CONTINUOUS
PROBE
Text Faults
Table 8–2 (cont)
In–Flight Troubleshooting
8-6
A28–1146–111
REV 2
PRIMUSR 660 Digital Weather Radar System
FC
21
22
24
27
34
35
36
XREF
FAULT DESCRIPTION
4840
AGC Limiting
4927
AGC RX DAC Monitor
4928
AGC TX DAC Monitor
4841
Selftest OSC Failure
4843
Multiple AFC Unlocks
4845
AFC Sweeping
4929
AFC RX DAC Monitor
4930
AFC Trim DAC Monitor
AHRS/IRS Source
4852
Analog STAB REF
4853
LINE
MAINT
PICTURE
UNCAL
AGC
RADAR
FAIL
RCVR
SELF–TEST
PICTURE
UNCAL
AFC
FAULT TYPE
CONTINUOUS
PULL
RTA
POWER ON
PULL
RTA
CONTINUOUS
SPOKING
LIKELY
CONTINUOUS
PULL
RTA
RADAR
FAIL
ÁÁ
ÁÁÁÁÁÁ
ÁÁ
ÁÁÁÁÁÁ
4848
PILOT
MSG
FAULT NAME
POWER ON
NO STAB SRC
STAB
UNCAL
CHK ATT
SRC
INSTALLATION
Scan Switch Off
SCAN SWITCH
SCAN
SWITCH
CHK
SWITCH
INSTALLATION
4854
XMIT Switch Off
XMIT SWITCH
XMIT
SWITCH
CHK
SWITCH
INSTALLATION
4914
Invalid
Altitude/Airspeed/STAB
Strapping
INVALID
STRAPS
RADAR
UNCAL
CHK
STRAPS
4915
Invalid Controller
Source Strapping
4916
Config1 Database
Version/Size Mismatch
POWER ON
IOP
RADAR
FAIL
PULL
RTA
Text Faults
Table 8–2
A28–1146–111
REV 2
In–Flight Troubleshooting
8-7
PRIMUSR 660 Digital Weather Radar System
Table 8–3 describes the pilot messages.
ÁÁÁÁÁÁÁ
ÁÁÁÁÁÁÁÁÁÁÁÁÁÁÁ
ÁÁÁÁÁÁÁ
ÁÁÁÁÁÁÁÁÁÁÁÁÁÁÁ
ÁÁÁÁÁÁÁ
ÁÁÁÁÁÁÁÁÁÁÁÁÁÁÁ
ÁÁÁÁÁÁÁ
ÁÁÁÁÁÁÁÁÁÁÁÁÁÁÁ
ÁÁÁÁÁÁÁ
ÁÁÁÁÁÁÁÁÁÁÁÁÁÁÁ
ÁÁÁÁÁÁÁ
ÁÁÁÁÁÁÁÁÁÁÁÁÁÁÁ
ÁÁÁÁÁÁÁ
ÁÁÁÁÁÁÁÁÁÁÁÁÁÁÁ
ÁÁÁÁÁÁÁ
ÁÁÁÁÁÁÁÁÁÁÁÁÁÁÁ
ÁÁÁÁÁÁÁ
ÁÁÁÁÁÁÁÁÁÁÁÁÁÁÁ
ÁÁÁÁÁÁÁ
ÁÁÁÁÁÁÁÁÁÁÁÁÁÁÁ
ÁÁÁÁÁÁÁ
ÁÁÁÁÁÁÁÁÁÁÁÁÁÁÁ
ÁÁÁÁÁÁÁ
ÁÁÁÁÁÁÁÁÁÁÁÁÁÁÁ
ÁÁÁÁÁÁÁ
ÁÁÁÁÁÁÁÁÁÁÁÁÁÁÁ
ÁÁÁÁÁÁÁ
ÁÁÁÁÁÁÁÁÁÁÁÁÁÁÁ
ÁÁÁÁÁÁÁ
ÁÁÁÁÁÁÁÁÁÁÁÁÁÁÁ
ÁÁÁÁÁÁÁ
ÁÁÁÁÁÁÁÁÁÁÁÁÁÁÁ
ÁÁÁÁÁÁÁ
ÁÁÁÁÁÁÁÁÁÁÁÁÁÁÁ
ÁÁÁÁÁÁÁ
ÁÁÁÁÁÁÁÁÁÁÁÁÁÁÁ
ÁÁÁÁÁÁÁ
ÁÁÁÁÁÁÁÁÁÁÁÁÁÁÁ
ÁÁÁÁÁÁÁ
ÁÁÁÁÁÁÁÁÁÁÁÁÁÁÁ
ÁÁÁÁÁÁÁ
ÁÁÁÁÁÁÁÁÁÁÁÁÁÁÁ
ÁÁÁÁÁÁÁ
ÁÁÁÁÁÁÁÁÁÁÁÁÁÁÁ
Pilot MSG
Description
RADAR FAIL
The radar is currently inoperable and should not be
relied upon. It needs to be replaced or repaired at the
next opportunity.
RADAR CAUTION A failure has been detected that can compromise the
calibration accuracy of the radar. Information from the
radar should be used only for advisory purposes such
as ground mapping for navigation.
PICTURE UNCAL
TILT UNCAL
The radar functions are ok, but receiver calibration is
degraded. Color level calibration should be assumed
to be incorrect.
Have the RTA checked at the next opportunity.
An error in the antenna position system has been
detected. The displayed tilt angle setting could be
incorrect. This can also cause ground spoking.
Have the RTA checked at the next opportunity.
SPOKING LIKELY A problem has been detected that can cause spoking
to occur.
Have the system checked at the next opportunity.
STAB UNCAL
An error in the antenna positioning system has been
detected. Groundspoking, or excessive ground
returns during roll maneuvers can occur. This can be
due either to the RTA or the source of pitch and roll
information to the RTA.
SCAN SWITCH
The SCAN SWITCH located on the RTA is off,
disabling the antenna scan. Check at the next
opportunity.
XMIT SWITCH
The XMIT switch located on the RTA is off, disabling
the transmitter. Check at the next opportunity.
Pilot Messages
Table 8–3
In–Flight Troubleshooting
8-8
A28–1146–111
REV 2
PRIMUSR 660 Digital Weather Radar System
9.
Honeywell Product Support
Honeywell SPEXR program for corporate operators provides an
extensive exchange and rental service that complements a worldwide
network of support centers. An inventory of more than 9000 spare
components assures that your Honeywell equipped aircraft will be
returned to service promptly and economically. This service is available
both during and after warranty.
The aircraft owner/operator is required to ensure that units provided
through this program have been approved in accordance with their
specific maintenance requirements.
All articles are returned to Reconditioned Specifications limits when
they are processed through a Honeywell repair facility. All articles are
inspected by quality control personnel to verify proper workmanship
and conformity to Type Design and to certify that the article meets all
controlling documentation. Reconditioned Specification criteria are on
file at Honeywell facilities and are available for review. All exchange
units are updated with the latest performance reliability MODs on an
attrition basis while in the repair cycle.
When contacting a Honeywell Dealer or Customer Support Center for
service under the SPEXR program, the following information regarding
the unit and the aircraft are required:
D
Complete part number with dash number of faulty unit
D
Complete serial number of faulty unit
D
Aircraft type, serial number and registration number
D
Aircraft Owner
D
Reported complaint with faulty unit
D
Service requested (Exchange or Rental)
D
Ship to address
D
Purchase order number.
D
If faulty unit is IN WARRANTY:
- Type of warranty (NEW PRODUCT or Exchange)
- Date warranty started
D If faulty unit is covered under a Maintenance Contract:
- Type of contract
- Contract date
- Plan ID number
D If faulty unit is NOT IN WARRANTY, provide billing address
A28–1146–111
REV 2
Honeywell Product Support
9-1
PRIMUSR 660 Digital Weather Radar System
The Honeywell Support Centers listed below will assist with processing
exchange/rental orders.
24–HOUR EXCHANGE/RENTAL SUPPORT CENTERS
U.S.A. – DALLAS
800–872–7739
972–402–4300
CANADA – OTTAWA
800–267–9947
613–728–4681
ENGLAND – BASINGSTOKE
44–1256–72–2200
AUSTRALIA – TULLAMARINE
61–3–9330–1411
FRANCE – TOULOUSE
33–0–5–6171–9662
GERMANY – AOA GAUTING
0172–8207300 (in Germany)
49–172–8207300 (outside Germany)
SINGAPORE
65–542–1313
ÁÁÁÁÁÁÁÁÁÁÁ
ÁÁÁÁÁÁÁÁÁÁÁ
ÁÁÁÁÁÁÁÁÁÁÁ
ÁÁÁÁÁÁÁÁÁÁÁ
ÁÁÁÁÁÁÁÁÁÁÁ
ÁÁÁÁÁÁÁÁÁÁÁ
ÁÁÁÁÁÁÁÁÁÁÁ
ÁÁÁÁÁÁÁÁÁÁÁ
ÁÁÁÁÁÁÁÁÁÁÁ
ÁÁÁÁÁÁÁÁÁÁÁ
ÁÁÁÁÁÁÁÁÁÁÁ
ÁÁÁÁÁÁÁÁÁÁÁ
ÁÁÁÁÁÁÁÁÁÁÁ
ÁÁÁÁÁÁÁÁÁÁÁ
ÁÁÁÁÁÁÁÁÁÁÁ
ÁÁÁÁÁÁÁÁÁÁÁ
ÁÁÁÁÁÁÁÁÁÁÁ
ÁÁÁÁÁÁÁÁÁÁÁ
ÁÁÁÁÁÁÁÁÁÁÁ
ÁÁÁÁÁÁÁÁÁÁÁ
ÁÁÁÁÁÁÁÁÁÁÁ
ÁÁÁÁÁÁÁÁÁÁÁ
ÁÁÁÁÁÁÁÁÁÁÁ
ÁÁÁÁÁÁÁÁÁÁÁ
ÁÁÁÁÁÁÁÁÁÁÁ
ÁÁÁÁÁÁÁÁÁÁÁ
ÁÁÁÁÁÁÁÁÁÁÁ
ÁÁÁÁÁÁÁÁÁÁÁ
ÁÁÁÁÁÁÁÁÁÁÁ
ÁÁÁÁÁÁÁÁÁÁÁ
ÁÁÁÁÁÁÁÁÁÁÁ
ÁÁÁÁÁÁÁÁÁÁÁ
ÁÁÁÁÁÁÁÁÁÁÁÁÁÁÁÁÁÁÁÁÁÁ
CUSTOMER SUPPORT CENTERS – NORTH AMERICA
Dallas Support Center
Honeywell Inc.
Commercial Aviation Systems
7825 Ridgepoint Dr.
IRVING, TX 75063
TEL: 972–402–4300
FAX: 972–402–4999
Canada Support Center
Honeywell Inc.
Commercial Aviation Systems
3 Hamilton Avenue North
OTTAWA, ONTARIO, K1Y 4J4
TEL: 613–728–4681
FAX: 613–728–7084
Minneapolis Support Center
Honeywell Inc.
Commercial Aviation Systems
8840 Evergreen Boulevard
MINNEAPOLIS, MN 55433–6040
TEL: 612–957–4051
FAX: 612–957–4698
Ohio Support Center
Honeywell Inc.
Commercial Aviation Systems
8370 Dow Circle
STRONGSVILLE, OH 44136
TEL: 440–243–8877
FAX: 440–243–1954
Central Support Center
Honeywell Inc.
Commercial Aviation Systems
1830 Industrial Avenue
WICHITA, KS 67216
TEL: 316–522–8172
FAX: 316–522–2693
Northwest Support Center
Honeywell Inc.
Commercial Aviation Systems
4150 Lind Avenue Southwest
RENTON, WA 98055
TEL: 425–251–9511
TLX: 320033
FAX: 425–243–1954
Honeywell Product Support
9-2
A28–1146–111
REV 2
PRIMUSR 660 Digital Weather Radar System
ÁÁÁÁÁÁÁÁÁÁÁ
ÁÁÁÁÁÁÁÁÁÁÁ
ÁÁÁÁÁÁÁÁÁÁÁ
ÁÁÁÁÁÁÁÁÁÁÁ
ÁÁÁÁÁÁÁÁÁÁÁ
ÁÁÁÁÁÁÁÁÁÁÁ
ÁÁÁÁÁÁÁÁÁÁÁ
ÁÁÁÁÁÁÁÁÁÁÁ
ÁÁÁÁÁÁÁÁÁÁÁ
ÁÁÁÁÁÁÁÁÁÁÁ
ÁÁÁÁÁÁÁÁÁÁÁ
ÁÁÁÁÁÁÁÁÁÁÁ
ÁÁÁÁÁÁÁÁÁÁÁ
ÁÁÁÁÁÁÁÁÁÁÁ
CUSTOMER SUPPORT CENTERS – NORTH AMERICA (CONT)
Miami Support Center
Honeywell Inc.
Commercial Aviation Systems
7620 N.W. 25th Street
Bldg. C Unit 6
MIAMI, FL 33122
TEL: 305–436–8722
FAX: 305–436–8532
ÁÁÁÁÁÁÁÁÁÁÁ
ÁÁÁÁÁÁÁÁÁÁÁ
ÁÁÁÁÁÁÁÁÁÁÁ
ÁÁÁÁÁÁÁÁÁÁÁ
ÁÁÁÁÁÁÁÁÁÁÁ
ÁÁÁÁÁÁÁÁÁÁÁ
ÁÁÁÁÁÁÁÁÁÁÁ
ÁÁÁÁÁÁÁÁÁÁÁ
ÁÁÁÁÁÁÁÁÁÁÁ
ÁÁÁÁÁÁÁÁÁÁÁ
ÁÁÁÁÁÁÁÁÁÁÁ
ÁÁÁÁÁÁÁÁÁÁÁ
ÁÁÁÁÁÁÁÁÁÁÁ
ÁÁÁÁÁÁÁÁÁÁÁ
ÁÁÁÁÁÁÁÁÁÁÁ
ÁÁÁÁÁÁÁÁÁÁÁ
ÁÁÁÁÁÁÁÁÁÁÁ
ÁÁÁÁÁÁÁÁÁÁÁ
ÁÁÁÁÁÁÁÁÁÁÁ
ÁÁÁÁÁÁÁÁÁÁÁ
ÁÁÁÁÁÁÁÁÁÁÁ
ÁÁÁÁÁÁÁÁÁÁÁ
ÁÁÁÁÁÁÁÁÁÁÁ
ÁÁÁÁÁÁÁÁÁÁÁ
ÁÁÁÁÁÁÁÁÁÁÁ
ÁÁÁÁÁÁÁÁÁÁÁ
ÁÁÁÁÁÁÁÁÁÁÁ
ÁÁÁÁÁÁÁÁÁÁÁ
ÁÁÁÁÁÁÁÁÁÁÁ
ÁÁÁÁÁÁÁÁÁÁÁ
ÁÁÁÁÁÁÁÁÁÁÁ
ÁÁÁÁÁÁÁÁÁÁÁ
ÁÁÁÁÁÁÁÁÁÁÁ
ÁÁÁÁÁÁÁÁÁÁÁ
ÁÁÁÁÁÁÁÁÁÁÁ
ÁÁÁÁÁÁÁÁÁÁÁ
ÁÁÁÁÁÁÁÁÁÁÁ
ÁÁÁÁÁÁÁÁÁÁÁ
ÁÁÁÁÁÁÁÁÁÁÁ
ÁÁÁÁÁÁÁÁÁÁÁ
CUSTOMER SUPPORT CENTERS – REST OF THE WORLD
United Kingdom Support Center
Honeywell Avionics Systems Ltd
Edison Road, Ringway North
BASINGSTOKE, HANTS,
RG21 6QD
ENGLAND
TEL:44–1256–72–2200
FAX:44–1256–72–2201
AOG: 44–1256–72–2200
TLX: 51–858067
France Support Center
Honeywell Aerospace
1 Rue Marcel–Doret, B.P.14
31701 BLAGNAC CEDEX,
FRANCE (Toulouse)
TEL:33–5–6212–1500
FAX: 33–5–6130–0258
AOG: 33–5–6171–9662
TLX: 521635F
Singapore Support Center
Honeywell Aerospace Pte. Ltd.
2 Loyang Crescent
SINGAPORE 1750
TEL: 65–542–1313
FAX: 65–542–1212
AOG: 65–542–1313
TLX: RS 56969 HWLSSC
Australia Support Center
Honeywell Ltd.
Trade Park Drive
TULLAMARINE, 3043, VICTORIA
AUSTRALIA (Melbourne)
TEL: 61–3–9330–1411
FAX: 61–3–9330–3042
AOG: 61–3–9330–1411
TLX: 37586 HWLTUL
Germany Support Center
AOA Apparatebau Gauting GmbH
Ammerseestrasse 45–49
D82131 Gauting
GERMANY
TEL: 49–89–89317–0
FAX: 49–89–89317–183
After Hours AOG Service:
0172–8207300 (in Germany)
49–172–8207300 (outside Germany)
TLX: 0521702
A28–1146–111
REV 2
Honeywell Product Support
9-3
PRIMUSR 660 Digital Weather Radar System
PUBLICATION ORDERING INFORMATION
Additional copies of this manual can be obtained by contacting:
Honeywell Inc.
P.O. Box 29000
Business and Commuter Aviation Systems
Phoenix, Arizona 85038–9000
Attention: Publication Distribution, Dept. M/S V19A1
Telephone No.:
FAX:
E–MAIL
Honeywell Product Support
9-4
(602) 436–6900
(602) 436–1588
CAS–publications distribution@
CAS.honeywell.com
A28–1146–111
REV 2
PRIMUSR 660 Digital Weather Radar System
10. Abbreviations
Abbreviations used in this manual are defined as follows:
TERMS
DEFINITION
AC
ADC
AFC
AGC
AGL
AHRS
API
AZ
Advisory Circular
Air Data Computer
Automatic Flight Control
Automatic Gain Control
Above Ground Level
Attitude Heading Reference System
Antenna Position Indicator
Azimuth
BITE
BRT
Built–in Test Equipment
Brightness
ccw
CHK
CLR
CNTL
CONFIG
CRC
cw
Counterclockwise
Check
Clear
Control
Configuration
Cyclic Redundancy Check
Clockwise
DAC
DSP
Digital to Analog Converter
Display
EEPROM
Electrically Erasable Programmable
Read–Only Memory
Electronic Flight Instrument System
Enhanced Ground–Proximity Warning System
Electronic Horizontal Situation Indicator
Elevation
ÁÁÁÁÁÁÁÁÁÁÁÁÁÁÁÁÁÁÁÁÁ
ÁÁÁÁÁÁ
ÁÁÁÁÁÁÁÁÁÁÁÁÁÁÁ
ÁÁÁÁÁÁÁÁÁÁÁÁÁÁÁÁÁÁÁÁÁ
ÁÁÁÁÁÁÁÁÁÁÁÁÁÁÁ
ÁÁÁÁÁÁ
ÁÁÁÁÁÁÁÁÁÁÁÁÁÁÁÁÁÁÁÁÁ
EFIS
EGPWS
EHSI
EL
FAA
FC
FLTPLN, FP,
FPLN
FMS
FPGA
FSBY
Federal Aviation Administration
Fault Code
Flight Plan
ÁÁÁÁÁÁÁÁÁÁÁÁÁÁÁÁÁÁÁÁÁ
A28–1146–111
REV 2
Flight Management System
Field–Programmable Gate Array
Forced Standby
Abbreviations
10-1
PRIMUSR 660 Digital Weather Radar System
TERMS
DEFINITION
ft
Feet, Foot
GMAP, GMP
GPS
GSPD
Ground Mapping
Global Positioning System
Groundspeed
HOLDA
HVPS
Hold Acknowledge
High Voltage Power Supply
INHIB
INT
IO
IOP
IRS
Inhibit
Interrupt
Input/Output
Inoperative
Inertial Reference System
kt
Knot(s)
LEWP
LSS, LX
Line Echo Wave Patterns
Lightning Sensor System
MAINT
MFD
MON
MPEL
MSG
Maintenance
Multifunction Display
Monitor
Maximum Permissible Exposure Level
Message
N/A
NAV
ND
NM
NSSL
NWS
Not Applicable
Navigation
Navigation Display
Nautical Mile
National Severe Storms Laboratory
National Weather Service
OSC
Oscillator
PFN
POC
PPI
Pulse Forming Network
Power on Count
Plan–Position Indicator
RCT, REACT
RCVR
Rain Echo Attenuation Compensation Technique
Receiver
ÁÁÁÁÁÁÁ
ÁÁÁÁÁÁÁÁÁÁÁÁÁÁÁ
ÁÁÁÁÁÁÁ
ÁÁÁÁÁÁÁÁÁÁÁÁÁÁÁ
ÁÁÁÁÁÁÁ
ÁÁÁÁÁÁÁÁÁÁÁÁÁÁÁ
ÁÁÁÁÁÁÁ
ÁÁÁÁÁÁÁÁÁÁÁÁÁÁÁ
ÁÁÁÁÁÁÁ
ÁÁÁÁÁÁÁÁÁÁÁÁÁÁÁ
ÁÁÁÁÁÁÁ
ÁÁÁÁÁÁÁÁÁÁÁÁÁÁÁ
ÁÁÁÁÁÁÁ
ÁÁÁÁÁÁÁÁÁÁÁÁÁÁÁ
Abbreviations
10-2
A28–1146–111
REV 2
PRIMUSR 660 Digital Weather Radar System
TERMS
DEFINITION
ÁÁÁÁÁÁ
ÁÁÁÁÁÁÁÁÁÁÁÁÁÁÁ
ÁÁÁÁÁÁ
ÁÁÁÁÁÁÁÁÁÁÁÁÁÁÁ
ÁÁÁÁÁÁÁÁÁÁÁÁÁÁÁÁÁÁÁÁÁ
ÁÁÁÁÁÁÁÁÁÁÁÁÁÁÁÁÁÁÁÁÁ
REG
RTA
RX
Register
Receiver Transmitter Antenna
Receiver
SBY, STBY
SCI
SCT, SECT
SLV
SPEX
STAB, STB
STC
Standby
Serial Control Interface
Scan Sector
Slave
Spares Exchange
Stabilization
Sensitivity Time Control
TCAS
TEMP
TERR
TGT
TST
TX
Traffic Alert and Crew Alerting System
Temperature
Terrain
Target
Test
Transmitter
UDI
UNCAL
Universal Digital Interface
Uncalibration
VAR
VIP
Variance
Video Integrated Processor
WOW
WX
Weight–on–Wheels
Weather
XMIT, XMITTER,
XMTR
XREF
XSTC
Transmitter
ÁÁÁÁÁÁÁÁÁÁÁÁÁÁÁÁÁÁÁÁÁ
ÁÁÁÁÁÁÁÁÁÁÁÁÁÁÁ
ÁÁÁÁÁÁ
ÁÁÁÁÁÁÁÁÁÁÁÁÁÁÁÁÁÁÁÁÁ
ÁÁÁÁÁÁ
ÁÁÁÁÁÁÁÁÁÁÁÁÁÁÁ
ÁÁÁÁÁÁÁÁÁÁÁÁÁÁÁÁÁÁÁÁÁ
ÁÁÁÁÁÁ
ÁÁÁÁÁÁÁÁÁÁÁÁÁÁÁ
ÁÁÁÁÁÁÁÁÁÁÁÁÁÁÁÁÁÁÁÁÁ
A28–1146–111
REV 2
Cross Reference
Extended Sensitivity Time Control
Abbreviations
10-3/(10-4 blank)
PRIMUSR 660 Digital Weather Radar System
Appendix A
Federal Aviation Administration
(FAA) Advisory Circulars
NOTE:
This section contains a word–for–word transcription of the
contents of the following FAA advisory circulars:
D AC 20–68B
D AC 00–24B.
SUBJECT: RECOMMENDED RADIATION SAFETY
PRECAUTIONS
FOR
GROUND
OPERATION OF AIRBORNE WEATHER
RADAR
Purpose
This circular sets forth recommended radiation safety precautions to be
taken by personnel when operating airborne weather radar on the ground.
Cancellation
AC 20–66A, dated April 11, 1975, is cancelled.
Related Reading Material
Barnes and Taylor, radiation Hazards and Protection (London: George
Newnes Limited, 1963), p. 211.
U.S. Department of Health, Education and Welfare, Public Health Service,
Consumer Protection and Environmental Health Service, ”Environmental
health microwaves, ultraviolet radiation, and radiation from lasers and
television receivers – An Annotated Bibliography,” FS 2.300: RH–35,
Washington, U.S. Government Printing Office, pp 56–57.
Mumford, W. W., ”Some technical aspects of microwave radiation
hazards,” Proceedings of the IRE, Washington, U.S. Government
Printing Office, February 1961, pp 427–447.
Background
Dangers from ground operation of airborne weather radar include the
possibility of human body damage and ignition of combustible materials
by radiated energy. Low tolerance parts of the body include the eyes
and the testis.
A28–1146–111
REV 2
Federal Aviation Administration (FAA) Advisory Circulars
A–1
PRIMUSR 660 Digital Weather Radar System
Precautions
Management and supervisory personnel should establish procedures
for advising personnel of dangers from operating airborne weather
radars on the ground. Precautionary signs should be displayed in
affected areas to alert personnel of ground testing.
GENERAL
D
Airborne weather radar should be operated on the ground only by
qualified personnel.
D
Installed airborne radar should not be operated while other aircraft
is in the hangar or other enclosure unless the radar transmitter is not
operating, or the energy is directed toward an absorption shield
which dissipates the radio frequency energy. Otherwise, radiation
within the enclosure can be reflected throughout the area.
BODY DAMAGE
To prevent possible human body damage, the following precautions
should be taken:
D
Personnel should never stand nearby and in front of a radar antenna
which is transmitting. When the antenna is not scanning, the danger
increases.
D
A recommended safe distance from operating airborne weather
radars should be established. A safe distance can be determined by
using the equations in Appendix 1 or the graphs of figures 1 and 2.
This criterion is now accepted by many industrial organizations and
is based on limiting exposure of humans to an average power
density not greater than 10 milliwatts per square centimeter.
D
Personnel should be advised to avoid the end of an open waveguide
unless the radar is turned off.
D
Personnel should be advised to avoid looking into a waveguide, or
into the open end of a coaxial connector or line connector to a radar
transmitter output, as severe eye damage may result.
D
Personnel should be advised that when high power radar
transmitters are operated out of their protective cases, X–rays may
be emitted. Stray X–rays may emanate from the glass envelope
type pulser, oscillator, clipper, or rectifier tubes, as well as
magnetrons.
Federal Aviation Administration (FAA) Advisory Circulars
A–2
A28–1146–111
REV 2
PRIMUSR 660 Digital Weather Radar System
COMBUSTIBLE MATERIALS
To prevent possible fuel ignition, an insulated airborne weather radar
should not be operated while an aircraft is being refueled or defueled.
M.C. Beard
Director of Airworthiness.
SUBJECT: THUNDERSTORMS
Purpose
This advisory circular describes the hazards of thunderstorms to
aviation and offers guidance to help prevent accidents caused by
thunderstorms.
Cancellation
Advisory Circular 00–24A, dated June 23, 1978, is cancelled.
Related Reading Material
Advisory Circulars, 00–6A, Aviation Weather, 090–45B, Aviation
Weather Services, 00–50A, Low Level Wind Shear.
General
We all know what a thunderstorm looks like. Much has been written
about the mechanics and life cycles of thunderstorms. They have been
studied for many years; and while much has been learned, the studies
continue because much is not known. Knowledge and weather radar
have modified attitudes toward thunderstorms, but one rule continues
to be true – any storm recognizable as a thunderstorm should be
considered hazardous until measurements have shown it to be safe.
That means safe for you and your aircraft. Almost any thunderstorm
can spell disaster for the wrong combination of aircraft and pilot.
A28–1146–111
REV 2
Federal Aviation Administration (FAA) Advisory Circulars
A–3
PRIMUSR 660 Digital Weather Radar System
Hazards
A thunderstorm packs just about every weather hazard known to
aviation into one vicious bundle. Although the hazards occur in
numerous combinations, let us look at the most hazardous combination
of thunderstorm, the squall line, then we will examine the hazards
individually.
SQUALL LINES
A squall line is a narrow band of active thunderstorms. Often it develops
on or ahead of a cold front in moist, unstable air, but it may develop in
unstable air far removed from any front. The line may be too long to
detour easily and too wide and severe to penetrate. It often contains
steady–state thunderstorms and presents the single most intense
weather hazard to aircraft. It usually forms rapidly, generally reaching
maximum intensity during the late afternoon and the first few hours of
darkness.
TORNADOES
D
The most violent thunderstorms draw into their cloud bases with
great vigor. If the incoming air has any initial rotating motion, it often
forms an extremely concentrated vortex from the surface well into
the cloud. Meteorologists have estimated that wind in such a vortex
can exceed 200 knots; pressure inside the vortex is quite low. The
strong winds gather dust and debris and the low pressure generates
a funnel shaped cloud extending downward from the cumulonimbus
base. If the cloud does not reach the surface, it is a funnel cloud; if
it touches the land surface, it is a tornado.
D
Tornadoes occur with both isolated and squall line thunderstorms.
Reports for forecasts of tornadoes indicate that atmospheric
conditions are favorable for violent turbulence. An aircraft entering
a tornado vortex is almost certain to suffer structural damage. Since
the vortex extends well into the cloud, any pilot inadvertently caught
on instruments in a severe thunderstorm, could encounter a hidden
vortex.
D
Families of tornadoes have been observed as appendages of the
main cloud extending several miles outward from the area of
lightning and precipitation. Thus, any cloud connected to a severe
thunderstorm carries a threat of violence.
Federal Aviation Administration (FAA) Advisory Circulars
A–4
A28–1146–111
REV 2
PRIMUSR 660 Digital Weather Radar System
TURBULENCE
D
Potentially hazardous turbulence is present in all thunderstorms,
and a severe thunderstorm can destroy an aircraft. Strongest
turbulence within the cloud occurs with shear between updrafts and
downdrafts. Outside the cloud, shear turbulence has been
encountered several thousand feet above and 20 miles laterally
from a severe thunderstorm. A low level turbulent area is the shear
zone associated with the gust front. Often, a roll cloud on the leading
edge of a storm marks the top of the eddies in this shear and it
signifies an extremely turbulent zone. Gust fronts move far ahead
(up to 15 miles) of associated precipitation. The gust front causes
a rapid and sometimes drastic change in surface wind ahead of an
approaching storm. Advisory Circular 00–50A, ”Low Level Wind
Shear,” explains in greater detail the hazards associated with gust
fronts. Figure 1 shows a schematic cross section of a thunderstorm
with areas outside the cloud where turbulence may be encountered.
D
It is almost impossible to hold a constant altitude in a thunderstorm,
and maneuvering in an attempt to do so produces greatly increased
stress on the aircraft. It is understandable that the speed of the
aircraft determines the rate of turbulence encounters. Stresses are
least if the aircraft is held in a constant attitude and allowed to ride
the waves. To date, we have no sure way to pick soft spots in a
thunderstorm.
ICING
D
Updrafts in a thunderstorm support abundant liquid water with
relatively large droplet sizes; and when carried above the freezing
level, the water becomes supercooled. When temperature in the
upward current cools to about –15 _C, much of the remaining water
vapor sublimates as ice crystals; and above this level, at lower
temperatures, the amount of supercooled water decreases.
D
Supercooled water freezes on impact with an aircraft. Clear icing
can occur at any altitude above the freezing level; but at high levels,
icing from smaller droplets may be rime or mixed with rime and clear.
The abundance of large, supercooled droplets makes clear icing
very rapid between O _C and –15 _C and encounters can be
frequent in a cluster of cells. Thunderstorm icing can be extremely
hazardous.
A28–1146–111
REV 2
Federal Aviation Administration (FAA) Advisory Circulars
A–5
PRIMUSR 660 Digital Weather Radar System
COLD
0
5
10
15
Schematic Cross Section of a Thunderstorm
Figure A–1
HAIL
D
Hail competes with turbulence as the greatest thunderstorm hazard
to aircraft. Supercooled drops above the freezing level begin to
freeze. Once a drop has frozen, other drops latch on and freeze to
it, so the hailstone grows – sometimes into a huge iceball. Large hail
occurs with severe thunderstorms with strong updrafts that have
built to great heights. Eventually, the hailstones fall, possibly some
distance from the storm core. Hail may be encountered in clear air
several miles from dark thunderstorm clouds.
D
As hailstones fall through air whose temperature is above 0 _C, they
begin to melt and precipitation may reach the ground as either hail
or rain. Rain at the surface does not mean the absence of hail aloft.
You should anticipate possible hail with any thunderstorm,
especially beneath the anvil of a large cumulonimbus. Hailstones
larger than one–half inch in diameter can significantly damage an
aircraft in a few seconds.
Federal Aviation Administration (FAA) Advisory Circulars
A–6
A28–1146–111
REV 2
PRIMUSR 660 Digital Weather Radar System
LOW CEILING AND VISIBILITY
Generally, visibility is near zero within a thunderstorm cloud. Ceiling and
visibility may also be restricted in precipitation and dust between the
cloud base and the ground. The restrictions create the same problem
as all ceiling and visibility restrictions; but the hazards are increased
many fold when associated with other thunderstorm hazards of
turbulence, hail, and lightning which make precision instrument flying
virtually impossible.
EFFECT ON ALTIMETERS
Pressure usually falls rapidly with the approach of a thunderstorm, then
rises sharply with the onset of the first gust and arrival of the cold
downdraft and heavy rain showers, falling back to normal as the storm
moves on. This cycle of pressure change may occur in 15 minutes. If
the pilot does not receive a corrected altimeter setting, the altimeter
may be more than 100 feet in error.
LIGHTNING
A lightning strike can puncture the skin of an aircraft and can damage
communication and electronic navigational equipment. Lightning has
been suspected of igniting fuel vapors causing explosion; however,
serious accidents due to lightning strikes are extremely rare. Nearby
lightning can blind the pilot rendering him momentarily unable to
navigate by instrument or by visual reference. Nearby lightning can also
induce permanent errors in the magnetic compass. Lightning
discharges, even distant ones, can disrupt radio communications on
low and medium frequencies. Though lightning intensity and frequency
have no simple relationship to other storm parameters, severe storms,
as a rule, have a high frequency of lightning.
WEATHER RADAR
Weather radar detects droplets of precipitation size. Strength of the
radar return (echo) depends on drop size and number. The greater the
number of drops, the stronger is the echo, and the larger the drops, the
stronger is the echo. Drop size determines echo intensity to a much
greater extent than does drop number. Hailstones usually are covered
with a film of water and, therefore, act as huge water droplets giving the
strongest of all echoes.
Numerous methods have been used in an attempt to categorize the
intensity of a thunderstorm. To standardize thunderstorm language
between weather radar operators and pilots, the use of Video Integrator
Processor (VIP) levels is being promoted.
A28–1146–111
REV 2
Federal Aviation Administration (FAA) Advisory Circulars
A–7
PRIMUSR 660 Digital Weather Radar System
The National Weather Service (NWS) radar observer is able to
objectively determine storm intensity levels with VIP equipment. These
radar echo intensity levels are on a scale of one to six. If the maximum
VIP levels are 1 ”weak” and 2 ”moderate,” then light to moderate
turbulence is possible with lightning. VIP Level 3 is strong and severe
turbulence is possible with lightning. VIP Level 4 is very strong and
severe turbulence is likely with lightning. VIP Level 5 is intense with
severe turbulence, lightning, hail likely, and organized surface wind
gusts. VIP Level 6 is extreme with severe turbulence, lightning, large
hail, extensive wind gusts, and turbulence.
Thunderstorms build and dissipate rapidly. Therefore, do not attempt
to plan a course between echoes. The best use of ground radar
information is to isolate general areas and coverage of echoes. You
must avoid individual storms from in–flight observations either by visual
sighting or by airborne radar. It is better to avoid the whole thunderstorm
area than to detour around individual storms unless they are scattered.
Airborne weather avoidance radar is, as its name implies, for avoiding
severe weather – not for penetrating it. Whether to fly into an area of
radar echoes depends on echo intensity, spacing between the echoes,
and the capabilities of you and your aircraft. Remember that weather
radar detects only precipitation drops; it does not detect turbulence.
Therefore, the radar scope provides no assurance of avoidance
turbulence. The radar scope also does not provide assurance of
avoiding instrument weather from clouds and fog. Your scope may be
clear between intense echoes; this clear does not mean you can fly.
Remember that while hail always gives a radar echo, it may fall several
miles from the nearest cloud and hazardous turbulence may extend to
as much as 20 miles from the echo edge. Avoid intense or extreme level
echoes by at least 20 miles; that is, such echoes should be separated
by at least 40 miles before you fly between them. With weaker echoes
you can reduce the distance by which you avoid them.
DO’S AND DON’TS OF THUNDERSTORM FLYING
Above all, remember this: Never regard any thunderstorm lightly even
when radar observers report the echoes are of light intensity. Avoiding
thunderstorms is the best policy. Following are some do’s and don’ts of
thunderstorm avoidance:
D
Don’t land or take off in the face of an approaching thunderstorm.
A sudden gust front of low level turbulence could cause loss of
control.
Federal Aviation Administration (FAA) Advisory Circulars
A–8
A28–1146–111
REV 2
PRIMUSR 660 Digital Weather Radar System
D
Don’t attempt to fly under a thunderstorm even if you can see
through to the other side. Turbulence and wind shear under the
storm could be disastrous.
D
Don’t fly without airborne radar into a cloud mass containing
scattered embedded thunderstorms. Scattered thunderstorms not
embedded, usually can be visually circumnavigated.
D
Don’t trust the visual appearance to be a reliable indicator of the
turbulence inside a thunderstorm.
D
Do avoid, by at least 20 miles, any thunderstorm identified as severe
or giving an intense radar echo. This is especially true under the
anvil of a large cumulonimbus.
D
Do circumnavigate the entire area if the area has 6/1 thunderstorm
coverage.
D
Do remember that vivid and frequent lightning indicates the
probability of a severe thunderstorm.
D
Do regard as extremely hazardous, any thunderstorm with tops
35,000 feet or higher, whether the top is visually sighted or
determined by radar.
If you cannot avoid penetrating a thunderstorm, the following are some
do’s BEFORE entering the storm.
D
Tighten your safety belt, put on your shoulder harness if you have
one, and secure all loose objects.
D
Plan and hold your course to take you through the storm in a
minimum time.
D
To avoid the most critical icing, establish a penetration altitude below
the freezing level or above the level of –15 _C.
D
Verify that pitot heat is on and turn on carburetor heat or jet engine
anti–ice. Icing can be rapid at any altitude and cause almost
instantaneous power failure and/or loss of airspeed indication.
D
Establish power settings for turbulence penetration airspeed
recommended in your aircraft manual.
D
Turn up cockpit lights to highest intensity to lessen temporary
blindness from lightning.
D
If using automatic pilot, disengage altitude hold mode and speed
hold mode. The automatic altitude and airspeed controls of the
aircraft increase maneuvers, thus increasing structural stress.
A28–1146–111
REV 2
Federal Aviation Administration (FAA) Advisory Circulars
A–9
PRIMUSR 660 Digital Weather Radar System
D
If using airborne radar, tilt the antenna up and down occasionally.
This will permit you to detect other thunderstorm activity at altitudes
other than the one being flown.
Following are some do’s and don’ts during thunderstorm penetration.
D
Do keep your eyes on your instruments. Looking outside the cockpit
can increase danger of temporary blindness from lightning.
D
Don’t change power settings; maintain settings
recommended turbulence penetration airspeed.
D
Do maintain constant attitude; let the aircraft ride the waves.
Maneuvers in trying to maintain constant altitude increase stress on
the aircraft.
D
Don’t turn back once you are in a thunderstorm. A straight course
through the storm most likely will get you out of the hazards most
quickly. In addition, turning maneuvers increase stress on the
aircraft.
for
the
National Severe Storms Laboratory (NSSL)
Thunderstorm Research
The NSSL has, since 1964, been the focal point of our thunderstorm
research. In–flight conditions obtained from thunderstorm penetration
by controlled, especially equipped high performance aircraft are
compared by the NSSL with National Weather Service (NWS) type
ground–based radar and with newly developed doppler radar. The
following comments are based on NSSL’s interpretation of information
and experience from this research.
RELATIONSHIP BETWEEN TURBULENCE AND REFLECTIVITY
Weather radar reflects precipitation such as rain and hail. It has been
found, however, that the intensity level of the precipitation reflection
does correlate with the degree of turbulence in a thunderstorm. The
most severe turbulence is not necessarily found at the same place that
gives the greatest radar reflection.
RELATIONSHIP BETWEEN TURBULENCE AND ALTITUDE
The NSSL studies of thunderstorms extending to 60,000 feet show little
variation of turbulence intensity with altitude.
Federal Aviation Administration (FAA) Advisory Circulars
A–10
A28–1146–111
REV 2
PRIMUSR 660 Digital Weather Radar System
TURBULENCE AND ECHO INTENSITY ON NWS RADAR
(WSR–57)
The frequency and severity of turbulence increases with radar
reflectivity, a measure of the intensity of echoes from storm targets at
a standard range. Derived gust velocities exceeding 2,100 feet per
minute (classified as severe turbulence) are commonly encountered in
level 3 storms. In level 2 storms, gusts of intensity between 1,200 and
2,100 feet per minute (classified as moderate turbulence) are
encountered approximately once for each 10 nautical miles of
thunderstorm flight.
TURBULENCE IN RELATION TO DISTANCE FROM STORM
CORE
NSSL data indicates that the frequency and severity of turbulence
encounters decrease slowly with distance from storm cores. Significantly,
the data indicates that within 20 miles from the center of severe storm
cores, moderate to severe turbulence is encountered at any altitude about
one–fifth as often as in the cores of Level 3 or greater thunderstorms.
Further, the data indicates that moderate turbulence is encountered at any
altitude up to 10 miles from the center of level 2 thunderstorms. SEVERE
TURBULENCE IS OFTEN FOUND IN TENUOUS ANVIL CLOUDS 15
TO 20 MILES DOWNWIND FROM SEVERE STORM CORES. Our
findings agree with meteorological reasoning that THE STORM CLOUD
IS ONLY THE VISIBLE PORTION OF A TURBULENT SYSTEM
WHOSE UPDRAFTS AND DOWN–DRAFTS OFTEN EXTEND
OUTSIDE OF THE STORM PROPER.
TURBULENCE IN RELATION TO DISTANCE FROM THE STORM
EDGE
THE CLEAR AIR ON THE INFLOW SIDE OF A STORM IS A PLACE
WHERE SEVERE TURBULENCE OCCURS. At the edge of a cloud, the
mixing of cloudy and clear air often produces strong temperature gradients
associated with rapid variation of vertical velocity. Tornado activity is found
in a wide range of spacial relationships to the strong echoes with which
they are commonly associated, but many of the most intense and enduring
tornadoes occur on the south to west edges of severe storms. The tornado
itself is often associated with only a weak echo. Echo hooks and
appendages are useful qualitative indicators of tornado occurrence but are
by no means infallible guides. Severe turbulence should be anticipated up
to 20 miles from the radar edge of severe storms; these often have a
well–defined radar echo boundary. The distance decreases to
approximately 10 miles with weaker storms which may sometimes have
indefinite radar echo boundaries. THEREFORE, AIRBORNE RADAR IS
A PARTICULARLY USEFUL AID FOR PILOTS IN MAINTAINING A
SAFE DISTANCE FROM SEVERE STORMS.
A28–1146–111
REV 2
Federal Aviation Administration (FAA) Advisory Circulars
A–11
PRIMUSR 660 Digital Weather Radar System
TURBULENCE ABOVE STORM TOPS
Flight data shows a relationship between turbulence above storm tops
and the airspeed of upper tropospheric winds. WHEN THE WINDS AT
STORM TOP EXCEED 100 KNOTS, THERE ARE TIMES WHEN
SIGNIFICANT TURBULENCE MAY BE EXPERIENCED AS MUCH
AS 10,000 FEET ABOVE THE CLOUD TOPS. THIS VALUE MAY BE
DECREASED 1,000 FEET FOR EACH 10–KNOT REDUCTION OF
WIND SPEED. This is especially important for clouds whose height
exceeds the height of the tropopause. It should be noted that flight
above severe thunderstorms is an academic consideration for today’s
civil aircraft in most cases, since these storms usually extend up to
40,000 feet and above.
TURBULENCE BELOW CLOUD BASE
While there is little evidence that maximum turbulence exists at middle
heights in storms (FL 200–300), turbulence beneath a storm is not to
be minimized. This is especially true when the relative humidity is low
in any air layer between the surface and 15,000 feet. Then the lower
altitudes may be characterized by strong outflowing winds and severe
turbulence where thunderstorms are present. Therefore, THE SAME
TURBULENCE CONSIDERATIONS WHICH APPLY TO FLIGHT AT
HIGH ALTITUDES NEAR STORMS APPLY TO LOW LEVELS AS
WELL.
MAXIMUM STORM TOPS
Photographic data indicates that the maximum height attained by
thunderstorm clouds is approximately 63,000 feet. Such very tall storm
tops have not been explored by direct means, but meteorological
judgments indicate the probable existence of large hail and strong vertical
drafts to within a few thousand feet of the top of these isolated
stratosphere–penetrating storms. THEREFORE, IT APPEARS
IMPORTANT TO AVOID SUCH VERY TALL STORMS AT ALL
ALTITUDES.
HAIL IN THUNDERSTORMS
The occurrence of HAIL IS MUCH MORE CLEARLY IDENTIFIED WITH
THE INTENSITY OF ECHOES THAN IS TURBULENCE. AVOIDANCE
OF MODERATE AND SEVERE STORMS SHOULD ALWAYS BE
ASSOCIATED WITH THE AVOIDANCE OF DAMAGING HAIL.
VISUAL APPEARANCE OF STORM AND ASSOCIATED
TURBULENCE WITH THEM
On numerous occasions, flight at NSSL have indicated that NO
USEFUL CORRELATION EXISTS BETWEEN THE EXTERNAL
VISUAL APPEARANCE OF THUNDERSTORMS AND THE
TURBULENCE AND HAIL WITHIN THEM.
Federal Aviation Administration (FAA) Advisory Circulars
A–12
A28–1146–111
REV 2
PRIMUSR 660 Digital Weather Radar System
MODIFICATION OF CRITERIA WHEN SEVERE STORMS AND
RAPID DEVELOPMENT ARE EVIDENT
During severe storm situations, radar echo intensities may grow by a
factor of ten each minute, and cloud tops by 7,000 feet per minute.
THEREFORE, NO FLIGHTPATH THROUGH A FIELD OF STRONG
OR VERY STRONG STORMS SEPARATED BY 20–30 MILES OR
LESS MAY BE CONSIDERED TO REMAIN FREE FROM SEVERE
TURBULENCE.
EXTRAPOLATION TO DIFFERENT CLIMBS
General comment: Severe storms are associated with an atmospheric
stratification marked by large values of moisture in low levels, relative
dryness in middle levels, and strong wind shear. It is well known that this
stratification of moisture permits excessive magnitudes of convective
instability to exist for an indefinite period until rapid overturning of air is
triggered by a suitable disturbance. Regions of the atmosphere which
are either very dry or very moist throughout substantial depths cannot
harbor great convective instability. Rather, a more nearly neutral
thermal stratification is maintained, partially through a process of
regular atmospheric overturning.
D
Desert Areas – In desert areas, storms should be avoided on the
same basis as described in the above paragraphs. While nonstorm
turbulence may, in general, be expected more frequently over desert
areas during daylight hours than elsewhere, THE SAME
TURBULENCE CONSIDERATIONS PREVAIL IN THE VICINITY
OF THUNDERSTORMS.
D
Tropical–Humid Climates – When the atmosphere is moist and only
slightly unstable though a great depth, strong radar echoes may be
received from towering clouds which do not contain vertical velocities
as strong as those from storms over the U.S. plains. Then it is a matter
of the pilot being informed with respect to the general atmospheric
conditions accompanying storms, for it is well known that
PRACTICALLY
ALL
GEOGRAPHIC
AREAS
HAVING
THUNDERSTORMS ARE OCCASIONALLY VISITED BY SEVERE
ONES.
USE OF AIRBORNE RADAR
Airborne radar is a valuable tool; HOWEVER, ITS USE IS
PRINCIPALLY AS AN INDICATOR OF STORM LOCATIONS FOR
AVOIDANCE PURPOSES WHILE ENROUTE.
A28–1146–111
REV 2
Federal Aviation Administration (FAA) Advisory Circulars
A–13/(A–14 blank)
PRIMUSR 660 Digital Weather Radar System
Appendix B
Enhanced Ground–Proximity
Warning System (EGPWS)
The AlliedSignal Mark VII EGPWS combines information from aircraft
navigation equipment (i.e. flight management system (FMS), inertial
reference system (IRS), global positioning system (GPS), radio
altimeter) with a stored terrain data base that alerts the pilot to
potentially dangerous ground proximity.
In addition to the verbal alert, the EGPWS can display the terrain data
on the weather radar indicator. Depending on the installation, the pilot
pushes a button to display the terrain, or the terrain data is automatically
displayed when a Terrain Alert occurs.
SYSTEM OPERATION
To display the EGPWS, the weather system can be in any mode except
OFF. When the EGPWS is active, the indicator range up and down
arrows control the EGPWS display range. The AZ button on the
indicator is also active and the azimuth lines can be displayed or
removed.
The other radar controls do not change the terrain display, but if they
are used while the EGPWS is displayed, they control the radar receiver
transmitter antenna (RTA), and the effect is displayed when the system
returns to the radar display.
EGPWS Controls
The typical EGPWS installation has remotely mounted push button
controls and status annunciators that are related to the display on the
radar indicator. The paragraphs below give a functional description of
the AlliedSignal recommended controls.
A28–1146–111
REV 2
Enhanced Ground–Proximity Warning System (EGPWS)
B–1
PRIMUSR 660 Digital Weather Radar System
PUSH BUTTON CONTROLS
The following remotely mounted push buttons control the EGPWS
display:
D
INHIB (Inhibit) Button – When active, the push on/push off INHIB
button prevents terrain data from being displayed on the radar
indicator. When the button is active, the INHIB annunciator lights.
D
ON (Terrain) Button – When active, the push on/push off ON button
displays terrain on the radar indicator.
ANNUNCIATORS
The following annunciators are displayed on the radar indicator to
indicate EGPWS operation:
D
FAIL – The FAIL annunciator indicates that the EGPWS has failed.
D
INHIB – The INHIB annunciator indicates that the INHIB push
button has been pushed and is active. When INHIB is annunciated,
EGPWS is not displayed on the radar indicator, and the aural
annunciators do not sound.
NOTE:
The FAIL and INHIB annunciators are often incorporated
into the INHIB push button.
D
TERR (Terrain) – The TERR annunciator indicates that the
annunciator lamp power is on. It does not indicate the operational
status of the system.
D
ON – The ON annunciator indicates that the radar indicator is
displaying terrain. This ON push button lamp is lit if the ON push
button has been pushed and is active, or if an actual Terrain Alert
is indicated by the EGPWS system and the terrain is automatically
displayed.
NOTE:
The TERR and ON annunciators are often incorporated
into the ON push button.
Some installation may not contain all of these controls and
annunciators, or they may have different names. Most EGPWS
installations have additional controls and/or annunciators (i.e., TEST).
Refer to the appropriate AlliedSignal publication for details.
Enhanced Ground–Proximity Warning System (EGPWS)
B–2
A28–1146–111
REV 2
PRIMUSR 660 Digital Weather Radar System
Related EGPWS System Operation
Some installations may have a DATA–NAV (navigation display, and/or
checklist), lightning sensor system (LSS), and/or traffic alert and crew
alerting system (TCAS) that already share the radar indicator’s display
by way of the Universal Digital Interface (UDI) connector. These
systems have priority for access to the radar display screen. These
systems data may be overlaid on the EGPWS display, or they may
simply override the EGPWS display.
EGPWS Operation
The EGPWS system may vary, depending on the installed controls and
software level of the EGPWS computer.
In some installations, the EGPWS display on the radar indicator is
manually operated. It is only displayed if the pilot pushes the ON button,
and it is removed if the pilot pushes the ON button a second time.
In some installations, the EGPWS display has a pop–up mode in which
the terrain display is automatically displayed when the EGPWS system
detects a terrain alert situation.
The pilot can remove the ground display from the radar indicator, or
prevent the EGPWS system from displaying ground on the radar
indicator by pushing the INHIB button.
The = and O range buttons on the radar indicator control the range of
the ground display. The radar indicator AZ button is active, and can
display or remove azimuth buttons. The other radar controls do not
change the ground display, but if they are used while EGPWS is
displayed, they control the radar RTA and the effects of any changes
are seen when the radar image is re–displayed.
For additional information, refer to the appropriate AlliedSignal EGPWS
operating manual.
A28–1146–111
REV 2
Enhanced Ground–Proximity Warning System (EGPWS)
B–3
PRIMUSR 660 Digital Weather Radar System
EGPWS Display
The EGPWS displays is shown as variable dot patterns in green,
yellow, or red. The density and color is a function of how close the
terrain is relative to the aircraft altitude above ground level (AGL), refer
to table B–1. Terrain/obstacle alerts are shown by painting the
threatening terrain as solid or red. Terrain that is more than 2000 feet
below the aircraft is not displayed. Areas where terrain data is not
available are shown in magenta..
Elevation of Terrain in Feet
AGL
Color
ÁÁÁÁÁÁÁÁÁÁÁ
Á
ÁÁÁÁÁÁÁÁÁÁ
ÁÁÁÁÁÁÁÁÁÁÁ
ÁÁÁÁÁÁÁÁÁÁÁ
ÁÁÁÁÁÁÁÁÁÁÁ
ÁÁÁÁÁÁÁÁÁÁÁ
ÁÁÁÁÁÁÁÁÁÁÁ
ÁÁÁÁÁÁÁÁÁÁÁ
ÁÁÁÁÁÁÁÁÁÁÁ
ÁÁÁÁÁÁÁÁÁÁÁ
ÁÁÁÁÁÁÁÁÁÁÁ
ÁÁÁÁÁÁÁÁÁÁÁ
ÁÁÁÁÁÁÁÁÁÁÁ
ÁÁÁÁÁÁÁÁÁÁÁ
ÁÁÁÁÁÁÁÁÁÁÁ
ÁÁÁÁÁÁÁÁÁÁÁ
ÁÁÁÁÁÁÁÁÁÁÁ
ÁÁÁÁÁÁÁÁÁÁÁ
ÁÁÁÁÁÁÁÁÁÁÁ
ÁÁÁÁÁÁÁÁÁÁÁÁÁÁÁÁÁÁÁÁÁ
ÁÁÁÁÁÁÁÁÁÁÁ
ÁÁÁÁÁÁÁÁÁÁÁÁÁÁÁÁÁÁÁÁÁ
ÁÁÁÁÁÁÁÁÁÁÁÁÁÁÁÁÁÁÁÁÁ
2000 or more above the aircraft
High density red
1000 – 2000 above the aircraft
High density yellow dot pattern
0–1000 above the aircraft
Medium Density yellow Dot
Pattern
0–1000 below the aircraft
Medium density green dot
pattern
1000 – 2000 below the aircraft
Low density green dot pattern
2000 or more below the aircraft
black
Unknown terrain
Magenta
NOTE: Caution terrain (60 second warning) is displayed as solid yellow. Warning
obstacle (30 second warning) is displayed as solid red.
EGPWS Obstacle Display Color Definitions
Table B–1
Enhanced Ground–Proximity Warning System (EGPWS)
B–4
A28–1146–111
REV 2
PRIMUSR 660 Digital Weather Radar System
Figure B–1 shows the EGPWS over KPHX airport at 2000 feet mean
sea level heading north. The terrain shows the mountains to the north
of Phoenix.
AD–62964@
EHSI Display Over KPHX Airport
With the EGPWS Display
Figure B–1
A28–1146–111
REV 2
Enhanced Ground–Proximity Warning System (EGPWS)
B–5
PRIMUSR 660 Digital Weather Radar System
EGPWS Test
When the EGPWS is selected for display, it can be tested. Push the
remote mounted EGPWS TEST button to display the test format shown
in figure B–2.
AD–63056@
EGPWS Test Display
Figure B–2
Enhanced Ground–Proximity Warning System (EGPWS)
B–6
A28–1146–111
REV 2
PRIMUSR 660 Digital Weather Radar System
Index
A
E
Abbreviations, 10-1
Accelerative Error, 5-15
Additional hazards, 5-55
turbulence versus distance from
storm core, 5-55
turbulence versus distance from
storm edge, 5-55
Altitude, A–10
relationship between turbulence
and altitude, A–10
Antenna mounting error, 5-16
level flight stabilization check, 5-17
stabilization in straight and
level flight check procedure,
5-17
Azimuth resolution, 5-41
Effect on altimeters, A–7
Enhanced ground–proximity warning
system (EGPWS), B–1
annunciators, B–2
FAIL, B–2
INHIB, B–2
ON, B–2
TERR, B–2
displays, B–4
obstacle display color
definitions, B–4
EGPWS test, B–6
push buttons controls, B–2
INHIB button, B–2
ON (terrain) button, B–2
system operation, B–1
controls, B–1
EGPWS operation, B–3
related EGPWS system
operation, B–3
Equipment list, 2-4
cockpit mounted options, 2-4
remote mounted, 2-4
Errors, 5-15
accelerative, 5-15
antenna mounting error, 5-16
level flight stabilization check,
5-17
dynamic, 5-15
pitch gain, 5-22
pitch stabilization check, 5-22
roll gain, 5-19
roll stabilization (while turning)
check, 5-19
stabilization in turns check
procedure, 5-19
wallowing (wing walk and yaw),
5-19
Exchange and rental service, 9-1
Extrapolation to different climbs,
A–13
desert areas, A–13
tropical–humid climates, A–13
C
Cockpit mounted equipment, 2-4
Configurations of individual echoes
(northern hemisphere), 5-47
avoid all crescent shaped echoes
by 20 miles, 5-51
avoid hook echoes by 20 miles,
5-47
avoid pendant by 20 miles, 5-50
avoid steep rain gradients by 20
miles, 5-51
avoid V–notch by 20 miles, 5-49
Customer support centers , 9-2
North America, 9-2
Rest of the World, 9-3
D
Do’s and don’ts of thunderstorm
flying, A–8
Dynamic Error, 5-15
A28–1146–111
REV 2
Index
Index–1
PRIMUSR 660 Digital Weather Radar System
Index (cont)
F
Fault code and text fault
relationships, 8-5
pilot messages, 8-8
Federal Aviation Administration
(FAA) Advisory Circulars
recommended radiation safety
precautions for ground
operation of airborne weather
radar, A–1
background, A–1
cancellation, A–1
precautions, A–2
purpose, A–1
related reading material, A–1
Thunderstorms, A–3
cancellation, A–3
general, A–3
hazards, A–4
national severe storms
laboratory (NSSL)
thunderstorm research, A–10
purpose, A–3
related reading material, A–3
G
Gain adjustment, 7-11
pitch, 7-15
adjustment procedure, 7-15
roll, 7-11
adjustment procedure, 7-11
Ground mapping, 5-56
TILT setting for maximal ground
target display, 5-57
12–inch radiator, 5-57
18–inch radiator, 5-58
H
Hail, A–6
Hail in thunderstorms, A–12
Index
Index–2
Hail size probability, 5-36
Honeywell product support, 9-1
customer support centers, 9-2,
North America, 9-2
Rest of the World, 9-3
publication ordering information,
9-4
I
Icing, A–5
In–flight adjustments, 7-1
pitch and roll trim adjustments, 7-1
level flight stabilization check,
7-3
pitch gain adjustment, 7-15
adjustment procedure, 7-15
pitch offset adjustment, 7-8
adjustment procedure, 7-8
pitch stabilization check, 7-12
check procedure, 7-12
roll gain adjustment, 7-11
adjustment procedure, 7-11
roll offset adjustment, 7-5
adjustment procedure, 7-5
roll stabilization check, 7-9
while turning check
procedure, 7-9
in–flight troubleshooting, 8-1
fault code and text fault
relationships, 8–1, 8-5
pilot messages, 8-8
pilot event marker, 8-1, 8-4
test mode with TEXT FAULTS
enabled, 8-2
fault data fields, 8-2
Interpreting weather radar images,
5-24
radar and visual cloud mass, 5-26
squall line, 5-27
weather radar images, 5-24
Introduction, 1-1
A28–1146–111
REV 2
PRIMUSR 660 Digital Weather Radar System
Index (cont)
Maximum permissible exposure
level (MPEL), 6-1
Maximum storm tops, A–12
Modification of criteria when severe
storms and rapid development are
evident, A–13
relationship between turbulence
and reflectivity, A–10
turbulence above storm tops,
A–11
turbulence and echo intensity on
NWS radar (WSR–57), A–11
turbulence below cloud base,
A–12
turbulence in relation to distance
from storm core, A–11
turbulence in relation to distance
from the storm edge, A–11
use of airborne radar, A–13
visual appearance of storm and
associated turbulence with
them , A–12
Normal operation, 4-1
preliminary control settings, 4-1
power–up procedure, 4-1
radar mode –– ground
mapping, 4-5
radar mode –– weather, 4-4
standby, 4-4
test mode, 4-6
color bands, 4-6
dedicated radar indicator, 4-6
EFIS/MFD/ND, 4-6
N
O
National severe storms laboratory
(NSSL) thunderstorm
research, A–10
extrapolation to different climbs,
A–13
desert areas, A–13
tropical–humid climates, A–13
hail in thunderstorms, A–12
maximum storm tops, A–12
modification of criteria when
severe storms and rapid
development are evident, A–13
relationship between turbulence
and altitude, A–10
Offset adjustment, 7-5
pitch, 7-8
adjustment procedure, 7-8
roll, 7-5
adjustment procedure, 7-5
Operating controls, 3-1
weather radar controller
operation, WC–660, 3-10
GAIN, 3-16
LSS (lightning sensor system)
(optional), 3-13
RADAR, 3-14
rainfall rate color coding, 3-14
RANGE, 3-11
L
Level flight stabilization check, 5-17,
7-3
stabilization in straight and level
flight check
procedure, 5-17, 7-3
Lightning, A–7
Line configurations, 5-52
avoid bow–shaped line of echoes
by 20 miles, 5-54
avoid line echo wave patterns
(LEWP) by 20 miles, 5-53
avoid thunderstorm echoes at the
south end of a line or at a break
in a line by 20 miles, 5-52
Low ceiling and visibility, A–7
M
A28–1146–111
REV 2
Index
Index–3
PRIMUSR 660 Digital Weather Radar System
Index (cont)
weather radar controller
operation, WC–660 (cont)
RCT (rain echo attenuation
compensation technique
(REACT)), 3-11
SECT (scan sector), 3-12
SLV (slave) (dual installations
only), 3-13
STAB (stabilization), 3-11
target alert characteristics,
3-12
TGT (target), 3-12
TILT, 3-13
weather radar indicator operation,
WI–650/660, 3-1
AZ (azimuth), 3-9
BRT (brightness) or BRT/LSS
(lightning sensor
system), 3-9
display area, 3-5
function switch, 3-5
GAIN, 3-8
GMP (ground mapping)
button MAP, 3-2
Rainfall rate color coding, 3-6
RANGE, 3-9
RCT (rain echo attenuation
compensation technique
(REACT)), 3-3
SCT (scan sector), 3-9
target alert characteristics,
3-4
TGT (target), 3-4
TILT, 3-8
WX (weather) button, 3-2
P
Pilot event marker, 8-4
Pitch and roll trim adjustments, 7-1
level flight stabilization check, 7-3
Pitch gain adjustment, 7-15
adjustment procedure, 7-15
Pitch gain error, 5-22
Index
Index–4
pitch stabilization check, 5-22
Pitch offset adjustment, 7-8
adjustment procedure, 7-8
Pitch stabilization check, 7-12
check procedure, 7-12
Preliminary control settings, 4-1
power–up procedure, 4-1
radar mode – ground mapping,
4-5
radar mode – weather, 4-4
standby, 4-4
Procedures
in–flight roll offset adjustment, 7-5
pitch gain adjustment, 7-15
pitch offset adjustment, 7-8
pitch stabilization check, 7-12
power–up, 4-1
roll gain adjustment, 7-11
roll stabilization (while turning)
check, 7-9
severe weather avoidance, 5-43
stabilization in straight and level
flight check, 5-17, 7-3
stabilization in turns check, 5-19
Publication ordering information, 9-4
R
Radar facts
ground mapping, 5-56
TILT setting for maximal
ground target display, 5-57
interpreting weather radar
images, 5-24
radar and visual cloud mass,
5-26
squall line, 5-27
weather radar images, 5-24
radar operation, 5-1
phenomenas, 5-4
radome, 5-42
rain echo attenuation
compensation technique
(react), 5-31
A28–1146–111
REV 2
PRIMUSR 660 Digital Weather Radar System
Index (cont)
azimuth resolution, 5-41
hail size probability, 5-36
shadowing, 5-34
spotting hail, 5-37
turbulence probability, 5-34
stabilization, 5-15
accelerative error, 5-15
antenna mounting error, 5-16
dynamic error, 5-15
pitch gain error, 5-22
roll gain error, 5-19
wallowing (wing walk and
yaw) error, 5-19
tilt management, 5-5
tilt setting for minimal ground
target display, 5-8
variable gain control, 5-30
weather avoidance, 5-43
additional hazards, 5-55
configurations of individual
echoes (northern
hemisphere), 5-47
line configurations, 5-52
severe weather avoidance
procedures, 5-43
weather display calibration, 5-28
Radiation Safety Precautions, A–1
Radome, 5-42
Rain echo attenuation
compensation technique
(REACT), 5-31
related functions, 5-31
attenuation compensation,
5-31
cyan REACT field, 5-31
Recommended radiation safety
precautions for ground operation
of airborne weather radar, A–1
background, A–1
cancellation, A–1
precautions, A–2
body damage, A–2
combustible materials, A–3
general, A–2
purpose, A–1
A28–1146–111
REV 2
related reading material, A–1
Reflectivity, A–10
relationship between turbulence
and reflectivity, A–10
Relationship between turbulence
and altitude, A–10
Remote mounted equipment, 2-4
Roll gain adjustment, 7-11
adjustment procedure, 7-11
Roll offset adjustment, 7-5
adjustment procedure, 7-5
Roll stabilization check, 7-9
while turning check procedure, 7-9
S
Shadowing, 5-34
Spotting hail, 5-37
Squall lines, A–4
Stabilization, 5-15
accelerative error, 5-15
antenna mounting error, 5-16
level flight stabilization check,
5-17
dynamic error, 5-15
pitch gain error, 5-22
pitch stabilization check, 5-22
roll gain error, 5-19
roll stabilization (while turning)
check, 5-19
wallowing (wing walk and yaw)
error, 5-19
Stabilization check, 7-9
Pitch, 7-12
Check procedure, 7-12
Roll, 7-9
While turning check
procedure, 7-9
Support centers, 9-2
customer support centers, 9-2
North America, 9-2
Rest of the World, 9-3
24–hour exchange/rental support
centers, 9-2
Index
Index–5
PRIMUSR 660 Digital Weather Radar System
Index (cont)
System configurations, 2-1
dual configuration, 2-1
dual control mode truth table, 2-3
equipment list, 2-4
cockpit mounted options, 2-4
remote mounted, 2-4
stand–alone, 2-1
T
Test mode, 4-6
color bands, 4-6
dedicated radar indicator, 4-6
EFIS/MFD/ND, 4-6
Test mode with TEXT FAULTS
enabled, 8-2
Thunderstorms, A–3
Cancellation, A–3
general, A–3
hazards, A–4
do’s and don’ts of
thunderstorm flying, A–8
effect on altimeters, A–7
hail, A–6
icing, A–5
lightning, A–7
low ceiling and visibility, A–7
schematic cross section of a
thunderstorm, A–6
squall lines, A–4
tornadoes, A–4
turbulence, A–5
weather radar, A–7
national severe storms laboratory
(NSSL) thunderstorm research,
A–10
extrapolation to different
climbs, A–13
hail in thunderstorms, A–12
maximum storm tops, A–12
modification of criteria when
severe storms and rapid
development are evident,
A–13
Index
Index–6
relationship between
turbulence and altitude,
A–10
relationship between
turbulence and reflectivity,
A–10
turbulence above storm tops,
A–11
turbulence and echo intensity
on NWS radar (WSR–57),
A–11
turbulence below cloud base,
A–12
turbulence in relation to
distance from the storm
edge, A–11
turbulence in relation to
distance from storm core,
A–11
use of airborne radar, A–13
visual appearance of storm
and associated turbulence
with them, A–12
purpose, A–3
related reading material, A–3
Tilt management, 5-5
tilt setting for minimal ground
target display, 5-8
12–inch radiator, 5-8
18–inch radiator, 5-9
Tornadoes, A–4
Trim adjustments, 7-1
Turbulence
above storm tops, A–11
and echo intensity on NWS radar
(WSR–57), A–11
below cloud base, A–12
in relation to distance from storm
core, A–11
in relation to distance from the
storm edge, A–11
relationship between turbulence
and altitude, A–10
relationship between turbulence
and reflectivity, A–10
A28–1146–111
REV 2
PRIMUSR 660 Digital Weather Radar System
Index (cont)
versus distance from storm core,
5-55
versus distance from storm edge,
5-55
visual appearance of storm and
associated turbulence with
them , A–12
Turbulence probability, 5-34
turbulence levels (from airman’s
information manual), 5-36
24–hour exchange/rental support
centers, 9-2
U
Use of airborne radar, A–13
V
Variable gain control, 5-30
Visual appearance of storm and
associated turbulence with them ,
A–12
W
Wallowing (wing walk and yaw)
error, 5-19
Warranty, 9-1
Weather avoidance, 5-43
additional hazards, 5-55
turbulence versus distance
from storm core, 5-55
turbulence versus distance
from storm edge, 5-55
configurations of individual
echoes (northern hemisphere),
5-47
avoid all crescent shaped
echoes by 20 miles, 5-51
A28–1146–111
REV 2
avoid hook echoes by 20
miles, 5-47
avoid pendant by 20 miles,
5-50
avoid steep rain gradients by
20 miles, 5-51
avoid v–notch by 20 miles,
5-49
line configurations, 5-52
avoid bow–shaped line of
echoes by 20 miles, 5-54
avoid line echo wave patterns
(LEWP) by 20 miles, 5-53
avoid thunderstorm echoes at
the south end of a line or at
a break in a line by 20
miles, 5-52
severe weather avoidance
procedures, 5-43
Weather display calibration, 5-28
Weather radar, A–7
Weather radar controller operation,
WC–660, 3-10
GAIN, 3-16
LSS (lightning sensor system)
(optional), 3-13
CLR/TST (clear/test), 3-13
LX (lightning sensor system),
3-13
OFF, 3-13
SBY (standby), 3-13
RADAR, 3-14
FP (flight plan), 3-15
GMAP (ground mapping),
3-14
OFF, 3-14
rainfall rate color coding, 3-14
STBY (standby), 3-14
TST (test), 3-15
WX (weather), 3-14
RANGE, 3-11
RCT (rain echo attenuation
compensation technique
(REACT)), 3-11
SECT (scan sector), 3-12
Index
Index–7
PRIMUSR 660 Digital Weather Radar System
Index (cont)
Weather radar controller operation,
WC–660 (cont)
SLV (slave) (dual installations
only), 3-13
STAB (stabilization), 3-11
target alert characteristics, 3-12
TGT (target), 3-12
TILT, 3-13
Weather radar indicator operation,
WI–650/660, 3-1
AZ (azimuth), 3-9
BRT (brightness) or BRT/LSS
(lightning sensor system), 3-9
CLR/TST (clear/test), 3-9
LX (lightning sensor system),
3-9
OFF, 3-9
SBY (standby), 3-9
display area, 3-5
display screen features, 3-5
function switch, 3-5
FP (flight plan), 3-6
FSBY (forced standby), 3-7
OFF, 3-5
ON, 3-6
SBY (standby), 3-5
TST (test), 3-7
GAIN, 3-8
GMP (ground mapping) button or
MAP, 3-2
rainfall rate color coding, 3-6
RANGE, 3-9
RCT (rain echo attenuation
compensation technique
(REACT)), 3-3
SCT (scan sector), 3-9
TGT (target), 3-4
target alert characteristics,
3-4
TILT, 3-8
WX (weather) button, 3-2
Index
Index–8
A28–1146–111
REV 2