1
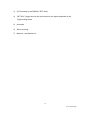
User's Guide Digital 20MHz and 60MHz Oscilloscopes
Model MS460 - 60MHz
Model MS420 - 20MHz
1 INTRODUCTION
Congratulations on your purchase of the Extech Digital Oscilloscope. This
manual is divided into two sections: Section One for the Oscilloscope
functions and Section Two for the MultiMeter functions. This meter is shipped
fully tested and calibrated and, with proper use, will provide years of reliable
service.
2 V5.1 ‐ March 2010 TABLE OF CONTENTS
GENERAL INFORMATION
WARRANTY
5
PRODUCT CONTENTS
6
SAFETY INFORMATION
7
INPUT CONNECTIONS
10
FRONT PANEL AND CONTROL KEYS OVERVIEW
11
RECALL FACTORY DEFAULT SETTINGS
19
PC DATA TRANSMISSION
63
FAQ.
76
APPENDIX A: SPECIFICATIONS
77
APPENDIX B: MAINTENANCE AND CLEANING
82
APPENDIX C: BATTERY CHARGING AND REPLACEMENT
83
APPENDIX D: SETTING THE REAL TIME CLOCK
84
SECTION ONE - OSCILLOSCOPE
BASIC INSTRUCTIONS ON USING THE OSCILLOSCOPE
POWERING THE OSCILLOSCOPE.
MAIN OSCILLOSCOPE DISPLAY SCREEN
MENU DESCRIPTION
SETTING THE TRIGGER POSITION AND TIME BASE
OSCILLOSCOPE INPUT CONNECTIONS
MEASURE UNKNOWN SIGNALS / AUTO SET FEATURE
AUTO ZERO THE HORIZONTAL TRIGGER.
AUTOMATIC RANGING MEASUREMENTS
DATA HOLD
AVERAGE MODE TO SMOOTH WAVEFORMS
PERSISTENCE MODE (SUPERIMPOSE WAVEFORMS)
PEAK DETECT (GLITCH CAPTURE)
AC COUPLING MODE
REVERSE WAVEFORM POLARITY
MATHEMATICAL FUNCTIONS
USB MASS STORAGE .
ADVANCED OSCILLOSCOPE FUNCTIONS
VERTICAL SETTINGS FOR CH1 AND CH2
CHANNEL COUPLING
OPEN AND CLOSE MEASUREMENT CHANNELS
SETTING THE PROBE ATTENUATION
INVERT A WAVEFORM DISPLAY.
MATHEMATICAL FUNCTION MENU SETTINGS
SETTING UP THE TRIGGER SYSTEM
TRIGGER CONTROL
ACQUISITION MODE
13
13
13
15
15
19
20
20
20
21
22
22
23
24
25
26
27
28
28
29
30
30
30
31
32
33
40
3 V5.1 ‐ March 2010 DISPLAY SETTINGS
STORING WAVEFORMS IN THE METER
FUNCTION SETTINGS MENU
AUTO CALIBRATION.
AUTO RANGE MEASUREMENTS
AUTOSCALE MODE .
CURSOR MEASUREMENTS
FREQUENCY COUNTER (MS460)
SQUARE WAVE OUTPUT.
FFT MODE.(MS420)
SYSTEM STATUS MENU.
TIME BASE MODE .
40
42
43
44
44
45
49
52
53
54
61
62
SECTION TWO – MULTIMETER FUNCTIONS
64
CONNECTING THE METER.
DISPLAY WINDOW.
RESISTANCE MEASUREMENTS
MEASURING DIODE VOLTAGE
CONTINUITY TEST.
MEASURING CAPACITANCE
MEASURING DC VOLTAGE
MEASURING AC VOLTAGE
MEASURING DC CURRENT
MEASURING AC CURRENT
DATA HOLD (FREEZE READINGS)
RELATIVE MEASUREMENTS
AUTOMATIC / MANUAL RANGE
Copyright © 2010 Extech Instruments Corporation (a FLIR company)
65
65
67
67
68
69
69
70
71
72
73
74
75
All rights reserved including the right of reproduction in whole or in part in any form.
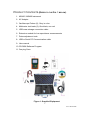
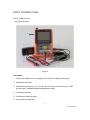
4 V5.1 ‐ March 2010 PRODUCT CONTENTS (REFER TO THE FIG. 1 BELOW)
1. MS420 / MS460 Instrument
2. AC Adaptor
3. Oscilloscope Probes (2); Grey in color
4. Multimeter test leads (2); One black, one red
5. USB mass storage connection cable
6. Extension module for low capacitance measurements
7. Probe adjustment tools
8. USB or Serial PC Communication cable
9. User manual
10. CD-ROM Software Program
11. Carrying Case
Figure 1: Supplied Equipment
5 V5.1 ‐ March 2010 SAFETY INFORMATION
Please read the user manual before use to ensure safety and precision
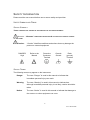
SAFETY SYMBOLS AND TERMS SAFETY SYMBOLS
THESE SYMBOLS MAY APPEAR IN THIS MANUAL OR ON THE INSTRUMENT:
WARNING: “WARNING” IDENTIFIES CONDITIONS & ACTIONS THAT POSE A HAZARD
TO THE USER
Caution:
“Caution” identifies conditions and actions that may damage the
product or external equipment
DANGER:
High
Refer to the
Manual Protective
Conductor
Terminal
Chassis
Ground
Earth
(ground)
Terminal
SAFETY TERMS
The following terms may appear on the instrument:
Danger:
The term “Danger” is used in this manual to indicate that
immediate personal injury can result
Warning:
The term “Warning” is used in this manual to indicate that,
although immediate personal injury is not likely, caution should be
taken
Notice:
The term “Notice” is used in this manual to indicate that damage to
the meter or to other equipment can occur
6 V5.1 ‐ March 2010 GENERAL SAFETY INFORMATION Carefully read the following safety information in order to avoid personal injury and
damage to this product or to products connected to it. This product must only be
used in the specified manner to prevent danger and hazard to products and persons.
Warning:
To avoid fire or electrical shock please use the proper power adapter. Use only
the power adapter recommended by the manufacturer.
Warning:
To avoid fire or electrical shock do not connect meter to more than 42V peak
(30Vrms) or on circuits of more than 4800VA:
● Use only the insulated voltage probes, test leads and adapter supplied with
the test tool, or as indicated by Extech as suitable for the Oscilloscope &
Multimeter.
● Before use, inspect voltage probes, test leads and accessories for
mechanical damage. Replace the equipment when it appears damaged.
● Remove all probes, test leads and accessories when not in use.
● Always connect the power adapter first to the AC outlet before connecting
it to the Oscilloscope & Multimeter.
● Do not apply voltages that exceed 400 V from earth ground to any input
when measuring in a CAT II environment.
● Do not apply voltages that exceed 400 V to the isolated inputs when
measuring in a CAT II environment.
● Use caution when using 1:1 test leads since the probe tip voltage will be
directly transmitted to the Oscilloscope & Multimeter.
● Do not use exposed metal BNC or banana plug connectors.
● Do not insert metal objects into the connectors.
● Always use the Oscilloscope & Multimeter in the manner specified.
● Voltage ratings, mentioned in the warnings, are provided as “working
voltage” limits. They represent V ac rms (50-60Hz) for AC sine wave
7 V5.1 ‐ March 2010 applications and as V dc for DC applications. Overvoltage Category II refers
to local level applicable for appliances and portable equipment.
Only qualified technical personnel should perform maintenance on these
devices.
Observe the nominal value limits for all terminals: To avoid fire or electric shock,
observe all nominal value limits, markings, and specifications for this product. Before
connecting to this product, carefully read the user’s manual.
Do no operate this instrument without the cover plate secured: If the cover plate
or panel has been removed, do not use this product.
Do not touch bare conductors
Do not use this meter in case of any undetermined failure: When in doubt
consult qualified repair personnel
Do not hinder the meter’s ventilation: Refer to the user manual for detailed
installation instructions and proper setup for adequate ventilation
Do not operate this meter in overly humid environments.
Do not operate this meter in potentially explosive environments.
Keep the meter’s surface clean and dry.
Use of this device in any manner inconsistent with the uses specified in this manual
can possibly compromise the safety protection provided by the meter.
8 V5.1 ‐ March 2010 INPUT CONNECTIONS
INPUT CONNECTIONS See Figure 2 below
6 Figure 2
Description
1. The power adapter is use to supply AC power and for battery recharging
2. Multimeter test leads
3. Multimeter input jacks (L to R: Current 2A-10A input, mA Current input, COM
ground input, Voltage/Resistance/Capacitance input)
4. Oscilloscope probes
5. Oscilloscope channel inputs
6. Square wave output jack
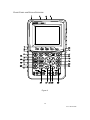
9 V5.1 ‐ March 2010 FRONT PANEL AND KEYPAD OVERVIEW Figure 3
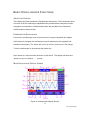
10 V5.1 ‐ March 2010 Description of Meter Front Panel and Keypad (Figure 3)
1.
AC adapter Port
2.
RS-232C Port
3.
USB Port
4.
USB Mass Storage Port
5.
Power switch
6.
F1 – F5 Soft-key options
7. AUTO SET: In the Scope mode, the meter automatically selects the
horizontal/vertical scale and trigger level
8. COPY: Press to store the waveform data into a USB storage device
9. ▲ (Red): Adjust the horizontal scale for Channel 1
10. VOLTS POSITION (Red): Switch between voltage and horizontal scales for
Channel 1
11. ▼ (Red): Adjust the horizontal scale for Channel 1
12. ▲ (Blue): Adjust the horizontal scale for Channel 2
13. VOLTS POSITION (Blue): Switch between the voltage and horizontal scales
for Channel 2
14. ▼ (Blue): Adjust the horizontal scale for Channel 2
15. RUN/STOP: Start/Stop the waveform capture process
16. BACKLIGHT: Turn the display backlight ON and OFF
17. DMM/OSC: Operation mode (switch between oscilloscope and multimeter)
18. MENU ▲: Choose a higher item on a menu list
19. MENU: Show / Hide menu
20. MENU ▼: Choose a lower item on a menu list
21. OPTION: Used in combination with the four (4) yellow arrow keys. This
button is used to set the main time base, trigger horizontal position and
trigger vertical position. Also used to adjust the display multiplier factors and
display vertical position during waveform calculation. Further, it is used to
adjust cursor 1 (V1 or T1) and cursor 2 (V2 or T2) position during cursor
measurements
22. ▲ (yellow): Oscilloscope UP arrow adjustment key
23. ▼ (yellow): Oscilloscope DOWN arrow adjustment key
24. ► (yellow): Oscilloscope FORWARD adjustment key
25. ◄ (yellow): Oscilloscope BACKWARD adjustment key
26. A: Selects DMM Current measurement mode
27. V: Selects DMM Voltage measurement mode
28. R: Selects DMM impedance, diode, continuity, capacitance measurement
mode
29. SET: Toggle AC/DC in the current or voltage multimeter measurement
modes; also switches between resistance, diode and capacitance modes
while in the resistance mode.
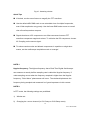
11 V5.1 ‐ March 2010 BASIC OSCILLOSCOPE FUNCTIONS
ABOUT THIS CHAPTER This chapter provides introductory Oscilloscope instructions. This introduction does
not cover all of the oscilloscope capabilities but provides basic examples of menu
navigation and operations. Detailed instructions are provided in the Advanced
Oscilloscope functions section.
POWERING THE OSCILLOSCOPE Connect the oscilloscope to an AC power source using the supplied AC adaptor.
If the battery is charged, the oscilloscope may be powered by the supplied and
installed Li-ion battery. The meter will run for up to four (4) hours on a full charge.
Turn the oscilloscope on by pressing the power key.
Upon power up, the instrument performs a ‘self check’. The display will show the
“press any key to continue……” screen.
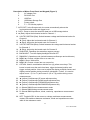
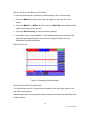
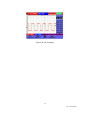
MAIN OSCILLOSCOPE DISPLAY SCREEN Figure 4: Oscilloscope Display Screen
12 V5.1 ‐ March 2010 Description of Oscilloscope Display Screen (Figure 4)
1.
Battery power status icon ( , ,
and
)
2.
Auto measurement screen No. 1 (“f” for frequency, “T” for cycle, “V” for
average value, “Vp” is the peak-peak value and “Vk” is the root-meansquare value
3.
Auto measurement screen No. 2
4.
Horizontal triggering position
5.
The difference in time between the horizontal triggering position and the
screen’s centerline (zero when the pointer is in the center of the screen)
6.
The trigger modes:
Auto: The oscilloscope is in the automatic mode and displaying the
waveform in the non-trigger mode
Trig’d: The oscilloscope has detected a trigger and is displaying the
information generated after the trigger
Ready: All pre-triggered data has been captured and the oscilloscope is
ready to receive trigger signals
Scan: The oscilloscope records and displays waveform data continuously
Stop: The oscilloscope has stopped collecting waveform data
7.
Red and blue trigger pointer shows vertical position of alternate triggers.
The trigger pointer turns green when it reaches an edge trigger or a video
trigger
8.
Hide or View the menu using the MENU key;
9.
Menu setting options (vary with each function)
10. Trigger Voltage Level
11. Trigger signal source
12. Primary Time Base
13 V5.1 ‐ March 2010 13. The coupling mode for CH2; “~” AC, “-” DC, and ground
14. The vertical Voltage units scale for CH2
15. The coupling mode for CH1; “~” AC, “-” DC, and ground
16. Vertical Unit Scale for CH1
17. The blue pointer shows the ground point of the waveform for CH2 (zero
position). If this pointer is not shown, the channel has not been opened.
18. OPTION (options vary with each function)
19. The red pointer shows the ground point of the waveform for CH1 (zero
position). If this pointer is not shown, the channel has not been opened
20. Waveform display area. Red waveform represents CH1, blue represents
CH2
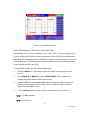
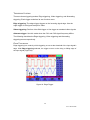
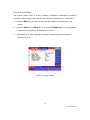
14 V5.1 ‐ March 2010 MENU DESCRIPTION The following explains how to navigate the menus to select a function.
1.
Press the MENU key to open the Function Menu. The Menu appears on the right
of the screen with the corresponding options available on the bottom of the
screen. Press MENU again to hide the Function Menu.
2.
Use the MENU ▲ or MENU ▼ keys to navigate and select menu functions.
3.
Use the soft-keys (F1…F5) to select an available option
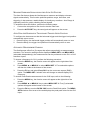
Figure 5: Menu
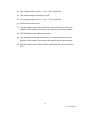
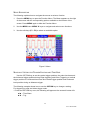
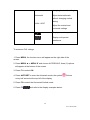
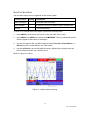
MANUALLY SETTING THE TRIGGER POSITION AND TIME BASE Use the OPTION key to set the vertical trigger position, the main time base and
the horizontal trigger position during Edge triggering and Video Triggering or vertical
trigger position for Horizontal time base and vertical trigger position and horizontal
level position during an Alternate trigger.
The following example shows how to use the OPTION key to change a setting.
For triggering in edge and video trigger mode:
1. Press the OPTION key once; the following will appear at the screen’s bottom left:
◄/► – Time Base
▲/▼ – Trig
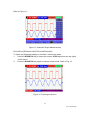
15 V5.1 ‐ March 2010 Figure 6
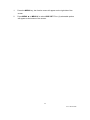
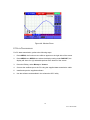
2. Press ◄ (yellow) or ► (yellow) to adjust the main time base. Press ▲ (yellow)
or▼ (yellow) to adjust the trigger horizontal position.
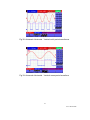
3. Press OPTION again and the following will appear:
◄/► – Time
▲/▼– Trig
See Figure 7:
Figure 7
4. Press ◄ (yellow) or ► (yellow) to adjust time base horizontal position, press▲
(yellow) or ▼ (yellow) to adjust trigger position.
5. Use the OPTION key to toggle between the two modes described above.
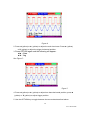
16 V5.1 ‐ March 2010 When triggering in the Alternate trigger mode:
7. Press OPTION and the following will appear:
—Time
—Trig 2
See Figure 8:
Figure 8:
7.
Press ◄ (yellow) or ► (yellow) to adjust the time base horizontal position and
press ▲ (yellow) or ▼ (yellow) to adjust the trigger horizontal position for Channel 2.
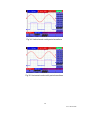
8.
Press OPTION again to display the following:
— Time Base
— Trig 1
See Figure 9:
17 V5.1 ‐ March 2010 Figure 9:
9.
Press ◄ (yellow) or ► (yellow) to adjust the main time base and press ▲
(yellow) or▼ (yellow) to adjust the trigger horizontal position for Channel 1.
10.
Press OPTION again to return to step 6 above.
Glossary of Terms
z Vertical scale factor: The voltage amplitude represented by a division in the
vertical direction of the display area, through the adjustment of which the user can
amplify or attenuate the signal and thus regulate the signal amplitude so that it is
placed in the expected measurement range.
z Vertical zero position: Ground point, through the adjustment of which the user
can regulate the display position of the waveform on the screen.
z Main time base: The time value represented by a division in the horizontal
direction of the display area.
z Trigger horizontal position: The time difference between the actual trigger point
and the screen central line, which will be displayed as 0 at the center point of the
screen.
z Trigger level position: The voltage difference between the actual trigger level
and the zero position of the triggering signal source channel.
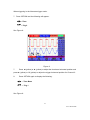
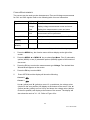
18 V5.1 ‐ March 2010 RECALL THE FACTORY DEFAULT SETTINGS To reset the Oscilloscope to the factory default settings, refer to the following:
1. Press the MENU key; the function menu will appear on the right side of the
screen
2. Press the MENU ▲ or MENU ▼ key to select a FUNCTION; three options will be
visible at the bottom of the screen.
3. Press F1 (Recall Factory) to recall the factory settings.
4. Press F2 to select “Auto calibration”. If the ambient temperature varies from the
specified operating temperature by more than 5 degrees Celsius, an Auto
Calibration should be performed.
Refer to Figure 10:
Figure 10: Resetting the Oscilloscope
OSCILLOSCOPE INPUT CONNECTIONS The Oscilloscope has two (2) signal inputs (located on the lower right side) for CH1
and CH2 measurements.
Isolated inputs allow for independent floating measurements between Multimeter and
Scope functions.
19 V5.1 ‐ March 2010 MEASURE UNKNOWN SIGNALS USING THE AUTO‐SET FEATURE The Auto-Set feature allows the Oscilloscope to measure and display unknown
signals automatically. This function optimizes position, range, time-base, and
triggering. It also assures a stable display of virtually any waveform. Auto Range is
especially useful for quickly checking several signals.
To enable the Auto-Set feature, perform the following steps:
1.
Connect the test probe to the circuit or device under test.
2.
Press the AUTO SET key; the test signals will appear on the screen.
AUTO ZERO THE HORIZONTAL TRIGGER AND TRIGGER LEVEL POSITION To configure the instrument so that the horizontal trigger and the trigger level position
automatically return to zero.
1. Press the V key; the horizontal trigger position will automatically return to zero
2. Press the R key; the trigger level position will automatically return to zero
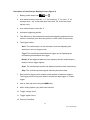
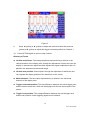
AUTOMATIC MEASUREMENT RANGING The Oscilloscope offers five (5) ranges that adjust automatically as measurements
are taken. Two numeric readings can be displayed: MEAS SET1 and MEAS SET2
(selectable independently); the measurements can be performed on the CH1 or CH2
waveform inputs.
To choose a frequency for CH1, perform the following procedure:
1.
Press the MENU key; the function menu will appear on the right side of the
screen.
2.
Press MENU ▲ or MENU ▼ to select MEAS SET 1. Five selectable options
will then be visible at the bottom of the screen.
3.
Press the F1 key and select Freq CH1 from the root mean square (RMS)
option. The MEAS SET 1 window color will change to red and display CH1
frequency.
To choose Peak-Peak measurements for the CH2 input, refer to the following:
1.
Press the MENU key; the function menu will appear at the right side of the
screen.
2.
Press MENU ▲ or MENU ▼ key to select MEAS SET 2. Five (5) selectable
options will appear at the bottom of the screen.
3.
Press the F4 key to select PK-PK CH2 from the Peak-Peak option. The MEAS
SET2 window color turns to blue and displays the peak-peak value for the CH2
input.
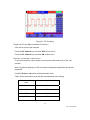
20 V5.1 ‐ March 2010 Refer to Figure 11:
Figure 11: Automatic Scope Measurements
DATA HOLD (FREEZING THE DISPLAYED READING) To freeze any displayed reading or waveform, follow these steps:
1.
Press the RUN/STOP key to freeze the screen: STOP appears at the top (right)
of the screen.
2.
Press the RUN/STOP key again to resume normal mode. Refer to Fig. 12:
Figure 12: Freezing the Screen
21 V5.1 ‐ March 2010 USING THE AVERAGE MODE TO SMOOTH WAVEFORMS Use the Average mode to smooth the displayed waveform; multiple data samples will
be averaged. The number of samples to average is selectable from 4, 16, 64, up to
128.
Note: For best results, the waveform must be repetitive. As the number of average
samples increases the waveform updating time increases. Refer to the following:
1.
Press the MENU key; the function menu will appear on the right side of the
screen.
2.
Press MENU ▲ or MENU ▼ to select the ACQU (acquisition) mode; Four (4)
selectable options will display at the bottom of the screen.
3.
Press the F3 key to select Average Factors and then press the F4 key to jump
to Averages 16. The meter then averages 16 samples (or acquisitions) and
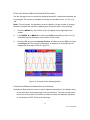
displays the final result. Refer to Figure 13:
Figure 13: Average Factor Sampling Mode
PERSISTENCE MODE (SUPERIMPOSING WAVEFORMS) Persistence Mode allows the user to hold a displayed waveform on the display while,
at the same time, superimposing the current waveform. The user can select the
amount of time (number of seconds or infinite) to retain the displayed waveform
or set the feature OFF. Refer to the following:
22 V5.1 ‐ March 2010 1.
Press the MENU key; the function menu will appear on the right side of the
screen.
2.
Press MENU ▲ or MENU ▼ to select DISP SET. Four (4) selectable options
will appear at the bottom of the screen.
23 V5.1 ‐ March 2010 3.
Press the F2 key to select 1 sec, 2 sec, 5 sec, infinite or OFF. Select a 1, 2,
or 5 second waveform display duration as desired. When Infinite is selected
the waveform will remain on the screen indefinitely. When OFF is selected, the
Persistence function has no effect on displayed waveforms.
Refer to Figure 14.
Figure 14: Persistence Mode to Observe Dynamic Signals
USING PEAK DETECTION TO CAPTURE GLITCHES Use Peak Detect to display events (glitches or other asynchronous waveforms) down
to 50 ns (nanoseconds).
1.
Press the MENU key; the function menu will appear at the right side of the
screen.
2.
Press MENU ▲ or MENU ▼ to select the ACQU MODE. Four (4) selectable
options will appear at the bottom of the screen.
3.
Press the F2 key to select Glitch Detect.
Refer to Figure 15.
24 V5.1 ‐ March 2010 Figure 15: Peak Detection
Glossary of Terms
• Collecting mode: The oscilloscope converts the collected analog data into
digital data for each of the following three modes: Sampling, Peak Detect, and
Averaging.
• Sampling: The waveform sampling resolution in seconds. Waveforms that change
faster than the sample duration will not be accurately captured.
• Peak value detection: In peak detect mode the meter can capture very narrow
pulses down to 50ns
• Averaging values: The oscilloscope averages a selectable number of
measurements. Random noise can be minimized in this mode.
• Duration time: A waveform can be held as a new waveform is displayed. The
amount of time the previous waveform is displayed is the ‘duration time’.
• Roll scan: The oscilloscope updates the waveform sampling points by scrolling
the screen from left to right (applicable only to primary time base settings above
50ms).
SELECTING AC‐COUPLING 25 V5.1 ‐ March 2010 After a reset, the Oscilloscope is dc-coupled so that ac and dc voltages appear on the
screen. Use ac-coupling to observe a small ac signal that rides on a dc signal. To select
ac-coupling, perform the following steps:
1.
Press the MENU key; the function menu will appear at the right side of the
screen.
2.
Press MENU ▲ or MENU ▼ to select the CH1 Setting. Four (4) selectable
options appear at the bottom of the screen.
3.
Press the F1 key and select AC. The AC coupling icon will appear on the
screen.
Refer to Figure 16.
Figure 16: AC-Coupling
REVERSING THE POLARITY OF THE DISPLAYED WAVEFORM To invert the input CH1 waveform, perform the following steps:
1.
Press the MENU key; the function menu will appear at the right side of the
screen.
2.
Press MENU ▲ or MENU ▼ to select CH1 setting. Four (4) selectable options
will appear at the bottom of the screen.
3.
Press the F4 key to select Inverted. The CH1 inverted waveform will then be
displayed on the screen.
Refer to Figure 17.
26 V5.1 ‐ March 2010 Figure 17: Inverted Waveform
USING MATHEMATICAL FUNCTIONS ON WAVEFORMS When adding (CH1 + CH2), subtracting (CH1 – CH2, CH2 – CH1), multiplying (CH1 *
CH2) or dividing (CH1/CH2) the input waveforms of CH1 and CH2, the oscilloscope
will display the mathematical result waveform M and the input waveforms of CH1 and
CH2 on the screen. The Mathematical functions perform a point-to-point calculation
on the waveforms (CH1 and CH2).
To use a Math function, perform the following steps:
1.
Press the MENU key; the function menu will appear at the right side of the
screen.
2.
Press MENU ▲ or MENU ▼ to select WAVE MATH. Five (5) selectable
options will appear at the bottom of the screen.
3.
Press the F3 key to select CH1+CH2; the calculation resulting waveform M
(green) will then appear on the screen. Press the F3 key again to exit the
Waveform Calculation mode.
4.
Press OPTION and the screen will show the following on the bottom left:
—CH Math Volts/Div
—CH M Zero
27 V5.1 ‐ March 2010 5. Press▲(yellow) or ▼(yellow) to adjust the vertical display position of waveform M.
Press ◄(yellow) or ►(yellow) to adjust the display time factor for waveform M.
Refer to Figure 18.
Figure 18: Waveform Mathematical Calculations
USB MASS STORAGE DEVICE / SAVE WAVEFORM DATA Connect a USB mass storage device to the USB port on the meter using the supplied
cable. Press the COPY key. The current waveform data will then be saved (the file
names are automatically sequenced (WAVE1.bin, WAVE2.bin, etc.). Now connect
the USB Mass Storage device to a Personal Computer and use the supplied software
to transfer and manipulate the stored data.
Note: Refer to the HELP utility in the supplied software for further instructions.
28 V5.1 ‐ March 2010 ADVANCED OSCILLOSCOPE FUNCTIONS
ABOUT THIS CHAPTER Advanced Oscilloscope functions are covered in this chapter.
VERTICAL SETTINGS FOR CH1 AND CH2 Each channel has its own independent vertical menu and each item can be set
respectively based on the specific channel.
To make vertical CH1 and CH2 settings, perform the following steps:
1.
Press the MENU key; the function menu will appear at the right of the screen.
2.
Press MENU ▲ or MENU ▼ to select CH1 SETUP. Four (4) selectable options will
appear at the bottom of the screen.
3.
Use the soft function keys (F1 through F4) to adjust settings as desired.
Refer to Figure 19.
Figure 19: Vertical Settings
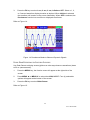
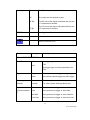
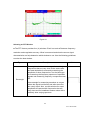
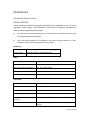
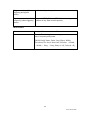
29 The following Table describes the Vertical Channel menu:
Function
Description
Setting
menu
Coupling
AC
The dc component in the input signal is blocked
DC
The ac and dc components of the input signal are available
OFF
Close the channel
ON
Open the channel
Channel
1X
10X
Probe
Select the desired probe attenuation
100X
1000X
Inverted
OFF
Waveform is displayed normally
ON
Open the Invert function for the waveform setting
SETTING THE CHANNEL COUPLING
CH1 will be used in this example.
Press F1 Coupling and then AC to set AC coupling. The DC component contained
in the tested signal is blocked.
Press F1 Coupling and then DC to set DC coupling. Both DC and AC components
contained in the tested signal are permitted.
Refer to Figures 20 and 21.
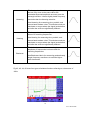
30 V5.1 ‐ March 2010 Figure 20: AC Coupling
31 V5.1 ‐ March 2010 Figure 21: DC Coupling
OPEN AND CLOSE MEASUREMENT CHANNELS
CH1 will be used in this example.
Press the F2 Channel key and then OFF to Close CH1.
Press the F2 Channel key and then ON to Open CH1.
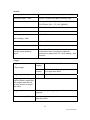
SETTING THE PROBE ATTENUATION
To prevent excessive input voltage, set the probe attenuation level to the 10X
position.
Next, magnify the display by 10X to match the displayed amplitude to the actual
amplitude.
Press F3 Probe to adjust the probe attenuation level.
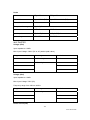
Table: Probe attenuation level and the corresponding menu setting
Probe attenuation
level
Corresponding Menu Setting
1:1
1X
10:1
10X
100:1
100X
1000:1
1000X
32 V5.1 ‐ March 2010 INVERT A WAVEFORM
Inverted waveform: The displayed signal reverses 180 degrees relative to ground.
Press F4 Invert to invert the waveform; press F4 Invert again to exit the inversion
mode.
33 V5.1 ‐ March 2010 WAVE MATH FUNCTION MENU SETTINGS The WAVE MATH functions show the calculation results (adding, subtracting,
multiplying or dividing CH1 and CH2 channel waveforms). Arithmetic operation
results can be displayed using a grid or a cursor. The amplitude of the calculated
waveform can be adjusted with CHM VOL, which is displayed in the scale factor
form. The amplitude ranges from 0.001 through 10 (in 1, 2, and 5 step increments)
that is, it can be expressed as 0.001X, 0.002X, 0.005X…10X. The position of the
calculated waveform can be adjusted up and down using the CHM ZERO key.
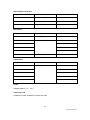
The corresponding operation function table
Setting
Description
CH1-CH2
CH1 waveform minus CH2 waveform
CH2-CH1
CH2 waveform minus CH1 waveform
CH1+CH2
Add CH1 waveform to CH2 waveform
CH1*CH2
Multiply CH1 and CH2 waveforms
CH1/CH2
Divide CH1 by CH2
To perform a CH1+CH2 waveform calculation, perform the following:
1. Press the MENU key; the function menu will appear at the right of the screen.
2. Press MENU ▲ or MENU ▼ to select WAVE MATH. Five (5) selectable options will
then be displayed at the bottom of the screen.
3.
Press the F3 CH1+CH2 key and waveform M appears on the screen. Press the F3
key again to close waveform M.
4. Press OPTION and the display will show the following:
— CH Math Volts/Div
— CH M Zero
Press ◄ (yellow) or ► (yellow) to adjust the range of the M waveform
Press ▲ (yellow) or ▼ (yellow) to adjust the position of the M waveform
Refer to Figure 22.
34 V5.1 ‐ March 2010 Figure 22: Waveform Mathematics
SETTING THE TRIGGER SYSTEM The trigger determines when the acquisition and display of waveform data occurs. When
starting to acquire data, the oscilloscope collects sufficient information to draw the
waveform at the left side of the triggering point. While waiting for a triggering condition,
the oscilloscope gathers data continuously. After a trigger is detected, the oscilloscope
gathers data continuously to draw the waveform at the right side of the triggering point.
To set a trigger mode, perform the following steps:
1.
2.
Press the MENU key; the function menu will appear at the right of the screen.
Press MENU ▲ or MENU ▼ to select TRIG MODE. Five (5) selectable options will
then be available at the bottom of the screen.
3.
4.
Use the soft-keys (F1 to F5) to select and configure the desired options.
Press OPTION; the following will appear on the display during edge triggering and
video triggering modes:
— Time
— Time Base
— Trig
— Trig
During alternate triggering the following will be displayed:
—Time Base
—Trig1
5.
— Time
— Trig2
Press ▲ (yellow) or ▼ (yellow) to adjust the vertical trigger position, Press ◄
(yellow) or ► (yellow) to adjust the time base horizontal position or adjust the
horizontal position.
35 V5.1 ‐ March 2010 TRIGGERING CONTROL There are three triggering modes: Edge triggering, Video triggering, and Alternating
triggering. Each trigger mode has its own function menu.
Edge triggering: The edge trigger triggers on the incoming signal edge. Use the
edge trigger for all signals except for video.
Video triggering: Perform video field trigger or line trigger on standard video signals.
Alternate trigger: Use this mode when the CH1 and CH2 signal frequency differs.
The following describes the Edge triggering, Video triggering and Alternating
triggering menus respectively.
EDGE TRIGGERING
Edge triggering is a mode by which triggering occurs at the threshold of the input signal’s
edge. With Edge triggering selected, the trigger occurs on the rising or falling edge of
the input signal (Figure 23).
Figure 23: Edge Trigger
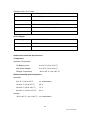
36 V5.1 ‐ March 2010 The Edge triggering menu is described in the following table
Description Function
Settings
menu
Slope
Source
Trig mode
Rising
Triggering on the rising edge of the signal
Falling
Triggering on the falling edge of the signal.
CH1
CH1 is used as the trigger source
CH2
CH2 is used as the trigger source
Auto
Acquisition of waveforms is possible even if
there is no triggering condition detected
Normal
Acquisition of waveforms can only be performed
when the triggering condition is satisfied
Single
Sampling is performed on a waveform when one
trigger is detected (sampling then stops).
Move to the next menu
Coupling
AC
The DC component is blocked
DC
All components are allowed
HF Rjc
HF part of the signal is blocked; only the LF
component is allowed
LF Rjc
The LF part of the signal is blocked; only the HF
component is allowed
SENS
Trigger sensitivity*
Hold-off
Move to the Hold-off menu
Return to previous menu
*Sensitivity: Sensitivity is an adjustment that allows the meter to obtain a stable
trigger by excluding the influences of signal noise. The sensitivity is adjustable from
0.2div~1.0div.
VIDEO TRIGGERING
The video trigger is designed to capture a video signal format, NTSC, PAL or SECAM.
For any other signal type, use the Edge trigger mode. Refer to Figure 24a & b, Figure 25
and Figure 26.
37 V5.1 ‐ March 2010 Figure 24a (screen 1) and 24b (screen 2): Odd Field Video Trigger
Fig. 25: Video Line trigger (screen 1)
Fig. 26: Video Line Trigger (screen 2)
The Video triggering menu is described in the following table.
Function
menu
Settings
Description
First screen
Normal
For video signals with low black levels
Polarity
For video signals with high black levels
Inverted
CH1
Select CH1 as the trigger source
CH2
Select CH2 as the trigger source
Sync
Line
Set synchronous trigger in video line
(Synchronization)
Field
Set synchronous trigger in video field
Source
38 V5.1 ‐ March 2010 Odd field
Set synchronous trigger in video odd line
Even field
Set synchronous trigger in video even line
Line NUM
Set synchronous trigger in video Line NUM
Move to next menu
When the sync is Line, Field, Odd Field, Even Field, the second page is as
follows:
NTSC
National Television System Committee standard
(most common)
PAL/SECAM
Less common video standard (used in Europe)
MODU
(Modulation)
Hold-off
Move to the Hold-off menu
Return to previous menu
When the sync is Designed Line, the second page is as follows:
NTSC
National Television System Committee standard
(most common)
PAL/SECAM
Less common video standard (used in Europe)
Increase
The Line value will increase
Decrease
The Line value will decrease
MODU
(Modulation)
Line
Line No.
Set and show the Line value
Hold-off
Move to the Hold-off menu
Return to previous menu
39 V5.1 ‐ March 2010 ALTERNATE TRIGGER
In Alternate trigger mode, the trigger signal is taken from two vertical channels. Alternate
trigger mode can be used to observe two signals of differing frequencies. From this menu
the user can set a different trigger type for two separate vertical channels.
Refer to Figure 27a.
Figure 27a: Alternate Trigger
The Alternate triggering menu is described in the following tables.
Function
menu
Settings
Description
When EDGE TRIGGERING is selected:
CH SEL
Type
Edge type
CH1
Set trigger type and other parameters for Channel 1
CH2
Set trigger type and other parameters for Channel 2
Edge
Set vertical channel trigger as edge trigger
Video
Set vertical channel trigger as video trigger
Rising
Triggering on the rising (leading) edge of the signal
Falling
Triggering on the falling (trailing) edge of the signal
Move to the next menu
40 V5.1 ‐ March 2010 Coupling
AC
The DC component is blocked
DC
All components are allowed to pass
HF Rjc
The HF part of the signal is blocked and only the
LF component is allowed
LF Rjc
The LF part of the signal is blocked and only the
HF component is allowed
SENS
Set trigger sensitivity
Hold-off
Move to the Hold-off menu
Return to previous menu
Function menu
Settings
Description
When VIDEO TRIGGERING is selected:
CH SEL
CH1
CH2
Set trigger type and other parameters for
CH1
Set trigger type and other parameters for
CH2
Type
Edge
Set vertical channel trigger as edge trigger
Video
Set vertical channel trigger as video trigger
Video type
Normal
For video signals with low black level
Polarity
Inverted
For video signals with high black level
Sync
Line
Set synchronous trigger in video line
(Synchronization
)
Field
Set synchronous trigger in video field
Odd field
Set synchronous trigger in video odd line
Even field
Set synchronous trigger in video even line
41 V5.1 ‐ March 2010 Line NUM
Set synchronous trigger in video Line NUM
When the sync is Line, Field, Odd Field, Even Field, the menu is as follows:
MODU
NTSC
Common video standard (used in the U.S.)
(Modulation)
PAL/SECAM
Least common standard (common in
Europe)
Hold-off
Move to the Hold-off menu
When the sync is Designed Line, the menu is as follows:
MODU
NTSC
Common video standard (used in the U.S.)
(Modulation)
PAL/SECAM
Least common standard (common in
Europe)
Line
Increase
The Line value will increase
Decrease
The Line value will decrease
Line No.
Set and show the Line value
Hold-off
Move to the Hold-off menu
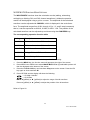
42 V5.1 ‐ March 2010 When the ‘Hold-off’ menu is accessed the screen will appear as below: Figure 27b: ‘Hold-off’ menu screen (MS420)
Refer to the Table below for details on the ‘Hold-off’ mode: (MS420 only)
Function menu
Settings
OFF Time
Time
Description Select a time duration (hold-off time) that
will act as a delay before each trigger
event
Increase
Increase the time
Decrease Decrease the time
Reset the Time
Reset the hold-off time to 100ns
Back
Return to the previous menu
Note:
Trigger Hold-off can stabilize complex waveforms. Hold-off time is the
oscilloscope’s waiting period before starting a new trigger. During Hold-off,
oscilloscope will not trigger.
43 V5.1 ‐ March 2010 Glossary of Terms
• Hold-off time: Programmable time period between trigger events (100ns default).
• Trigger modes: There are three trigger modes: Auto (acquires signal continuously),
Normal (acquires signal when trigger conditions are met) and Single (manually
triggers the signal).
• Automatic trigger mode: In this mode, the oscilloscope can acquire a waveform
without a triggering condition
• Normal trigger mode: In this mode, the oscilloscope cannot acquire the waveform
until it is triggered. When no trigger is present, the oscilloscope will display only the
original waveform; no new waveforms can be captured until a trigger is detected.
• Single mode: In this mode, the oscilloscope will detect a trigger and capture a
waveform each time the user presses the RUN/STOP key.
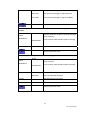
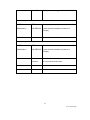
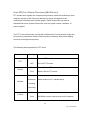
44 V5.1 ‐ March 2010 ACQUISITION MODE The Acquiring Mode menu is described in the Table shown below.
Function menu
Settings Description
Sample
Peak Detect
The waveform data sampling time interval. The
sample mode accurately reconstructs the waveform,
but cannot respond to rapid changes and sudden
peaks.
50ns
max.
Average
Averages
The peak detect mode captures rapid changes and
sudden peaks.
Multiple samples are averaged. The average mode
reduces the noise level (for best results, the waveform
must be repetitive)
4, 16, 64
or 128
Select the number of samples to average
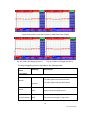
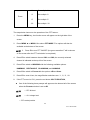
DISPLAY SETTING The Display Setting menu is described in the following table.
Function menu
Settings Description
Type
Vectors
Shows the waveform as a smooth line, connecting each
data point
Dots
Persist
Shows the waveform as a collection of independent
data points
OFF
1s
2s
Sets the duration of time that previous waveforms
remain on the display (useful for observing waveform
variations)
5s
Infinite
Format
YT
Displays the relative relationship between vertical
voltage and horizontal time.
Displays CH1 on the horizontal axis and CH2 on the
45 V5.1 ‐ March 2010 Carry
XY
vertical axis
Bitmap
Data transmitted in bitmap format (dots)
Vectors
Data transmitted in vector format (line)
DISPLAY STYLE
The display style includes Vector and Dot display types, as shown in Figure 28 and 29.
46 V5.1 ‐ March 2010 Figure 28: Dot Style
Figure 29: Vector Style
PERSISTENCE
The user can select the duration of time that past traces remain on the display. The
selections are 1, 2, 5 seconds, Infinite, and OFF.
XY MODE
This mode is only applicable to simultaneous CH1 and CH2 measurements. The X-Y
format plots the CH1 input as X-axis and CH2 input as Y-axis. This display mode is
47 V5.1 ‐ March 2010 convenient for viewing the phase relationship between CH1 and CH2; if the
oscilloscope does not detect triggering the data appear in light spots.
48 V5.1 ‐ March 2010 Description of Control Keys:
■
The CH1 VOL and CH1 ZERO keys for CH1 are used to set the horizontal
scale and position.
■
The CH2 VOL and CH2 ZERO keys for CH2 are used to set the vertical scale
and position continuously.
The following functions are not available in the XY display mode:
■
Reference or digital value waveform
■
Cursor
■
Time base control
■
Trigger control
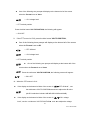
STORING WAVEFORMS The oscilloscope can save four (4) waveforms that can be displayed on the screen along
with the present waveform. The recalled waveforms cannot be adjusted.
The waveform Store / Recall menu is described in the following Table.
Function
menu
Setups
Description
Source
CH1
Select the signal source of the waveform to save
(the waveform to save must be on the display)
CH2
MATH
WAVE
A, B, C and
D
Save
Select the memory address for saving or recalling
data
Store the waveform of the selected signal source
into the selected address
Show
ON
OFF
Set ON to display the waveforms stored in address
A, B, C or D. Choose OFF to exit this feature.
To save a CH 1 waveform in address A, perform the following steps:
1.
Press the MENU key; the function menu will appear at the right of the screen.
49 V5.1 ‐ March 2010 2.
Use the MENU ▲ or MENU ▼ key to select Wave Save. Four (4) selectable
options will then appear at the bottom of the screen.
3.
Press the F1 key to select CH1 as the signal source.
4.
Press the F2 key to select Address A.
5.
Press the F3 key to save the waveform on CH1 in address A.
To display the saved waveform on the screen, perform the following steps:
6.
Press F4 to select Start for Address A. The waveform saved in Address A will be
displayed in green. The zero point, voltage the time will display in purple
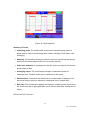
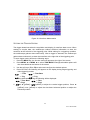
50 V5.1 ‐ March 2010 Refer to Figure 30:
Figure 30: Save and Recall Waveforms
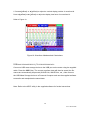
FUNCTION SETTING MENU (REFER TO TABLE BELOW) Press the MENU button and use the up/down arrow keys to scroll to FUNCTION
Function menu
Description
Recall Factory
Set the meter’s settings to their factory default
conditions
Auto Calibration
Perform an Auto-calibration procedure
Language
Select the desired display language (English, Chinese,
Deutsch, or Greek)
Auto-calibration
The Auto-calibration function automatically configures internal parameters to maintain the
sensitivity and accuracy of the meter. Use the Auto-calibration in the following cases:
•
When the temperature changes by more than 5 degrees Celsius during operation
•
When operating the oscilloscope in a new bench top or field environment
1. Press MENU and select the FUNCTION menu using the MENU ▲ or MENU ▼ key
2. Press F2 (Auto calibration). A message appears asking the user to remove all cables
51 V5.1 ‐ March 2010 and probes from the oscilloscope
3. After removing all cables, press F2 (Auto calibration) again. The Auto-calibration
automatically starts and a status message appears.
To interrupt calibration, press any key during the calibration.
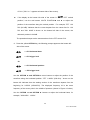
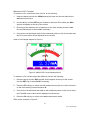
52 V5.1 ‐ March 2010 AUTOMATIC RANGING MEASUREMENTS The oscilloscope can perform twenty (20) automatic measurements: Frequency,
cycle, average, peak-to-peak, root mean square, Vmax, Vmin, Vtop, Vbase, Vamp,
overshoot, pre-shoot, rise time, fall time, +width, -width, +duty, -duty, delayA B
and delayA B . Two measurement results can be displayed simultaneously on the
screen. The function menu for automatic measurements is described in the following
Table.
Function menu
Settings
Description CH1
Measure the frequency of CH1
CH2
Measure the frequency of CH2
CH1
Measure the period of CH1
CH2
Measure the period of CH2
CH1
Measure the average value of CH1
CH2
Measure the average value of CH2
CH1
Measure the peak-to-peak value of CH1
CH2
Measure the peak-to-peak value of CH2
CH1
Measure Root Mean Square (RMS) value of CH1
CH2
Measure Root Mean Square (RMS) value of CH2
CH1
Measure the Vmax of CH1
CH2
Measure the Vmax of CH2
CH1
Measure the Vmin of CH1
CH2
Measure the Vmin of CH2
CH1
Measure the Vtop of CH1
CH2
Measure the Vtop of CH2
CH1
Measure the Vbase of CH1
CH2
Measure the Vbase of CH2
CH1
Measure the Vamp of CH1
CH2
Measure the Vamp of CH2
Freq
Period
Mean
Peak-Peak
Cyc RMS
Vmax
Vmin
Vtop
Vbase
Vamp
53 V5.1 ‐ March 2010 CH1
Measure the Overshoot of CH1
CH2
Measure the Overshoot of CH2
CH1
Measure the Preshoot of CH1
CH2
Measure the Preshoot of CH2
CH1
Measure the RiseTime of CH1
CH2
Measure the RiseTime of CH2
CH1
Measure the Fall Time of CH1
CH2
Measure the Fall Time of CH2
CH1
Measure the +Width of CH1
CH2
Measure the +Width of CH2
CH1
Measure the -Width of CH1
CH2
Measure the -Width of CH2
CH1
Measure the +Duty of CH1
CH2
Measure the +Duty of CH2
CH1
Measure the -Duty of CH1
CH2
Measure the -Duty of CH2
CH1
Measure the DelayA
B
of CH1
CH2
Measure the DelayA
B
of CH2
CH1
Measure the DelayA
B
of CH1
CH2
Measure the DelayA
B
of CH2
Overshoot
Preshoot
RiseTime
Fall Time
+Width
-Width
+Duty
-Duty
DelayA
DelayA
B
B
To measure the frequency of CH1 with MEAS SET 1 and the frequency of CH2 with
MEAS SET 2, perform the following steps:
1.
Press the MENU key; the function menu will appear on the right side of the screen
2.
Press the MENU ▲ or MENU ▼ key to select MEAS SET 1. Five (5) selectable
54 V5.1 ‐ March 2010 options will then appear at the bottom of the screen
3.
Press the F1 key to select the frequency measurement of CH1. The measurement
window will appear red in color and show the frequency of CH1
4.
Press the MENU ▲ or MENU ▼ key to select MEAS SET 2. Five (5) selectable
options will then appear at the bottom of the screen
5.
Press the F4 key to select the peak-to-peak value of CH2. The measurement
window will appear blue in color and show the peak-to-peak value of CH2
Figure 31: Automatic Measurements
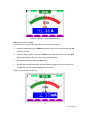
Autoscale
Autoscale enables the instrument to automatically configure the trigger
mode, voltage division and time scale according to the type, amplitude and
frequency of a signal.
The menu is as follows:
Function Menu
Setting
Instruction
Autoscale
OFF
Turn OFF Autoscale
ON
Turn ON Autoscale
Vertical
Adjust vertical scale without
Mode
55 V5.1 ‐ March 2010 changing horizontal setting
Horizontal
Adjust horizontal scale
without changing vertical
setting
HORI—VERT
Adjust the vertical and
horizontal settings
Display one or two periods
Display multi-period
waveforms
To measure CH1 voltage:
1. Press MENU, the function menu will appear on the right side of the
screen.
2. Press MENU ▲ or MENU ▼ and choose AUTOSCALE; three (3) options
will appear at the bottom of the screen
3. Press F1 to select ON
4. Press AUTOSET to enter the Autoscale mode; the symbol
flickers
every half second at the top left of the display
5. Press F2 to select the Horizontal/Vertical mode
6. Press F3
and refer to the display examples below:
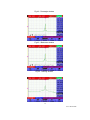
56 V5.1 ‐ March 2010 Fig 32: Autoscale Horizontal - Vertical multi-period waveforms
Fig 33: Autoscale Horizontal - Vertical mono-period waveform
57 V5.1 ‐ March 2010 Fig 34: Vertical mode multi-period waveform
Fig 35: Horizontal mode multi-period waveform
58 V5.1 ‐ March 2010 Notes:
1. In Autoscale mode the meter can automatically set the Trigger mode
(Edge, Video, and Alternate) and Type (Edge, Video)
2. In Autoscale mode the meter switches to YT Mode (Auto) from XY mode
(STOP)
3. In Autoscale, the meter defaults to DC coupling and AUTO triggering
mode
4. If the user attempts to manually adjust the vertical position, voltage
division, trigger level or time scale while in the Autoscale mode the meter
will automatically exit the Autoscale mode
5. When video triggering, the horizontal time scale is 50us
59 V5.1 ‐ March 2010 CURSOR MEASUREMENTS Two cursors can be used to make instantaneous Time and Voltage measurements
for CH1 and CH2 signals. Refer to the following table for more information.
Function menu
Settings
Description
Type
OFF
Exit the cursor measurement mode
Voltage
Display voltage measurement cursor and menu
Time
Display time measurement cursor and menu
CH1,
CH2
Select the waveform channel on which the cursor
measurement will be performed
Source
Delta (MS460)
Display the difference between CH1 and CH2 values
Cursor 1
(MS460)
Data for cursor 1
Cursor 2
(MS460)
Data for cursor 2
To use the cursor for a Voltage measurement on CH1, perform the following steps:
1.
Press the MENU key; the function menu will then display at the right of the
screen.
2.
Press the MENU ▲ or MENU ▼ key to select Curs Meas. Five (5) selectable
options (MS46) or two (2) selectable options (MS420) appear at the bottom of
the screen.
3.
Press the F1 key to select the measurement type Voltage. Two dashed lines
V1 and V2 will appear on the screen.
4.
Press the F2 key to select CH 1.
5.
Press OPTION and the display will show the following:
Cursor 2
Cursor 1
Use ▲ (yellow) and ▼ (yellow) to move V1 up and down; the voltage value
(relative to the zero position) will display at the bottom of the screen. Use ◄
(yellow) and ► (yellow) to move V2 up and down; the voltage value (relative
to the zero position) will display at the bottom of the screen. The display will
also show the result of V1 - V2. Refer to Figure 36-a.
60 V5.1 ‐ March 2010 Figure 36-a: Use the Cursor for a Voltage Measurement
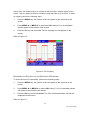
When the MENU button is pressed, the data table appears as shown in Figure 36-b:
Figure 36-b: Data Table
To use the cursor for a Time measurement on CH1, perform the following steps:
1.
Press the MENU key; the function menus will appear at the right of the
screen.
2.
Press the MENU ▲ or MENU ▼ key to select Cursor measurement. Two (2)
selectable options will then appear at the bottom of the screen.
3.
Press the F1 key to select the measurement type Time. Two vertical dashed
lines T1 and T2 will appear on the screen.
4.
Press the F2 key and select the channel CH1.
61 V5.1 ‐ March 2010 5.
Press OPTION and the display will show:
—Cursor 2
—Cursor 1
Press ▲ (yellow) or ▼ (yellow) to move T1 left and right; the value of T1 (relative to
the middle of the screen) will display. Press ◄(yellow) or ►(yellow) to move T2
left and right; the value of T2(relative to the middle of the screen) will display as
shown in Figure 37-a:
Figure 37-a: Time Measurement using cursor
When the MENU button is pressed, the data table appears as shown in Fig. 37-b.
Figure 37-b: Data Table
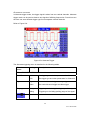
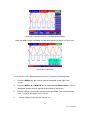
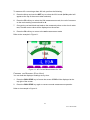
62 V5.1 ‐ March 2010 SIX (6) DIGIT FREQUENCY COUNTER (CYMOMETER) MS460 ONLY The frequency counter measurement range is 2Hz~60MHz.
When the meter is configured for edge triggering, it can only measure one channel
(the channel that is triggering). When the triggering mode is set to Alternating trigger
the instrument can measure both channels (CH1 and CH2).
To configure the Frequency Counter for two channel operation:
1. Press MENU and the function menu will appear on the right side of the
screen.
2. Use the MENU ▲ or MENU ▼ key to select DISP SET (Display Setting),
five (5) options will appear at the bottom of the screen.
3. Use the F5 key to select ON; refer to figure 38:
Fig 38: Frequency Counter Display
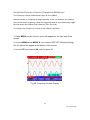
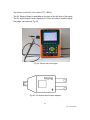
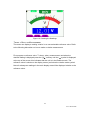
63 V5.1 ‐ March 2010 SQUARE WAVE OUTPUT TEST SIGNAL (5V, 1 KHZ) The 5V Square Output is available on the jack at the left side of the meter.
The 5V digital output has a frequency of 1 KHz and can be used to adjust
the probe, as shown as Fig.39
Fig 39: Square-wave test signal
Fig 40: 5V square wave output adaptor
64 V5.1 ‐ March 2010 USING FFT (FAST FOURIER TRANSFORM) (MS420 ONLY) FFT breaks down signals into component frequencies, which the oscilloscope uses
to display a graph of the frequency domain of a signal (as opposed to the
oscilloscope’s standard time domain graph). These frequencies can then be
matched with known system frequencies, such as system clocks, oscillators, or
power supplies.
The FFT in this oscilloscope can transform 2048 points of a time-domain signal into
its frequency components with the final frequency containing 1024 points ranging
from 0Hz to the Nyquist frequency.
The following table describes the FFT menu:
Function Menu
Setting
Instruction
ON
Turn on FFT function
OFF
Turn off FFT function
CH1
Select CH1 as FFT source
CH2
Select CH2 as FFT source
FFT
Source
Rectangle
Blackman
Select window for FFT (details below)
Window
Hanning
Hamming
dB
Set Vrms as the vertical scale unit of measure
Format
Vrms
Set dBVrms as the vertical scale unit of measure
65 V5.1 ‐ March 2010 *1
Set multiple *1
*2
Set multiple *2
*5
Set multiple *5
*10
Set multiple *10
Zoom
The steps below instruct on the operation of the FFT feature:
1.
Press the MENU key; the function menu will appear on the right side of the
screen.
2.
Press MENU ▲ or MENU ▼ to select FFT MODE. Five options will then be
available at the bottom of the screen.
3.
Press F1 to turn FFT ON/OFF (the green waveform F will be shown
on the screen after the FFT calculation is completed).
4.
Press F2 to switch between channel CH1 and CH2; the currently selected
channel is indicated at the top left of the screen.
5.
Press F3 to switch to WINDOW with the following available options:
HAMMING、RECTANGLE、BLACKMAN, and HANNING.
6.
Press F4 to switch to Format with the options: dB and Vrms.
7.
Press F5 to zoom in/out; the magnification selections are: *1, *2, *5, *10.
8.
If the FFT source is CH1, press the red button VOLTS POSITION ,
z
One of the following three prompts will appear at the bottom-left of the screen
when the Format selection is set to dB.
— FFT dB level
— CH1 voltage level
— FFT vertical position
66 V5.1 ‐ March 2010 z
One of the following two prompts will display at the bottom-left of the screen
when the Format is set to Vrms.
— CH1 voltage level
— FFT vertical position
Press the blue button VOLTS POSITION; the following will appear:
— CH2 OFF
9.
If the FFT source is CH2, press the blue button VOLTS POSITION ,
z
One of the following three prompts will display at the bottom-left of the screen
when the Format is set to dB.
— FFT dB level
— CH2 voltage level
— FFT vertical position
z
One of the following two prompts will display at the bottom-left of the
screen when the Format is set to Vrms.
Press the red button VOLTS POSITION; the following screen will appear:
—CH1 OFF
10. When the FFT source is CH1:
z
If the display at the bottom left side of the screen is "
-FFT dB level ", use
the red buttons VOLTS POSITION▲ and ▼ to adjust the dB value
(the DIV selections include 1dB 2dB 5dB 10dB and 20dB).
z
If the display at the bottom left side of the screen is "
-CH1 voltage
level", use the red buttons VOLTS POSITION▲ and ▼ to adjust the voltage
67 V5.1 ‐ March 2010 of CH1 ("CH1 2v~ " appears at bottom side of the screen);
z
If the display at the bottom left side of the screen is "
—FFT vertical
position", use the red buttons VOLTS POSITION▲ and ▼ to adjust the
position of the waveform along the vertical position. For example, "FFT 1.20
DIV (24.0dB)" indicates that the cursor departs from the center line for 1.20
DIV and "CH1 20dB" is shown on the bottom left side of the screen; the
arithmetic product is 24.0dB.
The operational steps are the same as above for the FFT source CH2:
11. Press the yellow OPTION key, the following prompts appear at the bottom left
side of the screen.
— CH1 horizontal base
— CH1 trigger level
Or
— CH1 horizontal position
— CH1 trigger level
Use the OPTION ◄ and OPTION ► menu buttons to adjust the position of the
waveform along the horizontal position. "FFT -2.00DIV (500.0Hz) " shown on the
bottom left indicates that the starting section of the waveform departs from the
beginning for 2.00DIV (250Hz/DIV). The displayed frequency M is the exact
frequency of the cursor point in the middle of spectrum (shown in Figure 41 below).
Use the OPTION ◄ and OPTION ► buttons to adjust the horizontal base; for
example, "250Hz/DIV (5KS/s".
68 V5.1 ‐ March 2010 Figure 41
Selecting an FFT Window
■ The FFT feature provides four (4) windows. Each is a trade-off between frequency
resolution and magnitude accuracy. What is measured and what the source signal
characteristics are help determine which window to use. Use the following guidelines
to select the best window.
Type
Description
Rectangle
Rectangle is the ideal window type for resolving
frequencies that are very close to the same value
but least desirable for accurately measuring the
amplitude of those frequencies. It is the ideal type
for measuring the frequency spectrum of aperiodic
signals and measuring frequency components near
DC.
Window
Use rectangle for measuring transients or surges
where the signal level before and after the event
are nearly equal. Also, use this window for equalamplitude sine waves with frequencies that are
very close and for broadband random noise with a
relatively slow varying spectrum.
69 V5.1 ‐ March 2010 Hamming
This is a good window for resolving frequencies
that are very close to the same value with
somewhat improved amplitude accuracy over the
rectangle window. It has a slightly better frequency
resolution than the Hanning selection.
Use Hamming for measuring sine, periodic, and
narrow band random noise. This window works on
transients or surges where the signal levels before
and after the event are significantly different.
This is a good window for amplitude accuracy but
less so for resolving frequencies.
Hanning
Blackman
Use Hanning for measuring sine, periodic, and
narrow band random noise. This window works on
transients or surges where the signal levels before
and after the event are significantly different.
This is the best window for measuring the
amplitude of frequencies but least useful for
resolving frequencies.
Use Blackman-Harris for measuring predominantly
single frequency waveforms to examine higher
order harmonics.
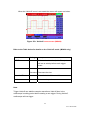
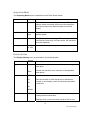
Fig 42, 43, 44, 45 show four types of window functions referring to a sine wave of
1KHz.
70 V5.1 ‐ March 2010 Fig 42 - Rectangle window
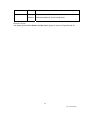
Fig 43 - Blackman window
Fig.44 - Hanning window
71 V5.1 ‐ March 2010 Fig.45 - Hamming window
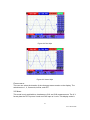
Quick Tips
If desired, use the zoom feature to magnify the FFT waveform.
Use the default dBV RMS scale to see a detailed view of multiple frequencies,
even if their amplitudes vary greatly. Use the linear RMS scale to see an overall
view of how frequencies compare.
Signals that have a DC component or an offset can cause incorrect FFT
waveform component magnitude values. To minimize the DC component, choose
AC Coupling on the source signal.
To reduce random noise and aliased components in repetitive or single-shot
events, set the oscilloscope acquisition mode to ‘average’.
NOTE 1:
Nyquist frequency: The highest frequency that a Real Time Digital Oscilloscope
can measure at exactly half the sampling rate is called the Nyquist frequency. If
under-sampling occurs when the frequency sampled is higher than the Nyquist
frequency, “False Wave” phenomenon will occur. The relationship between the
frequency being sampled and measured is of great importance in this context.
NOTE 2:
In FFT mode, the following settings are prohibited:
1)
Window set
2)
Changing the source channel (in CH1 Setup or CH2 Setup menu)
72 V5.1 ‐ March 2010 3)
XY Formatting in the DISPLAY SET mode
4)
“SET 50%” (trigger level at the vertical point of the signal amplitude) in the
Trigger setting mode
5)
Autoscale
6)
Wave recording
7)
Measure 1 and Measure 2
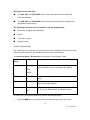
73 V5.1 ‐ March 2010 SYSTEM STATUS MENU The system status menu is used to display configuration information concerning
horizontal, vertical, trigger, and other systems. Follow the steps below to check status:
1.
Press the MENU key; the function menu will then appear at the right side of the
screen.
2.
Press the MENU ▲ or MENU ▼ key to select SYSTEM STAT. Four (4) selectable
options will then appear at the bottom of the screen.
3.
Sequentially press F1 through F4 to view the corresponding status information.
Refer to Figure 46.
Figure 46: System Status
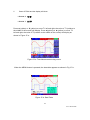
74 V5.1 ‐ March 2010 MAIN TIME BASE MODE The time base mode menu is explained as the following table.
Function menu
Setting Explanation
Main Time Base
Horizontal main time base
Zone Window
Use the two cursors to define a zoom window area
Window
Full-screen display
To zoom in on a small area of the display, perform the following steps:
1.
Press MENU to view the function menu on the right side of the screen.
2.
Press MENU ▲ or MENU ▼ to select the TIME MODE. Three (3) selectable options
will then appear at the bottom of the display.
3.
Use the Soft-keys F1, F2, and F3 to select the Main Time Base, Zone Window, or
Window functions as described in the Table above.
4.
Use the OPTION key and the◄ (yellow) and ► (yellow) keys to adjust and vary
the Time Base and size of the window zoom.
Refer to Figures 47 and 48.
Figure 47: Original Window Setting
75 V5.1 ‐ March 2010 Figure 48: Window Zoom
PC DATA TRANSMISSION For PC data transmission, perform the following steps:
1.
Press MENU; the function menu will then appear on the right side of the screen
2.
Press MENU ▲ or MENU ▼ to select the display setting mode DISP SET; the
display will show four (4) selectable options at the bottom of the screen
3.
Press the F4 key; select Bitmap or Vectors
4.
Connect the oscilloscope to the PC using the supplied data transmission cable
5.
Install and open the supplied software
6.
Use the software as described in the software’s HELP utility
76 V5.1 ‐ March 2010 User's Guide Model MS460 60 MHz Digital Oscilloscope Model MS420 20 MHz Digital Oscilloscope SECTION TWO: Multimeter Operation 77 V5.1 ‐ March 2010 78 V5.1 ‐ March 2010 USING THE MULTIMETER
ABOUT THIS CHAPTER This chapter provides step-by-step instructions for using the Multimeter functions.
These instructions also provide basic examples of menus and other basic operations.
MAKING METER CONNECTIONS Use the four 4-mm safety banana jack inputs for the Meter functions: COM, V/Ω/C,
10A, mA.
The four (4) banana jack inputs on the face of the meter are, L to R, 10A current, mA
current, COM (ground/negative), and Volts/Resistance/Capacitance
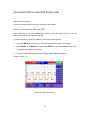
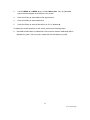
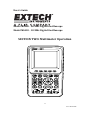
MULTIMETER DISPLAY WINDOW Figure 1: Multimeter Display Window
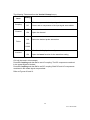
79 V5.1 ‐ March 2010 Description
1.
Battery status indicator
2.
Manual range indicator. In MANUAL mode the user selects the measurement
range
3.
Measurement mode indicators:
DCV: DC Voltage measurement
ACV: AC voltage measurement
DCA: Direct current (DC) measurement
ACA: AC current measurement
R: Resistance measurement
: Diode measurement
: Continuity measurement
C: Capacitance measurement
4.
Relative measurement mode indicator
5.
RUN: Continuous update mode. STOP: Display data hold mode
6.
The reference value in the relative measurement mode
7.
(X10) reading multiplier
8.
Unit of measure indicator and measurement reading
9.
Automatic range mode (AUTO). Meter automatically selects measurement range
10. Absolute / Relative measurement modes: The “||” symbols represents absolute
measurement (normal) mode. The “ ” symbol represents the relative mode
11. Manual measurement control (user selects measurement range)
12. Color coded scale indicator; Each test mode has a unique color scheme
80 V5.1 ‐ March 2010 MAKING MULTIMETER MEASUREMENTS Press the DMM/OSC key; the oscilloscope will switch to the multimeter mode. The
meter will prompt the user to correctly insert the test leads. Use the A, V, and R keys
to select the desired multimeter function.
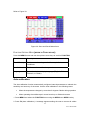
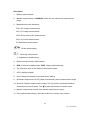
MEASURING RESISTANCE
To measure resistance, first remove power from the component or circuit under test
and then follow these steps:
1.
Insert the black lead into the COM banana jack input and the red lead into
the V/Ω/C banana jack input
2.
Press the R key. An ‘R’ appears at the top of the screen
3.
Connect the red and black test leads to the resistor or circuit under test. The
resistance value will appear on the screen (unit of measure: Ohms)
Refer to the example diagram below in Figure 2.
Figure 2: Resistance Measurement
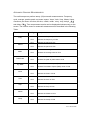
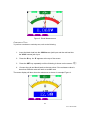
MEASURING DIODE VOLTAGE
To make a measurement on the diode, do the following:
1.
Insert the black lead into the COM banana jack input and the red lead into
the V/Ω/C banana jack input
2.
Press the R key. An ‘R’ appears at the top of the screen
3.
Press the SET key repeatedly until the diode symbol is displayed
4.
Connect the red and black leads to the diode and read the displayed voltage
(V)
81 V5.1 ‐ March 2010 5.
Reverse the test lead polarity and perform the test again Refer to the
example display screen in Figure 3.
82 V5.1 ‐ March 2010 Figure 3: Diode Measurement
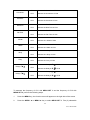
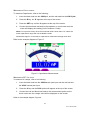
CONTINUITY TEST
To perform a resistance continuity test, refer to the following:
1.
Insert the black lead into the COM banana jack input and the red lead into
the V/Ω/C banana jack input
2.
Press the R key. An ‘R’ appears at the top of the screen
3.
Press the SET key repeatedly until the following is shown on the screen:
4.
Connect the red and black leads to the test points. If the resistance value is
lower than 50Ω the meter will emit an audible tone
The meter display will also show the resistance as shown in example Figure 4.
83 V5.1 ‐ March 2010 Figure 4: Continuity Test
84 V5.1 ‐ March 2010 MEASURING CAPACITANCE
To measure Capacitance, refer to the following:
1.
Insert the black lead into the COM jack, and the red lead into the V/Ω/C jack
2.
Press the R key. An ‘R’ appears at the top of the screen
3.
Press the SET key until the C appears at the top of the screen
4.
Connect the black and red leads to the capacitor or circuit under test; the
meter will display the reading (Unit of measure: Farad)
Notes: To improve accuracy when the measured value is lower than 5 nF, select the
lowest capacitance range and use the Relative mode.
Please allow approx. 30 seconds for capacitance measurements larger than 40uF.
Refer to the example diagram in Figure 5.
Figure 5: Capacitance Measurement
MEASURING DC VOLTAGE
To measure DC voltage, refer to the following:
1.
Insert the black lead into the COM banana jack input and the red lead into
the V/Ω/C banana jack input
2.
Press the V key and the DCV symbol will appear at the top of the screen
3.
Connect the red and black test leads to the measurement points on the
circuit under test; the voltage value will be displayed on the screen
Refer to the example diagram, Figure 6.
85 V5.1 ‐ March 2010 Figure 6: DC Voltage Measurement
MEASURING AC VOLTAGE
To measure AC voltage, refer to the following:
1.
Insert the black lead into the COM banana jack input and the red lead into
the V/Ω/C banana jack input.
2.
Press the V key and then press SET so that the ACV symbol appears at the
top of the screen
3.
Connect the red and black leads to the measured points and the AC voltage
values of measured points will be displayed on the screen.
Refer to the example diagram in Figure 7.
Figure 7: AC Voltage Measurement
86 V5.1 ‐ March 2010 MEASURING DC CURRENT
To measure a DC current lower than 400 mA, do the following:
1.
Insert the black lead into the COM banana jack input and the red lead into the
mA banana jack input
2.
Use the A key and the SET key as needed to select the DCA mode (the DCA
symbol will appear at the top of the screen
3.
Ensure that the displayed unit of measure on the main reading screen is mA.
Use the F4 soft-key to select mA if necessary.
4.
Connect the red and black leads to the measured points on the circuit under test;
the DC current value will be displayed on the screen.
Refer to the example diagram in Figure 8.
Figure 8: 400mA DC Current Measurement
To measure a DC current larger than 400 mA, perform the following:
1.
Press the A key and the DCA symbol should appear at the top of the screen.
Use the SET key to select DCA if necessary.
2.
Press the F5 soft-key to select the 10A measurement mode, the unit of measure
on the main reading screen should be A.
3.
Connect the red and black test leads to the measured points on the circuit under
test; The DC current value will be displayed on the screen.
4.
Press the F4 soft-key to return to the mA measurement mode
Refer to the example in Figure 9.
87 V5.1 ‐ March 2010 88 V5.1 ‐ March 2010 Figure 9: 10A DC Current Measurement
MEASURING AC CURRENT
To measure AC current lower than 400 mA, perform the following:
1.
Insert the black lead into the COM banana jack input and the red lead into the mA
banana jack input
2.
Press the A key and then the use the SET key to select the ACA mode. The ACA
symbol will appear at the top of the screen when selected
3.
Use the F4 soft-key to select the mA mode
4.
Connect the red and black leads to the measured points on the circuit under test;
The AC current value will be displayed on the screen.
Refer to the example in Figure 10.
89 V5.1 ‐ March 2010 Figure 10: 400mA AC Current Measurement
90 V5.1 ‐ March 2010 To measure AC current larger than 400 mA, perform the following:
5.
Press the A key and use the SET key to select the ACA mode (ACA symbol will
appear at the top of the screen when selected)
6.
Press the F5 soft-key to select the 10A measurement mode, the unit of measure
on the main reading screen should be A
7.
Connect the red and black test leads to the measured points on the circuit under
test; The AC current value will be displayed on the screen.
8.
Press the F4 soft-key to return to the mA measurement mode
Refer to the example in Figure 11.
Figure 11: AC Current Measurement for 10A
FREEZING THE READINGS (DATA HOLD)
You can hold the displayed readings at any time.
1.
Press the RUN /STOP key to freeze the screen. STOP will be displayed at the
top right of the screen
2.
Press the RUN /STOP key again to resume normal measurement operation
Refer to the example in Figure 12.
91 V5.1 ‐ March 2010 Figure 12: Freezing the Readings
TAKING A RELATIVE MEASUREMENT
The meter can display a reading ‘relative’ to a user-selectable reference value. Refer
to the following discussion on how to make a relative measurement.
First program a reference value. To do so, take a measurement and when the
desired reading is displayed press the “||/ ” soft-key until the ‘ ’ symbol is displayed
at the top of the screen; this indicates that the unit is in the Relative mode. The
reference value is shown on the display screen just below the relative mode symbol.
Now all subsequent readings in the main display area will be displayed relative to the
reference value.
92 V5.1 ‐ March 2010 SELECTING THE AUTOMATIC / MANUAL RANGE MODES
The default mode of the instrument is the automatic range. To switch to the manual
range, perform the following steps:
1.
Repeatedly press the F1 MANUAL soft-key until the desired range is selected on the
meter’s display. MANUAL will be displayed on the upper left hand corner of the
meter’s display when in the manual mode
2.
In the manual range mode, the measuring range is increased by one stage with each
press of the F1 key. When the highest range is reached, the meter jumps to the
lowest range
3.
Press the F3 soft-key to select the AUTO range mode. AUTO will display on the
upper left side of the screen.
Refer to the display example in Figure 13.
Figure 13: Automatic/Manual Range Adjustment
93 V5.1 ‐ March 2010 94 V5.1 ‐ March 2010 FAQ
The oscilloscope does not power up
Check that the battery is charged. If the battery is not charged, plug the AC Adaptor charger
into an AC source and then into the meter. Charge the battery for at least 15 minutes before
using the Oscilloscope. Please contact Extech for service if the instrument fails to power on
after a charge
The oscilloscope shuts down after operating for only several seconds
The battery is most likely very weak or completely drained; Check the displayed battery status
symbol. The
symbol indicates that the battery is exhausted and must be charged.
The meter displays ERR when in the Multimeter mode
The measurement mode is likely not selected. In this case, press any of the three mode keys
V, A or R
The measured voltage value is 10 times larger or smaller than the actual
value indicated in the oscilloscope mode
Check that the channel attenuation level matches the actual probe attenuation ratio
A waveform is displayed on the oscilloscope screen but is not stable
Check whether the signal item in the trigger mode menu matches the actual signal channel.
Check the trigger mode: The edge trigger mode is typically used for most applications; the
video trigger mode is applicable for video signals. Only when the proper trigger mode is
applied can the waveform be stable.
Change the trigger coupling into the HF rejection and LF rejection to filter the HF or LF noise
trigger by the interference.
No display when the RUN/STOP key is pressed in oscilloscope mode
Check whether the trigger mode in the trigger mode menu is in Normal or Single Shot and
whether the trigger level is outside of the waveform’s range.
In such conditions, adjust the trigger level to be in the middle of the range or select the nonauto trigger mode. Additionally, press the AUTO SET key and re-try the previous suggestions.
95 V5.1 ‐ March 2010 When using average sampling in the sampling mode or when selecting a long display time in
the oscilloscope display mode, the display speed is slow; this is normal
96 V5.1 ‐ March 2010 APPENDICES
APPENDIX A: SPECIFICATIONS OSCILLOSCOPE
Unless otherwise indicated, all technical specifications are applicable to the 10X probe
attenuation switch setting. The oscilloscope should meet the following requirements in
order to meet the published specifications.
■
The instrument should be allowed to run continuously for more than 30 minutes under
the specified operating temperature
■
If the operating temperature is exceeded by more than 5 degrees Celsius, an “Autocalibration” must be performed (system function menu)
Sampling
Sampling modes
Normal sampling, Peak detection, Average value
Sampling rate
100MS/s (MS420), 250MS/s (MS460)
Input
Input coupling
DC, AC
Input impedance
1MΩ ±2% connected in parallel with 20pF ±5pF
Probe attenuation coefficients
1X, 10X, 100X, 1000X
Max. Input voltage
400V (peak)
Channel delay time(typical)
150ps
Horizontal
Sampling rate range
10S/s~100MS/s
Waveform interpolation
(sin x)/x
Data record length
6K points for each channel
Scanning speed range(S/div)
5ns/div~5s/div, steps in “1-2.5-5” mode
Sampling rate relay time
accuracy
±100ppm (time interval equal to or larger than 1ms)
Time interval
Single: ± (1 sampling interval time + 100ppm × rdg +
0.6ns)
97 V4.0 ‐ March 2010 ( T) measurement
accuracy(full bandwidth)
Average 16 : ± (1 sampling interval time
+100ppm×reading+0.4ns)
98 V4.0 ‐ March 2010 Vertical
Analog digital converter A/D
8 bits resolution (both channels synchronously)
Sensitivity range
5mV/div 5V/div(for the BNC connector input
V/div
Displacement range
± 10 div (MS420), ±2V(5mV/div ~ 200mV/div), ±50V(500mV/div ~5 V /div) (MS460)
Analog bandwidth
60MHz (MS460); 20MHz (MS420)
Single bandwidth
Full bandwidth
Low frequency response
≥ 5Hz (BNC connector
(A/D coupling, -3dB)
Rise time
≤17.5ns (MS420) , ≤5.8ns (MS460)
DC gain accuracy
±5%
DC measurement (accuracy
average value sampling
mode
The voltage difference between any two points on
the waveform after averaging the captured
waveforms is greater than 16: ± (5% reading + 0.05
divisions)
Trigger
Trigger sensitivity
Edge trigger
Triggering level range
DC
coupling
CH1 and CH2: 1div (DC full bandwidth)
AC
coupling
Same as the DC coupling when it is equal
to or larger than 50Hz.
±6 divisions from the screen center
Triggering level accuracy
(typical) which is applicable
to the signal with rise and
fall time equal to or longer
than 20ns
±0.3 divisions
Trigger displacement
655 divisions for pre-triggering and 4 divisions for posttriggering
50% level setting (Typical).
Operation with the input signal frequency equal to or
larger than 50Hz.
99 V4.0 ‐ March 2010 Trigger sensitivity (Video
triggering and typical
mode)
2 divisions of peak-to-peak value
Signal system and line/field
frequency (Video triggering
mode)
Supports NTSC, PAL and SECAM broadcasting
systems of any field or line frequency
Measurement
Cursor measurements
Voltage difference and time difference between cursors
Auto measurements
Peak-to-Peak voltage, mean voltage, root mean square
value, frequency and period
(MS420 0nly):Vmax, Vmin, Vtop, Vbase, Width, Overshoot, Pre‐shoot, Rise time, Fall time, ﹢Width, ﹣Width, ﹢Duty, ﹣Duty, Delay A→B↑, Delay A→B↓
100 V4.0 ‐ March 2010 Probe
1X position
10X position
Bandwidth
Up to 6 MHz (DC)
Up to full bandwidth (DC)
Attenuation rate
1: 1
10: 1
Compensation range
20pf 40pf
Input resistance
1MΩ ±2
10MΩ ±2
Input impedance
85pf 115pf
14.5pf 17.5pf
Input voltage
150 V DC
300 V DC
MULTIMETER
Voltage (VDC)
Input Impedance: 10MΩ
Max. Input Voltage: 1000V (DC or AC peak-to-peak value)
Range
Accuracy
Resolution
400.0mv
±1.5% ±2 digit
100uV
4.000V
±1% ±1 digit
1mV
40.00V
10mV
400.0V
100mV
Voltage (VAC)
Input Impedance: 10MΩ.
Max. Input Voltage: 750V (AC)
Frequency range: from 40Hz to 400Hz
Range
Accuracy
Resolution
4.000V
±1% ±3 digits
1mV
40.00V
10mV
400.0V
100mV
Direct Current (DC)
101 V4.0 ‐ March 2010 Range
Accuracy
Resolution
40.00mA
±1.5% ±1 digit
10uA
400.0mA
±1.5% ±1 digit
100uA
10A
±3% ±3 digit
10mA
102 V4.0 ‐ March 2010 Alternating Current (AC)
Range
Accuracy
Resolution
40.00mA
±1.5% ±3 digit
10uA
400.0mA
±2% ±1 digit
100uA
10A
±5% ±3digit
10mA
Range
Accuracy
Resolution
400.0 Ω
±1% ±3 digit
0.1Ω
4.000KΩ
±1% ±1 digit
1Ω
Resistance
40.00KΩ
10Ω
400.0KΩ
100Ω
4.000MΩ
1KΩ
40.00MΩ
±1.5% ±3 digit
10KΩ
Range
Accuracy
Resolution
51.20nF
±3% ±3 digit
10pF
Capacitance
512.0nF
100pF
5.120uF
1nF
51.20uF
10nF
100uF
100nF
Diode
Voltage reading: 0 V ~1.5 V
Continuity Test
Audible tone when resistance is lower than 50Ω
103 V4.0 ‐ March 2010 GENERAL SPECIFICATIONS
Dimensions
7.1 x 4.5 x 1.6” (18 × 11.5 × 4cm)
Weight
1.4 lbs. (645 g)
Power consumption
6W
Display type
3.7" color liquid crystal display (LCD)
Display resolution
640 (horizontal) × 480 (vertical) pixels
Display color
65536 colors
Power Adapter
Power supply
100-240 V AC 50/60Hz
Power output
8.5 VDC
Current output
1500 mA
Ambient Environmental Specifications
Temperature
Operation Temperature
On Battery power
0 to 50 °C (32 to 122 °F)
With Power adapter
0 to 40 °C (32 to 104 °F)
Storage Temperature
-20 to +60 °C (-4 to 140 °F)
Relative Humidity and Temperature
Operation:
0 to 10 °C (32 to 50 °F)
no condensation
10 to 30 °C (50 to 86 °F)
95 %
30 to 40 °C (86 to 104 °F)
75 %
40 to 50 °C (104 to 122 °F)
45 %
Storage:
-20 to +60 °C (-4 to +140 °F)
no condensation
104 V4.0 ‐ March 2010 APPENDIX B: MAINTENANCE AND CLEANING MAINTENANCE
Do not store or place this instrument where the liquid crystal display (LCD) may be
directly exposed to sunlight for extended periods
Warning: Do not allow the instrument to become wet
Cleaning
Inspect the instrument and the probe frequently in accordance with operating
conditions. Clean the outer surface of the instrument according to the following steps:
1. Wipe the outside of the instrument and the probe using a soft cloth. Use care
when cleaning the LCD display screen.
2. Use a slightly damp cloth and mild detergent when cleaning and only clean
the instrument when it is powered down. Do not use abrasive chemical
detergents
Warning: Before use, please confirm that the instrument is dry so as to avoid
electrical short circuits and personal injury
STORAGE OF INSTRUMENT
If the test tool is to be stored for an extended time, the lithium battery must be
charged before storage
105 V4.0 ‐ March 2010 APPENDIX C: CHARGING THE INSTRUMENT The lithium battery may ship un-charged. The battery must be initially charged for 4
hours (the instrument must be turned off during charging). The battery can supply
power for 4 hours after being charged completely.
When supplying power by using the battery, a battery indicator is displayed on the
top of the screen. The battery symbols appear as follows: , ,
and , where
indicates that the battery can only be used for about 5 minutes. To charge the battery
and power the instrument, connect the oscilloscope using the supplied power
adapter. The charging speed can be increased by turning off the meter.
Note: To avoid battery overheating during charging, do not charge the meter in an
area where the ambient temperature exceeds the specified operating temperature.
Note: The meter can be charged for extended periods. After it is charged it switches
to a low charge status and may remain in the charging configuration for extended
periods.
REPLACING THE LITHIUM BATTERY UNIT
It is usually not required to replace the battery but if it is required only qualified
personnel should carry out this operation. Use only the same type of lithium battery
currently installed in the meter. To access the battery remove the three (3) Philips
screws on the rear of the instrument at the top of the stand behind the rubber
protective jacket.
106 V4.0 ‐ March 2010 APPENDIX D: SET THE REAL‐TIME CLOCK 1. Press the MENU key; the function menu will display on the right side of the
screen.
2. Use the MENU ▲ or MENU ▼ key to select SYS STAT; four (4) options will
appear at the bottom of the screen.
3. Use the F4 key to select the MISC option and the system time, along with other
information, will appear as shown below:
4. Press OPTION to enter the Time setting mode. The highlighted field can be
edited.
5. Use the ◄ and ► keys to highlight a value for editing; Use the▲ and ▼ arrow
keys to change the corresponding value for year, month, date, hours, minutes
and second
6. Press the MENU ▲up arrow key to exit the programming mode
107 V4.0 ‐ March 2010 Warranty (English) EXTECH INSTRUMENTS CORPORATION (A FLIR COMPANY) warrants this instrument to be free of defects in
parts and workmanship for one year from date of shipment (a six month limited warranty applies to sensors and
cables). If it should become necessary to return the instrument for service during or beyond the warranty period,
contact the Customer Service Department at (781) 890-7440 ext. 210 for authorization or visit our website
www.extech.com for contact information. A Return Authorization (RA) number must be issued before any product is
returned to Extech. The sender is responsible for shipping charges, freight, insurance and proper packaging to
prevent damage in transit. This warranty does not apply to defects resulting from action of the user such as misuse,
improper wiring, operation outside of specification, improper maintenance or repair, or unauthorized modification.
Extech specifically disclaims any implied warranties or merchantability or fitness for a specific purpose and will not be
liable for any direct, indirect, incidental or consequential damages. Extech's total liability is limited to repair or
replacement of the product. The warranty set forth above is inclusive and no other warranty, whether written or oral,
is expressed or implied.
Product Support
Technical Support: [email protected] -- Calibration and Repairs: [email protected]
Product specifications subject to change without notice
For the latest version of User Guides, Software updates, and other information:
www.extech.com
(781) 890-7440
Extech Instruments Corporation, 285 Bear Hill Road, Waltham, MA 02451
ISO9001 Certified
Copyright © 2010 Extech Instruments Corporation (a FLIR company)
All rights reserved including the right of reproduction in whole or in part in any form.
Garantía (Español) EXTECH INSTRUMENTS CORPORATION (UNA EMPRESA FLIR) garantiza este instrumento para estar libre de
defectos en partes o mano de obra durante un año a partir de la fecha de embarque (se aplica una garantía limitada
a seis meses para los cables y sensores). Si fuera necesario regresar el instrumento para servicio durante o
después del periodo de garantía, llame al Departamento de Servicio a Clientes al teléfono (781) 890-7440 ext. 210
para autorización, o visite nuestra página en Internet www.extech.com para Información del contacto. Se debe
otorgar un número de Autorización de Retorno (RA) antes de regresar cualquier producto a Extech. El remitente es
responsable de los gastos de embarque, flete, seguro y empaque apropiado para prevenir daños en tránsito. Esta
garantía no se aplica a defectos resultantes de las acciones del usuario como el mal uso, alambrado equivocado,
operación fuera de las especificaciones, mantenimiento o reparación inadecuada o modificación no autorizada.
Extech específicamente rechaza cualesquier garantías implícitas o factibilidad de comercialización o aptitud para
cualquier propósito determinado y no será responsable por cualesquier daños directos, indirectos, incidentales o
consecuentes. La responsabilidad total de Extech está limitada a la reparación o reemplazo del producto. La
garantía precedente es inclusiva y no hay otra garantía ya sea escrita u oral, expresa o implícita.
Ayuda de producto
Soporte Técnico [email protected] - Reparación / Retornos: [email protected]
Las especificaciones del producto están sujetas a cambios sin aviso
Para la última versión de esta Guía del usuario, actualizaciones de software y otra información
www.extech.com (781) 890-7440
Extech Instruments Corporation, 285 Bear Hill Road, Waltham, MA 02451
Certificado ISO9001 Copyright © 2010 Extech Instruments Corporation (una empresa FLIR)
Reservados todos los derechos, incluyendo el derecho de reproducción total o parcial en cualquier medio.
108 V4.0 ‐ March 2010 Garantie (Français) EXTECH APPAREILS CORPORATION (Une société FLIR) garantit que cet appareil est exempt de défauts matériels et de fabrication
pendant un an à compter de la date d’envoi (une garantie limitée de six mois s’applique aux capteurs et câbles). Si le renvoi de
l’appareil pour réparation devient nécessaire durant ou après la période de garantie, contactez le service client au (781) 890-7440
poste. 210 pour autorisation ou visitez notre site Web à l’adresse www.extech.com pour obtenir nos coordonnées. Un numéro
d’autorisation de retour (AR) doit être délivré avant tout retour de produit à Extech. L’expéditeur prend à sa charge les frais
d’expédition, le fret, l’assurance et l’emballage correct de l’appareil afin de prévenir toute détérioration durant le transport. Cette
garantie ne s’applique pas aux dommages imputables à l’utilisateur tel que l’usage impropre ou abusif, un mauvais câblage, une
utilisation non conforme aux spécifications, un entretien ou une réparation incorrecte, ou toute modification non autorisée. Extech
déclinera spécifiquement toute garantie ou qualité marchande ou aptitude à l’emploi prévu et ne sera en aucun cas tenu
responsable pour tout dommage conséquent direct, indirect, ou accidentel. La responsabilité totale d’Extech est limitée à la
réparation ou au remplacement du produit. La garantie définie ci-dessus est inclusive et aucune autre garantie, écrite ou orale,
n’est exprimée ou implicite.
Appui de produit Service d’assistance technique [email protected] ‐ Réparations et retours :[email protected] Spécifications produit sujettes à modifications sans préavis Pour obtenir la dernière version de ce manuel d’utilisation, des mises à jour logicielles et autres informations Extech Appareils Corporation, 285 Bear Hill Road, Waltham, MA 02451 www.extech.com (781) 8907440 Certifié ISO 9001 Copyright © 2010 Extech Appareils Corporation (une société FLIR).
Tous droits réservés, y compris le droit de reproduction, en tout ou en partie, sous quelque forme que ce soit.
109 V4.0 ‐ March 2010