1
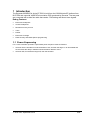
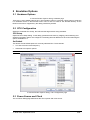
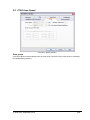
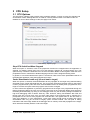
_ V9.12. 184 Technical Notes Renesas V850E2/Fx4 Family In-Circuit Emulation This document is intended to be used together with the CPU reference manual provided by the silicon vendor. This document assumes knowledge of the CPU functionality and the terminology and concepts defined and explained in the CPU reference manual. Basic knowledge of winIDEA is also necessary. This document deals with specifics and advanced details and it is not meant as a basic or introductory text. Contents Contents 1 1 Introduction 1.1 Power Sequencing 2 2 2 Emulation Options 2.1 Hardware Options 2.2 CPU Configuration 2.3 Power Source and Clock 2.4 Initialization Sequence 2.5 JTAG Scan Speed 3 3 3 3 4 5 3 CPU Setup 3.1 CPU Options 3.2 Debugging Options 3.3 Reset Options 3.4 Nexus Options 6 6 7 8 8 4 Flash Mask Options and Security Flags 10 5 Memory Access 11 6 Hardware Breakpoints 11 7 OSEK Debug Support 12 8 Getting Started 12 9 Trace 9.1 On-Chip Trace Concept 9.2 On-Chip Trigger and Qualifier Configuration 9.3 Trace Examples 13 13 13 15 10 Coverage 23 11 Profiler 23 iSYSTEM, September 2014 1/23 1 Introduction The Renesas V850E2/Fx4 ActiveGT POD is built from the iC3000/ActiveGT platform from iSYSTEM and a special V850E2/Fx4 emulation POD produced by Renesas. The two parts are connected with a wide flex cable that carries JTAG debug and Nexus trace signals. Debug Features Execution breakpoints Access breakpoints Real-time memory access Trace Profiler Execution Coverage Flash Security and Mask Options programming 1.1 Power Sequencing For a correct emulator operation a prescribed power sequence must be followed: At Power On the emulator must be switched on first, and then the target. In an automated test environments the delay in between should be about 300ms or more. At Power Off, first switch the target off, then the emulator. iSYSTEM, September 2014 2/23 2 Emulation Options 2.1 Hardware Options In-Circuit Emulator Options dialog, Hardware page There are no user settable options here. The Emulation memory is actually a flash memory inside the Fx4 Umbrella device on the Renesas POD. There is also no need for the Shadow Memory as the Real-Time access is supported by the debug interface by default. 2.2 CPU Configuration Select the emulated CPU family, the POD and the target device being emulated. CPU Setup Opens the CPU Setup dialog. In this dialog, parameters like memory mapping, bank switching and advanced operation options are configured. The dialog will look different for each CPU reflecting the options available for it. Set Default This button will set default options for currently selected CPU. These include: Vcc and clock source and frequency Advanced CPU specific options Note: Default options are also set when the Family or a POD is changed. In-Circuit Emulator Options dialog, CPU Configuration page 2.3 Power Source and Clock The Vcc/Clock Setup page determines the CPU's power and clock source. iSYSTEM, September 2014 3/23 In-Circuit Emulator Options dialog, Vcc/Clock Setup page No option here, as well. The POD power is provided so that the emulator can be used standalone, that is, without being connected to a target board. As soon as the target is connected, the target power has to be applied. Note the correct sequencing of the emulator and target power. There is no programmable clock control available from winIDEA. Check the Renesas V850E2/Fx4 User Manual to familiarize yourself with the microcontroller clock controller. The V850Fx4 Renesas POD (IC30741P) comes populated with the 4MHz crystal, which connects to the Main Oscillator. Next, a 32.768 kHz quartz crystal is provided for the Sub Oscillator. If the target application uses different main oscillator crystal than 4MHz, the crystal on the V850Fx4 Renesas POD must be exchanged. Refer to the IC30740 POD Hardware Reference document, which comes along with the development system, for more details on exchanging the 4MHz main oscillator crystal. 2.4 Initialization Sequence Usually, there is no need to use initialization sequence when debugging with an In-Circuit Emulator (ICE) a single chip application. Primarily, initialization sequence is used on On-Chip Debug systems to initialize the CPU after reset to be able to download the code to the target (CPU or CPU external) memory. With an ICE system, the initialization sequence may be required for instance to enable memory access to the CPU internal EEPROM or to some external target memory, which is not accessible by default after the CPU reset. The user can also disable CPU internal COP using initialization sequence if there is a need for that, etc. Initialization sequence is executed immediately after the CPU reset and then the code is downloaded. Detailed information may be found in the Initialization Sequence help topic. iSYSTEM, September 2014 4/23 2.5 JTAG Scan Speed JTAG Scan Speed definition Scan speed JTAG Scan Speed is automatically set to the Free mode. The free running JTAG clock is required by the V850E2 debug interface. iSYSTEM, September 2014 5/23 3 CPU Setup 3.1 CPU Options The CPU Setup, Options page provides some emulation settings, common to most CPU families and all emulation modes. Settings that are not valid for currently selected CPU or emulation mode are disabled. If none of these settings is valid, this page is not shown. CPU Setup, Options page Stop CPU Activities When Stopped When this option is checked, most of the peripheral functions are stopped when the application is stopped. For details, please refer to the Fx4 User Manual, Chapter 36, On-Chip Debug Unit. This option directly controls the SVSTOP bit in the EPC Emulation Break Control register. Note that some peripherals have an override bit to disable stopping when the CPU is stopped in debug mode. In general, it is recommended that the option is checked in order to have more predictable behavior of the debugged application using these peripheral functions. Cache downloaded code only (do not load to target) When this option is checked, the download files will not propagate to the target using standard debug download but the Target download files will. This is typically used where the flash memory has limited number program/erase cycles and when the downloaded code has already been programmed. Don’t forget to uncheck the option when the program sources have changed! In cases, where the application is previously programmed in the target or it's programmed through the flash programming dialog, the user may uncheck 'Load code' in the 'Properties' dialog when specifying the debug download file(s). By doing so, the debugger loads only the necessary debug information for high level debugging while it doesn't load any code. However, debug functionalities like ETM and Nexus trace will not work then since an exact code image of the executed code is required as a prerequisite for the correct trace program flow reconstruction. This applies also for the call stack on some CPU platforms. In such applications, 'Load code' option should remain checked and 'Cache downloaded code only (do not load to target)' option checked instead. This will yield in debug information and code image loaded to the debugger but no memory writes will propagate to the target, which otherwise normally load the code to the target. iSYSTEM, September 2014 6/23 3.2 Debugging Options This pane exposes two options related to a memory access. Displayed below are default settings. If the settings are reversed, it allows a post-mortem examination of the internal RAM that would otherwise be cleared by the debugger initialization. Ignore access errors Any access to an undefined address space or non-initialized internal RAM returns an error status. This is displayed with question marks ‘?’ all over the memory window when such address base is given. However, check this option to be able to inspect the state of the internal RAM, and uncheck the ‘Initialize internal RAM’ option. Initialize internal RAM Per default this option must be checked. After reset, the microcontroller internal SRAM is not initialized and cannot be used. When the option is checked, the debugger initializes internal SRAM, which is required for internal flash programming. Uncheck the option only when it’s required to analyze the microcontroller state after the reset. Note that the Debug download will fail in this case! Use case would be to download the code to the flash with this option checked. Next, power off and power on complete system and then perform a debug reset only. At that point internal RAM is intact by the debugger and the microcontroller state can be inspected. iSYSTEM, September 2014 7/23 3.3 Reset Options Latch target RESET When the option is checked, the debugger latches active target reset until it gets processed. This yields a delay between the target reset and restart of the application from reset. If this delay is not acceptable for a specific application, the option should be unchecked. An example is an application where the CPU is periodically set into a power save mode and then waken up e.g. every 6ms by an external reset circuit. In such case, a delay introduced by the debugger would yield application not operating properly. When the option is unchecked, the application is resumed after the internal (e.g. watchdog) or external target reset with a minimum delay. 3.4 Nexus Options The Nexus Options dialog allows setting the Nexus MDO width and the Nexus clock divider. There is no uniform rule which setting is the best as it depends on the requirements. 16-bit port size is the default recommended value. It gives the best result in terms of session time and time accuracy. Profiler uses this configuration internally. When tracing a lot of data, it is recommended to use 48-port size since 16-bit port size selection will yield overflows sooner. Note that the maximum port size for the Dx4 device is 24 bits. Use 4-bit port size when maximum session time (tracing no or minimum data -> profiler) is required and a time stamp accuracy can be sacrificed. The Nexus clock divider is usually set to the 1:2 ratio. Lower divider settings can also be used if trace data integrity problems are suspected. iSYSTEM, September 2014 8/23 The trace clock frequency can be checked in the Plugins/Measurement window. The Trace Clock is measured on the Renesas POD trace connector, while the CPU Clock is calculated from the Nexus clock divider setting above. If the trace clock exceeds the hardware limits, then the trace window will contain errors or be blank even in Record everything mode. The displayed frequencies are shown for informational purposes only. Note the sample screenshot above was taken on a target without the CPU PLL being initialized. The CPU thus ran from a default internal high-speed ring oscillator. iSYSTEM, September 2014 9/23 4 Flash Mask Options and Security Flags The dialog under the Hardware/Tools/FLASH menu provide access to the V850E2/Fx4 Flash Mask option bits. Certain options need the CPU to go over reset to take effect. Please refer to the Fx4 User Manual. Note: Programming of the Security Flags has been disabled to prevent locking the in-circuit emulation device. The flags are intended for end product protection, and are available for iC5000 and iC3000/iCard environments. The picture above shows the recommended settings for the initial Flash Mask Options. The bits cleared disable both instances of the WDTA Window Watchdog Timer A. Note: Download to flash will fail if the watchdog timer is not disabled. iSYSTEM, September 2014 10/23 5 Memory Access V850E2 debug interface features a real-time memory access, that does not require user program to be stopped and allows reading the memory while the application is running. Note that large amounts of memory read affect the application performance. 6 Hardware Breakpoints Access breakpoints are configured by opening the Debug/Hardware Breakpoints dialog. Two breakpoints are provided. Note that they are shared with the execution breakpoints from the Debug/Breakpoints dialog. For every breakpoint an ASID - Address space identifier value can be set. When ASID is irrelevant, keep the check box unchecked. Various logic conditions can be set for the address including address match and address mismatch. Address can be entered as a physical address or as a symbol, whose address is extracted from the debug information included in the download file. Data breakpoints also allow selecting memory access type, access size and optionally data value that can match or mismatch. In the Action tab select the desired option to be performed when a breakpoint occurs. iSYSTEM, September 2014 11/23 7 OSEK Debug Support Enable OSEK support by selecting ‘ORTI (AUTOSAR,OSEK,CMX)’ selection in the ‘Debug/Operating System’ dialog and then press the ‘Setup’ button. Specify the path to the OSEK ORTI file, where the necessary debug information is kept. 8 Getting Started 1) 2) 3) 4) 5) Connect the system. Power up the emulator and then power up the target. Execute debug reset. The CPU should stop on reset location 0x0. Open memory window at RAM location and check whether it is possible to modify its content. If above steps passed successfully, the debugger is operational and code download should be possible. iSYSTEM, September 2014 12/23 9 Trace The V850E2/Fx4 development system is based on a Renesas Fx4 Umbrella device that incorporates an On-Chip Trace Unit, the OCT. The on-chip trace is based on messages and has limitations compared to the in-circuit emulator where the complete CPU address, data and control bus is available to the emulator in order to implement exact and advanced trace features. 9.1 On-Chip Trace Concept For program trace, trace port sends a message only for every executed non-sequential instruction, effectively on changes of a program flow. Each message contains the instruction type information and a destination program counter. Based on this information, the debugger reconstructs complete program flow by inserting sequential instructions between the recorded non-sequential instructions. This can work as long as the debugger has a complete code image of the application (download file) in order to know which sequential instructions are located between the non-sequential. For this reason, a self-modifying code cannot be traced. Transmitted OCT messages are appended with a time stamp information. That is a time of message, not of execution. All sequential instructions being reconstructed by the debugger, relying on the code image and inserted between the recorded addresses, do not contain exact time information. Any interpolation with the recorded addresses containing valid time stamp would be misleading for the user. Hence, all sequential instructions between the two non-sequential instructions, have the same time stamp value. Data trace can record all data access cycles issued by the CPU. However, no access to the CPU core registers (R0-R31, FEPC, CTBP, etc) can be traced. Trace port bandwidth becomes quickly restrictive with the data trace enabled since data trace usually generates 2 messages for a single traced data access. When the number of trace messages exceeds the trace port bandwidth, an overflow message is sent out in order to inform the user that messages were lost. From that point on until the next synchronization message, there will be a gap in the trace display. It’s up to the user then to either limit the traced data accesses, which yields less messages and thus no trace overflow, or to turn on the non-real-time trace mode, which stalls the CPU in order for the trace port to transmit all messages in the internal trace pipeline without loss. The non-real-time trace mode is turned on by checking the Stall CPU to prevent overflows option in the Trigger/Qualifier configuration dialog. 9.2 On-Chip Trigger and Qualifier Configuration The Qualifier pane defines which CPU cycles are recorded by the trace. Complete program flow can be either recorded or not. Additionally, program flow recording can be limited to a specific part of an application code. Use Trace ON and Trace OFF option to do that. Record CMOV and Record OTM control the recording of Conditional Move instructions and Ownership Trace Messages. Data accesses can be all recorded but this can easily lead to trace overflows. As an alternative, 4 data qualifier address ranges can be defined for the data accesses. See the next picture for an example. iSYSTEM, September 2014 13/23 Trace Qualifier The Watchpoint Trace width and Data Message Type are shown in their default, recommended settings. Other settings are available to aid solving any more demanding issues. iSYSTEM, September 2014 14/23 9.3 Trace Examples Analyzer window is opened from the View menu. Before using trace for the first time please refer to winIDEA Contents Help, Analyzer Window section (or alternatively to the standalone Analyzer.pdf document). A screenshot of the Trigger dialog shows that any trigger item can also function as a qualifier, as a Trace On or Off switch, or as an input to the Trigger Sequence Engine coupled with an event counter. Trace Trigger Example 1: Trace records the program execution (instructions, no data accesses) until the CPU is stopped. First example explains how to record a complete program flow either from the application or trace start on or up to the moment, when the program stops. In first case, the trace would record and display program flow from the start until the trace buffer is full. Alternatively, the trace can stop recording on a program stop. The ‘Continuous mode’ option allows roll over of the trace buffer, which results in the trace recording up to the moment when the application stops. In practice, the trace displays the program flow just before the program stops, for instance, due to a breakpoint hit or due to the Debug/Stop command issued by the user. Use ‘Record everything’ operation type in the ‘Analyzer’ window and make sure that ‘Continuous mode’ is configured to ensure that the trace buffer rolls over while recording the running program. The trace will stop as soon as the CPU is stopped. Define reasonable buffer size depending on the required depth of the trace record. Have in mind that a smaller buffer uploads faster. You can start with e.g. 16MB. iSYSTEM, September 2014 15/23 Before the program is set to run or while it is running already, activate the trace recording by the ‘Trace begin’ tool bar or the CTRL+B shortcut key. The trace stops recording when the program execution is stopped. After the trace stops recording, the collected information is analyzed and displayed. Select a start ‘Immediately’ or ‘On Trigger’ when the trace should record only until the trace buffer gets full. Example 2: Trace triggers when function Type_Simple() is called and program execution is recorded around the trigger event. Create a new Trace Trigger in the Analyzer window and open the trigger configuration dialog. First, select ‘Enabled’ in the Trigger combo box on top of the dialog, next set Execution Watchpoint 1 for the trigger condition and then enter Type_Simple address in the corresponding address field. Leave the ‘Qualifier‘ pane at default setting, which records program flow only. iSYSTEM, September 2014 16/23 Example 2 Trigger Settings Now activate the trace and run the program. When the trigger event occurs, the trace will stop recording and display the recorded program. Let’s take a look at the trace record as there are some differences in the display comparing to the standard in-circuit emulator trace, where the program flow is obtained by recording activities directly on the CPU bus. iSYSTEM, September 2014 17/23 Example 2 Trace Result When the trigger occurs, trace port outputs a special trigger message called Watchpoint, frame 0 above. This is detected by the external trace hardware and recorded as a trigger event. Recorded trigger message is depicted with a red frame in the trace window. In this example, we can see that actual Type_Simple() function started 3 frames after the Watchpoint message. This is due to a delay between the time when the instruction was executed and the time when belonging message is broadcast externally. It is user’s concern to search for the code that actually generated the trigger message. The distance from the trigger frame to the actual trigger point in the reconstructed program also depends on the number of sequential instructions following the trigger event. iSYSTEM, September 2014 18/23 Example 3: The trace will start recording (instructions and data accesses) after the function Type_Simple() is executed for the fifth time. Let‘s configure a new trigger called e.g. ‘Trigger 1’. Reuse the settings from the previous example. All remains the same except that Execution Watchpoint 1 is now configured for the sequencer respectively SW4 state of the sequencer instead for the trigger. The user can configure a sequence of up to 4 states (SW1-SW4) in the ‘Sequencer’ field. Additionally, enable the counter, which connects it to the output of the sequencer and set its value to 5. Example 3 Trigger Settings Next, open the Qualifier pane in order to enable also a data access recording. iSYSTEM, September 2014 19/23 Example 3 Qualifier Settings Start the trace and run the application from reset on. After Type_Simple() is executed five times, the trace will trigger and normally display the program around the trigger message. Let’s analyze the trace record. It’s possible that the trace record will contain the overflow messages. That happens due to the enabled data trace. Occurrence of overflows depends on the code, which can generate an arbitrary number of data accesses. If the CPU accesses the data very often in a short time, it can produce such amount of messages that the CPU internal Nexus trace FIFO buffer can no longer handle. If that happens, an overflow message is sent out signaling the external trace hardware that the trace information is lost and no longer valid. From that moment on the debugger can no longer reconstruct the program flow properly until the trace FIFO buffer is flushed and a synchronization message is broadcast. There are two solutions for this problem presented below. iSYSTEM, September 2014 20/23 Example 3 Trace Result The first one is to use the non-real-time trace mode, which stalls the CPU until the FIFO buffer becomes ready for new messages and then resumes the execution. This trace mode is turned on by checking the ‘Stall CPU to avoid overflows’ option in the Trigger pane. Since this is a severe intrusion in the real-time program execution it is not a recommended solution unless the user is fully aware of the consequences. The second and better solution is to limit the amount of the generated data access messages. The existing trace configuration records all data accesses although the user might be interested only in data accesses to a specific, limited region or even just to a few variables. iSYSTEM, September 2014 21/23 Example 4: Configure trace to record only data accesses to the 32-bit global variable named iCounter. Following picture shows the necessary settings. Example 4 Qualifier Settings This setting yields a trace recording without overflow errors. See the next screenshot. iSYSTEM, September 2014 22/23 Example 4 Trace Result 10 Coverage Refer to winIDEA Contents Help, Coverage Concepts section for Coverage theory and background. Refer to winIDEA Contents Help, Analyzer Window section (or alternatively to the standalone Analyzer.pdf document) for information on Coverage user interface and use. 11 Profiler Refer to winIDEA Contents Help, Profiler Concepts section for Profiler theory and background. Refer to winIDEA Contents Help, Analyzer Window section (or alternatively to the standalone Analyzer.pdf document) for information on Profiler user interface and use. Disclaimer: iSYSTEM assumes no responsibility for any errors which may appear in this document, reserves the right to change devices or specifications detailed herein at any time without notice, and does not make any commitment to update the information herein. iSYSTEM . All rights reserved. iSYSTEM, September 2014 23/23