1
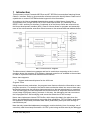
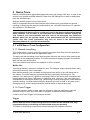
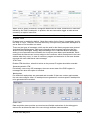
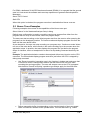
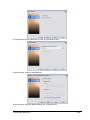
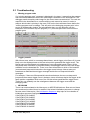
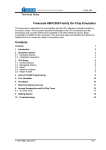
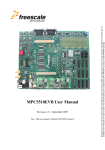
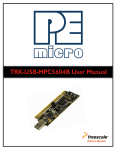
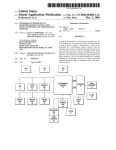
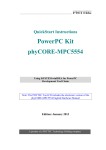
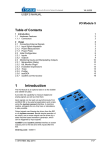
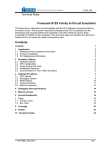
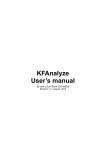
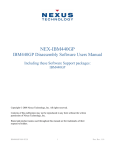
_ V9.12. 225 Technical Notes Freescale MPC5xxx & ST SPC56 Nexus Class 2+ Contents Contents 1 1 Introduction 2 2 Nexus Trace 2.1 e200 Nexus Trace Configuration 2.1.1 Record everything 2.1.2 Trace Trigger 2.2 Nexus Trace Examples 2.3 Troubleshooting 4 4 4 4 7 11 3 Coverage 12 4 Profiler 12 iSYSTEM, May 2015 1/12 1 Introduction This document covers Freescale MPC5xxx and ST SPC56 microcontrollers featuring Nexus Class 2+ interface. Refer to microcontroller reference manual to identify Nexus Class level of a particular or contact iSYSTEM technical support for this information. According to the Nexus standard, these devices contain multiple Nexus clients that communicate over a single IEEEE-ISTO 5001-2003 Nexus class 2(+) combined JTAG IEEEE 1149.1 auxiliary out interface. Combined, all of the Nexus clients are referred to as the Nexus development interface (NDI). Class 2+ Nexus allows for program and ownership trace of the microcontroller execution without access to the external data and address buses. NDI Functional Block Diagram The Nexus trace is based on messages and has its restrictions comparing to the in-circuit emulator where the complete CPU address, data and control bus is available to the emulator in order to implement exact and advanced trace features. Nexus trace supports: Program and ownership trace for the e200 core Program Trace Using a branch-trace mechanism, the program trace feature collects the information to trace program execution. For example, the branch-trace mechanism takes into account how many sequential instructions the processor has executed since the last taken branch or exception. Then the debugging tool can interpolate the instruction trace for sequential instructions from a local image of program memory contents. In this way, the debugging tool can reconstruct the full program flow. Self-modifying code cannot be traced due to this concept. Nexus trace implements internal FIFO buffer, which keeps the data in the pipe when the Nexus port bandwidth requirements are greater than capabilities. FIFO is heavily used when the application sequentially accesses data, which yields heavy trace port traffic through a narrow Nexus port. Note that only transmitted addresses (messages) contain relatively (time of message, not of execution) valid time stamp information. All CPU cycles being reconstructed by the debugger iSYSTEM, May 2015 2/12 relying on code image and inserted between the recorded addresses, do not contain valid time information. Any interpolation with the recorded addresses containing valid time stamp would be misleading for the user. Thereby, more frames displayed in the trace window contain the same time stamp value. Ownership Trace Ownership trace is based on ownership trace messaging (OTM). OTM facilitates ownership trace by providing visibility of which process ID or operating system task is activated. In practice, an operating system writes to the process ID register (PID0), which yields an ownership trace message for every write. Then it’s up to the data profiler to record these messages and display the task activities (task profiler). Nexus Class 2+ Trace Features (iC5000 & iTRACE GT): External trace buffer Program and OTM Trace for e200 core AUX inputs Profiler Execution Coverage iSYSTEM, May 2015 3/12 2 Nexus Trace Default winIDEA instance allows debugging and tracing the primary e200 core. In case of the second core, another winIDEA instance is open from the Debug/Core in order to debug and trace the 2nd e200 core. Analyzer window is open from the View menu. Refer to a separate document titled Analyzer User’s Manual for more details on general handling & configuring the analyzer window and its use. Only MPC5xxx Nexus L3+ specifics are explained in this document. A detailed and exhaustive explanation on how the Nexus trace works and the meaning and purpose of all Nexus options, which are found in the Nexus configuration dialogs within winIDEA, can be found in the individual Core Reference Manual. Identify the core inside of your microcontroller and then refer to the belonging Core Reference Manual, which can be typically found at and downloaded from the semiconductor vendor web site. Some information may also be found in the Microcontroller Reference Manual of a specific microcontroller. 2.1 e200 Nexus Trace Configuration 2.1.1 Record everything This configuration is used to record the contiguous program flow either from the application start or up to the moment when the application stops. The trace can start recording on the initial program start from the reset or after resuming the program from the breakpoint location. The trace records and displays program flow from the start until the trace buffer fulfills. This is the default mode when a new analyzer .trd file is created. Buffer Size This setting defines a maximum analyzer file size. The analyzer stops collecting Nexus trace information when this limit is exceeded. Note that this setting is not correlated to the physical trace buffer of the HW debug tool by any means. The actual analyzer physical buffer size is limited by the debug tool. For instance, if the debug tool is capable of recording 512KB of the Nexus trace information only, limiting analyzer file size to 1MB poses no restriction at all. However, if the user finds just a small portion of the analyzer record (e.g. 16kB) being of interest and requires a swift analyzer window handling, it makes sense limiting the analyzer files size to 16kB. In this case, just a belonging portion of the complete analyzer physical buffer is required and used. 2.1.2 Trace Trigger This trace operation mode is used, when it’s required to trace the application around a particular event or when only some parts of program or data have to be recorded. Create a new Trace Trigger in the Analyzer window. Trigger Note: There is a single Trigger dialog which covers all different devices, which also feature different set of on-chip debug resources. Based on the selected CPU, only supported settings in the dialog are enabled and others are disabled. The same on-chip debug resources are shared among e200 hardware execution iSYSTEM, May 2015 4/12 breakpoints, e200 access breakpoints and e200 on-chip trace trigger. Consequentially, debug resources used by one debug functionality are not available for the other two debug functionalities. In practice this would mean that no trace trigger can be set for instance on instruction address, when four execution breakpoints are set already. Trigger Trace can trigger immediately after the trace is started or can trigger on one or more watchpoints (debug events), which occur while the target application is running. Trigger watchpoints can be IAC1-IAC3, DAC1-DAC2, CNT1-CNT2 and are described next. Instruction Four watchpoints (IAC1-IAC4) can be configured to trigger on executed instruction address (program counter match). Four address matches, two address in/out range matches or two address matches where address can be additionally masked, can be configured. Trace Trigger Configuration dialog- Trigger tab Data Two watchpoints (DAC1, DAC2) can be configured to trigger on accessed data address. Besides the access type, two address matches, one data address in/out range match or one address match where address can be additionally masked, can be configured. In case of MPC56xx derivatives, data address can be also combined with the data value while the data value comparison is not available for the MPC551x devices. iSYSTEM, May 2015 5/12 When ‘Link to’ option is checked, configured data access is further conditional on instruction defined by IAC1/IAC3 watchpoint. In practice, the user can restrict trigger on data access caused by an explicit instruction. Note: Data accesses are not visible since Nexus class L2+ doesn’t implement data trace. Program Trace Program trace is enabled by default. Most often setting for the Start is ‘immediately’ and for the ‘End’ is ‘never’. However, user can select any of the previously described watchpoints to act as Start or End condition on match. There are two types of messages, which can be used for the Nexus program trace protocol. ‘Individual Branch Messages’ yield more information about program execution than the ‘Branch History Messages’ setting. Major advantage of the ‘Individual Branch Messages’ setting is more accurate time information but it requires more Nexus port bandwidth, which means that the Nexus trace is more subject to the overflows, which are depicted in the trace window when they occur. In case of overflows, program reconstruction in the trace window resumes with next valid Nexus trace message. OTM Trace Enable OTM check box, when 8-bit writes to the process ID register should be recorded. Generate periodic OTM Periodically, once every 256 messages, the most recent state of the PID0 register is messaged out when this option is checked. Watchpoints Per default all watchpoints are generated and recorded. If there are custom requirements, the user can configure either ‘no watchpoints are generated’ or selects specific watchpoints to be generated and recorded. DQM Trace Data acquisition trace provides a convenient and flexible mechanism for the debugger to observe the architectural state of the core through software instrumentation. iSYSTEM, May 2015 6/12 For DQM, a dedicated 32-bit SPR has been allocated (DDAM). It is expected that the general case is to instrument the software and use mtspr operations to generate Data Acquisition Messages. Nexus FIFO Control Stall CPU When this option is checked, the program execution is stalled before Nexus overruns. 2.2 Nexus Trace Examples Following examples show some of the capabilities of the Nexus trace port. Select ‘Nexus’ in the ‘Hardware/Analyzer Setup’ dialog. Default trace configuration is used to record the continuous program flow either from the program start on or up to the moment, when the program stops. The trace can start recording on the initial program start from the reset or after resuming the program from the breakpoint location. The trace records and displays program flow from the start until the trace buffer fulfills. As an alternative, the trace can stop recording on a program stop. ‘Continuous mode’ allows roll over of the trace buffer, which results in the trace recording up to the moment when the application stops. In practice, the trace displays the program flow just before the program stops, for instance, due to a breakpoint hit or due to a stop debug command issued by the user. Example: The application behavior needs to be analyzed without any intrusion on the CPU execution. The trace should display program execution just before the CPU is stopped by debug stop command. Use ‘Record everything’ operation type in the ‘Analyzer’ window and make sure that ‘Continuous mode’ is configured to ensure that the trace buffer rolls over while recording the running program. The trace will stop as soon as the CPU is stopped. Note that this ‘Record everything’ operation type always apply for the e200 trace. Define reasonable buffer size depending on the required depth of the trace record. Have in mind that a smaller buffer uploads faster. You can start with e.g. 128kB. iSYSTEM, May 2015 7/12 With these settings, the trace records program execution as long as it’s running. As soon as the program is stopped, the trace stops recording and displays the results. Following examples describe configuring trace to trigger on a specific function being executed or to record specific variable data accesses. The ‘On trigger break execution’ option in the ‘Trace Configuration’ dialog should be checked when it’s required to stop the program on a trigger event. Example: Trace triggers on Type_Struct function call. Create new Trace Trigger in the Analyzer window. Trigger configuration dialog Due to the relatively complex Trigger configuration dialog, it is recommended to use the Wizard, which is open by pressing the ‘Wizard…’ button in the left bottom corner. In first step, select ‘Simple Event’ for the Select Trigger Scenario. iSYSTEM, May 2015 8/12 In second step, select ‘Execution of Code’ for the Select Event. In the third step, specify Code Address. In the next step, keep the default setting ‘All - Program Flow’. iSYSTEM, May 2015 9/12 In the final step press Finish. The trace is configured. The user can also change the size of working trace buffer and the trigger position in the Trigger configuration dialog. Run the application and start the trace. After the trace triggers, the results are uploaded and displayed. Let’s inspect the results. Trigger point can be found around frame 0 and marked as ‘Watchpoint’ in the Content bus. iSYSTEM, May 2015 10/12 2.3 Troubleshooting Missing program code If a “missing program code” message is displayed in the trace, it means that the program was executed at addresses where no code image is available in the download file. The debugger needs complete code image for the correct trace reconstruction! The code not reported in the download file or a self-modifying code cannot be traced. In order to analyze which code is missing in the trace, click on the last valid trace frame before the “missing program code” message. This will point to the belonging program point in the source or disassembly window. Set a breakpoint there, run the program until the breakpoint is hit and then step the program (F11) from that point on to see where the program goes. Trigger position With Nexus trace, which is a message based trace, actual trigger point (frame 0) is most likely not to be displayed next to the instruction which generated the trigger event. The Nexus trace port broadcasts only addresses of non-sequential branch jumps. All the sequential code in between is reconstructed by the debugger based on the code image available from the download file. There is no exact information to which of the inserted (reconstructed) sequential instructions the trigger event belongs. Nexus trace port broadcasts a dedicated trace trigger message beside the non-sequential branch messages. For example, if there are 30 sequential instructions between the two non/sequential jumps and there was a trigger event in between, trace will always depict the trigger at the same position regardless which one of the 30 instructions generated the trigger event. That's why you probably see the misalignment between the trigger event and the belonging code. MPC563xM There is an errata related to the Nexus port on MPC563xM devices. Slew rate on Nexus pins remains slow when Nexus is enabled. Use below initialization sequence to change the slew rate of Nexus pins. See Initialization Sequence help topic for more details on initialization sequence configuration and use. S 0xC3F901F6 W 0x000C S 0xC3F901F8 W 0x000C S 0xC3F901FA W 0x000C S 0xC3F901FC W 0x000C S 0xC3F901FE W 0x000C S 0xC3F90200 W 0x000C S 0xC3F90202 W 0x000C iSYSTEM, May 2015 11/12 S 0xC3F90206 W 0x000C S 0xC3F90208 W 0x000C Check the errata document for your target device to see if this issue is still applicable. 3 Coverage Refer to winIDEA Contents Help, Coverage Concepts section for Coverage theory and background. Refer to winIDEA Contents Help, Analyzer Window section (or alternatively to the standalone Analyzer.pdf document) for information on Coverage user interface and use. 4 Profiler Refer to winIDEA Contents Help, Profiler Concepts section for Profiler theory and background. Refer to winIDEA Contents Help, Analyzer Window section (or alternatively to the standalone Analyzer.pdf document) for information on Profiler user interface and use. Disclaimer: iSYSTEM assumes no responsibility for any errors which may appear in this document, reserves the right to change devices or specifications detailed herein at any time without notice, and does not make any commitment to update the information herein. iSYSTEM. All rights reserved. iSYSTEM, May 2015 12/12