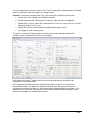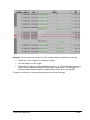
1
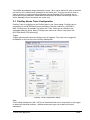
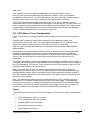
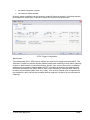
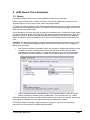
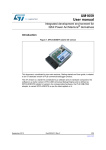
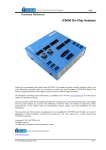
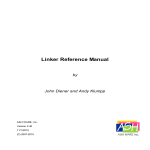
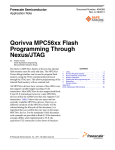
_ V9.12. 225 Technical Notes Freescale MPC5xxx & ST SPC56 Nexus Class 3+ Contents Contents 1 1 Introduction 2 2 Nexus Trace Configuration 2.1 e200 Nexus Trace Configuration 2.1.1 Record everything 2.1.2 Trace Trigger 2.2 eDMA Nexus Trace Configuration 2.3 FlexRay Nexus Trace Configuration 2.4 eTPU Nexus Trace Configuration 4 4 4 4 9 10 11 3 e200 Nexus Trace Examples 3.1 Nexus 3.2 Nexus RTR 3.3 Troubleshooting 14 14 18 18 4 Coverage 19 5 Profiler 19 iSYSTEM, May 2015 1/20 1 Introduction This document covers Freescale MPC5xxx and ST SPC56 microcontrollers featuring Nexus Class 3+ interface. Refer to microcontroller reference manual to identify Nexus Class level of a particular microcontroller or contact iSYSTEM technical support for this information. According to the Nexus standard, these devices contain multiple Nexus clients that communicate over a single IEEEE-ISTO 5001-2003 Nexus class 3(+) combined JTAG IEEEE 1149.1 auxiliary out interface. Combined, all of the Nexus clients are referred to as the Nexus development interface (NDI). Class 3+ Nexus allows for program, data and ownership trace of the microcontroller execution without access to the external data and address buses. Communication to the NDI is handled via the auxiliary port and the JTAG port. The Nexus trace is based on messages and has its limitations comparing to the in-circuit emulator where the complete CPU address, data and control bus is available to the emulator in order to implement exact and advanced trace features. Due to the limited debug features of the Nexus trace, iSYSTEM has introduced a proprietary Nexus Real-Time Reconstruction (Nexus RTR), which restores the original e200 core execution bus, which is otherwise embedded deeply in the CPU silicon, in the development system. With this technology, advanced trace functions, extended profiler and infinite realtime execution coverage become available. Nexus trace supports: program, data and ownership trace for the e200 core program, data and ownership trace for the eTPU (on CPUs where it’s available) tracing data accesses for the eDMA module (on CPUs where it’s available) tracing data accesses for the FlexRay (on CPUs where it’s available) Program Trace Using a branch-trace mechanism, the program trace feature collects the information to trace program execution. For example, the branch-trace mechanism takes into account how many sequential instructions the processor has executed since the last taken branch or exception. Then the debugging tool can interpolate the instruction trace for sequential instructions from a local image of program memory contents. In this way, the debugging tool can reconstruct the full program flow. Self modifying code cannot be traced due to this concept. Nexus trace implements internal FIFO buffer, which keeps the data in the pipe when the Nexus port bandwidth requirements are greater than capabilities. FIFO is heavily used when the application sequentially accesses data, which yields heavy trace port traffic through a narrow Nexus port. Note that only transmitted addresses (messages) contain relatively (time of message, not of execution) valid time stamp information. All CPU cycles being reconstructed by the debugger relying on code image and inserted between the recorded addresses, do not contain valid time information. Any interpolation with the recorded addresses containing valid time stamp would be misleading for the user. Thereby, more frames displayed in the trace window contain the same time stamp value. Data Trace Data trace is used to track real-time data accesses to device specific internal peripheral and memory locations by specifying a start and stop address with read or write access (the MPC55xx supports two such qualifier areas). iSYSTEM, May 2015 2/20 Transmitted information about the memory access cannot be compressed fundamentally since each memory access is distinctive and not predictable. Errors in the trace window appear when the CPU executes too many data accesses in a short period. These yield numerous Nexus messages, which cannot be sent out through the narrow Nexus port to the external development system on time and an internal data message FIFO overflow is reported in the trace window. Consequentially, it’s highly recommended to configure on-chip message control (qualifier) to restrict data trace recording only to data areas of interest to minimize possible overflows. Program and data trace messages are not ordered in time. Since the data trace has precedence over the program trace, a number of data messages is recorded before the actual instruction (block of instructions between two branches, or sync) is recorded that caused the data accesses. No reordering is done by the debugger since it would be highly speculative and cannot be guaranteed to be valid, unless the messages would contain a time-stamp. Unfortunately, this is not realized in the MPC5500 Nexus implementation. Ownership Trace Ownership trace is based on ownership trace messaging (OTM). OTM facilitates ownership trace by providing visibility of which process ID or operating system task is activated. In practice, an operating system writes to the process ID register (PID0), which yields an ownership trace message for every write. Then it’s up to the data profiler to record these messages and display the task activities (task profiler). Nexus Class 3+ Trace Features (iC5000 & iTRACE GT): External trace buffer Program, Data and OTM Trace for e200 core Program, Data and OTM Trace for eTPU1 and eTPU2 Data trace for eDMA Data trace for FlexRay (MPC5567) Advanced external trigger and qualifier Time Stamps AUX inputs Profiler Execution Coverage iSYSTEM, May 2015 3/20 2 Nexus Trace Configuration Default winIDEA instance allows debugging and tracing the primary e200 core. In case of a second core, another winIDEA instance is open from the Debug/Core in order to debug and trace the 2nd e200 core. Analyzer window is open from the View menu. Refer to a separate document titled Analyzer User’s Manual for more details on general handling & configuring the analyzer window and its use. Only MPC5xxx Nexus L3+ specifics are explained in this document. A detailed and exhaustive explanation on how the Nexus trace works and the meaning and purpose of all Nexus options, which are found in the Nexus configuration dialogs within winIDEA, can be found in the individual Core Reference Manual. Identify the core inside of your microcontroller and then refer to the belonging Core Reference Manual, which can be typically found at and downloaded from the semiconductor vendor web site. Some information may also be found in the Microcontroller Reference Manual of a specific microcontroller. 2.1 e200 Nexus Trace Configuration 2.1.1 Record everything This configuration is used to record the contiguous program flow either from the application start or up to the moment when the application stops. The trace can start recording on the initial program start from the reset or after resuming the program from the breakpoint location. The trace records and displays program flow from the start until the trace buffer fulfills. This is the default mode when a new analyzer .trd file is created. Buffer Size This setting defines a maximum analyzer file size. The analyzer stops collecting Nexus trace information when this limit is exceeded. Note that this setting is not correlated to the physical trace buffer of the HW debug tool by any means. The actual analyzer physical buffer size is limited by the debug tool. For instance, if the debug tool is capable of recording 512KB of the Nexus trace information only, limiting analyzer file size to 1MB poses no restriction at all. However, if the user finds just a small portion of the analyzer record (e.g. 16kB) being of interest and requires a swift analyzer window handling, it makes sense limiting the analyzer files size to 16kB. In this case, just a belonging portion of the complete analyzer physical buffer is required and used. 2.1.2 Trace Trigger This trace operation mode is used, when it’s required to trace the application around a particular event or when only some parts of program or data have to be recorded. Create a new Trace Trigger in the Analyzer window. Trigger Note: There is a single Trigger dialog which covers all different devices, which also feature different set of on-chip debug resources. Based on the selected CPU, only supported settings in the dialog are enabled and others are disabled. The same on-chip debug resources are shared among e200 hardware execution iSYSTEM, May 2015 4/20 breakpoints, e200 access breakpoints and e200 on-chip trace trigger. Consequentially, debug resources used by one debug functionality are not available for the other two debug functionalities. In practice this would mean that no trace trigger can be set for instance on instruction address, when four execution breakpoints are set already. Trigger Trace can trigger immediately after the trace is started or can trigger on one or more watchpoints (debug events), which occur while the target application is running. Trigger watchpoints can be IAC1-IAC8, DAC1-DAC2, CNT1-CNT2 and are described next. Instruction Up to 8 watchpoints (IAC1-IAC8) can be configured to trigger on executed instruction address (program counter match). Eight address matches, four address in/out range matches or four address matches where address can be additionally masked, can be configured. Devices based on e200z4 and e200z7 cores feature eight instruction watchpoints (IAC1IAC8) while majority of devices feature four instruction watchpoints (IAC1-IAC4). Data Two watchpoints (DAC1, DAC2) can be configured to trigger on accessed data address. Besides the access type, two address matches, one data address in/out range match or one address match where address can be additionally masked, can be configured. When ‘Link to’ option is checked, configured data access is further conditional on instruction defined by IAC1/IAC3 watchpoint. In practice, the user can restrict trigger on data access caused by an explicit instruction. Trigger tab in the Trace Trigger Configuration dialog Counter Debug module features two 16-bit counters CNT1 and CNT2 which can be configured to operate independently or can be concatenated into a single 32-bit counter. Each counter can iSYSTEM, May 2015 5/20 be configured to count down when one or more count-enabled events occur (IAC1-IAC4, DAC1-DAC2). When the count value reaches zero, a debug event is generated. First counter (CNT1) can have additionally a start condition which can be IAC1, IAC3, DAC1 or CNT2 event. Disable Events Messages generated by certain events (Debug Mode, Low Power Mode, Trace Disable, New PID, Branch and Link, TLBWE, TLBIVAX, VLE Entry, VLE Exit) can be disabled in order to minimize total amount of generated Nexus messages. Note: These options are available o e200z4 and e200z7 cores and per default they are unchecked. The on-chip Nexus module has a limited amount of nexus messages, which can be broadcasted over the Nexus port in certain time frame without a loss of Nexus information. An overrun Nexus message is reported when the maximum bandwidth is exceeded. Refer to the belonging Core Reference Manual for more details on these options. Program Trace Program trace is enabled by default. Most often setting for the Start is ‘immediately’ and for the ‘End’ is ‘never’. However, user can select any of the previously described watchpoints to act as Start or End condition on match. There are two types of messages, which can be used for the Nexus program trace protocol. ‘Individual Branch Messages’ yield more information about program execution than the ‘Branch History Messages’ setting. Major advantage of the ‘Individual Branch Messages’ setting is more accurate time information but it requires more Nexus port bandwidth, which means that the Nexus trace is more subject to the overflows, which are depicted in the trace window when they occur. In case of overflows, program reconstruction in the trace window resumes with next valid Nexus trace message. Data Trace Enable data trace when it’s required to record data accesses besides the program. Default setting for the Start is ‘immediately’ and for the ‘End’ is ‘never’. However, mind that the trace may start displaying errors due to the data trace enabled. Depending on the application, Nexus trace can output a huge amount of access addresses and access data which in worst case yield internal data message FIFO overflows due to a limited Nexus port bandwidth. Then also program path reconstruction fails. To stay away from the possible overflows, the user should use watchpoints, which can be used as data trace Start or End condition on match and/or Message Control, which allows defining two data windows. This minimizes the number of data messages to be sent through the Nexus port. Message Control 1-4 define four independent data address ranges. Valid condition can be either address in range or outside of range. Nexus trace can record Instruction access data and Data access data (default). Tracing can be further restricted to Read/Write, Read or Write accesses only. Note: Devices based on e200z4 and e200z7 cores feature four Message Controls (1-4) while majority of devices feature two Message Controls (1-2) OTM Trace Enable OTM check box, when 8-bit writes to the process ID register should be recorded. iSYSTEM, May 2015 6/20 Generate periodic OTM Periodically, once every 256 messages, the most recent state of the PID0 register is messaged out when this option is checked. Watchpoints Per default all watchpoints are generated and recorded. If there are custom requirements, the user can configure either ‘no watchpoints are generated’ or selects specific watchpoints to be generated and recorded. DQM Trace Data acquisition trace provides a convenient and flexible mechanism for the debugger to observe the architectural state of the core through software instrumentation. For DQM, a dedicated 32-bit SPR has been allocated (DDAM). It is expected that the general case is to instrument the software and use mtspr operations to generate Data Acquisition Messages. Nexus FIFO Control The Overrun Control register (OVCR) controls the Nexus behavior as the message queue fills. The Nexus block may be programmed to: Allow the queue to overflow, drain the contents, queue an overrun error message and resume tracing. Stall the processor when the queue utilization reaches the selected threshold. Suppress selected message types when the queue utilization reaches the selected threshold By default, Nexus block is configured for the first type of operation (stalling & suppression disabled), where an overrun condition is possible but the program execution time is not affected by any means. Stall CPU In this mode, processor instruction issue is stalled when the queue utilization reaches the selected threshold. The processor is stalled long enough to drop one threshold level below the level which triggered the stall. ¼, ½, or ¾ Stall Threshold can be selected. Message Suppression In this mode, the message queue will disable selected messages types when the queue initialization reaches the selected threshold. This allows lower bandwidth tracing to continue (e.g. program trace) and possibly avoid an overrun condition. Once triggered, message suppression will remain in effect until queue utilization drops to the threshold below the level selected to trigger suppression. iSYSTEM, May 2015 7/20 Data Trace, Program Trace, OTM Trace, Watchpoint Trace and DQM Trace messages can be individually suppressed by checking the individual option. ¼, ½, or ¾ Suppress Threshold can be selected. iSYSTEM, May 2015 8/20 2.2 eDMA Nexus Trace Configuration eDMA trace is configured in the RAM Sniffer pane in the Trace dialog by choosing ‘DMA’ as the Crossbar Master.. Note: eDMA trace is not available on all microcontrollers. eDMA trace is available only when the ‘Nexus’ trace type is selected in the ‘Hardware/Analyzer Setup’ dialog. eDMA trace cannot be used in conjunction with iSYSTEM Nexus RTR technology. Trigger Trigger options specify how the eDMA trace is triggered. The trace can be triggered immediately or by one of the two eDMA watchpoints. Data Two eDMA watchpoints (WP1, WP2) can be defined and can be used either for the trigger or data trace start/end. Address and access type can be defined for each watchpoint. eDMA Trace Configuration dialog Data trace First, eDMA trace must be globally enabled by checking the ‘Enabled’ option. Next, the user must set the data trace start and end condition. Trace can be started immediately or by means of one of the watchpoints. The same goes for the trace stopping – the trace can be set to never stop or when one of the watchpoints is reached. iSYSTEM, May 2015 9/20 Two eDMA data address ranges (Message Control 1 & 2) can be defined in order to optimize the amount of the eDMA trace messages on the Nexus port. The user should use them in order to avoid or to keep at minimum possible internal message FIFO overflows due to limited Nexus port bandwidth. eDMA data accesses that fall within the Message Control 1 and/or Message Control 2 window, are output only. 2.3 FlexRay Nexus Trace Configuration FlexRay Trace is configured in the FlexRay pane in the Trace dialogr. FlexRay trace is supported only on MPC5500 devices featuring the FlexRay module (e.g. MPC5567). Note: FlexRay trace is available only when the ‘iTrace’ trace type is selected in the ‘Hardware/Analyzer Setup’ dialog. FlexRay trace cannot be used in conjunction with iSYSTEM Nexus RTR technology. Trigger Trigger options specify how the FlexRay trace is triggered. The trace can be triggered immediately or by one of the two FlexRay watchpoints. FlexRay Trace Configuration dialog Data Two FlexRay watchpoints (WP1, WP2) can be defined and can be used either for the trigger or data trace start/end condition. Address and access type can be defined for each watchpoint. iSYSTEM, May 2015 10/20 Data trace First, FlexRay trace must be globally enabled by checking the ‘Enabled’ option. Next, the user must set the data trace Start and End condition. Trace can be started immediately or by means of one of the watchpoints. The same goes for the trace stopping – the trace can be set to never stop or when one of the watchpoints is reached. Two FlexRay data address ranges (Message Control 1 & 2) can be defined in order to optimize the amount of the FlexRay trace messages on the Nexus port. The user should use them in order to avoid or to keep at minimum possible internal message FIFO overflows due to limited Nexus port bandwidth. Only FlexRay data accesses that fall within the Message Control 1 and/or Message Control 2 window are output only. 2.4 eTPU Nexus Trace Configuration eTPU Trace is based on messages and features program trace, data trace and ownership trace. Program trace is based on branch trace messaging, which displays program flow discontinuities (start, jump, return, etc.) allowing the development tool to interpolate what transpires between the discontinuities. Thus static code may be traced only. Data trace allows tracing reads and writes to selected shared parameter RAM (SPRAM) address ranges. Ownership trace provides visibility of which channel is being serviced. An ownership trace message is transmitted to indicate when a new channel service request is scheduled, allowing the development tools to trace task flow. A special OTM is sent when the engine enters in idle, meaning that all requests were serviced and no new requests are yet scheduled. The eTPU1 and eTPU2 module are debugged each in a separate winIDEA session. Refer to Freescale MPC5500 Family On-Chip Emulation technical notes document for more details on the eTPU debugging. eTPU Nexus Trace is open from View/Trace, assuming that the eTPU winIDEA debug session is set up and active. Both eTPU engines have their own Nexus register sets that allows trace to be set up independently for each of them. The only exception to this is the data trace address range registers that are shared. Refer to the Nexus Dual eTPU Development Interface chapter in the eTPU Reference Manual for more details on the eTPU trigger and qualifier settings and the eTPU trace in general. Note: The same on-chip debug resources are shared among eTPU hardware execution breakpoints, eTPU access breakpoints and eTPU on-chip trace trigger. Consequentially, debug resources used by one debug functionality are not available for the other two debug functionalities. In practice this would mean that no trace trigger can be set for instance on instruction address, when hardware execution breakpoints are set already, etc. Trigger Trigger options specify how the eTPU trace is triggered. The trace can trigger immediately or on: eTPU watchpoint 1 (WP1) occurrence eTPU watchpoint 2 (WP1) occurrence channel register write occurrence host service request occurrence on link register occurrence iSYSTEM, May 2015 11/20 on match recognition request on transition detect request All seven trigger conditions can be limited to a specific serviced channel. If serviced channel information is to be ignored, 0 should be written for the service channel mask. eTPU Trigger Configuration Watchpoints Two watchpoints (WP1, WP2) can be defined and used for the trigger and the qualifier. The 'Operation' combo box selects whether address and/or data matching is done and if matching is done on data fetches or instruction fetches. Access Type can be read, write or read/write. Address can be masked. Address Mask 0xFFFF considers all the bits in the address while 0x0 masks all address bits. When Data is used for the watchpoint, individual byte within 32bit value can be masked (Byte mask out). Lastly, 5-bit service channel must be specified for the watchpoint, which can be also masked (when a mask bit is 0 that bit is not compared for masking). iSYSTEM, May 2015 12/20 Qualifier eTPU Qualifier Configuration Qualifier should be used with sense in order to prevent or at least minimize the eTPU trace overflows on the Nexus port. Depending on the application and the eTPU trace settings, the on-chip eTPU trace module can generate more messages than it is capable to send out externally over the Nexus port without loss. In general, the user should strive after the settings, which generates minimum traffic on the Nexus port while still displaying the relevant information on eTPU activities. Program Trace By default, program trace is configured to trace all the program activity. However, the program trace information can be limited by defining start and end condition or by focusing program trace on one or more active eTPU channels only. See an explanation for the available Start and End events in the Trigger section. Data Trace Four data trace windows with programmable address ranges and access attributes are provided. Data trace windowing reduces the requirement on the Nexus port bandwidth by constraining the number of trace locations. The four trace window address ranges are shared among the dual engines and the eTPU coherent dual-parameter controller (CDC). Besides the four data trace windows, number of trace locations can be additionally limited through the data trace Start and End condition. Ownership Trace Check the option when ownership trace messages need to be traced. iSYSTEM, May 2015 13/20 3 e200 Nexus Trace Examples 3.1 Nexus Following examples show some of the capabilities of the Nexus trace port. Default trace configuration is used to record the continuous program flow either from the program start on or up to the moment, when the program stops. The trace can start recording on the initial program start from the reset or after resuming the program from the breakpoint location. The trace records and displays program flow from the start until the trace buffer fulfills. As an alternative, the trace can stop recording on a program stop. ‘Continuous mode’ allows roll over of the trace buffer, which results in the trace recording up to the moment when the application stops. In practice, the trace displays the program flow just before the program stops, for instance, due to a breakpoint hit or due to a stop debug command issued by the user. Example: The application behavior needs to be analyzed without any intrusion on the CPU execution. The trace should display program execution just before the CPU is stopped by debug stop command. Use ‘Record everything’ operation type in the ‘Analyzer’ window and make sure that ‘Continuous mode’ is configured to ensure that the trace buffer rolls over while recording the running program. The trace will stop as soon as the CPU is stopped. Note that this ‘Record everything’ operation type always apply for the e200 trace. Define reasonable buffer size depending on the required depth of the trace record. Have in mind that a smaller buffer uploads faster. You can start with e.g. 128kB. With these settings, the trace records program execution as long as it’s running. As soon as the program is stopped, the trace stops recording and displays the results. Following examples describe configuring trace to trigger on a specific function being executed or to record specific variable data accesses. iSYSTEM, May 2015 14/20 The ‘On trigger break execution’ option in the ‘Trace Configuration’ dialog should be checked when it’s required to stop the program on a trigger event. Example: Trace starts recording after Type_Struct function is called for the fifth time. Create new Trace Trigger in the Analyzer window. Enable Instruction IAC1 watchpoint and specify Type_Struct for the Address. Enable CNT1 counter, select IAC1 watchpoint for ‘Count on’ event, set 5 for ‘Counter’ and keep ‘Start on’ set to ‘Any’. Enable Data Trace and keep default configured Message Control 1 Set Trigger on CNT1 debug event. The trace is configured. Following picture depicts current trace settings. Initialize the complete system, start the trace and run the program. Let’s inspect the results. Trigger point can be found around frame 0 and marked as ‘Watchpoint’ in the Content bus. Don’t forget that recorded instruction and belonging data access are not recorded in expected time order. This applies for all data access records. Belonging instruction is recorded and visible much later (e.g. 25 frames) after the data access was recorded. . This happens due to the Nexus concept, which immediately broadcasts data messages, while instruction messages are usually sent in blocks. iSYSTEM, May 2015 15/20 Example: Trace monitors the value of iCounter variable while the application is running. Create new Trace Trigger in the Analyzer window. Set ‘Immediately’ for the Trigger Enable Data Trace and configure Message Control 1 for iCounter data accesses only. Select iCounter address and check ‘Entire Object’ range option. The debugger will determine and configure range end address based on the size of the variable. The trace is configured. Following picture depicts current trace settings. iSYSTEM, May 2015 16/20 Initialize the complete system, start the trace and run the program. The trace records all writes to iCounter variable. Time difference between two consecutive data write accesses can be measured using markers. In this particular case, the time difference is 110,988 us. iSYSTEM, May 2015 17/20 3.2 Nexus RTR iTRACE GT development system offers some advanced trace features, which are based on iSYSTEM Nexus RTR technology. Nexus RTR is restricted to the e200 program execution bus and default Power ISA instruction set (e.g. MPC555x). VLE instruction set is not supported, which means none of the Freescale MPC56xx or ST SPC56 devices are supported. 3-Level Trigger Unlimited Qualifier Watchdog Trigger Duration Tracker ‘RTR Execution’ must be selected in the Hardware/Analyzer Setup dialog to use these extra features. Note: Nexus RTR is available on iTRACE GT only for 12-bit MDO (Nexus port) implementation only. The RTR technology is not available on iTRACE PRO, iC5000 or ActiveGT PODs. For more information on these trace functionalities and use refer to winIDEA Contents Help describing Bus Trace in details. 3.3 Troubleshooting Missing program code If a “missing program code” message is displayed in the trace, it means that the program was executed at addresses where no code image is available in the download file. The debugger needs complete code image for the correct trace reconstruction! The code not reported in the download file or a self modifying code cannot be traced. In order to iSYSTEM, May 2015 18/20 analyze which code is missing in the trace, click on the last valid trace frame before the “missing program code” message. This will point to the belonging program point in the source or disassembly window. Set a breakpoint there, run the program until the breakpoint is hit and then step the program (F11) from that point on to see where the program goes. Trigger position With Nexus trace, which is a message based trace, actual trigger point (frame 0) is most likely not to be displayed next to the instruction which generated the trigger event. The Nexus trace port broadcasts only addresses of non-sequential branch jumps. All the sequential code in between is reconstructed by the debugger based on the code image available from the download file. There is no exact information to which of the inserted (reconstructed) sequential instructions the trigger event belongs. Nexus trace port broadcasts a dedicated trace trigger message beside the non-sequential branch messages. For example, if there are 30 sequential instructions between the two non/sequential jumps and there was a trigger event in between, trace will always depict the trigger at the same position regardless which one of the 30 instructions generated the trigger event. That's why you probably see the misalignment between the trigger event and the belonging code. 4 Coverage Refer to winIDEA Contents Help, Coverage Concepts section for Coverage theory and background. Refer to winIDEA Contents Help, Analyzer Window section (or alternatively to the standalone Analyzer.pdf document) for information on Coverage user interface and use. 5 Profiler Refer to winIDEA Contents Help, Profiler Concepts section for Profiler theory and background. Refer to winIDEA Contents Help, Analyzer Window section (or alternatively to the standalone Analyzer.pdf document) for information on Profiler user interface and use. iSYSTEM, May 2015 19/20 Disclaimer: iSYSTEM assumes no responsibility for any errors which may appear in this document, reserves the right to change devices or specifications detailed herein at any time without notice, and does not make any commitment to update the information herein. iSYSTEM. All rights reserved. iSYSTEM, May 2015 20/20