1
_
RELEASE NOTES
winIDEA 2011 9.11
9.11.2 (14.1.2011)
winIDEA
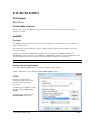
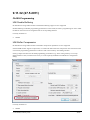
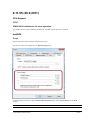
Facelift
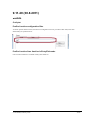
The docking and toolbar elements introduce a new flatter design, bringing a fresh look to winIDEA.
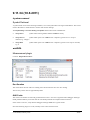
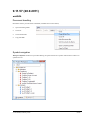
Help
Hardware Technical notes are now accessible via global Help
menu.
The applicable documents are linked according to current
configuration.
iSYSTEM, February 2012
1/85
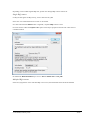
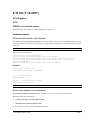
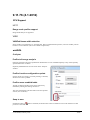
GCC ARM double Type support
GCC compiler generates two different binary footprints of double type variables when targeting little endian
platform. Because of legacy library issues, the swapped(FPA) format is usually used by the application, instead
of the straight (VFP) which is used by all other commercial compilers.
To support both implementations a configuration option is intrduced.
Location: Debug/Files for Download/Properties/Advanced/GCC ARM double format
Default: Swapped (FPA)
iSYSTEM, February 2012
2/85
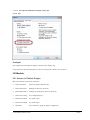
CPU Support
MPC 5xxx
Shadow Memory Programming
Shadow memory programming is released to all derivatives, however the user is warned to possible side effects:
TriCore 1.6
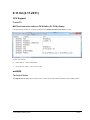
Hardware Breakpoint Support
Compared to TriCore 1.3.x TriCore 1.6 changes the on-chip breakpoint module operation.
EXEVT, CREVT and SWEVT allow CNT toggle action
These events are accessible from Hardware/Emulation Options/CPU/Setup/Events dialog
iSYSTEM, February 2012
3/85
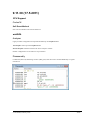
Hardware Breakpoints
TriCore 1.6 uses 8 execution/access breakpoint resources. The TriCore 1.3 Memory Protection Module is no
longer used.
The breakpoints are accessible from Debug/Hardware Breakpoints dialog.
iSYSTEM, February 2012
4/85
9.11.3 (24.1.2011)
isystem.connect
OCD Register Access
On-chip debug registers on some CPUs are accessible only via on-chip debug protocol (JTAG, SDI,…).
Access to such registers is provided on per OCD architecture basis via isystem.connect SERVICE_OCD_Access
service.
Since OCD registers can be of arbitrary size, the access is provided as a BYTE vector with little-endian ordering
(the first BYTE will be scanned in first, starting with bit 0).
Python code example:
import isystem.connect as ic
cmgr = ic.ConnectionMgr()
cmgr.connectMRU('')
dataCtrl = ic.CDataController(cmgr)
wrData = ic.VectorBYTE([0x12, 0x34, 0x56, 0x79])
dataCtrl.writeOCDRegister(0x20, 32, wrData)
rdData = ic.VectorBYTE()
dataCtrl.readOCDRegister(0x20, 32, rdData)
for byte in rdData:
print hex(byte),
iSYSTEM, February 2012
5/85
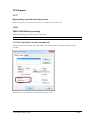
CPU Support
External Watchdog Service
Periodic watchdog service can handle the watchdog depending on CPU state.
Location: Hardware/Emulation Options/CPU/CPU Setup/External WDT
Default: OFF
Note: watchdog service is currently available only on ARM architecture.
iSYSTEM, February 2012
6/85
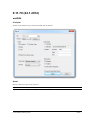
TriCore 1.6
Hardware Breakpoints
Event configuration is available with every breakpoint resource.
The breakpoints are accessible from Debug/Hardware Breakpoints dialog.
iSYSTEM, February 2012
7/85
Execution Coverage
If four ranges or less are configured for execution coverage, the on-chip trigger/buffer system is configured to
record execution from those ranges only.
This increases the recording time period.
iSYSTEM, February 2012
8/85
9.11.4 (26.1.2011)
isystem.connect
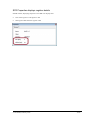
Option Display
Options accessible via isystem.connect which are stored inside documents can be accessed using relative paths.
The Help/Display Option dialog always showed full path, which could yield a very long URL.
winIDEA
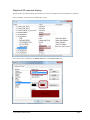
Help
Direct access to installed SDK help is provided from the Help menu.
SDK documentation is provided in HTML format. Selecting an item opens the default HTML browser.
iSYSTEM, February 2012
9/85
9.11.8 (11.2.2011)
winIDEA
Disassembly Window
Listing from beginning of code range (e.g. start of current function)
Context menu provides list commands:
List Function - available when inside a function body. List from function start and beyond function end are
provided
List Label – available when outside function body. Lists from first preceding code label and first subsequent
code label are provided.
List History
Points before and after List command are memorized. Reversing the path is possible using the Backspace key.
iSYSTEM, February 2012
10/85
9.11.12 (24.2.2011)
isystem.connect
Download symbols only functionality is available via IConnectDebug::RunControl(rDownloadNoCode) call.
CPU Support
MPC 5xxx
MPC560x Shadow Memory Programming
Flash mass erase erases also user area in shadow block.
iSYSTEM, February 2012
11/85
9.11.14 (8.3.2011)
CPU Support
MPC 5xxx
Low Power Debug
Transition into low-power state and
return to normal power is supported
on
MPC551x
MPC560x
Low power handling is enabled
optionally as not all CPU masks
implement debugger support
internally.
If such a CPU is used with this
option enabled, emulation will not
start.
Location: Hardware/Emulation
Options/CPU/CPU
Setup/MPC5xxx
Default: OFF
ARM
iMX25 Support
iMX25 Debug and ETB trace is supported.
Initialization after Download
Initialization after download can be optionally performed also on CPU Reset command.
Location: Hardware/Emulation Options/Initialization After Download
Default: ON
iSYSTEM, February 2012
12/85
winIDEA
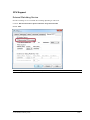
Profiler Range Mode
Range mode is a stateless analysis method and is
not susceptible to:
weak debug information
compiler optimizations
RTOS stack manipulations
Execution profiling under RTOS is possible even if
task switches are not traceable.
Refer to ProfilerConcepts.pdf for further
information.
Note: Range mode is currently supported only on
MPC e200 architecture.
iSYSTEM, February 2012
13/85
9.11.17 (15.3.2011)
CPU Support
MPC 5xxx
Low Power Debug
When CPU exits low power state,
the emulator stops it and
reinitializes the on-chip debug
module. This ensures that
breakpoints and trace do not miss
any code execution.
After the OCD initialization the
CPU remains stopped. If the CPU
should resume running, check the
Run after exiting low power state
option.
Location: Hardware/Emulation
Options/CPU/CPU
Setup/MPC5xxx
Default: OFF
ARM
Cortex M4 Core
Support
Cortex M4 core debug is supported.
winIDEA
Watch Window
Display format for expanded elements of aggregate types (arrays, structures) is configurable. The format is
selected via context menu on the specific element.
Variables Window
Display format of local variables is configurable. The format is selectable via context menu on the local variable.
iSYSTEM, February 2012
14/85
9.11.19 (18.3.2011)
CPU Support
MPC 5xxx
Low Power Debug
When CPU is about to enter low
power mode, the emulator can stop
it. This allows review of the
application context. The CPU
status indicates that the CPU is
stopped before entering low power
mode.
When the user subsequently runs
the CPU, it will enter low power
state.
Location: Hardware/Emulation
Options/CPU/CPU
Setup/MPC5xxx
Default: OFF
winIDEA
Profiler
Configuration of OS object profiling is now independent of data profiling configuration.
iSYSTEM, February 2012
15/85
Changes in operation
Earlier winIDEA versions:
Task ID object was profiled if
Data and Include OS objects were selected, or
Function was selected and an operating system was configured in the OS Setup…
Other OS objects were profiled if
Data and Include OS objects were selected
Since 9.11.18:
Task ID object and other OS objects are profiled if
OS objects is selected
iSYSTEM, February 2012
16/85
9.11.22 (4.4.2011)
CPU Support
HC12
MM912G634
MM912H634
ARM
Freescale Kinetis family
winIDEA
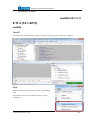
ISL to Python converter
iSYSTEM Script Language is deprecated. To provide an easy
upgrade to Python, winIDEA can convert an existing ISL script
to a Python script.
If an ISL file is open in winIDEA editor, a Convert To Python
command is provided in the context menu.
After conversion the Python file is opened in winIDEA.
iSYSTEM, February 2012
17/85
9.11.24 (13.4.2011)
CPU Support
PowerPC
Bolero3M family ActiveGT POD.
MPC e300 (MPC83xx, MobileGT) JTAG Burst+ download. Download speeds in range of 1MB/s.
winIDEA
Symbol Table Dump
winIDEA internal symbol table can be dumped to a text file. This
is used for diagnostic purposes when symbolic information is not
yielding results expected from the source code.
To dump the symbols:
Select the Symbols pane in the Workspace window
Right click the download file to be dumped
Select the file and information to dump
iSYSTEM, February 2012
18/85
9.11.26 (25.4.2011)
CPU Support
V850
Fx4-L FLASH support.
winIDEA
Parser
C++ reference variables can be modified
decltype operator can be used to extract type information from an object
function parameter or return value can be accessed via sizeof, typeof and decltype operators
Run Control
If the compiler generates debug information where multiple source line symbols are generated for the same
source line (e.g. for statements, multiple statements in one line), winIDEA can step over all these statements in a
single Source Step operation.
Location: Debug/Options /Symbols/Source step until a different line
Default: OFF
iSYSTEM, February 2012
19/85
9.11.27 (5.5.2011)
CPU Support
MPC 5xxx
Internal RAM initialization
Internal RAM initialization is required to program the internal FLASH and to perform unaligned access to RAM.
Initialization can be performed:
Never
Always
Automatically – in this case the initialization is performed if during download FLASH or internal RAM
must be written
Location: Hardware/Emulation Options/CPU/CPU Setup/MPC5xxx
Default: Automatically
iSYSTEM, February 2012
20/85
winIDEA
Elf/Dwarf
Some compilers generate 'hint' source line debug info, which can create several source line symbols for a single
actual source line. This can cause confusing results in trace and in coverage and can have impact on source code
debugging.
Per default such lines are discarded, but if necessary they can be loaded by clearing the Load only »beginning of
the statement« lines option.
Location: Debug/Files for download/Properties/Advanced
Default: ON
iSYSTEM, February 2012
21/85
9.11.28 (10.5.2011)
CPU Support
Sitel SCxxx
SC14443 MMU supported
SC14443 can remap virtual addresses to physical, loading into physical memory and display in memory
windows is provided.
winIDEA
Analyzer
The Analyzer window unifies Trace and Profiler analysis functionality. Both analyses can run in parallel on a
single recording session.
The configuration and recorded data is saved in a .trd file. trd files created by older winIDEA versions are
backward compatible.
In addition to existing View/Analyzer command shortcut, which opens the <workspace>.trd file, the
View/Profiler provides a shortcut to the <workspace>_profiler.trd file. This file is created automatically when
an older winIDEA workspace is opened and the legacy Profiler configuration is imported to it.
Note: A separate Analyzer.pdf user manual document is provided.
isystem.connect implications
The existing IConnectProfiler interface interfaces the active analyzer window.
Profiler configuration is now available via IConnectIDE::Option interface.
OSEK
IRQ Object definition allows
subtraction of IRQ context activity
from the task activity which it
interrupted.
An OSEK object is defined to be IRQ
object by setting its Object Type to
IRQ ID.
Per default, this is attributed to the
RUNNINGISR2 OSEK object.
iSYSTEM, February 2012
22/85
Depending on how OSEK signals IRQ state, profiler can manage IRQ context switches as:
Single IRQ context
Usually the OS signals no IRQ activity, with a value like NO_ISR.
In this case it is assumed that last active task is reactivated.
If a value other than this Default value is signaled, a separate IRQ context is used.
For such scenario enable the Default Value option in the Object properties and select the value which is
considered neutral.
Per default the RUNNINGISR2 object is set to have a default value of NO_ISR.
Multiple IRQ contexts
If the OS (re)signals the active task after IRQ was serviced, then the default value should be disabled.
iSYSTEM, February 2012
23/85
9.11.30 (17.5.2011)
CPU Support
Cortex M
SoC Reset Method
SoC reset is available on all Cortex M devices.
winIDEA
Analyzer
Legacy Profiler configuration is imported automaticaly into Profiler.trd file.
View/Profiler menu opens the Profiler.trd file.
IConnectProfiler interface interfaces the active analyzer window.
Profiler configuration is accessible via script interface.
Disassembly
Conditional (dark red) and change-of-flow (dark green) instructions are coloured differently to regular
instructions.
iSYSTEM, February 2012
24/85
9.11.31 (24.5.2011)
winIDEA
Analyzer
Zoom in/out using Ctrl + mouse wheel is implemented.
Editor
Default custom color syntax (additional keywords) for Assembler, C and C++ now use standard CCS syntax,
instead of just a list of keywords.
iSYSTEM, February 2012
25/85
9.11.32 (27.5.2011)
FLASH Programming
UMI Double Buffering
FLASH devices using UMI2 monitors with double buffering support are now supported.
Double buffering can double programming performance. In this mode, the CPU is programming one sector while
the data for the next sector is being delivered via on-chip debug interface.
Currently available on:
STM32
UMI Buffer Compression
FLASH devices using UMI2 monitors with buffer compression capabilities are now supported.
If the FLASH monitor supports compression, it is used when better than 60% compression can be achieved. This
can increase programming performance on devices with a slow memory write debug interface.
If using compression decreases FLASH programming performance (e.g. when writing memory via on-chip
debug interface is fast, but CPU itself is slow), it can be explicitly disabled in FLASH device configuration
dialog.
Currently available on:
STM32
iSYSTEM, February 2012
26/85
winIDEA
Build Manager
Build manager is disabled on workspace load, if project is not configured (no targets or no project files).
Symbol prefix removal
Prefix on symbol names can be optionally removed on these symbol classes:
Global Variables
Functions
Code Labels
Location: Debug/Options/Symbols
Default: disabled
iSYSTEM, February 2012
27/85
9.11.33 (2.6.2011)
winIDEA
Project / Symbols Window
The Symbols pane of the project window can show modules used in the download file, organized in folder
groups.
The Module Folders context menu allows selection of folder diplay:
None
- no folder hierarchy is shown
Name
- only folder names are shown
Relative path- folder relative path to workspace folder is shown
Absolute path- full folder path is shown
Context menu operations on module folder:
Explore
- opens system explorer on the selected folder
Context menu operations on module:
Goto Source - opens the module file in winIDEA editor
Open File Location – opens system explorer and selects the module file
iSYSTEM, February 2012
28/85
9.11.34 (10.6.2011)
isystem.connect
Symbol Retrieval
A symbol name can be retrieved using an address, even if the symbol does not begin at that address. This can be
used to determine to which function a certain code location belongs.
The ESymbolFlags to IConnectDebug::GetSymbol function have been extended with:
sScopeExact
sScopeNarrow
symbol which spans over aAddress. For composite types the narrow scope is
returned, e.g. A.B[3].C
sScopeWide
e.g. A
symbol whose starting address matches aAddress exactly
symbol which spans over aAddress. For composite types the wide scope is returned,
winIDEA
Measurement plugin
Location: Plugin/Measurement
Run Duration
This value shows the time CPU was running since the last time the user set it into running.
The accuracy of this value is approximately 20ms.
GND Faults
This value is the number of observed ground transient events. An event is registered when debugger and target
GND potentials differ by more than 250 mV. The GND potentials are sampled at 500ns intervals.
If this value is non zero, verify that the debugger and target GND have a good contact.
Note that switching target on or off, normally causes a few transient events.
iSYSTEM, February 2012
29/85
Display of char type arrays
Arrays of type char can be displayed in watch window as zero terminated
strings.
If the option is not checked, the string is displayed as a array of 8-bit
characters. Individual elements are displayed according to Character
display configuration in the same dialog.
Location: Debug/Options/Symbols
Default: ON
Expression override modifiers
The above global setting can be explicitly overriden for individual
watches with watch modifiers.
To force string interpretation, use the ,s modifier.
From context menu select: char[]
To force array interpretation, use the ,a modifier.
From context menu select: Display char[] as string
Example:
char sz[] = “Hello World”;
iSYSTEM, February 2012
30/85
Array offset and number of elements displayed
To allow viewing elements of large arrays, watch modifiers can be used to set the first displayed element and
number of displayed elements.
Format:
<watch expression>,a[<first element][.<number of elements>]
Example:
sz,a3
// display array elements starting from sz[3]
sz,a3.2 // display 2 array elements, starting at sz[3]
sz,a.2 // display first 2 array elements
This modifier can also be set by selecting Set array offset… from the
context menu.
iSYSTEM, February 2012
31/85
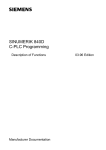
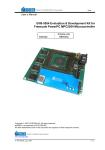
Graphical OS resource display
The OS window provides graphical representation of resource consumption (if such information is available).
In this screenshot stack usage for an OSEK OS is shown.
Note: the bar color is defined by the Background color of the OS/Text value item.
iSYSTEM, February 2012
32/85
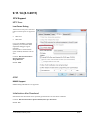
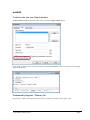
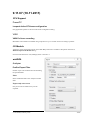
SFR Properties displays register details
In SFR window, displaying Properties of an SFR now displays also:
Size of the register or sub-register in bits
Sub-register offset from the register in bits
iSYSTEM, February 2012
33/85
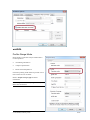
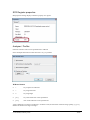
CPU Support
V850
Data FLASH contents save
Data FLASH contents with ID tags can be saved in NEC interleaved hex format.
The Base configuration specifies the offset to add to the addresses in the output file.
Location: Hardware/Tools/Data FLASH and EEPROM Emulation
iSYSTEM, February 2012
34/85
9.11.35 (17.6.2011)
CPU Support
CR16B
SC14443 MMU supported
SC14443 can remap virtual addresses to physical, loading into physical memory and display in memory
windows is provided.
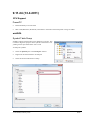
winIDEA
Editor block macros
A block comment interprets certain key combinations as a block modify operation.
All file types
TAB
indent selection
SHIFT+TAB
unindent selection
/
adds or removes double slash // comment
C
Python
#
adds or removes # comment
iSYSTEM, February 2012
35/85
9.11.36 (26.6.2011)
isystem.connect
CodeStore container
CodeStore is a container which can keep any amount of code. The purpose of the container is to keep track of all
e.g. all dowloaded code, all code in a single file, read-back code in a verification process etc.
The container consists of a collection of CodeStoreItems. Each item keeps address, size and data stored at that
address.
Operations:
Add, exclude and retrieve code
Compare two containers and create a difference container
Report contents to a file
Creation:
Return from one of the DataController functions
Explicitly
csEmpty = ic.CCodeStore(cmgr)
CodeStore operations
The isystem.connect DataController provides these operations:
csGetDownloaded
Returns a CodeStore with downloaded code (from a single or all files).
csReadMemory
Uses an existing CodeStore as reference and returns a new CodeStore with reference memory regions read.
csDif
Performs a difference operation between two CodeStores and creates a new CodeStore with the difference
information.
This Python example shows how a verify operation can be performed:
dataCtrl = ic.CDataController(cmgr)
memArea = 0
# get downloaded,
#
all files
#
include data
csDownloaded = dataCtrl.csGetDownloaded(memArea, '', True)
# read back the memory.
iSYSTEM, February 2012
36/85
#
Use csDownloaded as address reference
csRead = dataCtrl.csReadMemory(memArea, csDownloaded)
# create a dif
csDif = dataCtrl.csDif(csDownloaded, csRead)
# report differences,
#
don't append
#
use default report format
#
contiguous regions
#
references are csDownloaded and csRead
csDif.reportDif('VerifyReport.txt', False, '', 0, csDownloaded, csRead)
csVerifyDownloaded
This function performs all above steps in a single operation.
dataCtrl = ic.CDataController(cmgr)
memArea = 0
# verify and report
#
all files
#
write a report to VerifyReport.txt
dataCtrl.csVerifyDownloaded(memArea, '', 'VerifyReport.txt')
iSYSTEM, February 2012
37/85
winIDEA
Custom tools can use Output window
Tools/Customize/Tools configuration allows setting of the Use Output window option.
If this option is checked, the tool will start hidden and STDOUT/STDERR streams will be shown in the Output
window's Tools pane.
Disassembly Register / Memory list
Drag & drop a register from disassembly into memory window lists memory from register value.
iSYSTEM, February 2012
38/85
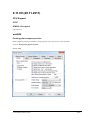
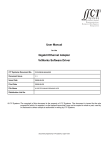
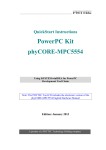
SFR Register properties
SFR properties dialog displays read/write property of a register.
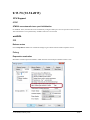
Analyzer / Profiler
Function execution areas can be specified with a wildcard.
In this example all functions which start with CAN_ are profiled.
Wildcard format
*
any sequence of characters
?
any single character
#
any single digit
[set]
any of the characters in the specified set
[!set]
none of the characters in the specified set
A set is defined as a sequence of characters. If a dash is used, all characters within the range qualify, e.g. [a-z]
defines all characters in range a though z.
iSYSTEM, February 2012
39/85
9.11.37 (4.7.2011)
CPU Support
ARM
OMAP4 OCD
Basic single core debug support.
PowerPC
xPC5643L Leopard Active GT POD
Full feature set.
PPC440EPx OCD
Full debug feature set.
iSYSTEM, February 2012
40/85
9.11.38 (8.7.2011)
Verified Build
V850
HCS12/S12X
MPC5xxx
ARM7/ARM9
ColdFire
CPU32
TMSx70
Cortex-M0/M1/M3/A8
78K
CR16
MPC56x
TriCore
XC2xxxx
STM8
HCS08
R8C
CoolRISC
CPU Support
ARM
AM3517 OCD
Basic single core debug support. Implemented as derivative of OMAP35xx.
HCS12
MC9S12VRx Tomar OCD
Full debug feature set.
iSYSTEM, February 2012
41/85
9.11.39 (9.7.2011)
CPU Support
V850
V850Fx4-L
Program and Data FLASH programming.
TriCore
PCP Channel Enable
If a channel is disabled, winidea can optionally enable R7.CEN bit before step/run.
ARM
TMS570 Reset initialization
nSRST is released for 500 microseconds before debug init to allow AJSM to unlock debug resources.
iSYSTEM, February 2012
42/85
9.11.40 (13.7.2011)
CPU Support
78k0R
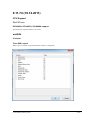
Data Profiler
When more than 2 data items are defined, trace is configured to the union of all items. This allows profiling of an
arbitrary number of data variables, but reduces the trace buffer depth.
iSYSTEM, February 2012
43/85
9.11.42 (21.7.2011)
CPU Support
PowerPC
Pictus 1M RAM Sniffer support
The two RAM Sniffer modules on the Pictus1M can be
used to trace memory accesses to the internal RAM.
VLE area auto configuration
VLE areas can be configured using current MMU configuration.
When CPU is stopped, the Configure using current CPU state button in the Debug/Files for Download/VLE
dialog can be used to configure VLE regions to all MMU TLBs currently configured for VLE code.
iSYSTEM, February 2012
44/85
winIDEA
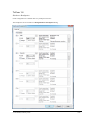
Customizable columns in Analyzer Profiler Statistics View
Any statistical aspect of the profiler session can be displayed as a column in the statistics view. Column selection
is available via
button or by right-clicking the header line (below the toolbar).
To sort the contents by a specific statistic criteria, click the respective column header.
iSYSTEM, February 2012
45/85
Write access breakpoints can be set directly from watch window
Variables configured in the Watch window can be used to directly set a hardware Write access breakpoint.
When a single variable whose address is linear in memory space (i.e. not in a register, or using a register offset),
the context menu Set Write Breakpoint command configures the hardware access breakpoint logic (if available
on the current platform).
To modify or clear the breakpoint, use Debug/Hardware Breakpoint command.
iSYSTEM, February 2012
46/85
9.11.43 (25.7.2011)
CPU Support
ARM
Floating point instructions support
Cortex VFPv2 and VFPv3 instruction set extension is supported.
PowerPC
MPC560xE support
Full debug and trace feature set.
iSYSTEM, February 2012
47/85
9.11.44 (27.7.2011)
CPU Support
PowerPC
MPC5xxx / PX Industrial Line support
Industrial line of e200 core based CPUs is using this naming convention:
Prefix
Domain
PXD
Display
PXN
Networking (Ethernet)
PXS
Safety
PXR
Real-time Performance
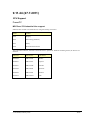
This table links industrial, automotive and code names. Apart from different marketing names, the devices are
identical.
Industrial
Automotive
Code Name
PXR40xx
MPC5674F
Mamba
PXS20xx
MPC5643L
Leopard
PXS30xx
MPC5675K
Komodo
PXD10xx
MPC5606S
Spectrum
PXD20xx
MPC5645S
Rainbow
PXN2xxx
MPC5668G
Fado
iSYSTEM, February 2012
48/85
9.11.46 (11.8.2011)
winIDEA
Analyzer
Profiler Filter
Code items displayed in the timeline and statistics view can be filtered using wildcard expressions in the Filter
bar.
To open the filter bar, click the
icon in the toolbar, or Filter command from the context menu.
Filter expression uses case insensitive wildcard format.
Several expressions can be specified by delimiting them with space characters; e.g. to display only functions
starting with OS or CAN, specify the filter: OS* CAN*
Filtering is applied until the filter bar is open. When closed, all areas are displayed again.
Note: filter expressions are synchronized between profiler timeline and statistic views.
Hide items with no activity
Press the Filter bar’s button:
Profiler / Trace Synchronization
Trace view can be synchronized to the position of the caret in the Profiler timeline view.
To synchronize manually, hold down the Shift key when placing the caret pointer.
To synchronize automatically on every caret move, press the toolbar
iSYSTEM, February 2012
button.
49/85
Profiler Line Profiling
Line profiling is available in Entry/Exit and
Range mode.
Statistic criteria:
Count
Net time
Gross time
Call time
Timeline:
Net and gross activity is shown in Range mode
only.
iSYSTEM, February 2012
50/85
9.11.47 (18.8.2011)
CPU Support
V850
V850 Fx4 FLASH Programming
Before FLASH programming operation is attempted, winIDEA presets OPTION byte to disable watchdog
during programming. After the operation, the OPTION byte is restored.
V850 Fx4 64k FLASH Support
New parts with larger FLASH are now supported, using new Renesas FLASH library.
PowerPC
SPACE2 CPU support
Preliminary device support. Verification pending silicon.
iSYSTEM, February 2012
51/85
winIDEA
Analyzer
Profiler Tail Merge Analysis
Compiler’s tail merge optimization effectively moves part of function (A) code body into another function (B).
In range mode, execution in function B would be attributed to function B, instead of the optimized function A.
If this option is enabled, profiler performs analysis of tail-merge optimization on the fly. This analysis requires a
higher level of debug information quality and it relies on object code analysis. If the analysis algorithm fails,
profiler session aborts. In such case the tail-merge analysis can be disabled to revert to regular range mode.
Location: Analyzer/
/Profiler/Tail-merge analysis
Default: OFF
Profiler Filter
Negative wildcards are supported by using the - prefix.
In this example all functions are shown except functions starting with OS or Adc.
Profiler Goto Disassembly
Tracking disassembly from timeline
and statistics views is available via
Context menu/GoTo/Disassembly.
iSYSTEM, February 2012
52/85
Help
Release notes link is now provided from Help/Release notes… menu.
The link points to the online version of the release notes PDF file.
iSYSTEM, February 2012
53/85
9.11.48 (26.8.2011)
CPU Support
XC2000
XC22xxM (MR+) devices support
Full feature set.
PowerPC
PowerPC PPC405D5 support
Full debug feature set. PowerPC PPC405D5 is a soft-core found in Xilinx FPGAs
winIDEA
Debug
Download File Configuration
Download file path can be modified, while all other file options remain unchanged.
Note: path for the Project Output File cannot be changed.
iSYSTEM, February 2012
54/85
9.11.49 (30.8.2011)
winIDEA
Analyzer
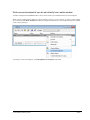
Profiler function configuration filter
To find a specific function easier, the function configuration list now provides a filter field, with same
functionality as symbol browser.
Profiler function lines timeline in Entry/Exit mode
Line execution timeline is available in Entry/Exit mode too.
iSYSTEM, February 2012
55/85
9.11.50 (7.9.2011)
CPU Support
STM8
STM8L15xR6, STM8L15xR8, STM8L15xM8, STM8L15xC8 devices support
Full feature set.
winIDEA
Analyzer
Marker auto-sync from Trace view
If Auto-sync is enabled, Profiler Timeline view synchronizes markers if they are moved in the Trace view.
Debug
Group Breakpoint Setting
Setting breakpoints at emulation start and Enable All/Disable All/Remove All, is performed in a single
operation. For software breakpoints set in FLASH this yields only a single FLASH erase/program operation and
a considerable improvement in speed.
Eclipse
Eclipse Debug plug-in verified with Eclipse 3.7.0 (Indigo).
Existing plug-in works fine without changes, installation document is updated.
iSystem Reg-Ex parser plug-in is no longer needed, because similar functionality is built-in.
iSYSTEM, February 2012
56/85
9.11.51 (14.9.2011)
CPU Support
CR16C
SC14444A SC14445A devices support
Full feature set.
I/O Module
I/O module Pattern program can be scaled in time and voltage at load time.
This allows definition of a generic waveform (e.g. sine wave) which can be scaled to custom frequency and
amplitude.
iSYSTEM, February 2012
57/85
9.11.52 (15.9.2011)
CPU Support
CR16C
QSPI monitor new device support
Winbond W25Q64BV is supported.
iSYSTEM, February 2012
58/85
9.11.53 (21.9.2011)
CPU Support
ARM
Energy Micro EFM32 support
Full feature set.
winIDEA
SDKs
The SDK file locations have been moved to be in the same folder, as when the SDK is installed standalone.
The Help/SDKs/ menu opens the documentation files from the new location.
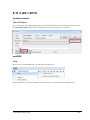
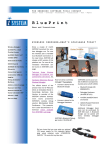
SFRs
Multiple special function registers can be defined for a CPU
In the CPU specification, names of multiple CPUs or modules can be combined with the + sign.
This allows adding a few SFRs for a CPU. In the above example the default registers for MPC5567 are used with
addition of SFRs specified in external definition MySFRs.
iSYSTEM, February 2012
59/85
Structure for external SFR definitions provided in the setup
The folder structure, top-level definition file and CPU family specific description files are provided in winIDEA
setup. The folder structure is placed in SFR subfolder of winIDEA installation.
Custom SFRs (.SFR file and .SFG files) can be placed in this structure and will be available on next winIDEA
start.
For more information see External SFR.pdf.
isystem.connect
ISYSTEM_APPDATA environment variable can be set to specify root folder of winIDEA permanent files.
This is necessary on some Windows platforms when isystem.connect operation is performed under a service
account.
If the system environment doesn’t provide the APPDATA environment variable, ISYSTEM_APPDATA should
be defined, pointing to a directory which is accessible from the service account.
iSYSTEM, February 2012
60/85
9.11.54 (23.9.2011)
CPU Support
V850
V850Fx3 Range mode profiler
Range mode is supported.
I/O Module
Power Measurement
I/O module now supports power measurement.
The optional Power Probe can be used between the power source and target.
For more information refer to IOModule.pdf
This allows definition of a generic waveform (e.g. sine wave) which can be scaled to custom frequency and
amplitude.
winIDEA
Analyzer
Functions with identical names can be profiled. If multiple functions with the same name are detected, the fully
qualified name is used:
File static functions: “<file name>”#<function name>
Class methods: <class name>::<method name>
Example:
Record functions: *Static*
iSYSTEM, February 2012
61/85
9.11.55 (26.9.2011)
CPU Support
ARM
STM32 GPIO initialization for trace operation
New STM32 devices require additional initialization of GPIO if Trace operation is required.
winIDEA
Script
Keyboard shortcuts can be configured for external scripts.
The shortcut scripts are configured in the Options/Script dialog.
To define keyboard shortcuts, open Tools/Customize/Keyboard dialog and set Script shortcut in the Tools
category.
Note: this setting is specific to winIDEA workspace.
iSYSTEM, February 2012
62/85
9.11.57 (28.9.2011)
winIDEA
Document handling
Document selector provides these commands (available from context menu)
Open Containing folder
Close All
Close All But This
Copy Full Path
Symbol navigation
Workspace/Symbols window now provides filtering for quick location of a symbol. Filter format is same as in
symbol browser.
iSYSTEM, February 2012
63/85
9.11.60 (7.10.2011)
CPU Support
ARM
STM32F series FLASH support
STM32F2xxxB/C/E/F/G devices FLASH programming is supported.
isystem.connect
CExecutionController::call interface
The call method of the CExecutionController class allows calling target functions via isystem.connect. The call
mechanism makes use of isystem.test technology. It requires that the application is loaded and the stack has been
initialized.
Note: this functionality is available only on platforms where isystem.test is implemented.
These functions are provided:
string call(const string
string call(const string
string call(const string
string call(const string
const string ¶m3);
string call(const string
&functionName);
&functionName, const string ¶m1);
&functionName, const string ¶m1, const string ¶m2);
&functionName, const string ¶m1, const string ¶m2,
&functionName, const StrVector ¶ms);
Example
import isystem.connect as ic
from isystem.connect import IConnectDebug
cmgr = ic.ConnectionMgr()
cmgr.connectMRU('')
execCtrl = ic.CExecutionController(cmgr)
print execCtrl.call('Factorial', ‘7’)
Note: the target application must be stopped at the time of the call.
Source line symbol size information
IConnectDebug::GetSourceAddress function can return size of source line along with its address.
SDK implements this functionality in
CAddressController::getAddressOfSourceLine
CDebugFacade::getAddressOfSourceLine
For more information refer to obnline SDK documentation.
iSYSTEM, February 2012
64/85
9.11.62 (17.10.2011)
CPU Support
PowerPC
PPC44x Trace support on iC5000
RISCWatch trace protocol is supported.
MPC5xxx e200z4/z7 MMU support
TLB layout differences (TSIZE) to older e200 CPUs are supported.
winIDEA
Symbols
Type names of struct, union and enum types are accessible with the type prefix.
Example
struct S
{
char c;
}
This type is accessible with struct S too.
Analyzer
Profiler Export Format Text1
New configurable text export format Text1 is implemented.
For further information refer to Analyzer.pdf
Profiler Stack Killer functionality
Profiler supports OS killing a complete task, without all functions on stack exiting properly.
Configuration is available via Profiler Configuration/Advanced dialog.
Functions configured as stack killers must be determined empirically, or by OS vendor specification.
For further information refer to Analyzer.pdf and ProfilerConcepts.pdf
iSYSTEM, February 2012
65/85
Profiler Timeline state variable display
Symbolic values for state variables are shown in timeline view. The value is shown for the caret pointer time.
isystem.connect
Global symbol retrieval
CDataController:getSymbols()
can be used to get all functions and global variables. The returned list is a string vector.
Example
import isystem.connect as ic
cmgr = ic.ConnectionMgr()
cmgr.connectMRU('')
data = ic.CDataController(cmgr)
# allocate string vector to receive function list
functions = ic.StrVector()
# For other types of global symbols use other flags as the first parameter.
data.getSymbols(ic.CDataController.estFunctions, functions)
# Iterate the returned vector and print every function name.
for funcName in functions:
print funcName
iSYSTEM, February 2012
66/85
9.11.63 (25.10.2011)
CPU Support
PowerPC
MPC5xxx TLB write access
TLB entries can be written via MemoryWrite functions (e.g. isystem.connect).
To access a specific part of a specific TLB entry, the access address encodes the TLB index in bits 16-31 and
the MAS register number in bits 0-15.
Example
To access MAS3 of TLB 4, use address 0x00040003
isystem.connect
MPC 5xxx controller
MMU TLB manipulation functions are provided via CMPC5xxxController class.
Example:
import isystem.connect as ic
cmgr = ic.ConnectionMgr()
cmgr.connectMRU('')
# get MPC5xxx controller
MPCCtrl = ic.CMPC5xxxController(cmgr)
# get TLB 3
TLB = MPCCtrl.getTLB(3)
# change RPN to 0x40800000 physical
TLB.m_dwMAS3 = 0x40800000 | (TLB.m_dwMAS3 & 0xFFF)
# set TLB 3
MPCCtrl.setTLB(3, TLB)
iSYSTEM, February 2012
67/85
9.11.64 (4.11.2011)
CPU Support
PowerPC
MPC5xxx Instruction Address FIFO Buffer (PC FIFO) display
Last eight change-of-flow PC locations are displayed in Plugin/e200 Execution History window.
Double-click actions:
on the address – shows disassembly
on Location or Source – shows source code
winIDEA
Technical Notes
The Help/Technical Notes menu provides links to technical notes documents installed in the winIDEA folder.
iSYSTEM, February 2012
68/85
9.11.66 (11.11.2011)
CPU Support
PowerPC
Leopard 2M support
Full feature set on iC5000 and iTraceGT.
Leopard Active GT Double data rate Nexus support
On the active POD, double data rate Nexus streaming can be used to attain maximum bandwidth.
iSYSTEM, February 2012
69/85
9.11.67 (16.11.2011)
CPU Support
PowerPC
Leopard Active GT Nexus configuration
Only applicable options are shown in the Nexus configuration dialog.
V850
V850 Fx4 trace recording
Maximum session duration extended using compression. Up to 1 minute session recording is possible.
I/O Module
Values for power measurement probe preset JB1/JB2 positions are available as drop-down shortcuts in
Hardware/Options/IO Module dialog.
If current measurement is used, Multiply factor is forced to 1.
winIDEA
Analyzer
Profiler Export Filter
Profiler export can be limited to items matching
the specified filter.
Filter
Same wildcard format as the Analyzer window
filter.
Export only active areas
Only areas with recorded activity will be
exported.
iSYSTEM, February 2012
70/85
9.11.68 (18.11.2011)
CPU Support
PowerPC
Leopard unlock with password
Standard MPC5xxx password unlock supported.
ARM
TMS570 trace support on iC5000
ETM trace on iC5000 is supported.
winIDEA
IDE
Unified window type switching
Switching between MDI, floating and dockable window type is unified.
Docked state: right click on window title bar or the document tab, and
open the Window type menu
MDI state: right click on window title
bar or the document tab, and open the
Window type menu
Floating state: open the
Window menu
iSYSTEM, February 2012
71/85
9.11.69 (28.11.2011)
CPU Support
ARM
STM32L15x support
Full feature set.
winIDEA
Floating point compare precision
When comparing floating point numbers using vague precision, the precision can be specified.
Location: Debug/Debug Options/Symbols
Default: 1E-5
iSYSTEM, February 2012
72/85
9.11.71 (2.12.2011)
CPU Support
Sitel SCxxxx
SC14446A, SC14447A, SC14448A support
Standard SCxxxx CPU feature set is supported.
winIDEA
Analyzer
Profiler XML Export
Profiler XML export is available.
iSYSTEM, February 2012
73/85
9.11.72 (8.12.2011)
CPU Support
Tricore
TC1724, TC1728
Full debug feature support.
ARM
VFP registers support
VFP register set can be accessed via SFR window, watch expressions and isystem.connect.
winIDEA
Debug
SFR window
Floating point SFRs are displayed in floating point format per default. Hexadecimal display can be selected via
context menu.
FLASH operations
Explicitly issued FLASH operations (verify, blank check, erase,…) retain the progress report open after
successful completion.
Analyzer
Profiler XML Export
Parent area information for data states and function lines is available in the export.
iSYSTEM, February 2012
74/85
9.11.73 (13.12.2011)
CPU Support
ARM
STM32Lxxx automatic trace port initialization
On STM32L CPUs, the TPIU does not automatically configure GPIO ports for trace operation when activated.
This initialization is now performed by winIDEA when trace is activated.
winIDEA
IDE
Release notes
Online Help/Release Notes now include full change-log for official release and development version.
Debug
Expression evaluation
Maximum evaluation upload extended to 64kB. Old limit was 256 Bytes. Default remains at 256.
iSYSTEM, February 2012
75/85
Watch window
Watch arrays can be expanded up to 4096 elements. Previous limit was set to 256 elements.
Download verify
The standard progress dialog is now used for verification. This allows copying the report to clipboard.
Analyzer
Profiler configuration cleaned-up
Code and data areas are displayed in parallel.
Less frequently used options have been moved to
Advanced configuration.
iSYSTEM, February 2012
76/85
9.11.74 (19.12.2011)
CPU Support
Sitel SCxxxx
SC14446A, SC14447A, SC14448A support
Special function register database is up to date.
winIDEA
Analyzer
Trace XML export
XML export is available. Exported information detail is configurable.
iSYSTEM, February 2012
77/85
9.11.75 (22.12.2011)
CPU Support
ARM
TMSx70 ECC FLASH programming
Flash ECC data can be programmed separately when automatic ECC generation is disabled (Hardware/FLASH
device Configure/Configuration).
winIDEA
IDE
Inconsistent text file line endings tolerance
winIDEA now detects the ‘prevailing’ line ending convention. Inconsistencies like sequences of CR CR LF are
treated as a single new line.
Text files using such mixture of line endings are non-standard and are considered as file error. The effect occurs
when content from differently encoded sources is merged via file transfer, copy/paste or explicit merging.
To avoid confusion, it is advised that the error is eliminated at the source.
iSYSTEM, February 2012
78/85
9.11.76 (4.1.2012)
CPU Support
HC11
Range mode profiler support
Range mode analysis is supported.
V850
V850Fx4 Nexus width selection
Nexus width is now limited to 16, 24 and 48 bits. Due to implementation specifics, narrower widths yield no
benefit in session duration (due to trace buffer compression).
winIDEA
Analyzer
Profiler tail-merge analysis
Functions which are tail-merge optimization destinations are now included implicitly if any of the explicitly
specified functions use them.
Implicitly added functions are not shown in the Analyzer
window.
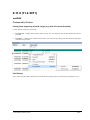
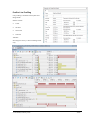
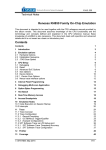
Profiler function configuration update
If Code Areas list is empty, but Code profiling is checked,
all functions will be profiled.
Profiler areas enable/disable
Already configured profiler areas can be temporarily
disabled by clearing the leading check-box.
The new configuration will take effect in the next profiler
session (live or off-line)
Snap to area
If timeline toolbar’s
previous is executed.
button is checked, the located area will be scrolled into view when find next or find
iSYSTEM, February 2012
79/85
9.11.77 (12.1.2012)
winIDEA
Desktop
Double click on document tab maximizes the window.
SFR Window
Address column
The Address column displays:
address for SFRs
bit position and size for sub-SFRs
Value radix
SFR value can include radix prefix:
0x for hexadecimal values
0b for binary values
iSYSTEM, February 2012
80/85
Location: Tools/Options/SFR Window/Display radix prefix
Default: Off
Analyzer
Non regular functions properties display is limited to Net display only.
Count and Count derived information as well as Context specific statistics are not shown.
I/O Module
HIL Access to Pattern Engine
HIL Write method accepts these parameters:
Pattern.FileName
Path to the pattern definition file
Pattern.ScaleTime
Multiply the times by this factor.
Pattern.ScaleAOUT
Multiply the Analog Out values by this factor.
Pattern.UseConfig
Use configuration part.
Pattern.UseTableA
Use Table A part.
Pattern.UseTableB
Use Table B part.
PatternSet
Set to TRUE/1 to apply the pattern configuration.
iSYSTEM, February 2012
81/85
CPU Support
HC11
Data profiling considers all write sources
Write from any SoC source (not just CPU core)) is considered as a profiler event.
ARM
TMSx70 EEPROM programming
EEPROM programming for F021 devices is supported.
Note that EEPROM is erased during mass erase.
In-Circuit emulation access breakpoints
Breakpoint Count is now interpreted as pass count – the number of hits to skip before a breakpoint stops
execution.
This behavior is now identical to execution breakpoint pass count.
iSYSTEM, February 2012
82/85
9.11.78 (17.1.2012)
winIDEA
Help
Help/Release notes now links to isystem.com/downloads/sw-updates
Analyzer
Binary export provides AUX/IOM data export option.
iSYSTEM, February 2012
83/85
9.11.79 (24.1.2012)
winIDEA
Analyzer
Profiler export adds Area type selection and Data and AUX filters.
Areas
Defines which area types will be exported.
Note: function lines are exported only if functions are also exported.
iSYSTEM, February 2012
84/85
9.11.80 (3.2.2012)
winIDEA
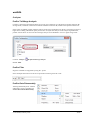
Watch window
Binary constants
Binary constants of the form <digits>b are recognized.
e.g. 1000b == 4
This format should be used if one intends to modify binary values in the watch window. Other binary display
formats cannot be used to modify the value.
iSYSTEM, February 2012
85/85