1
Oscilloscope
Digital Storage Oscilloscope
Operation Manual
05- 30200/400/600
Digital Storage Oscilloscope
Operation Manual
•
0· , · ' • . • ' "
, . . , ' • •" .,
fi\
V
11"
'.
., . '
•• ••
", .
' . ' • • , .' • • • • , . , .
'. "
---;::..
:;:;;;. ......
~
()
!Q)l
@ ez Digital Co.,Ltd.
:;::::.~
=.J
:;:;:. ......
DECLARATION OF CONFORMITY
according to ISO/lEe Guide 22 and EN 45014
Manufacturer 's Name:
E Z Digit a l Co.. Ltd.
Manufacturer's A ddress:
222- 28. Nae -dong, Ojeong - gu.
Bucheon -s i, Gy ecnggi-do
R.O.K , 421 -16 0
Declares tha t the product :
Product
Name :
OSC ILLOSCO PE
Model Numbers:
05 -3 0200 , 05 -30400 , 05-30600 ,
Date :
Aug. 18. 1995.
Conforms to the following product specifications :
Certified by TUV Rhein lan d
Safety:
EN 61010- 1: 1993
(l EC 1010- 1 : 1990 + A1:1 992, modified )
EMC :
EN 5008 1- 1: 1992
EN 50082 - 1: 1992
Supp lementary In formation :
The pr oduct herewith complies with t he re q uireme nt s of t he Low Voltage
Directive 73/23 /EEC and the E MC Direct ive 89/336/EEC .
.
Bucheon, Gy eonggi
Location
C. )' . /LU'J?
Chea l Young Kim
Quality Assurance Manager
Safety Summary
Safety Precautions
Please take a moment to review these safety precautions. They are
provided for your protection and to prevent damage to the oscilloscope.
This safety informatio n applies to all operator and service personnel.
Caution and warning sta tements.
CA UT ION
Is used to indicate correct operating or maintenance
procedures in order to prevent damage to or destruction
of the equ ipment or ot her property.
WARNING
Calls attention to a potential danger that reqwres correct
procedures or practices in order to prevent personal injury.
Symbols
Cautionj refer to accompanying documents ) and Warning ,
Protective ground (eart h) symbol.
Introduction
T hank you for purchasing a E Z product. Electronic mea su rin g inst ruments pr odu ced
by EZ Digita l are high tec hnology products made und er strict qu ality control.
We guarantee their exceptional precision and utmost reliability. For proper use of
th e pr odu ct plea se rea d thi s user manual ca refully.
~ EZ Digital CO. .Lt d,
Note
I. T o fully maintain the precision and reliability of the product use it within the range
of standa rd setti ng (temperature W'C - 35·C . hu midity 45% -85 %) .
2. After turning on- power. please allow a pre-heating period of as long as some 15 minutes
before use.
:J.
This equip ment should be used with a triple line power cord for sa fety.
4. For quality imp rovem ent the exterior design an d specifications of th e product ca n be
cha nged with out prior noti ce.
5. If you have fur ther questi ons concerning usc. pleas e contact the EZ Digital service
center or sales outle t.
Warranty
Warranty service covers a peri od of o ne year from th e date of original
purchase.
In case of technical failu re within a year , repair service will be
prov ided by our service center or sales outlet free of cha rge.
We charge customers for repa irs a fter the one-year warranty period has
been expired. Provided that agai nst any failure resulted from the user's
negligence, na tural di saster or accide nt, we cha rge you for repairs
regardless of the warran ty period .
Fo r more professio nal rep air service, be sure to co ntac t our service
center o r sales outlet.
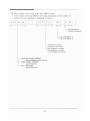
- C O NTE NTS -
l.
D escrip tio ns of th e prod uc t
II
\-1. Introd uctio n
II
1-2. Specificatio ns
13
1-3. Points to bc chec ked prio r to usc
17
1-4. Accesso ries
18
2. Operating in structi ons
2-1. Function of eac h block
2-1-1. Displ ay a nd power blocks
2-1-2. Verti cal amplifier block
2-1-3. Sweep and trigger blocks
2-1-4. Read o ut
14
21
21
····· 2 1
23
······ 26
2-1-5. Sto rage block
27
2-1-6. Mi scellan eou s featu re
28
2-2. Basic func tions and measur ement
29
2-2-1. Con nec tion of measuri ng signals
24
2-2-2. Adj ustment during initial o peratio n
30
2-2-3.
Data display
33
( I) Real time mode dis play
33
(2) Storage mod e displ ay
35
2-2-4. Real time mode meas urement
38
(() Single -trace mea su rement
38
(2) Dual-trace mea surement
.~ <)
(3) T rigger selectio n
-I I
2-2-5.
(4) Addition and differe nce measureme nt
44
( 5) X-Y measur em ent ··
45
(6) Delayed-tim e axis o pera tion
46
Digital storage mod e function
49
( I) Normal storage mode ( MO DE) ·
49
( 2) Equivalent sampling mod e
49
(3) Roll mode
51
(4) Single mod e
52
(5) Hold mode
53
( 6) Save mod e
53
( 7) Save mem ory display ( RECALL)
53
(8) X-Y plot ou tput
54
( 9) Ho rizontal mag ni fication di splay
54
( 10) Int erpolation
57
( I I ) ALT MAG .
( 12 ) GO -NOGO ·
58
59
59
65
( 13) Menu mode
( 14) X - Y measurement
2-3. Measurement applicatio ns .
66
2-3-1. Ampl itud e measurem en ts
66
2-3-2. Ti me interval measurements
70
2-3-3. Fre quency meas urements .
72
2-3-4. Ph ase di fferen ce measurem ents
73
2-3-5. Rise time measurement
77
3. X-Y digital o u tp ut
3-1.
Application X-Y plott er
80
3-2. Pl otter specificatio n
80
3·3. Connection
R5
3-4. Setting
85
3-5. Operation
4.
RO
. ··· · 90
3-6. RS-232C interface
90
3-7. Major troub le,
90
Serial co m m unication us ing R S-232C
91
4-1. Introduction
..···· 9 \
4-2. Specification
91
4-3. Connector pin arrangement and signal description
....... . 91
4-4. Connectio n
93
4-5. Operation and command
94
4-6. Transmission/reception data format
96
4-7. Separating character
102
4-8. Abnormal operation handling
102
4-9. RS-232C interface cable co nnection and instrument opera tion .... 102
4-10. Generation of data transmi ssion/re ception program
\0 2
4-11. Key cau se of abnormal data transmission/re ception
.... ···10:1
4-12. Program examples
\0:1
5. User m ain ten ance guide
JJI
5-1. Cl eaning
J II
5-2.
JII
Calibration
6 . OS-3IXX)DSRS diugrum-,
J 12
6- 1. External views
J 12
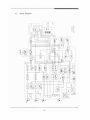
Block d iag ram
II .'
6-2.
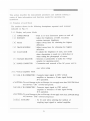
1. Description of product
1-J. Introduction
This product OS-3000DSRS is the 2 channel digital storage oscillosco pe
which is equipped with ND converter.
It combines the benefits of digital scope to measure, store, interpret and
commu nica te the rapid trace, with the benefits of ana log scope to measure
the wide band width, 2 tim e ax is generato r, de lay sweep and separated TV
trigger signa l.
It redu ces the measurement error, and' uses 6% sq uared type CRT with
internal flourescent scale which en ables to take the photograph of
observed waveform.
(l) High speed optical frequency band width
ND con verter installed on each channel samples the input signal at
the ma x. rate of 20M H z samples/sec. Any signal with perfect
rcp catedness can be stored. (M ax. 20-60 MHz)
This product ca n be used as an ordinary real time oscilloscope with
frequency range between 20 and 60M Hz .
(2) Large storage capacity
Each channel has 2kW memory . Since it can indicate the wavefo rm
composed of IkW data, it measures any rapid ly changing transition
trace with high acc uracy .
(3 ) Waveform save
It has 1kW memory to save two waveforms store d in eac h cha nne l.
(4) Multi-Fu nction
It has a variety of following functions to interpret a wide ran ge of
signa ls :
- Roll mode function to measure low signal.
- Average function to elimina te noise from th e signal and to measure
the pure signal.
II
(5) Output
It uses bot h RS-232C in terface fu nc tio n to input/ output the d igital
data to th e perso na l com pu ter, and RS-232C to conduc t screen hardcop y
thro ugh digital plott er. It also interprets and reco rd s the stored
data.
(6) CRT an d cursor reado ut
It ca n pro mptly perform the operation and meas urement using both th e
CRT readout func tion to display the set info rmatio n of panel and th e
cursor readout function to display th e voltage difference (8 V) . tim e
diffe rence (8 T) and frequency d ifference (l /8 T) between two
cursors.
12
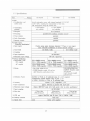
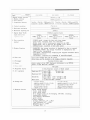
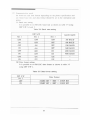
1-2. Specifica tions
Spec.
OS-J0201l
Model
OS-J0400
OS-JOWO
-CRT
1. Configuration and
useful screen
2. Accelerating
potential
J. Phosphor
6-inch rectangular screen wi th internal graticulc ; Sx 10 DiV
( 1div= [em ), marking for measurement of rise time.
2mm subdivisions along the central axis.
+1.9kV approx.
+ 11.5kV approx .
(ref. cathode)
(ref. cathode)
PJ I (standard)
4. Focussing
possibletwith autofocus correction circuit)
provided
5. Trace rotation
6. Scale illumination
variable
provided
7. Intensity control
- Z-Axis input
(Intensity Modulation)
I. Input signal
Positive going signal decreases intensity. ( + 5Vp-p or more signal
cases noticeable modulation at normal intensity senings.)
DC-2MHz (-3dB)
DC-3.5MHz (-3dB)
2. Band-width
3. Coupling
4. Input impedance
DC
2a-3Ok-ohms
30Y (DC+ peak AC)
5. Maximum input voltage
* Vertical
Deflection
I. Band-width (-3dB)
DC coupled
AC coupled
2. Modes
DC to 20MHz normal
DC to 7MHz magnified
10Hz to 20MHz normal
10Hz 10 7MHz magnified
DC to 40MHz normal
DC to 7MHz magnified
10Hz to 40MHz normal
10Hz to 7MHz magnified
CHI. CH2. ADD. DUAL
(CHOP;TImeJdiv switch - 0.25 to 5m<,
ALT;TimcJdiv switch 2ms 10 O.211s
3. Deflection Factor
4. Accuracy
5. Input impedance
6. Maximum input voltage
7. Input coupling
0.25 to 5ms
ALT:TimcJdiv switch
2msto O. II'S
SmY/div to SV/div in 10 calibrated steps of a 1-2-5 sequence.
Continuously variable between steps at least I : 2.5
xS MAG ; ImVldiv to IVidiv in IO calibrated steps.
normal ; + 3%. magnified; + 5 %
approx. IM-<>hm in parallel with 2SpF+ 3pF
Direct ; 3OOV(DC+peak AC), (with probe; refer to probe specification)
AC-DC.GND
17.5nsorless
8.8ns or less
(sOns or less;x5)
(sOns or less;,5 )
8. Rise time
9. CHI out
5.8ns or less
(35ns or less;x5)
approx. 20mY/div into 50 ohms ; DC to IOMHz (-3dB)
10. Polarity inversion
11. Signal delay
DC to 60MHz normal
DC to IOMHz magnified
10Hz 1060MHznormal
10Hz 10 IOMHzmagnified
CHI.CH2,ADD.DUAL
(CHOP : Tune/div switch
CH2 only
delay cable supplied
none
13
.-
Spec.
OS -.' 0 20D
--------______ Mo del
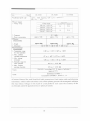
* Horizontal
Deflection
I. Display modes
2. Time base A
OS -.'060D
OS -.'O·jOD
A, A int, B. B TRIGD. X-V
O.2i Jiv 10 O.2sid iv in 19 calibrated steps, 1-2-5 sc- 0. 1P~/ di v 10 O.2s-'uiv in 20
'sh
qucncc. uncalibrutcd continuous control bcrwccn calibra ted steps 1-2-5 scsteps at least 1 : 2.5
quence uncalibrated continuous control between
steps at least 1 : 2.5
Hold-off time
3. Time base B
Delayed sweep
Delay time jitter
4. Sweep magnification
variable with the holdolT control
Ool/ Js/div to O.2/ls.div in 7 calibrated steps. 1-2-5 se- 0.1 }Js.'div to IOIJsh.liv in 7
qucnec.
calibrated stcps t-z-S scquence
I div or less to 10 div or more
better than I : 2(xx}()
IOtime s (m axi mum sweep r..Llc;20n\-idiv)
NOle;50ns/div, lOns/div of A TI~lE BASE
are uncalibrutcd.
+ 3%.
5. Accuracy
(ot
10
l Otirncstrnacimurn sweep
rate ; IOns/di v
50t ). additional error for magnifier + 2%
* Trigger System
I. Modes
AlITO. NORM. lV-V. lV-H
CHI, CHl, LINE. EXT
AC
+ or
2. Source
3. Coupling
4. Slope
5. Sensitivity and
Frequency
AlITO. NORM
lV-V. lV-H
6. External triag"
Input Impe an ce
Max. input voltage
X·y Opera tion
l. X·'3Xis
*
~.
Y axis
.~ .
X · Y ph u-,e dittcrcu c...·
*Readout
Function
I. Cursor readout
function
2. Panel setting
displays
3. Effective cursor
range from center
graticule
4. Resolution
2OHz·1MHz lMHz·1OMHz
2OHz·1MHz 2MHz-40MHz
2OHz·1MHz lMllz.ffiMliz
1.5div INT Il.Sdiv
U.Sdiv
l.Sdiv INT O.5div
l.Sdiv
EXT O.2Vo-o O.8Vo-o EXT O.2Vo-o O.8Vo-o EXT O.2Vo-o O.8Vo-o
at least I div or l.OVp-p Composite Sync.
f Mo hm in pararall with approx. 30pF
250V(LlC +pcak AC)
!NT
(same as CHI except for the following)
Deflection factor: same as that of CHI
Accuracy; ± 5%
Frequency response ; DC to 500kllZ(-3dll l
same as CH2
3" or less (at DC to 50kHz)
~V;
Voltage reference
~T ;
Time reference
Frequency reference II ~V;
~-REF
~· REF
~-REF
Vertical axis (CHI. CH2)VfDlV. UNCAL. MAG (convened value)
Horizontal axis
: SfDlV. UNCAL. MAG (convened value)
Vertical : withinf 3 div
Horizontal : with in f 4 div
1(25 div
1-1
I
Model
Spec.
• Digital sto rage functio n
I. Display memory
2. Sav'c memory
3. Acquisit ion mem ory
() S - Jll~O()
(lS - 'ON) )
OS ·.'O·IO»
1()l)l)Wtlnh /C H
I00:IWortJ... elf »: 2
Sus/ div - 20sl d iv : 2000 word , IC Ii ! Susl d iv -20sl di v : 2000 wordsi CH
0.2usld iv - 2sl d iv : IOOOword s/ CIi o .lu, l d iv -2 usl d iv : IOOOword siCH
-
2 ~ po i nL t1 i\
4. Vert ical resolut ion
5. Horizontal resol ution
lOOPoint/div
6. Maximum sapmling rate
20 Msl s
7. Digital Band Width
single shot event
"': I'll..'II\
v \,.'\ cru
8 . Data acqu isition
method
9 . Display Funct ion
10. Data save
S M lIl (4 sa mplesl Cycle )
20 M II ,
7M Hz at Y axi s xS
MAG
15. X-Y operation
16. Swee p time
17. Readout function
MA G
· NO RM mode : storage the da ta each time trigger
· ROL L mode : da ta is continuously stored o n the C RT
· 1I0LD mode : data is he ld for 'he NO RM. AVG . RO LL
· S INGLE mode: wa veform is held after stored
· S MOOTIi : the storage waveform is d isplayed by dot s o r smooth
· Il'oTERPO LAn O N : the sto rage waveform is di sp layed by dot .
linear o f sine interpolatio n
· ALI MA G : Si multa neo usly dis playi ng the original waveform and its
ma gnified wavefo rm
· GO· NOGO : judgement and co mparing of acquisitio n signal
Up to IwO stora~ data can be saved.
Sa ved d ata can
reca lled to tnc d isplay whenever reau ired .
Var iable (0 .0 4 div step)
plo tter o utp ut o f the CRT d~ layed inform ation to an IJP ·GL
plotter via the RS· 232C inte ace .
1,'\ " I l .L1 .1 outpu t
14. Magnified displa y
6OMII,.
7MHz at Y axis xS
· A VG mode : averaging from 4 to 256 times
I I. Pre -trigger
12. Plotter
4OM I17
7 M Jlz 31 Y ax is x5
M AG
RS· 232C
x \ 0 by Tirn e/ d iv switch or MAG switch
·X ax is - SA
Sig le trace X- Y X ax is - C H 1
Y axis - S8
Y axi s - C H 2
Du al trace X-Y X axis - C H I
Y axi s - C H 2
Sensitivity
X axis : C II I ImV -S V/ d iv ± S%
Y ax is : C H 2 I m V- S V/ d iv ± S%
Ph ase erro r
3" o r less fro m DC -SO Kllz
0_11'- dl\ -20" d i_
O.2IJs.'div- 20s div
repetitive signal:O. 1jJs Ji \ - 2ps div,
repetitive signaLO.2Ils/di",'-2/Js/div
roll mode:O.5j'S,,'di\"-20s.'di\
roll mooe:O.5j'S.'d i\" - 20s.'div
ALT: O.5 1 1~d i v- 20s div
AI.T O. I,><;Idiv"().5 msldiv
CIIOP: Imsldi_- 20, 'd iv
CHOP:O. Ims'd iv-20s!div
( Panel se u ing d ispld:)
V/ d iv. uncal . MA .
Si div, unc al. M AG _
X- Y. Tri ~g er poi nt, no. of averaging. roll mod e . smoo lhing.
interpola tio n method .
save memory informat ion .
trobe seni ng
( ursor reado ut )
Vo ltage difference 6 V : o -Ref
T ime diffe rence ,0, T : t::. -Ref
Frequency II t::. I : 6 -Ref
Pretn gger 'm.G : 6
I:;
Sf'L".
\luJd
-
* Calibrator'(probe
~ IJj )
approx.
Juty ral l\l
* Power
Supply
I . Voltage range
2. Frequency
3. Power consumption
OS · .1( 01)1)
OS -.10.1(1)
()S · .l O~ ()1>
l U I, fn.."Juclli.) ', 05\' (.t]% )
50%
' q U. I H.' \ \ ;j\ I..'
voltage range
I()()( 40 -I IOV)'AC"
120( IOK- I32V)/AC
220( 198 . 242 V)/AC
2.1(~207 · 250 V)iAC
..
F ,
,
'1
2A
F2A
IA
F IA
50 I 1'011,
..ppm\ . 70W .
upprov . 711\ \
appro, . 70 W.
* Ph ys ic a l
C haracteristics
I. Weight
2. D imension
* Environm ental
Characteristics
I . T emperarure range
for rated operation
2. ~t a:< . ambient
operating temperature
3. Ma:<. storage
tcmerurure
4. Humidity mnge for
rated operation
5. Max. ambient
operating humidity
• Safety
, B tC
approx. 8kJe
approx.8kJ;::
"Pp'O\. Ski:
320 m W ) X 140 m (10 X 430 m (LJ
+ 1Ot: to + 3st: (+ 5O'F to +9S'F)
at: to + 4Ot: (+ 3tF to + 104'F)
- 2Ot
to + 70t: (- 4'F to
45"
+ ISS'F)
to + 85" R11
35" to + 85% RH
Er\610 10- 1 overvoltage CAT IT. degree of poilulion 2.
Approval :TOV I
lnterferdnce :EN5008 1-1
Susceptab,hty : EN50082- 1. IEC80 1-2, 3. 4
c Ca utiono .So urccs like small hand -held radio tran sceivers, fixed station radio and television
transmitters . vehicle radio tran smitters anJ cellular phones generate electromagnetic radiation
that may induce voltages in the lead s of a lest pro be In su ch ca ses the accu racy of the
oscilloscope canno t be guaranteed due to physical reaso ns.
16
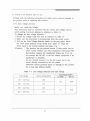
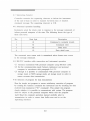
1-3. Points to be checked prior to use
Comply with the following procedures for safety and to prevent damage to
the product prior to operating this product.
1-3-1. Lin e voltage selection
Before use, check the voltage.
This in strument mu st be operated with the correct line voltage selector
switch setting to prevent damage in reference to table I-I.
To change the lin e voltage selection :
1. Decide the voltage range and fuse in reference to table I- I.
2. Make sure the instrument is disconnected from the power source.
3. Pull out the Lin e Voltag e Selector switch on the rear panel. Select
the arrow mark position of the switch from Table I-I. Slide the
arrow mark to the desired position and plug it in.
<Caution> : Th is product has the ground chassis (3 wire power cord is
used ) . Check whether any other equipment connecting with
th is product requ ires th e transforme r before use. If so, do
not connect the DC/AC or the h ot chassis equipment if no
tra nsfo rmer is available.
Do not directly con nect it to the AC power nor to the
circuit directly connected to th e AC power.
Otherwise serious person al injury or damage to this product
for a long time without trouble .
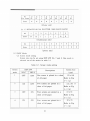
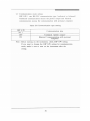
Table 1-1. Line voltage select ion and fuse ratings
Line voltage
Arrow mark position
90 - II OVAC
100
108 - 132 VAC
120
198 - 242 VAC
220
207 - 250 VAC
230
17
Fuse Ratings(250V)
IECI27
ULl98G
2A
F2A
IA
FIA
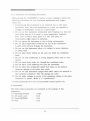
1-3-2. Install ation and han dling precautions
Wh en placin g the OS-3()()()DSRS in service at your workplace, obs erve the
following precautions for best instru me nt performan ce and longest
service life.
1. Avo id placi ng this instru ment in an extremely hot or cold place.
Specifica lly, don 't leave thi s in strument in a close car, exposed to
sunlight in midsummer, or next to a space heater.
2, Do not use this instrumen t immediately after bringin g it in from th e
cold. Allow time for it to warm to room temperature, Simila rly,
don't move it from a warm place to a very cold pla ce, as
condens ation might impair its operation,
3. Do no t expose the instrument to wet or dusty environ ments.
4. Do not place liquid-filled containers on top of this instrument.
A spill co uld serio usly damage the instrument.
5. Do not use this instrumen t where it is subject to severe vib ration,
or strong wind.
6. Do not place heavy objects on the case, nor block the ventilation
holes.
7. Do not use this oscilloscope in stro ng magnetic fields, such as near
mot o rs.
8. Do not insert wires, tools, etc. through the ventilation holes.
9. Do not leave a hot solde ring iron near the instrument.
10. Do not place thi s oscilloscope upside dow down o n the ground,
otherwise damage to the knobs ma y result.
11. Do not use this instrument upright while BNC cables are attached to
the rear-pa nel co nnec tors, This will damage the cable.
12. Do no t apply voltages in excess of the maximum ratings to the input
connectors or probes. (Refer to 1-2 specificati o n)
13. Thi s oscilloscope is 10 use UL listed do uble insulated probes on ly,
-4. Accessories
The below listed accesso ries are contained in the package of thi s
instrument.
( I)
(2)
(3)
(4)
Op erating manual
AC power code
Probc (OPTION)
Fu se
I copy
l EA
2 EA
I EA
18
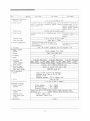
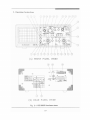
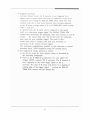
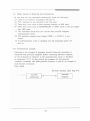
2. O perating In struc tions
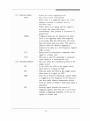
(A) FRONT PANEL ITEMS
35
__
......... " ....... "'....
._"'
........ .."'..-..,..4 .'''' _.....
_.' ''
WAItN'N(;
20
,
C......ToO/<
...-s ' .... . ..........,."""
."....
_
~
,. '"
7
8
(B) REAR PANEL ITEMS
Fig. 2-1 . 05-3020D front/rear views
19
33
~
r~--
~
I
Ii
'ITL
r-'
,
- ---f"-----+--- ~ .
....
o
q
I
~~ .~
... _- , "
I 0 -· -' °' = =
= - _ .. .~
...•.
I
l~~
I -,
r-C::I
.
•
-........c:::J
4
•
.. " "' -
. -§g o. ::OU
' ,
-~'~
,
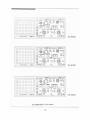
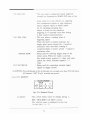
05·30200
CD .'0 . ©~
... - - . , '"
~"",,~~,
CH
2 1!lIS~ ~ ",:,
il:h.
-,
05·3 0400
~ '- _
.
"
n._A'.... ...::'"A:
....
'-._- '
_
~~~
.c - .
ClCJc:::l=
..." ' 0 0
1/"
c
,
-- -
-- I
-,
I
;~ " .) CHI:Z:
_
-
-._-..-
I
•
_-
i
I
_. ~
~ ~,!IZ;.?
_.
.
~-~
9.(I) ''''. ~ ~......
-
'h U '
,
I~ ©~ ::0, :. ©
,
--
)
,, - - , , -oJ
,
,
-
' ,
~
==
.. -. 0 =
0 ,....--=
--=
· . ==
/
~
lA -
,~~
R
I"
I
-c:
&~ ~
!! II
,
.-._... ....
. .: , ;. .J .: ' ", ©
',' ~'. , ®§~
~«(j1Q
J
I
I!
9-(I)
~:' -~
©~ :'0
, ,
..... ,
/
I
,
@&,,
. ," :,\.-...<6:. 0 @i~
- ..."' o;o¥
J
...
_... iC)B--= · .. ==
~4:
, --= · D O' 0 0 0 0
,
- ,
C)
_ .~
0'
/
0 .:::,
CH1 (rJ
II
I '· ~
©~
.
~...... ~&
..
~
(I)
..... ,
~
."
~'- <" _
~OCJCJ
©~: : O~ O
J 9. -t:~ ~~
-I
~! 'S>
L:..I L..J L.J ~
DO
, ,
~-~
0
---
I
.. .. '',,);,',.,.?
:: e Mf!'!)'! W5i C) ~ ~~
,
,
-,~:;
"_... I~'©"
ss: . ~df'- 0'
;'. ,.".. a, 0 ~
_0 ., Ll'LJ':
J
T
!
-
I "'"1' I .''''-~ :,:0: '.-
c=j'1
-
~I
( H l l[
_ CJ
aoro CJ
__
c.J
CJ
CJ CJ CJ
i ll", 41
~,t..
~~ ~
'.'().... 8:- CD.. @5l
~...... ~ ~
I
~
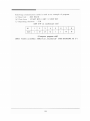
05-300005R5 Front Views
20
ca
..
'--, ' -
( Hl lt
"
~ 10:.
05·30600
Thi s sec tion describes the mea surement proced ures and methods utilizing a
variety of basi c informa tion s and function s need ed for operatin g this
in strument.
2-1. Functio n of each block
The numbers shown in the following descrip tions rep resent each terminal
indicated on F ig. 2-1.
2-1-1. Display and power bloc ks
[ I ] POWER SWITCH
[ 3] INTENSITY
[ 4] FOCUS
[ 5] TRACE ROTATION
[ 6 ] SCALE ILLUM
[ 7 ] VOLTAGE SELECTOR
[ 8 ] POWER CONNECTOR
Pu sh in to tum instrument power on and off.
Adju st the bri ghtness of CRT. Cloc kwise
rotation increases brightness.
Adjust sweep lin es for obtai ni ng the highest
definition.
Adjust sweep line s for obtaining the high est
definition.
It adju sts the brightness of scale. and useful
when obs ervation is made in a dark place or
when taking the ph otograph of screen.
Selection is permissible to make the voltage
suita ble for operating power.
Co nnection and removal of the AC power co rd is
easy whe n using.
2-1-2. Vertica l amplifier bloc k
[ 9] CHI. X IN CONNECTOR: Connec ts input sign al to CH1 vertical
amp lifier or becomes a X-axis signal during
X-Y opera tion.
<CAUTION> To avoid damage to the oscilloscope. do not apply more than 250VrDC+Peak
AC) between "CH I" terminal and ground.
[10] CH2. Y IN CONNECTOR : Connec ts input signal to C H2 vertical
amplifier or becomes a Y-axi s signal during
X-Y operation .
<CAUTION> To avoid damage to the oscillosco pe. do not apply more than 250V(DC+Peak
AC) between "cnz" termina l and ground.
[ 1l][12] AC-DC.GND
To be used when selecting the meth od of
co upling input signal to vertical amplifier.
21
AC
GND
DC
[ 13][ 14J VOLTS/DIY
[ 15J [ 16J VARIABLE
[ 17J[ 18J POSITION
PULL CH2. lNV[18J
[19J V MODE SWITCH
CHi
CH2
Ca pac itor betwee n inp ut connector and vertical
a mplifier interrup ts an y DC compo nent of the
signal.
Co nnects inp ut co nnector of verti cal amplifier
to the ground , thu s establishin g GND as a
referen ce point.
By making direct connec tio n between in put
co nnector and verti cal amplifier, input signal
is directly co nnected to vertical ampli fier.
As bei ng the attenuato r by each step selectin g
vertical deflection sensitivity, meas urement
of waveform is practicable regardless of
signal magnitude and those shall be used by
having them placed at the appropriate position
so as to make waveform mea surement easy .
As being the minute adjustor being used when
having vertical deflection sensitivity
continuously va ried , if they are fully rotated
counterclockwise the attenuation ratio becom es
less than 1/2.5 of indicated val ue. When you
pull o ut the knob, vert ical axis sens itivity
becomes x5 times.
At time time. the maximum sensitivity becomes
ImV.
Being used for moving verti cal axis waveform.
Clockwise rotation moves wavefo rm up and
co unterclockwise rotation moves it down .
Wh en pulled ' out, the signal applied to CH2
appea rs in verted.
Bein g used for selec ting th e displ ay mode of
vertical axis.
Displays only the signal input to CH I on th e
CRT.
Di spl ays only the signa l inp ut to C H2 on the
CRT.
DUAL
ADD
[ 20J CHI OlIT CONNECTOR
Two signa ls th ai a rc input to CH I a nd C H2
a ppear o n th e C RT simulta neo usly.
C H O P : TIM E/ DI Y 0.2s-Sms
ALT : TIME /DIY 2ms -0.21'i (. OS-3060 lJ : 0.1 us )
Displays the algebraic sum of C H I and CH2
signals.
Provides freq uency counter or other devices
with a part of signals that arc input 10 CH I
by having them amplified.
2-1-3. Sweep s and trigger blocks
[2 lJ HORIZONTAL DISPlAY
A
AlNT
To select the sweep mode.
A pushbutton sweeps the CRT at the main (A)
tirnebase rate when pressed .
A !NT pushbutton sweeps the CRT at the main
(A) tirncb ase rate when pressed, a nd the B
tirnebase intensifies a section of the
trac ets) . (In case of OS -30600. pres> A and B
simuhanously),
The secto r whose brightness is modulated is
disp layed on the screen in a magnified form.
BTRIG'D the delay sweep is triggered by the
first trigger pu lse.
pu shbutton pro vides X-V o peration. (o nly
B
x-y
OS-306(0 ).
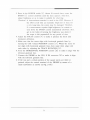
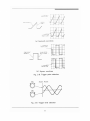
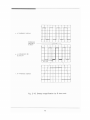
( • A swee p appears in STORAGE mode .)
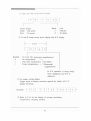
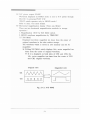
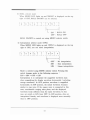
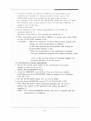
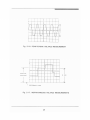
• In OS-3000 DSRS. the horizontal display is as follows
( F ig. 2-2 and 2-3) .
HORIZ OISP
•
B
CJ CJ
A IN T
B '1'RIC"o
HORIZ OI<P
fA " '1
CJ 0
x- Y
B 'PtIG'D
c:J CJ
CJ CJ
Fig. 2-2. 05-30200 , 3040D
Fig. 2-3. 05-30600
[ 22J A TIME/DlV
To select eithe r the calib rated sweep rate of
the main (A) tim ebase, and X-V operatio n
( )S - J() ~()J ) .
OS -30.fOD ) for dcluycd-vwccp operation .
To select the calibra ted sweep ra te of the
calibrated ( B) timebase.
[ 24J DELAY TIME POSmON
To dete rm ine the exact sta rting point within
th e A timebas e delay ran ge at wh ich the B
timebase will begin sweeping.
[ 25J A VARIABLE
Being used for hav ing A sweep time varied
continuou sly from the calibrated position.
PULL XIO MAG
: When you make the part to be magnified align
with the central scale of the vertical axis by
adjusting the position of the horizontal axis
and when you pull the X10 MAG switch, the
waveform, the left and the right of which are
magnified centering around the middle,
appears. At this time, sweep time becomes
1/10 of the indicated value of TIME/ON.
[ 26J HORIZONTAL POSm ON: Being used for adjusting horizontal position
and being used independently of the tim e
measurement of waveforms.
Clockwise rotation of the kn ob moves it to the
right and counterclockwise rotation moves it
to the left.
[23J B TIMElDlV
[ 27J TRIGGER MODE
AurO
NORM
TV-V
TV-H
[28J TRIGGER SOURCE
CHI
CH2
LINE
EXT
Selects the sweep triggering mode .
Th e swee p occurs au tomaticall y.
When there is a triggering signal, th e sweep
triggered normally is obtained and the
waveform stop s.
Where there is no signal and the trigger IS
not made, the sweep still occurs
automatically. This position is convenient in
general use.
Triggered sweep can be obtained, but when
there is no triggering signal and triggering
is not made, then the sweep does not occur,
then the sweep does not occur. This mode is
effective when the effective triggering is
desired to be done in a low frequency (approx.
25Hz or less) .
Being used for measuring a composite video
signal in a frame unit
This one is used for meas uring a composite
vedeo signal in a scanning line unit.
This can select the convenient portion of the
trigger source .
It can select the CH I as the trigger source
when there is a signal on CH l.
This can select the CH2 as the trigger source
when there is a signal on CH2.
This one is used for observing a signal which
is triggered on the frequency of AC power. It
can also stable observe components derived
from the power in which a measuring signal IS
contained.
External signal becomes the sourc e of
triggering signals. And this one is used when
making a triggering regardless of the size of
signals of vertical axis.
25
[ 29J HOLD OFF
[ 30J TRIG LEVEL
TRIGGER SLOPE
[31J EXT TRIG IN
This one makes complicated signa l triggerred
certa in ly by cha nging the HOLD O FF time of the
main sweep. It is also effective in triggering
such complica ted signals as high freque ncy
signal, irregula r signa l or digita l signa l,
etc. by extending sweeping time.
Adj ust it slowly for the stab ilized
triggering. It is normally used after having
it fully rot ated counterclo ckwise.
T his o ne selects a starting point of
triggering signa l.
When the kn ob is rotated clockwi se, the
trigger point moves toward the + ( pos itive)
maximum value and when rotating it
counterclockwise, it move s toward - ( negative)
maximum value.
Being used for selecting trigger slope of the
initial sweep. When the switch is pressed,
this switch selects po sitive / +) slope and wh en
pulled. the switch indicates negative (-)
slope.
Being used for connecting external trigger
signals to trigger circuits.
<CAUTIO N> To avoid damage to the oscilloscope , do not apply more than 250V(DC+Peak
AC) between "EXT Trig In" terminal and ground.
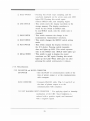
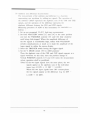
2-1-4. [3 2J READOUT
READOU T/CURSOR
Fig . 2-4. Readout/Curs or
Gi) SELECT
: This switch selects cursor to change among 6,
REF, TRACKING ( "', REF) curso rs.
Th e selected curso r is displayed on the top
(o r left side). ( 6 , \7)
26
®
s»,
toT, l/toT
C9 ON/OFF
: This switch switches among '" Y, '" T, 1/'" T
modes.
: Pressing {;:, Y and SELECT toggles the readout
func tion ON or OFF.
: Moves the selected cursor upward , downward,
right or left.
2-1-5. [ 34] STORAGE
STOR AGE ~ ODE
SlORAG£
YENU
HotD
SA't£
Cl Cl Cl CJ
S1NCt£
SElECT
PLOT
RECAll
Cl Cl Cl Cl
Fig. 2 · 5 . Front panel storage mod e switch
is> STORAGE SWITCH
CD MENU SWITCH
: When LED goes out, it performs the normal
realtime oscilloscope function. All the
switches do not operate. Pressing this switch
once light s up LED , en ters into storage mode ,
and all the switches operate. Pressing this
switch once more in storage mode enters into
REAL TIME mode. In storage mod e, LED blinks
asynchrono usly along with sampling.
: Pre ss this switch to change average,
interpolation, prob e state, roll and smoothi ng
ON/OFF. Whenever pressing this switch, the
mode is changed, and the currently selected
mode is displ ayed on the top right of CRT.
Eac h set mode is ch an ged by pressing SELE CT
switch unde r MEN U switch.
27
Gil HOLD SWITCH
® SAVE SWITCH
CD SINGLE SWITCH
CD SELECT SWITCH
® PLOT SWITCH
CD RECALL SWITCH
: Pre ssin g thi s switch sto ps sampling, and the
waveform displayed on the screen stops and LED
lights ON. Pres sin g thi s switch again
releases HOLD state, a nd sampling begin s.
: This switch stores the display waveform in the
storage memory. Th e disp lay waveform is
stored by this switch in H OLD state.
In no n-HOLD mode, o nly the switch state is
cha ntged .
: Thi s switch measures the cha nge in the
instantaneo us (intermi uent) waveform.
: This switch cha nges th e M ENU switch setting
mode.
: Thi s switch outputs th e display waveform on
the X-Y plotter. Pressing switch transmitts
da ta and lights up LED . This switch operates
only in the H OLD sta te (H OLD LED lights up) .
: Thi s switch is used to display the stored
waveform on CRT again . Pressing this switch
lights up the LED. Wh en LED goes out after
pressing th is switch continuously it relea ses.
2-1-6. Miscellaneous
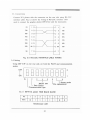
[33] DIP SWITCH and RS-232C CONNECTOR
DIP SWITCH
Sets the PLOT or communication mode at the
time of plotter outp ut or at the communication
with computer,
RS·131C CONNECTOR
Co nnects RS-232C cabl e ( F ig. 3-2 and 4-2) at
the time of plott er o utput or at the
communication with co m puter.
[35] EXT BLANKING INPlIT CONNECTOR : For ap plying signa l to intensity
modulation of the C RT. Tra ce brightness is
reduced with a positive signal, and incr ea sed
with a negative signal,
[ 36J CAL TERMINAL
O utp uts th e sq ua re wave (O.5V, Ik Hz) to
ca libra te th e probe and vertica l am plifier.
[ 37] GROUND CONNECTOR
Provides an a ttac h me nt point for a sepa ra te
ground lead .
2-2. Basic measurements
2-2-1. Co n nec tio n o f mea suring signals
T h ere a re th ree different meth od s for obs erving signals by means of the
osc illos co pe as foll ows :
I. M eth od using lead wire
2. Method using coaxial cable
3. M eth od using probe for oscilloscope
I. Method using lead wire
This meth od is the simple one bu t it ca n o nly be used in th e even t
that the signal level you intend to measure is either a high level
sign al or a low im pedance circui t (such as TTL circuit). At this
time, groun d wires shall be connected between the groundin g term in al
of oscillos cope and the gro un di ng surface o f objects to be me asure d.
However, in case that th e wire picks up h um an d noi se because th e
wire is not shielded, the measurement may ofte n be d ifficult whe n
mea suring low level signals. As it is hard to have the wire
co n nec ted to the connector of oscilloscope, using a binding adapter
for BNC is desirable.
2. Method using coaxial ca ble
This me thod is th e most prevailing one which is widely used when an
o utput connector is attached to the me asureing object As the
shie ld coa ting of coaxial cable prevents hum and noise, accu rate
meas ure me nt ca n be performed.
Since th e coa xial cable ar e usually fitted with BNC connectors on
each end a nd th ere a re many vari eties of types by their purposes, it
j ust wou ld be advis able to usc a suita ble one as needed. When
measuring hi gh frequency signa ls, a terminator having an impedance
of the sa me val ue as th e im ped a nce o f me asuring signal sources shall
be used, and th e coaxial ca bles sho uld also be matched with th e
term ina to r in terms of impedance. Even when using a long ca bl e,
should you use th e subjec t meth od , an acc ura te measurement co uld be
performed with out affecting measurem ent signa ls.
29
3. Method using prob e for oscillosco pe
Usi ng a probe is most preferable to any other alternatives wh en
performing the measurement o nto ci rcuits. The prob es arc available
with IX (direct connection) position and lOX (atten uation) position.
As thc input signal att enuates by 1/10 with the input impedance of
oscillosco pe with prob e increased at lOX position, measurement unit
(VOLT/ O IV) mu st be multiplied by ten ( 10). ( e.g. it becomes 50mV X
10 = 0.05V in 50mV/OIV) . As the probe of oscilloscope also uses
shielde d wires, it can prevent hum and noise. When you intend to
perform the measurement by using the coaxial cable, you should
exactly know the source impedance, the highest frequency involve d,
a nd the capacitance of the cable, etc,
If an y of these factors are unknown , use a 10 X prob e.
2-2-2. Adj ustment during initial operation
Co mp ly with the following procedure before co nd ucting the measurem ent
I. Adj usting kn ob is as follows
OFF ( released)
POWER SWITCH [ iJ
Fully counterclockwise
INTEN CONT ROL [3J
FOCUS CONTROL [ 4J
Mid
AC-GNO-OC SWITCH [ 11,12J
AC
VOLT/OIV SWITCH [ 13,14J
20mV
VERTI CAL POSITION
In the middle and pushed in
CONTRO L [ 17,18J
Full y clockwise and pushed in
VARIABL E CONTROL [ 15,16J
V. MODE SWITC H [ 19J
CH I
0.5111s
TIM E/OIV [22J
Fully clockwise and pushed in
T IME VARIABLE (25)
HORIZONTAL POSITION [26J
Mid
TRIG G ER MODE [ 27J
AUTO
TRIGG ER SOURC E [28J
CH I
TRIG GER LEVEL [30J
Mid
NORM ( max. CCW)
HOLD OFF [29J
2. Co nnec t the power co rd to the power co nnec tor [ 8J.
30
3. Pres s in the POWER switch [1 J. About 30 seconds later , rotate the
INTEN [ 3] control clockwise until tbe trac e appears. And then,
adjust brightness so as to make it suitable for observing.
<Caution> A burn-resista nt material is used in the CRT. However if
the C RT is left with an extremel y bright dot o r trace for
a very long time, the screen may be damaged. Th erefor e,
if a measurement requires high brightness, be certain to
turn down the INTEN co ntrol immediately afterward. Also,
get in the habit of turn ing the brightness way down if
the scope is left unattended for any period of time.
4. Adj ust the FOCUS co ntrol [ 4] to make it produ ce the finest and
distinctest defi nition.
5. Make sure tha t the traces align with horizonta l graticu le lin es by
turning the C H I vertical POSITION co ntrol [ 17J. Whe re the traces do
not align with ho rizontal graticule lin es, then mak e them align with
each o the r by adj usting the TRAC E ROTATION [SJ.
6, Turn the HORIZONTAL POSITION co ntrol [26] to make it align with the
left-most graticule line .
7. Co nnect th e PROB E to the CHI , X IN co nnector [9] to mak e it align
with th e left-m ost graticule line .
8. If the top and a certain porti on of the square waves are tilted o r
pointed, adjust the control terminal of the PROBE by means of a
small screwdriver as shown on Fig. 2-b (b ).
31
R( TRA(l ABl (
HOO k
HOO K COVl R
~
GROUND CLIP
CAPACITANCE
CORRECT ION
TR,MM( R
CQR;UC TlY
C()'j P( NSAH O
I .. )
PROBl
UNDER
COMP £HSATl D
ill
(tll H H CTS Of PROO£ COM PENSATION
Fig. 2-6 . Probe com pensati on
(jVl R
CQMP( NSATfO
TIP
2-2-3. Dat a d isplay
(I) Real time mod e displa y
Curso r measurement value
I
I
[>- -
/
Cursor -.
CD
-
-
-
-
- - - - .- - - - - - - - - - -
- - - - - - - - - - - - - - - - - - - - - I
I
CHI
Scale
factor
I
I
I
ADD CH2 Scale
factor
I
A sweep, B sweep
X-V Scale factor
CH I and CH2 scale factor display
1<--
V/DIV
---->1
r ~1 - r OX- r->- r ~ -r 0-r- r; -1
m-
L __ L __ L __ L __ L _
PROBE display
PIOX
lOX PROBE
PIX
IX PROBE
_ L _ _ L _ _J
BLANK
>
*
CAL
UNCAL
X5MAG
In ADD mod e, • +' is displayed between scale factors of CHI and
CH2.
33
. <t
A sweep. B sweep factor display and X-V displa y
1<
>1
VIDIV
r ->-r -0. -r1 -5 -r-m -r -s -1
I
l
I
_
_ L __ l
_
_ L __ L _
--.J
[
BLANK
•
> :
®
Xl CAL
XI0 MAG
UNCAL
1)ln X-V ope ration mode, X-V mode is
displayed. and TIME/DIY setting
data and B setting data disappear.
2) l n B sweep mode, B TIME is
displayed and TIME/DIY selling data
disappear.
C ursor measurement disp lay
T he meas ure d value between cursors is displayed.
I<:- - --
- - Measured valu e - - - >
I
-r --r0
V 1
I
I
_ L _ _ L_---1
t;. V
I
: CH I, CH2, AD D, D UAL
o: T : Ti me differe nce
between two cursors
for A TI ME/DIY
1/ t;. T : Reciprocal of t;. T
t;.V : + . - , m v, V. div
6. T: +, -. ps, ms, s, div
1/ t;. T : MHz, kH z, H z, mHz, ?
• div" is displayed in the following
cases
- The measureme nt value of the
channel selected by VERTICAL
MOD E switch is not in CAL mode.
- B sweep
-X-Y mode
- A sweep (UN CAL mode)
-CHI and CH2 VOLTS/ DIY are same
with each other when the VERTICAL
MODE is ADD.
(2) Storage mod e displa y
Location of data displ ay o n C RT
Pr e-trigger and curs or mea surement value
~
'--------1
1>- - - - - - - - - - - - - - - - - - -
C ursor ::::
-II------;:===+
Save A
scale facto r
Average. smoothing.
interpolati on and sampling
met hod save switch, PROBE
I
state
,-_~- Save B scale facto r
ADD
C H I scale factor
NOTE
CH2
scale factor
A scal e and
X-Y scale factor
Waveform o r even previously stored waveform ma y be
displayed
while input signal is stored in storage mod e. While.
waveform is stored, the instrument stores the setting
condition associated with sweep factor and waveform. These
valves are alway s displayed when waveform is displayed.
CHI , CH2 and A sweep factors
When CH I and C H2 waveforms are displayed. the sweep
factor co rrespon ding to waveform is displayed.
* Pre trigger and cursor measurement
The sweep waveform correspo nding to the function selected
using cursor selector switch and vertical mode switch is
displayed.
*
*
SAVE A and SAVE B sweep factor
Wh en th e waveform is stored in the memo ry. V/ON and
TIME/ O N is displ ayed. Wh en th e stored waveform is
displayed on the CRT by pressing RE CALL switch, this
sweep factor is displayed.
(1'
C II I a nd C H::' ' '' CCp faC lor di spl ay
r Pl- -r, OX
- -r. ->-r -1 -r 0- -r- -r-V -1;
I
l
I
__ l
__ l
lD
I
__ l
__ L _
_ l
__ L _
Blank
Prob e display
lOX prob e
PIOX
IX probe
PIX
>
*
_J
CAL
UNCAL
X5 MAG
@ A and B sweep sweep factor display and X-V display
1<--
SIDIV
---->1
r --- r - -r - -r - -r - -1
> . 0. • 5
ID
,S
L _ _ l _ _ L __ L _ _ L _
BLANK
*
:J
XI CAL (No hori zontal ma gnification )
No interpola tion
Sine wave interpolati on
Lin ear interpola tion
n
J
-J
XIO MAG
( Horizontal
magnification )
In X·Y ope ra tion. A sweep sweep
factor disappears and x ·y is
displayed .
@ Pre trigger selling display
Trigger point of display waveform against the trigger point of
display waveform .
(Example
<D
Refer to 2-2-5 for the display of average . smooth ing,
interpolation, sampling method.
36
®
Curso r measurement value display
The measur ed valu e between cursors is dis played.
- - - - - >1
Measur ed value
: Volt difference between
lJ. V : -t- , - . mV, V, div
two cursors for CHI and Dual a T : -l-, - , ns, !'S, rns, 5, div
sweep waveform.
1/ lJ. T : MHz, kHz, ?, mHz, div
lJ. V2 : Volt difference between
two cursors for CH2
sweep waveform ,
lJ. V : Voltdifference between
two cursors for ADD
sweep waveform,
lJ. V I
lJ. T
: Time difference
•div" is displayed in the followin g
between two cursors
case :
for A sweep waveform -The measurement value of the
1/ lJ. T : Reciprocal of lJ. T
channel selected by VERTICAL MODE
switch is not in CAL stat e.
-A sweep VAR mo de is not in CAL
mod e at the equivalent sampling
mode.
-x-v mode
-In HOLD state, TIMEIDIV switch
exceeds the measurement MAG range.
-The VOLTS/DIV of C HI an d em are
not same with each other whe n
vertical mode is ADD.
37
2-2-4. Real time mo de mesur ement
(I) Single-t race mea surement
Single-trace measurement is the mo st elementary function o f this
measuring ins trume nt.
Use this mo de when you intend to measure o ne single signal. Sin ce
this instrument comprises two channels, j ust choose o ne of CH I and
C H2. C H 1 has an OlITPlIT term inal [20], and it is desirable for you
to use it when you intend to mea sure the frequency by mea ns of a
frequency counter.
CH 2, as the INVERT switch [ 18], is practica ble to have the polarity
of waveform inverted.
<D Set the switches as indicated below when you use the C H I. The
words in the bracket represent the setting wh en using CH2.
POWER [ I]
ON
AC-GND-DC [Il ], [12]
AC
VERTICAL AXIS POSrnON [ 17],[ 18J : Mid rotation and pu shed in
VAR IABLE [ IS], [ 16J
Fully CW and pu shed in
V MODE [ 19]
CHI (c m)
HORlZ. DISPLAY [21 J
A
A T IME VAR IA BLE[251
Fully CW and pushed
TRI GGER MODE [27J
AUTO
TRlG SOURCE [28]
CHI (Cm)
TRlG LEVEL [30]
Mid rotation
HOLD OFF [29J
NORM ( positioning it at
the end of CCW)
® Position the trace on the center of CRT by adjusting the
Verti cal POSmON control.
@ Connect the signal by means of the 'IN connector [9J [IOJ and
tum the VOLT/DIY [ 13], [ 14] so as to make the sign al fully
appear o n the CRT.
( Cautio n) Do not apply a signal greater than 2S0V ( DC + peak
AC ) .
<D Tum the TIME/DIY switch [22] so as to mak e the signal become
the des ired cycle. For the gene ral measurem ent display of 2 or
3 cycles is suitable but when meas uring the closed up
wavefo rms , displ ay of 50-100 cycles is proper. And adj ust the
T Rl G GER LEVEL co ntrol [ 30] with having it rotated to make a
stable waveform appear.
38
®
If the signa l to be measur ed does not trigger or the
measureme nt is diffic ult beca use of its weakn ess though the
VOLT/D1V switch is positioned on SmV. pull the VARIABLE ( PU LL
XS MAG ) [ lSJ [ 16]. At thi s time. where the VOLT/ON switch is
set to SmV, it becomes lmV/O N and the frequency wide band
width decreases to 7 MH z. However. the noi se increases on the
trace .
® If the signal you wish to observe is a high frequency, thus
resulting in too many cycles tho ugh th e TIM E/D1V switch which
is set to the position of 0.2~s. pull the 'TIME VARIAB LE
termi nal ( PULL X10 MAG ) [ 2S]. Then the sweep speed increases
by ten [ IOJ times so th at 0.2~s beco mes 20ns/div an d O.S ~s
beco mes SOns/div.
0.2 and O.S~s MAG arc the uncalibrated term inal and 1us o r
less is the calibrated terminal. (Wh en magnified by XIO in
lu s/div, the value is ± 10% and when mag nified by XIO in less
than I ps, the val ue is ± S %) .
(j) When measurin g DC or very low frequ ency. the AC coupling
results in the attenuation of signal o r distortion so that use
th e instrument after having the AC-OC.GNO switch [ 11], [ 12J
positi oned to DC.
Ca ution : Wh ere the waveform of very low AC level is loaded on
the high DC voltage. it may not appear on DC
position.
Th e NORM of TRIGG ER MODE switch [27J is the position
to be
reswept. Wh en observing signal freq uency belo w 2SHz, you
ca n
also perfo rm the measurem ent by adj usting the TRIGGER
LEVEL
[3 0]. .
(2) Dual-trace measu remen t
D ual-t race measurement is the major functio n of this instrument,
OS-3OOO0 . The measuring procedu re is sa me as that of 2-2-4
single-trace measurement abov e with the excepti on of the followin g :
CD Set the V MODE switch [ 19J to dual.
Use ALT for rela tively high-frequency sign als (TIM E/O N switch
:O.2rns or faster). and usc CHOP for rel at ivel y low- freq uenc y
signals (T IME/DIV switch : O.Srns or slower).
39
@ If the two chan nels are o f th e same freque ncy. you can exactly
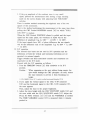
initiate th e triggering with TR IG G ER SOU RC E switch [ 2s1
S,M "' '''IIH'1
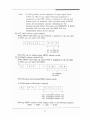
. 1..... 1 \hI1..
ISVt< ,., 1..1
( a) Co mpos itive video signa l
I
:
,
- '--
(b) TV-V coupling
.1
I 1
I
~ m ~ mIIIl1T
II
II
Ie
,
(c) TV-H coupling
1
r_~ r_TI
,
,
I
f-i
I
!
I
r-
I\...
1"-
t '-,
M
I
\I
.,
'I
( d) SYN C polarity
Fig . 2-7. 'TV si nc s ignal separation
40
1Il"",1, \'( "'1.AlI T'r
~_ u. ; 1CJ'o
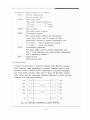
(3) Tri gger selectio n
Triggerin g is the mo st co mplica ted o pe ratio n to perform fo r the
osci lloscope becau se this instrum ent has man y requi rement s that
have to be incid entall y applied. and it requ ires a n exact
synch ronizatio n as well.
CD Tri gger mod e selection
Aut o trigger mod e :
Sinc e the synchro nized sweep alwa ys appears. even th ough there
exists no signal nor ha s the trigger adjusting been don e
improperly granting that there exists a signal. you have
nothing to wo rry abo ut that erro rs ca n possibly arise from the
NORM .
H owever. where the sig nal freq uency is less than 25Hz. the AUTO
cannot be used. At this time. the mea su rement has to be done at
the NO RM position.
NO RM trigger mode :
C RT beam appears o nly when the signal is synchron ized. This
trigger MO D E docs not cause the trace to appear in case that
there is no signal, that the synchroniza tion adj usti ng ha s been
done improperly and that th e ven ieal PO SITI ON has been
inco rrectly adj usted or that the YOLT/DIY switch ha s been
improperly positioned.
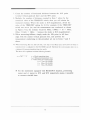
TV-V. TV-H trigger mode :
The cleanly synchronized waveform can be observed with
separating the waveform such as a co mposite video sig na l
( F ig. 2-7(a » into the horizontal and vert ical componen ts by
adding a TV sync separation circ uit, For the sync hronization
of vertical components of the TV signal ( F ig. 2-7(b » . set the
Trigger MODE switch switch to TV-Y. For the synchro nization of
horizo nta l co mpo ne nts of the TV signa l (Fig. 2-7(c ». set the
Trigger MO DE switch to TV-H. Wh en th e TRIGGER has bee n
separated ( F ig. 2-7(d». the TV sync po la rity sho uld be
negative / - ) .
41
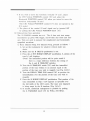
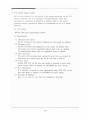
@ Trigger poin t selectio n
The SLO PE switch determines wheth er the sweep shall start from
the rise-starting poi nt or from the fall-starting po int. ( See
Fig. 2-8) .
Dep ressed switch represen ts the rise-start ing point and
released switch indicate s the fallstarting point.
Q) Tri gger level selection
Thi s position represents the starting point of the signal which
is input with either CH I or CH2.
Th e signal starting point varie s as shown on Fig. 2-9 by
turning the TRIGGER LEVEL control [3 0] to the left and right.
42
I ·I S I..1l1'... . ..1
POSI Tt.(
POSITt y{
sco-r
-,
SlOl'{( '~ ~ ,/ ~t(.AT'Yl
~ C~lI
i
I
I ) STAAuec ..\
N{ (,Al ' ';( SLoPE
/ 1
LI
I
1/
II
u
1L....,j
(a) Sawtooth waveform
I
-
IS lAIlTtl'C;
-
"
I'«(,AT I';{ Sl ~ [
"'I
STA8l { Il'ISll'C> I
~'~I "
' ~Lt Pf..> POflT
"",
~;H J"".~
I
~
'- f-
-
j1.I S "' A l t ~ AT
-
POSlflY( Sl cP {
-
( b) Square waveform
Fig. 2- 8. Tr igger point select ion
ll Y1l
r-«
Start Poi nt
"'"
NO'::;:...
0 -Fig. 2-9 . Trigger level select ion
-
(..0 Additi on and difference measurements
The measurem ent of the additio n and di fference is it function
representing o ne waveform by addin g two signals. Th e o peration o f
the add ition (AD D) repre sent s the algebraic sum of the C H I and CH2
signals, and the o pera tion of the difference rep resents th e
algebraic diffe rence between the C H I and C H2 signals.
Measuring procedure of ADD of this instrument, OS · .1I1( ~ )I)SRS i-, as
follows :
I. Set up per paragrap h 2-2-4(2 ) dual-trace meas urement.
2. Set bo th VOLTS/DIY switch [ 13J and [ 14J to the sa me pOS1l10n
and turn th e VARIABLE contro ls [ 15J and [ 16J fully cloc kwise
until being click-stopped. Wh ere the amplitude difference of
the two signals is co ns iderably large, red uce bo th VOLTS/DIY
switches simultaneously as much as to make the am plitude of the
larger signal be within the screen displ ay.
3. Select the TRIGGER switch h aving the biggest signal.
4. Set the V. MODE switch [ 19] to ADD posit ion )
Then, the algebra ic sum of the CH I and CH 2 signals appea rs as a
signal wavefo rm. At th is time, since the posi tion cha nge of
Vertical POSITION controls [17] and [18J va ries the measurement
values, operation sha ll be prohibited.
( Note) If the two input signals have the sa me phase, the two
signals appear as the algebraic sum of the ind ividual
1.2 DIY = 5.4 DIY) .
traces (e.g. 4.2 DIY
Wh ere the two input signals have 1800 co unter-phase,
the two signals appear as the difference (e.g. 4.2 DIY
+
1.2 DIY = 3.0 DIY) .
5. If the pop amplitude of the resultant trace is very small
signa l, perform the measurement after havin g a large marking
ma de on the screen displ ay with adjusting both VOLTS/DIY
switches.
The re is a nother method measuring the algebraic sum of the two
signals of th is instrume nL
That is the method performing the mea surement at the same time when
pulli ng the CH2 Vertical POSmON control [ 18] on which 'PULL
CH2 INY" is marked.
Wh en th e CH2 Vertical POSmON cdntrol is pull ed and the input
signal h as the same phase, the waveform of ADD will be the
difference of amplitude (e.g. 4.2 DIY - 1.2 DIY = 3.0 DIY) .
If the input signals have 1800 of phase difference, the two signals
will be the arithmetic sum of the amplitude (e.g. 4.2 DIY + 1.2 DIY
= 5.4 DIY).
(5) X-V operation
Th e internal time base s are not used in X-V operation and the
deflection s of both the vertical and horizontal directions are all
operated via extern al signals.
Trigger switches and their associated controls and connectors are
inoperative in the X-V mode.
Procee d with the X-V operation as follows :
I. Tum the TIMElDIY switch [22] fully clockwise to its X-V
positi on.
Caution : When appearing as the spot without being swepts, the
spot would damage the CRT phosphor. As such, reduce
the trace intensity to prevent it from becoming too
brigh L
( * 05-3060D: Press X-Y switch on the horizontal display [21 ))
2. If .you apply the vertical signal to the CH2, Y IN connector
[ 10] and the horizontal signal to the CHI, X IN connector [9],
th e trace appears.
Then, adjust the trace to the proper brightness.
3. Adju st the trace height with the CH2 VOLTS/DIY switch [ 14] and
the trace width with the CH I VOLTS/DIY switch [ 13]. Adjust the
PULL X5 MAG switches [ 15] [16] and the VARIABLE as needed.
The TIME VARIABLE control [25 ] is measured when it remains
pushed in.
45
4. If you wish to move the waveform vertic all y rv axis). adjust
the C H2 Vertical POSmON control [ ISJ and adjust the
Hori zontal POSmON eonlrol [26 J whe n you inte nd to move the
waveform hori zontally (X-ax is) .
(The CH I Vertical POSITION control [17] docs no t opera te in the
X-Y mode) .
5. The pha se of the vertical (Ysaxis) sign al can be inverted ISo'
by pulling the C H2 Vertical POSITION kn ob [ ISJ.
(6) Delayed-time base operation
Th e OS·3IXXIDSRS co ntains two axis. The A time axis start sweep
immediately up given with trigger, and B time axis starts 2nd time
axis. Th ey are used to measure the complicated and horizontally
magnified waveform.
CD Basic delayed sweep. For delayed sweep, proceed as follows
A. Set up the instrument for whatever vertical mode you
desire.
B. Make sure the B TRIG'D pushbutton is o ut
C. Pre ss the A INT HORIZ DISPLAY pushbutton. A section of the
tracevs) will brighten .
<Note> Th e intens ified portio n will be quite smaIl if
there is a large differen ce between the setting of
the A and B TIME/DN switches .
D. Tum the B TIME/D N switch [23J until the intensified
portion of the trace widens to an amount equal to the
portion of the tra ce you wish to magnify (see Fig. 2-6(b) ) .
E. T um the DELAY TIME PO S control [24J to positio n the
intensificati on over th e portion of the trace you wish to
mag nify.
F. Press the B HORIZ DI SPLAY pushbutton. That portion of the
trace intensified in Step 5 now appears as spreaded over
the full width of the CRT screen. The trace now displayed
is being swept by the B timebase (Fig. 2-6Cc)) .
G. If needed, additional enlargeme nt is possible by pulling
the A VARIABL E kn ob [25J for PULL X IO MAG .
-16
®
Triggered B sweep
In bas ic de layed sweep, the B tirncaxis is not triggered by a
signal event, it begins whe n the main (A um ebase) sweep cross
comparate level scuing by DELAY TIME PO S. knob . The o nly
problem with this is that mai n tirn ea xis jitter becomes ap pa rent
in the B sweep at higb rati os of A to B TIME/DN switch setting
( 100 : I and up ).
To prevent th is, the B sweep can be triggered by the signal
itself, o r a time-relate trigger signa l. Th e DELAY T IME POS
co ntro l then determines the minimum del ay time between A and B
sweeps : the actual delay time will be that plus the addi tio nal
time until th e next available trigger. The result is that
actual delay time is variable o nly with step resolutio n, in
increments of the interval betwen triggers.
Th e maximum magnification possible by thi s technique is several
thou sand times. (C RT brightness being the limiting factor.
@ For triggered B sweep, proceed as follows :
A. Set up the sco pe for basic delayed sweep as describ ed in
the preced ing para graphs.
B. P ress in the B TRIG'D pu shbutton [ 21], and adjust the
Tri gger LEVEL co ntro l [3oJ if necessa ry. Th e B timeaxi s is
now triggering o n the same trigger signal as the A
timebase. Th e stan of B sweep will always be a leading or
trailing edge of the trigger signal : turning the DELAY
TIME POS contro l will not cha nge this.
,)7
~
a. A TIM EBASE DIS PLAY
INTENSIFI ED
'f
,
PORTlCN Of
A SWH P
l
,
..
T
b. A IN TE NS IFIED BY
B DIS PLAY
,
P H ~1
,
, ... (
,
,
...
7
1
,
,
C,
B TIME BA SE DISPLAY
,
,
,
,
,
,
,
'I'
Fig. 2-10. Sweep magnification by B time axis
,
,
,
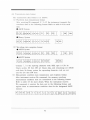
2-2-5. Digital storage fun ction
Digital storage fun ction operates in the following sequence :
(j ) NORMAL storage mode (NORM)
CD NORMAL storage mode (NORM) displ ays th e waveform to be stored
in the real mode.
(%) Press storage switch.
Q) Waveform sweeps all th e trigger devices depending on the
setting of adjustor in the front size. The waveform to be
stored is displayed on the CRT. It sweep speed is low, the
retrieval and display of waveform require more time . It takes
about three seconds to retrieve and display waveform in the
sweep range of 0.1 s/div. Trigger signal is generated after
that time.
If sweep speed is low, therefore, waveform is not displayed on
the CRT immediately upon adjusting the adjustor on the fron t
side.
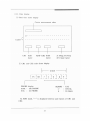
® When TIME /DIV fadjustor is between 51'S /div and 0.2s /div the intermittent and
repeated waveforms may be stored.
® Pressing HOLD switch in NORMAL STORAGE mode stops the correction
operation by CRT display, and the CRT display stops.
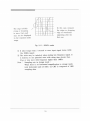
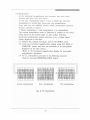
(2) Equivalent sampling mode (EQUIV)
When TIME / DlV switch is set between 0.21'S / div and 21'S / div.
I * OS-:\OWD: 0.1~ /div - 2~ /div) The repeated waveform can be stored in the
EQUIV mode. Pay attention to the followings in this mode:
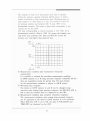
CD The edge initially rising or dropping in trace (left end) may not be displayed
in the repeated mode range. In this case, measure the rising or dropping edge
of waveforms appearing after the first one.
49
I
17
1/
t-,
G
)
The edge initially
/
rising or dr opping
in trace (l eft end)
may not be disp layed
in the repeated mode
range .
V
l-
-f
I I"
I---
f\
In thi s case, measure
the risign or dropping
edge of waveforms
appearing after the
first one.
Fig. 2-11. EQUIV mode
@ It takes longer than 5 seconds to store input sign al below 1kHz
(for 200Hz input) .
® The noise ma y be included whe n stori ng low freque ncy signal. It
is desirous to use spherical wave with rising time sho rter than
O.3 ~s o r sine wave with freq uency higher than lMHz.
Note : Sampling rate in sto rage mode :
When the re is no horizontal magnification in storage mode,
total horizontal scale of IOdiv. on CRT is composed of 1000
sampling da ta.
so
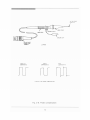
(3) ROLL mode
The displayed waveform flows to the left from the righ t.
Correction point for new da ta and ROLL mode make it easy to measure
the signal lower tha n 100H z or so. To stop the ROLL mode, press
HOLD switch to hold the fina l waveform on CRT.
<
CRT
•
(~I
• • I \ II \ I 1\ 11\ I
\ I \ I \ I \ I \ I
\
•
\ 11 \ 1 \11 'II
\) \ IJ
.·
Existing da ta
· ,\ T ngger
.
Point for
."
•
•
•
!
Stored data
new data.
New dat a
Fig. 2-12. ROLL mode
Note
a) ALIASING distinction
If the input signal having frequency higher than a half
the sample clock frequency is added in the sweep range
when measuring signal in storage mode (NORM , AVG ),
ALIASING occurs.
In this case, the waveform obtained by sample clock
frequency from the input signal frequency is displayed.
This waveform may be regarded as correct
If ALIASIANG is doubtful, convert into REAL TIME mode to
check whether it is same as the operating mode display
being measured.
It ALIASING occurs, the waveform of NORM mode (i nput
signal frequency - sampling clock frequency) is displayed
with its top and bottom section nearly flat. So it is
possibl e to decide ALIASING in consideration of the
difference between these two displa ys.
SI
b) ROL L waveform co rrection
ROLL mode is possible in high speed ran ge ( up to
O.5s/d iv.l . If vertical mode is set to DUAL, the
waveform docs not move smoothly at O.Ss/d iv. which occurs
depending on the relati on between th e waveform da ta and
display rate . In reality, the waveform is normal.
(4) Single opera tion in NORM mod e
With sto rage mod e set to NORM, pressing SING LE switch performs
NORM
mode srnapiin g, and renews th e waveform o n th e tube surface. Then
it automatically converts into HOLD state.
Q) SING LE opera tion procedure
a) Set storage mode to NORM, and adjust th e adjustor knob to
store and display input signal in the o peratio n mode.
b) Set trigger mode switch to NORM, and set trigger level to
such a location as suitable to measure input signal.
c) Press SINGLE switch
@ Pressing SINGLE switch converts into input signal trigger
stand by state. Wh en trigger signal is applied, th e SINGLE
sa mpling is carried out. The SINGLE switch LED continues to
light up when th e input signa l trigger is not detected. If
trigger signal is applied or trigger mod e is set to AUTO ,
SIN GLE switch LED goes out, and automatically converts into
HOLD state. (Hold LED lights up ) .
® Wh en trigger mod e switch is set to AUTO, SINGLE treatment is
performe d if inp ut signal is not triggered. So the D C sign al
ca n be measured in thi s mod e.
@) Wh en trigger signal enters in N.ORM mode, the NORM sa mpling
occurs for the waveform data corresponding to one tube surface,
and all the data renew the tube surface into new waveform data.
This fun ction is effective in storing th e ins taneous waveform.
Note : SIN GLE does not operate in averaging, ROLL, EQUIV or MAG
state. When vertical mo de is dual (ALT), CHI (o r CH2)
performs signale operation.
( 5) HOLD mod e
P ressing HOLD switch in EQUIV, NORM o r ROLL mod e sets HOLD mod e.
In thi s mode, sa mpling opera tion stops in each operating mode.
When mod e enters into HOLD mod e, the waveform display data are
continuously displa yed. When the waveform data displayed after HOLD
mode are set, the waveform data can not be moved vertically.
(6) SAVE operation (SAVE)
Th e waveform data sampled and displayed in storage mode can be
stored in the storage memory. Data which .are stored in the sto rage
mem ory can be displayed on the CRT.
SAVE operation
(D Use SAVE switch to set the storage memory concerned.
@ Sampling data are displayed in storage mode. P ress HOLD switch
to stop waveform.
@ Pressintg SAVE switch saves the suspended waveform in the
storage memory.
CD When storage switch LED lights up instantaneously, it means
that waveform is stored.
® Wh en vertical mode switch is set to CHI . CH2 or ADD, waveform
is stored storage memo ry A and B in tum whenever pressing SAVE
switch. Wh en vertical mode switch is set to DUAL, CH I waveform
is stored in storage memory A while CH2 waveform is stored in
storage mem ory B.
(7) Storage memory display (RECALL)
Th e detail s stored in storage mem ory in HOLD mode are displayed o n
the CRT in next operation, and comparable with current waveform.
(D Pressing thi s switch once, recall switch displays both the
waveform stored in storage memo ry A and the set valu e (V/div.
and TIME/ON) regardless of vertical mode switch . Pre ssing
this switch Once more, the waveform stored in storage mem ory B
is displayed. Pressing this switch one more time displays both
the waveform stored in storage mem ory A and B and the set
valu e.
P ressing th is switch again erase s displayed waveform and set
value.
@ The waveform data displayed in storage mode cannot be moved
vertically.
53
(8)
x-v plotter output ( PLOT )
Waveform displ ayed in HOLD mode is sent to X-V plotter through
RS-232C by pressin g PLOT Sf\V.
(P LOT switch operates only in HOLD rnod e.)
Refer 10 item 3 for more details.
(9) Horizo ntal magnification displa y (Ti me axis MAG)
Th ere are two horizontal maganification meth od s in storage
operation:
I. Ma gnification (X IO) by XIO MAG switch.
2. HOLD waveform magnification by T IME/DIV.
(I) XIO MAG
Displayed waveform magnified ten times from the center of
origi na l waveform in the tube surface storage.
The waveform which is slored in save memory can not be
magnified.
Gi) Pulling XIO MAG switch displays ldiv. sector magnified ten
times fro m th e center of o riginal waveform.
lIE If it is displayed on both sides of CH I and C H2, the
Idiv. sector magnifie s ten times from the center of C H I
and CH2 o riginal waveform .
Original state
Magnified state
CHI
CH2
Fig. 2-13. X10 MAG
5-1
(j)) Wh en switch is released by pressing X IO MAG switch, it
return s to the original wavefo rm.
(2) HOLD waveform magnifiaction usin g TIME/DIY switch
When storage waveform is displ ayed on the tube surface in HOLD
mode, manipulating TIME/DIY switch make s it possible to
co ntin uo usly magnify and displ ay up to ten times the TIME/DIY
switch set value. Magnificati on is done from the center of
original wa veform as in ( I) .
[ Example of magnification operation]
Gil Di splay the original waveform and set HOLD mode.
(j)) Turn TIME/ DIV switch clockw ise to change TIME/DIV to rapid
set value. When TIME/DIY set value is cha nged on the tube
surface waveform is magnified as corres po nd ing to the set
value.
55
(i)
Original
l ms/di v
TIMEIDIV
HO LD mod e
(ii) Rotating TIME / DIY
switch. it magnifies
two times with TIM E/
DlV = O.5ms/d iv.
CH1
fV\II.NVINIM
CH2
JLWJUUULU
CHI
fV\NV\
CH2
.JLJLJUUL
CHI
~
CH2
-FL
(iii) Rotating TIME / DIY agam
switch, it magnifies
ten times with TIME/
OlV = O.5ms/d iv.
Fig. 2 ·1. HOLD wav eform
magn ification
@ This operation performs horizont al mag nification up to ten
time s. Therefore TIME/OlV switch can set a tenth th e
origina l waveform. But TIME/ OIV display is not cha nged and
waveform is not magn ified any more even if you turns
TIME/OIV clockwise beyon d that extent
@ When magnification is displayed, the magnificati on rate is
grad ually redu ced a nd returned to the original waveform by
selling the TIM E/OlV set switch to the slower side while
turning TI ME/OIV switch cou nterclockwise.
)6
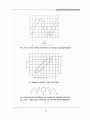
( 10) Interpo la tion
As the horizontal magnification rate increa ses, sine wave loo ks
stepwise and pulse wave goes ami ss.
In this case, interpolation ma kes it ea sy to watch the wavefo rm .
Interpola tio n is divided into linear and sine in terpo lat io ns .
Every time yo u p ress M EN U selecto r switch, int erpolati o n selectio n
function co nve rts as follows :
---> Lin ear interpolation ---> sine interpolation ---> no interpolation
Th e cu rrent interpolation mode is indicated as sym bol on the sweep
sweep fact or on the bottom right o f tub e surface. Selecting
linear/ sine interpol ati ons makes pul se/sine wave o f input signal
clearly displayed on th e tube.
(j) Indicate th e o riginal waveform, and set the HOLD mo de.
( 2) C arry ou t horizontal magnification display using XIO MAG or
TIME/DIY. switch, and have the waveform to be interpolated
di splayed on th e tub e surface.
( Refer to ( 9) horizontal magnification display for horizontal
magnifi cation operation).
(3) In ( 2), interpolation proceeds in the following sequence
whenever pressing INTERPOLATION switch.
,
'-
Lin ea r in terpola tion '
Sin e interpola tio n
Fig. 2-15 Interpolation
57
No interpolation
In X I() MAG magnilicatio n, pressing X I() MAG after interpolation
stops interpolation and norma l magnifica tion display enters
into effect.
In norma l magnification , pulling X 10 MAG after interpolation
stops interpolation and X 10 MAG magnification display enters
into effect.
(II) ALT MAG mode
An original waveform and magnified waveform arc displayed simultaneously.
When awaveform of CH I displayed and ALT MAG mode is selected,
the original waveform and its maguified waveform are displayed
simultaneously.
To perform the ALT MAG display of a waveform of CH2, set the vertical
mode 10 CII2 first, and then set in the ALT MAG mede.
ALT MAG
VERTICAL ~IODE
NORMAL DISPLAY
Cl I I
CII2
CIII WAVEfORM
CIJ2 WAVEFORM
CHI original waveform / CH I magnified. waveform
CHZ original waveform I CH2 magnified waveform
DUAL
DUAL(CHl . CH2l
WAVEFORM
DUAL(CIII , ( 12) original waveform
I DUAL (Cl II +CH2)magnified waveform
ADD
ADD(CHl +CIJ2)
WAVEFORM
ADD(ClI l + C1I2) original waveform
I ADD(CII t + CIJ2) magnified waveform
EX) ALT MAG OPERAT ION (CII I)
I) ScI the vertical mode 10 CH I first, and displayed the waveform of CH I
2) Press IIOLD switch to stop waveform,
3) Use MENU switch 10 ser ALT MAG mode and then select ALT MAG on.
4) Manipulating TIM E I DIV switch makes it possible to continuously magnify
and display up to ten times the TIM E I DIV switch set value,
S) Move the CURSO R 10 a magnified point by the MAG POINT cursor
6) The magni fied waveform is displayed at approximately 3div below
the original waveform
Magnified
Initial
f- :
l
ri g. I - I
5X
e ll I original waveform
CH1 magnified waveform
(12) GO-NOGO mode
The GO-NOGO judgement func tion is used to judge if te acquired signal is in the
judgeme nt domain (Bo undary) sei on the CRT scree n.
TI,e input sign als acquired in seq uence are compared with the boundary,
When the results satify the conditions (CO M PARE. HO LP ). the se processing
arc performed automat ica lly.
Thi s function is used to monitor ahnonnal phenomena which will occur not so
frequently, or to detect undesired sam ples which will out put sign las different
from the reference signal.
GO - NOGO OPERATION
I) GO-NOGO is performed by limited co nuitio ns please co nfirm the operating
co nd ition. (The mode AVER AGI NG . ROLL, MAG . DUAL, SING LE,
RECALL other than o perating) .
2) Use M ENU sw itch set GO-NOGO mode .
3) Se let the co ndition to issu e GO -NOGO from the following two option.
<D Wh en a waveform is out of the j udgeme nt domain
®
"
is onl y co mpari ng
4) Usc MEN U se lector switch se t G O-NOGO judgement domain.
pressing MEN U selec tor sw itch changes mode in the foll ow ing seq uence.
O.4div --7 O.8di v --7 1.2div --7 O.4div
5 ) To perform GO-NOGO operation, press RC ALL Switch
6) XH : Compari ng waveform in the judg me nt dom ain
OH : If the resul t waveform is o ut of the j udgme nt do mai n
Ho lds a wa veform on the sc ree n.
operation
I
"'"
I
rcsull s(HOLD)
I
I
I
,
-
I
I
''j;
,
I
I
I
I
,
I
Fig. 1 -2
(13) MENU mode
59
•
j->
I
,
~ . 1/
I 1'-(
I
Using M ENU switch. it is possibl e to set interpo lation. waveform
smooth ing ON/OFF in average horizontal magn ificatio n whenever
pressing M ENU switch. [ P RO B], [ SMT H ], [ AVG], [ ROLL] and [ IT PL]
appear on the top of CRT one by one and LED lights np.
Pressing the switch aga in release s MENU mode, and LED goes out.
<D Prob e factor selector mod e (P ROB)
When MENU LED ligh ts up and [PROB] is displayed on the top
right of CRT, you can select PROBE factor.
Xl
XIO
I X PROBE
10 X PROBE
Using menu selector switch, it is possible to select XIO/XI
mode .
@ Smoothing selector mode (SMTH)
When MENU LED lights up and tSMTH] is displayed o n the top
right of CRT, SMOOTHING turns ON/OFF.
r s-r ~ -r ~ -r ~ -r - -r - -r - 0- r ; -r -F-1
l
_
_ L _
_ L __ l
_
_ L _
_ L __ l
_
_ l
IT
__ l
_
--.J
~l
OFF :
SMOOTHING
ON : SMOOTHING
In OFF state, storage waveform is displayed in dot s.
Turning it ON, th e dots are connected to display smooth
waveform. If sampling frequency is low in co nnectio n with input
signal (wh en sign al with more than 5 cycles per each sector) ,
it is displayed with amplitude low. In this case, set
smoothing mode to OFF to display the waveform with amplitude
similar to that of input signal.
60
Q) AVERAGING setting mode (AVG)
Wh en M ENU LED lights up a nd [ AVG] is dis played o n the top
right
of CRT, the number of averaging operations can be set.
NORM
4
16
64
256
The number of averaging operations is changeahle using MENU
selector switch . Pressing MENU selector switch changes NORM
fro m 4 Ibm 256.
The average waveform is displayed after data is obtained for
the set sweep number. The average of next data is ohtained in
the number same as the number of sweeps, and the average
waveform display is corrected.
Thus it is possible to detect non-repetitive signal under the
influence by non-trigger noise.
The number of averaging operations is same as the set average
number. In ROLL mode, no averaging operation is carried out.
61
<D ROLL selector mode
When MENU LED lights up a nd [ ROLL] is displayed on the top
right of CRT, ROLL ON/O FF can be selected.
r ~ -r ~ -r ~ -r ~ -r - -r - -r -0- r ~ -r - -1
l
__
L __ L __ L _ _ L __ l _ _ L __ l _ _ L _-J
ON
OFF
ROLL ON/OFF is carried out using MENU selector switch.
®
Interpolation selector mode (ITP L)
When MENU LED lights up and [ ITPL] is displayed on the top
right of CRT. you can select interpolation.
OFF
SIN
LIN
Mode is selected using MENU selector switch. Pressin g this
switch changes mode in the following sequence :
LIN ..... SIN ..... OFF ..... LIN
Interpolation is 10 in terpolate the magni fied waveform data
when magnifying the display waveform hori zont ally (excluding
storage waveform) . In OFF position , waveform is magnified
horizontally. In SIN position. the initial waveform beco mes
similar 10 sine wave. If the square wave is co nnected in this
state, considerable ranging takes place. and the displayed
waveform looks different from the inp ut waveform . In this
case. set switch to LIN from OFF. In LIN position, data are
interpolated line arly a nd waveform is displayed more smoothly
than in OFF position .
Note
®
In SIN position, set the amplitude of input signal below
8 DIV on CRT. If any signal with large amplitude is
connected on the CRT, tortion is observed in the top and
bottom sector of waveform . After waveform stops in ROLL
mode, the interpolation operates depending on the
selection between MAG XIO mode and TIME/DIV. If ROLL
waveform does not stop, both the MAG XIO and
interpolation modes do not operate.
ALT MAG selector mode (AMAG)
When MENU LED lights up and [AMAG) is displayed on the top right
of CRT, you can select ALT MAG.
T
OFF : ALT MAG OFF
ON : ALT MAG ON
®
ON / OFF can be selected using MENU selector switch.
GO-NOGO selector mode (G-No)
When MENU LED lights up and [G-NO] is displayed on the top right
of CRT, you can select GO-NOGO.
I) r----.-----.--,----.-,---.-----.-~~-,_~~
T
XH : COMPARE
OH: HOLD
XH /OH can be selected using MENU selector switch.
2) IF XH mode (or OH mode) is selected,
~
T
~
O.4<1iv : JUDGEMENT DOMAIN 0.4<11'
0.8div : JUDGEM ENT DOMA IN O.8<l1v
1.2dIV : JUDGEM ENT DOMA IN 1.2dIV
Pressing MENU selector switch changes mode in the following sequence
O.4div ---> O.8div ---> 1.2div ---> O.4div
6.1
®
Menu display in the mode " the than MEN U mode
In the modes other than MEN U, the setting informati on of the number of
average and the smoothing is displayed as follows.
t ;mOOthing on
BLANK :Smoothing off
[
SA: SAVE Memory A
SB : SAVE Memory B
BLANK:NoI average
AV4:4times of average
A V 16: 16times of average
[ AV64 :641imes of average
AV256:256times of average
EQUIV :EQUlVALENT SAMPLING
(0.2J.o/div(60MHLO.IJ"Jdiv) to 2",1div)
NORM : NORMAL SAMPLING
(5",1 div to0.15 1div)
ROLL :ROLL MODE
(0.5s1divto 025 1div)
(\ 4 ) X-Y operation
The internal time axis is no t used for ,X-Y measureme nt.
X-V operation is carried out as follows :
I. Set the vertical mode selector switch to DUAL.
(If it is set to CHI, CH2 or AD D, erro r may OCCUR) .
2. Pressing HOLD switch in EQUIV, NORM or ROLL mode ent ers into
HOLD mod e. Th en sa mpling operation stops whil e waveform
display data arc displayed cont in uously.
3. Turn A TI MEIDIV switch [ 22J completely clockwise to X-V
po sition. ( * OS-3()('()D: Set horizontal mode " lector switch to
X·y)
( Note) :If it is displayed in dots and not deflected , the
fluore scent surface of C RT ma y be damaged. If the
brightnes s is to high, lower it.
65
2-3 M EASUR EMENT APP LICATIONS
Thi s sectio n co nta ins the measu rem ent proced ures app lying basic functio ns
of th is instrume nt. OS-302(J().
Though only so me o f them arc introd uced, we assure yo u that a variety of
specific measurem ent can also be performed based on the said func tions.
As the measurement applications set o ut herein are the impo rtant and
essential particulars, it is desirab le for you to make yourself familiar
with those ba sic ope ra ting procedures whil e you use the oscilloscope.
2-3-1. Amp litude Measurement
Th e latest trigger sweep osc illoscope ha s two major func tions.
Th e first of the se is to measure the amplitude.
It is pra cticable to perform all the measurement with the oscilloscope
ranging from th e simple waveforms to the complex ones.
The oscilloscope in general ha s two different voltage measurements,
namely peak-to-peak ( 1'-1') measurement and instantaneou s peak-to-peak
( 1'-1') mea surement.
Instantaneous vo ltage measurement is to mea sure the voltage of each
point on the wavefo rm from a ground reference.
In order for you to perfo rm the afo rementione d measurements exactl y,
make sure that the VARIABLE controls are fully turned clockwise.
( J) Peak-to-Peak ( 1'-1') Voltage Measurem ent
1. Set up the vertical mode switches of the osc illoscope in the same
ma nn er as tha t set out in 2-2. BASIC MEASUREMENTS.
2. Adju st the T IME/D IV switch [22 1in such a man ner as to form a
wavefo rm of as many as two or three cycles a nd the VOLTS/OIV switch
shall he so adj usted as to ma ke the waveform be on the CRT screen
display .
3. Adj ust the Verti cal POSITI O N controls 1171 and [ IXI properly and
make the end of the waveform align with the horizontal grar icu lc
line of the CRT screen display. (See Fig. 2-7).
4 . Adju st the Ho rizontal POSITI O N co ntro l 1261 and make the en d of the
waveform be o n the central vertical lin e of th e C RT scree n displ ay.
(Thi s line is grad uated in 0.2 scale divisions) .
66
5. Co unt the number of divisions of bo th the top a nd bottom of the
wavefo rm and mu ltipl y the resulta nt number by the va lue of the
VOLTS/DIV switch. th us result ing in the pea k-to-p eak voltage.
For example, if the va lue of the VOLT S/D IV switch was set to 2V when
the waveform same as that shown in Fig. 2-16 had bee n measured, it
wou ld in fact be 8.0 Vp-p ,
(4.0d iv X 2.0V= 8.0V)
6. If the indicat ion of the vert ical magn ificatio n is X5, divide the
measured va lue by 5.
However, if the probe is 10:1, mu ltipl y the voltage by 10.
7. Wh en measuring a sine wave below 100Hz o r a sq ua re wave below 1KHz,
set th e AC-DC,G N D switches to DC.
CAlITIO N : Where th e waveform is loaded with the high potential DC
voltage, the ab ove me asurement is difficult.
At thi s time , perform the measurement with setting the
AC-DC,GND switches to DC.
(Wh en the mea surement of AC com ponent is needed) .
: For any instrument equipped with readout function, movin
curso r to the top and bottom of waveform displ ays the
poten tial difference V o n the screen.
( 2) In stantaneou s Voltage Measurement
1. Set up th e verti cal mode switch of the osc illoscope in the sa me
manner as that set out in 2-2.
BASIC MEASUREMENT ab ove.
2. Adju st the TlM E/D IV switch [221 o r [23I so as to becom e a co mplete
waveform ' and set the VOLTS/ DIY switch to produce 4 to 6 divisions
( See Fig. 2- (7) .
3. Set the AC -DC,GND switch (I I) o r ( 12) to G ND.
4 . Turn the Ver tical POS ITION co ntro l [ 171 or [ 18] and make it align
with either th e lowest cen tral horizontal gra ticule line ( in case of
positive (%) signal) or the up pe rmost one (when the signal is
ncga tive f-) ) .
NOTE : The vertical POSITION controls must not be touched until the
mea sure men t is co mp leted.
67
5. Set the AC/ Gt'O/OC switch to DC.
If the sig na l is po sitive ( ,1 ) . th e waveform appe ars abov e the gro und
refe rence lin e and wh ere the sig nal is negative (- ) , the waveform
appears below the ground referen ce lin e.
CAlJrIO N : Wh ere the DC volta ge is relativel y greatly loaded co m pa red
wi th the wave form, then mea sure the AC portion separately
from others with selling th e AC-O C ,G N O switch to AC.
6. Make the point yo u wish to meas ure align with the ce ntral vertical
gratic ulc lin e on th e C RT sc ree n dis play by movi ng th e Hori zontal
POSIT IO N co ntro l lZo].
Since th e centra l vertical gra tieulc is gra duated in sca les at every
0.2 division, th e mea surem ent is easy to perform.
In th e exa mple cited for Fig. 2-7, if th e VOLTS/OIV switch is
posit ioned a t 0,5V, the value becomes 2,5V (5,0 div X 0.5V= 2.5V) .
7. If th e X5 ma gnified movement is performed, divi de th e value measured
in par agraph 6 a bo ve by 5 and wh ere the XIO PROBE is used , multiply
the resultant value by 10.
8. After setting READ OUT cu rsor (X) at the G NO level, positioning 1:0.
curso r (+ ) to the waveform to be measured di splays the instantaneous
voltage on the screen.
68
.l : I
I
I
,
l
~L
(
I
1\
\
I
I
i
\
i
. i
I
1
\
.
i i
! I 1\ I
I
1\
I
,
T
>
H
o
.,
J
)
$
Fig. 2·16. PEAK·TO·PEAK VOLTAGE MEASUREMENT
.l!
I
11
VE RTIC AL
DISTANCE
I
I
~
I I
I
I
REFERENC E LINE
I
5 DIV
~
Fig. 2·17. INSTANTANEOUS VOLTAGE MEASUREMENTS
69
2 -.3 -~ .
Ti me Interval Measu rem ents
The second most impo rtant mea sur ement o f the sync h rono us-swee p
oscilloscope is the very measurem ent of time interval.
Since the divisions uni formly ma rked on the C RT scree n are all
calibrated to the time bases. the time interval mea surement is
practicable,
(I) Basic Techniq ue
Th e basic techniq ue for measuring time interval is described in this
sectio n. In additio n. characteristics measurement and varia tio n
technique using this techni que will be helpful. if you apply the
following proced ures:
I. Set up switches in the same manner as that described in 2-2-4.
Set the TIM E/DIV sw itch [n ] in such a mann er as to make the
,
\\ aveforrn appear on CRT screen display as large as possible.
Tum the TIM E VARIABLE co ntro l [25J fully clockwise until being
click stopped.
Otherwise you so do. the measured value will be inaccurate. thus
requ iring yo u to exe rcise due care.
3. Adju st the Vertical POSITIO N controls [ 17] and [ 18] and make the
waveform you wish to mea sure align with the central horizontal
grati cule lin e.
-+. Turn the Horizont al Position control [26] and make the left side of
the waveform correspond to the vertica l graci tule line .
5. Cou nt the number of graticule divisio ns up to the point you inten d
to measure. Horizontal central line is graduated in divisions
ranging to 0.2 division.
70
6. If you multiply the value measured in Item 5 above by the value set
by the TIM E/D IV switch. the time you wish to meas ure will be
obtained. If the T1MEIV RIAI:lLE knob 125 1i, pulled ( X I (J magnifi ed
mod e) . divide the measur ed value by 10.
(2) Period . Pul se Width. and D uty Cycle Measur ement
If you mak e goo d usc of the measur ement based o n the basic tech nique.
you can also measure th e perio d of pulse, pulse width , and dury cycle,
etc. Wh en a complete period of pul se of the signa l appears o n the C RT
screen display, the period of pulse of tha t time can be measu red.
For example, if the TIME /D IV switch were .set to lOms, the measured value
of one cycle between A and C in Fig. 2-9 would be a wavefo rm havin g a
period of cycle of IOms X 7= 70ms.
The pulse width represent s the tim e between A and B.
In Fig. 2- IS, it is 1.5 division so that it becom es 1.5div X IOms =
15ms. However, in this example, as an 1.5 division is a rather sho rt
dis tance, should you set th e TIME/ON switch to 2ms, it would be seen
magnified as sho wn on Fig. 2-ISb.
Th en , though the pulse is short, th e measureme nt accuracy becomes
increasingly better. Wh ere it is still disp layed small even with
adjusting the TIME/DN switch, it is advisa ble to perform the
measurement und er XI O magnified condition by pulling the A VARIABLE kn ob
(25) .
Wh en pu lse width and period are known, du ry cycle can be calculated.
Duty cycle is the percentage aga inst ON-time of the pul se period ( total
of ON-and OFF-time) .
In Fig. 2-IS: the duty cycle is as follows :
D ty
I (%) = Pulse width X 100- A
u cyc e
Peri od
- A
(e. g) Duty cycle
(%)= j~:~
B
C
X 100
X 100=21.4 %
lit Measure the cycle by moving cursor. Th en measure the pulse width .
Th e du ry cycle of required waveform is obta ined by applying the
measured value to the fo rmula.
71
A
c
8
,
8
A
r~~T-~ l
I
II
,
i
I
I
i
!
.1
1
f-t-....+ •1-++1 1 +1
I
~ 'H
•
i
'r
I
(a)
r oms DI v IS ION
lb )
2mS DI v IS I ON
Fig. 2-18 . TIME INTERVAL MEASUREMENT
2-3-3. Freq uency Measurement
Whe n an accurate measurem ent is needed, a frequ en cy counter sha ll be
used . If you have the freq uency cou nter co nnected to the C H I OUTPUT
co nnector [20] o n the rear panel of the oscilloscpe, you will enjoy the
convenience and advantage to perform both the waveform observing and
frequency measurement sim ultaneously. However, when a frequ en cy counter
is not available, the oscilloscope can di rectly measure the modulated
waveform that can hardly be measured by means of a frequency counter, or
the waveform bearing a lot of noi se. Frequency is interrelated to the
perio d. First of all , in brief, you can simply obtain the frequ ency by
calc ulating with I/t assuming that you' hav e already known the period t
appea ring in section 2-3-2 Time Interval Measurement. With applying the
formula of 1/t. when period is depicted in secon ds, the frequ enc y is
HertzrH z) ; period in milli secondsvms) yields frequ en cy in
kilohertz Ckf-lz r . peri od in microseconds (IlS) yields frequen cy in
rnegah ertz t.Ml-lz) .
The accuracy of frequency is determined by an accurate calibration of
the timebase and careful me asurement of the period.
72
2-3-4. Ph ase Difference Mea surements
Pha se differen ce in phase angle between signa ls can be measured using
the du altr ace meth od of phase mea surement or Lissajous diagrammatic
meth od of ph ase measurement in the X -Y mode of the oscilloscope.
(J) Dual-trace Meth od
This meth od work s with any type of waveform . Even if the waveform s are
different from each other or the phase differen ce is great, the
mea surement up to 20M Hz is practicable.
Me asurement shall co mply with the following:
1. Set the switches as described in 2-2-4 Dual-trace Measurement.
Co nnect one signal to the CH I IN connector 191 and another one to
the C H2 IN connector 110]
NOTE : Where th e frequency is becoming higher, usc the same probe or
the cable ha ving an equal delay time so that an mea surement
erro r can be redu ced.
2. Position the Trigger SO URC E switch 1281 toward the stable waveform .
At this time, move another waveform upward or downward by adjusting
th e vertical POSmON control so as to make the said waveform
invisible.
3. Move the waveform to the center adjusting the vertical POSITION
control, and make the waveform occupy 6 divisions.
4. Adj ust the Trigger LEVEL co ntrol130J and ensure that the beginning
point of the waveform corresponds exactly to the starting point of
the horizontal graticule line (See Fig. 2-19).
5. Adjus t the TIM E/DIV switch 122J TIM E VARIABL E co ntrol 125], and the
hori zo ntal POSITION control 126] properl y so as to make one cycl e of
th e waveform become 7.2 divsions. When this is done, each major
horiz ontal division represents 50° and each subdivision represents
10°.
6. Perform the same procedure as that described in Item 3 above so as
to have an other waveform already moved to be invisible also
displayed on center of the horizontal graticule line.
7. The horizontal distance between the beginning points on the
horizontal axis of two waveforms is the phase difference. For
example, the phase difference shown in Fig. 2-10 is 5.2
divisions, hence 60°
73
S. If the phase difference is less tha n 500. the measurement can be
p erformed closely usin g X IO magnificatio n mode. In this case. note
that o ne major d ivisio n represen ts 5° .
9. For any ins trume nt equ ipped with REA DOUT func tio n. measuring T
value after moving cursor as sho wn in the figure makes it possible
to measure th e ph ase difference in the en tire cycle.
(2) Lissajous Pallem Meth od
This method can o nly be used where the waveform is sine wave.
Measur ements ca n possibly be pe rformed at freque ncies even high er than
500KH z depe nding on wide band width of the amplifier. H owever, in order
fo r you to maintain the maximum accuracy provided in features. it is
desirable to co nduct the measurement at the phase difference less th an
20kHz.
7-1
L
,
f-- --IT [\v- 1\
f--lf V 1\
1/
\
I
1\
/:
\ -r-r-,x
,
, 1\ ' 1\
/
,
1/
'L i.
"I ,
-
,
-
J
1/
~ }
~
II
J
,
I
~
II
Olff ( k( f(; (
7
I
1/ II
zoiv 360'
--,
Fig, 2-19. DUAL-TRACE METHOD OF PHASE MEASUREMENT
,1
,
~
!
.
- j
1/
I,
V
1/
L
1/
/
,
t>
I
1./)
1/
V
•I
1/.:;.: V
ru
1
PHASE DIFFERENCE( angll! ()
= son - I
A
B
( a) PHASE ANGLE CALC ULATION
/0 0
O'
.,.
\:j-,
,,,.
reo-
OJ'
(b) LlSSAJOUS-PATIERNS OF VARI OUS PHAS E ANGLES
Fig. 2-20. LISSAJOUS METHOD OF PHASE MEASUREMENT
75
Pha se difference measurement shall comply with the following proce dure:
I. Rotate the TI ME /D IV switch fully cloc kwise and set it to the X-Y
position.
CAUTION: At this time, the trace on the CRT screen is so brig ht
tha t it co uld often damage the C RT ph ospho r. So redu ce the
trace intensity prop erly.
2. Make sure that C H2 POS ITION [I X] and PUL L X5 MAG knob r161 arc
pus hed in.
3. Co nnect one sig nal to the C H I, X IN con nec tor 19 J, and anothe r
signal to the C1I2. Y IN co nnector [l O],
4. Cente r the waveform by adjusting the CH2 vertical POSITION control
[ 18). and adj ust the C H2 VOLTS/DIV switch [14J and VARIABLE co ntro l
[ 16) together so as to make the wave fo rm become 6 division s (the
waveform ex ists on the 100 % and 0% graticu le line).
5. Adju st the CH I VOLTS/DIV switch 113]. and VARIABLE to make the
waveform become 6 divisions as done in Item 4 above.
6. Precisely cen ter the waveform to have it exactly positioned right on
the hori zontal center by adjusting the horizontal POSmON co ntrol
1261.
7. Count the number of divi sion s indicated by th e waveform along the
central vertica l graticule lin e. You may count movin g th e waveform
by means of the CH2 posi tion contro l for close measurem en t.
8. The ph ase difference of th e two signa ls ( angle e) is equ al to the
a rc sine of A B ( the number divided by 6 in Item 7 above) . Fo r
example, when the waveform is same as the described in F igure 2-20a,
if you perform the calc ulation acco rding to Item 7 above, the
resultant is the arc sine value of 2+6= 0.3334.
whic h is converted into 19.5° in terms of'the angle.
PHASE DIFFERENCE (angle 8) =sin
-' ~
9. The simple method can di rectly be applied to angles less th an 90°.
As for angles greater than 90°, add 90° th eret o. So that you are
required to determ ine its value with referri ng to variou s ph ase
angle indicated in Fig. 2-1I(b) .
NOTE : Th e conversion of sine an gle can be obtained in accordance
with trigonometric function table and trigonometric function
expressio n.
76
10.For an y ins trument eq uipped with READ O UT functio n mcasu riug A and B
values after moving c urso r as shown in the figure makes it po ssible
to ca lc ula te the phase difference ( 8) .
2-3-5. Risctime Measurement
Rise time is the time req ui red for the Icadi ng edge of a pul se to rise
from 10% to 90 % of the tota l p ulse amplitude. Fallti rnc is the tim e
required for the trai ling edge of a pul se 10 d rop fro m 90% of the total
pul se amplit ude to 10%. Risctim e an d falltime, which m ay be
collectively called tra nsit io n tim e, are mea sured essen tially in the
same manner.
To mcasure rise and fall tim e, procccd as follows :
I. Connect the pulse you wish to measure to the C H I IN connec tor (9 1,
and set the AC-DC,GN D switch III 1 10 AC.
2. Adjust the TIME/DIV switch [::'::'1 to d isplay abo ut 2 cycles of th e
p ulse. Make sure th at the T IME VARIABLE co n tro l 1::'51 is rotated
fully clockwise and pus he d in .
3. Cent er the pulse vert ically by adj usting th e C H I vertical PO SITION
11 71·
4. Adjust the C HI VOLTS/D IY switch 1131 so as to make top of the pulse
be clo sest to the 100 % gra ticule line, and th e b ottom of the pul se
be clo sest 10 the 0 % line. Where the correspo nde nce is not ma de,
then rotate the VARIAB LE control [ 15J sligh tly co un terclockwise with
making graticulc lines of bo th sides dev iate a little to mak e th e
both pu lse peaks rest exactly on the 100 % and 0 % graticule lin es,
respectively. (See Fig. 2-2f) .
5. Adj us t th e hori zontal POSITION control 126 J and makc the rising edge
rest on the central vertica l graticule lin e (crosses at the 10 %
point) .
6. If the risetime is sloa s compa red to the peri od, no further
m agn ification is necessary. If, however, the risetim e is as sho rt
as to co rres po nd almost to the vertical graticule line, make an
adj ust men t as described in Item 5 above by pulling th e TIME
VARIABLE/PULL XIO MAG con trol [25 1 ( See Fig . 2·21(b)).
77
7. Co unt the number of horizontal divis ion s between th e 10% point
(central venieal graticule line) and the 90 % point.
8. Multiply the nu mb er of divisions co unted in Item 7 ab ove by the
numerical value of the TIM E/DIY switch, the n you wiU obtai n the
measured rise tim e. Wh ere the mode is XI O magnifica tion, divide the
value of the TIME/DIY setting by 10. For example, if the TIME/DIY
switch was set to Ips, and the measurement was co nducted as sho wn
in Figure 2- l la, the risetime would be 360n s. ( IOOOns -=- 10 = lOOns,
l OOns X 3.6d iv
36005 : because the mode is XIO magnifica tion) .
9. Wh en measuring Ialltime, simp ly make the 10% point in fall time
a lign with the central venical grat iculc line, and perform the
measure ment conforming to the procedure sel out in Items 7 and 8
above.
=
10. When measuri ng the rise and fall time. note that 17.5ns-Rise lime (tr)=O.35/f-.'JH whic h is
transi tion time is contained in the OS-30:20D oneself. Therefore the real transition time uc) is
cOIllJX)SeJ of measure transition time (tnu and tr,
The above all is ex plained with the followin g formula:
Ic
= Real transition time
tm=
tr -
*
Measured transition time
Rise lime o f osci lloscope
tr = 17.5ns: 05-30200
tr = 8.8ns: 05-30·100
tr = 5.8ns: 05-3()(,(J0
For the instru ment eq uipped with READOUT function, positioning
cursor and 6 curso r to 10% and 90 % respectively makes it possibl e
to mea sure rise/fa ll time.
78
o.r: l"
n
I
•
f-s - f-
•
.u
10 QQ
r-:
.. ...
+-+ ••• +
\
.
I
i
qH
~m
o.
i
b ~
I
.r
a. BASIC DIS PLAY SET UP
,1
I
•
"
...
.
I
C 1
~
r: :-...
"""
.
i
...
.a
1
« .b
"
b. WITH HOPIZONTAL MAGNIFICATION
Fig. 2·21. RISETIME MEASUREMENT
79
3. X-Y plo tter d igi ta l o utp ut
All the dat a displayed o n the screen is the ou tput appearing o n the X- Y
planer co n nected with this instrumen t through RS-232C cable. The
op/e ratio n of inst rumen t is describ ed as foll ows. Refer to the plotter
operation manual attac hed to plott er for ins truc tio ns o n the X-Y planer
operation .
3·1. X-Y plotter
HP-GL (RS-232C specifica tio n) plotter
3-2. Specification
( ]) Cha racte r a nd cursor
All the charac ters and curso rs displ ayed o n the screen ar e plotted.
( 2) Waveform data
All th e waveform dal a displayed o n the screen are plaited. The
ho rizontal and vertical waveforms with 10 and 8 div arc plotted.
In ma gn ification mode, on ly the magnifi ed sector is plott ed.
(3) G rid and sca le
Th e grid with hori zontal and vertical 10 and 8 div ar e plotted. In
hori zo ntal and vertical rids , th e 0.2 div nit sca le is plott ed.
(4) Screen mode
Setting DIP S/W o n the rear side makes it possible to select four
scree n modes. Refer to chapter 3.4, SElTING for more details.
(5 ) Pen repl acem ent
It is possibl e to speci fy the pen repl acement using DIP S/W o n the
rear side. Refer to chapter 3.4, SElTING for more details.
(6) Example of plouings
F ig. 3-1 ( a) thru 3-1 (d ) sho w th e example of ploui ngs.
lJ
0
x
~
I
l
- - - - - t - - - . - --_ . .
p
Ul
:::>
Jl
--- -,
~
I-.-.
~~
0
x
F:
'""
,
~
[::
< F--
0
I
I
f--'>
:3
-----1
.:
UJ
I
~ I
f-'>.
~
[
0
0
- . - ..
:>
1
~
+
m
\
f-J .
<
z
1."\
::0
:s:
---- :> J
'---
j
I
~
0
:>
b
j
-1
f--'>
< VJ
:<P /
I
~
0
p
L
~.
_
I
l
I
0
<,
l
~
cO
_j
:>
t
~
f.-"-
-
,/
j
bn
-
u
< \
< \
J
I
<------ ::>
LJ
r-
-
C
- :>
<
< t>
c..n
'"
\
Fig. 3-1 ( a) PLOT OUTPUT DISPLAY 1
81
!,
'"Ii +1 2V
,
l
I
{
I
I
:\/
I
~
I
I
:I Ii
,
I
I
,
,
~
~~;
I
I
L.J
T
i
L
\/ \
I
L
-
0.5 l1S
NCRM
L ~ r---.
~
l
I
V
Om
+4
I
I
!
I
i PIOX! 0.2 ' . l OX
G.Tl
!
\
n
d
I
L--
L.:.-J
1 - -• .. . . .
I
\
i
SM
7\ r\
I,
I
51
- . ... .
I~
If\ /~ f\
I
I
NCRM . ... -
. . . - ..
.-'
51
V
SM
<,
(\ / \
1
\
\
/ \ x,1
~
V\
I
I V I
v
1\7
I
k
L i
r D.~
rv
~
•
- -""
:
!
-l
()
I
-
'~.
II
I Pioxi 0. 5 '
L0-
(\ \1
lOX
;;;;;::::;;:
OV
0
T
"() A 1_
-
'-
~. " ()
0.5 rns
Fig. 3·' ( b) PLOT OUTPUT DISPLAY 2
82
,........
~
W
\.
m..,
:J>
-~-~
$~
i
~
'F ,,:-;,. ..
....
~-F=-:P
·. tI
;f -: ~
.J
-~c:
-- - .....
ro c- --'--- :J .
C
til
- . --,
,= j.-.,:: ~; .
--
I
,
t .
- -
:
,
__
- -=c
~J ~ _:J c:
--
i
.... . ..
,
1
<:
~
<::
. <:
--
Ul
-T
~:I
.,. I
II
c
til
--
I.---~
--
<
I, .'-I
_
~F- - C'-~ D-c
-
if
....
-T ;-
--
~
.1.~
111
-s- - .
til
II'
_1
~
"U
..;
+
111
. -c:::
'-I
-e::
...-
ru
<
<::
----
»>
--
---
~ ,
01
-c:::
. .. ...
1
-- '
~
:::>
-e::
-
;:;r
II'
I 3!
I
·- r- T--~
~
~-' ..:,"
, I- .•::S..
-t--l
I: + I
l
I
I: oi .
-r--t - -"~':l
I
31 -
II
o
-c
Fig. 3, ' ee) PLOT OUTPUT DISPLAY 3
83
I
1
' ;, c.
0 I,
r-·- -rr-
~t;
.... ..
.,
~~--
.. .. . .... .
~___ -m
_
-l
···· -·~lr~
T
!I
--+ - - ~-i--tl~
-
,
I
' ..~
t-
1
to:
li
In
i!l
f~
a
I~
iii
l
I
l
r
.
J
I
H
!I
Ll
I r
I~
I rt~
I
-J- II']
L.. .
II
_....J
~~~·"· ·~F · ·J~J~
~~ ~l
~. ~ .
F
<,
./
,
In
11
r
I
(
~
l r--
~
3
I
\
I'.....
I
:D
r
,
1
I
1"\
U1
I '"
~
L--
Pn<
p
u /
r
,i
V
I{'
(
/'
Fig. 3-' ( d) PLOT OUTPUT DISPLAY 4
84
3-3. Co nnec tions
Connect X-Y plotter with the connec tor o n th e rea r side usin g RS-232C
interface cable. F ig 3.2 sho ws tbe wiring of RS-232C int erface cab le
used to co nnec t the gra ph ic plotter HP7475A with the instrumen t.
FG
to
0
I
FG
TXD
20
0
2
TXD
RXD
3 0
0
3
RXD
RTS
4 0
0
4
RTS
CTS
5 0
f- O
5
crs
DSR
60
0
6
DSR
0 20
DTR
--
20 0
DTR
SG
7
0
0
SG
7
Fig. 3-2 RS-232C INTERFACE CABLE W IRING
3-4 Setting
Using DIP SIW on the rear side, set bo tb th e PLOT and communic atio n
modes.
o
Off
BBBBBB BB
~ l
II
I
ON
No. I
2
3
4
5
6
7
8
' L S~reen
Pen rep lacement
Date format
Communication type
Ex I) H P7475A plo tter (9600 BAUD RATE)
NO.
1
2
3
4
5
6
7
8
stale
0
I
I
I
I
I
0
0
(Oscilloscope side)
85
mode
g
8
7
6
5
Pin name S2
SI
Y
US
A3
4
B4
3
B3
2
B2
1
B1
0
0
0
0
1
0
I
0
NO.
Sla te
0
( P lo ner side>
Ex 2) HITACHI 681-XA PLOTTER (9600 BAUD RAT E)
NO.
I
2
3
4
5
6
7
B
Slale
0
0
I
1
I
I
I)
0
( Oscilloscope side>
NO.
I
2
3
4
5
6
7
B
9
9
Sta te
0
I
I
0
I
I
0
I
0
0
( plotter side )
(I) PLOT Mod c
(a) Screen mod e setting
Screen size can be set using DIP SfW No. 7 and 8. One mode is
selected out of the modes in tab le 3-1.
Table 3-1 . Screen mod e setting
Screen
DIP SfW
mode
NO .7
NO . 8
1
OFF
OFF
Screen Size
Descri ptions
( mm)
One screen is plotted in a sheet
of A4 paper
175 X 140
Refer to Fig .
3-1 (a)
2
ON
OFF
Two screens are plotted in a
shee t of A4 pape r
118 x95 .8
Refer to Fig.
3-2 (b)
3
OFF
ON
Four screens are plotted
in
a
shee t of A4 paper
87 x70
Refer to F ig.
3- 1 (c)
4
ON
ON
Two screens are plo tted in a
sheet of A4 pa per
87 x 70
Refer to Fig.
3-1 ( d)
(b) Pen replacement setting
It is possible to set the pen replacement listed
DIP S/W 6.
In
tab le 3-2 using
Table 3 -2 Pen replacement settinq
DIP S/ W
NO.6
Pen feplacement
OFF
ON
NO
YES
When DIP S/W 6 is set to OFF. six colors arc used for plotting.
Ta ble shows the details of plot and corresponding pen number.
Table 3-3 . Pen number corresponding to th e details of plot.
Pen number
I
3
Details of plot
G RID AND SCALE
CH I
C H2
SAVE A
SAVE B
WAVEFORM
4
CU RSO R
VOLTS/DIY
Cha racter
TIM E RAN GE
CHI
CH 2
SAVE A
SAVE B
SWEE P
SAVE A
SAVE B
Ot hers
5
6
2
3
4
5
6
1
5
6
I
X7
( ~.)
Com m u n ica u o n mod e
Se t baud rat e a nd data fo rma t depe nding o n the plotter speci fica tion a nd
use. S ~Hn (' baud rate a nd data forma t s ho uld be set in the in strume nt and
plott er .
( a) Baud rat e se tting
It is possible to set RS-232C baud rate as shown in tab le 3-4 using
DIP SiW 3,4 and 5.
Table 3-4 Baud rate se ni ng
DI P
siw
BAUD RATE
NO. 3
NO. 4
NO. 5
OFF
OFF
OFF
300 BAUD
0;\1
OFF
OFF
600 BAUD
OFF
ON
OFF
1200 BAUD
ON
ON
OFF
2400 BAUD
OFF
OFF
ON
4800 BAUD
ON
OFF
ON
9600 BAUD
OFF
ON
ON
ON
ON
ON
~
~
( B) Data forma t setting
It is possib le to set RS-232C data format as shown in table 3-5
using DIP SiW 2.
Table 3 -5 Data format sening
DIP Si W
No. 2
OFF
ON
Data Form at
START BIT
START BIT
88
+
+
8BIT
8BIT
+
+
ISTO P BIT
2STOP BIT
(0) Co mm unicatio n mod e setting
DIP S/W 1 sets RS-232C co mmun ica tion type ( unilateral o r bilateral )
Unilateral co mmunicatio n means the plott er output and bil ateral
co mmunica tion mea ns the co mm unica tio n with person al com puter.
Tab le 3-6 Comm unica tion type selli ng
DIP S/W
No.1
OFF
ON
Co mm unica tion type
Un ilateral ( plotter o utput)
Bilateral (c omm unicatiof with pe rso na l
co mputer
Note : Before turnmg on th e instrumen t, check DIP S/W setung.
If you want to change the DIP S/W setting for co m munic ation
mode, make it sure to turn o n the instrument after the
setting.
89
3-5. Ope ration
\\'111:11 th e in strument is in HOLD mode. pressing [ PLOT] SAV s tarts
plotting. Red lamp lights lip while plotting is carried out. When
plotting is oye r. lamp go es o ut and pen is relea sed .
3-6. RS -232C int erfa ce
Th e instrument is equipped with RS-232C as a standard func tio n. This
fun ction enables person al computer to control the plottin g ope ratio n as
well as data input/ou tput to/from co mputer. Th is communication function
can not be used togeth er with the output to the X-Y plotte r.
Do not use the X-Y plott er output function (plo tter out put usin g PLOT
S/\V ) whe n you use the co mputer co mmunication function .
3-7. M ajor troubles
If X-Y plo tter does not o perate normally, chec k th e followin gs :
( I) Cable wiring is not don e in accordance with Fig. 3-2.
(2) X-Y plotter power turns off.
(3 ) Co m mun icatio n type setting ( DIP S/W 1) is wron g.
(4) T he instru ment is not in HOLD mod e.
(5) Baud rate and data format are not properly set (Set them correctly
after turn ing power off. Refer to paragraph 3.4 (2»
(6) Bau d setting is not correct on the plotter side.
( 7) When plotting stops, turn plotter power off and o n to initialize
plotter. Then try to perform plotting.
'i()
4. RS-232C
4-1. Int rodu ction
RS-232C is the serial communication interface standardized by U.S.
Electronic Industry Association , and transmits and receives digital data
through RS-232C interface.
4-2. Specificati on
( I) Electric feature
(2)
(3)
(4)
(5 )
( 6)
(7)
( 8)
Tra nsmi ssion type
Stop big len gth
Character len gth
Parity bit
Sep arating character
Trans mission rate
Communicati on protocal
EIA RS-232 is applicable
Non-sync h ronizatio n
I bit/2 bits
8 bits
disabled
CIR
300, 600, 1200, 2400, 4800 o r 9600 BAUD
Hardwire hand sha ke
4-3. Co n nector pin alignm ent and signal technology
(I) Fig. 4-1 and table 4-2 sho ws the RS-232C connector pin alig nment
and pin functions, respe ctively.
Fig. 4-1 . RS-232C connector pin alig nment
NOTE : Use DB-25P ( FEMAL E) whic h is used for co nnec tor cable.
() J
Table 4 ·1 . RS· 2 3 2C Conne cto r term inal
Pill No .
Signal
Function
I
FG (."'A)
GND configuration
2
TXD ( IlA)
Data transmisxion
OUT
3
RXD ( BIl)
D ata rece ptio n
IN
4
RTS (CA)
OUT
5
CTS (CIl)
Transmission request
Trans m iss io n
req ues t
6
NC
Non-co nnec tion
7
SG (AB)
Signal G N D
8
NC
Non co nnection
9
"
~
10
"
~
II
~
~
12
~
~
13
~
"
14
~
~
15
~
~
16
~
~
17
"
18
"
"
"
19
~
"
20
~
"
21
~
"
22
~
"
23
24
~
"
~
25
NC
"
Non co n nectio n
92
Signal direction
IN
( 2) RS-232C inte rface sig na ls a rc as follo ws:
<DFG
G rou nd co nfiguration
C ha ssis ground cable
@TXD
D ata tran smi ssion
Data output signal transmissio n
+ 9V level - - - - - " 0" (space)
- 9V level - - - - - "I " ( ma rk)
® RXD
Dat a recept ion
Data input signal recepti on
® RST
Transmissio n request
Th is o utput signal indicates the tra nsmissio n
request state, and is used to control the data
transmission function at modem transmission pan.
"0" ( space) - ca rrier transm ission request
" I " ( ma rk) - carrier stop request
®crs Transmission permission
This input sign al co ntrol s modem transm ission part,
and is in an indication state when modem transmission
part is allo wed to transmi t.
Signa l grou nd
® SG
Signal gro und ca ble
4-4. Co nnectio n
Connect the instrument to per sonal comp uter using RS-232C interface
ca ble. Interface varies depe nd ing o n perso na l computer type. So read
o peration manua l carefull y befo re co nnec ting it to personal co mputer,
and select proper interfa ce ca ble. F ig 4-2 shows the RS-232C interface
cable wiring used for co nnecting G oldStar Precision Co., LId's pers onal
co mputer B-I6 with the ins trument.
FG
1
1
0
0
1
1
FG
I
rO3 I
TXO
TXD
2 0
RXD
3 0
RTS
4 0
0
4
RTS
CTS
5 0
0
5
CTS
SG
7 0
0
7
SG
2
0
RXD
Fig. 4-2. RS-232C INTERFACE CABLE WI RING
93
4-5. Operating function and function command
If the instrument is connec ted with personal com purer through RS-232C
interface. it is possible 10 use personal computer with appropria te
programs. Function command designate the program operation to be
carried out by instrument, It is possible to prepa re a set of programs
using personal co mputer to configure the automatic meas urement system
having a variety of function s. The functions to be used by using
RS-232C and function comma nds a re described as follows:
( I) Pan el selli ng
Pan el selling enables th e communicatio n with personal co mputer in
both storage or non storage mode. For data co mm unication, set it
to storage mode to transmit accurate data.
(2) Opera ting function
<D Waveform data transmission
The instru men t has the followi ng six data mem ories.
CH I acq uisition memory stori ng CH I waveform data.
CH2 acq uisition memory storing CH2 waveform data.
Two sweep trace mem ori es (SAVE A and B)
C H I display memory
C H2 dis play memory
C H 1 and CH 2 acquisitio n mem ories have each 2000 data load
capacity dep end ing on the sa mple mod e. C H I and C H2 displ ay
me mo ries two sweep trace memorie s have 1000 data load capacity.
CH I and CH2 display mem ories and two save memories can be
transmitted using personal co mputer.
Tab le 4·2 Sam pling mod e and acquisition
Sample mod e
Acquisition memo ry capacity
ROLL
1000
NORM
2000
EQU IV
2000
The number of data to be transmitted eac h time is selected
within thc memory capacity. Decimal ASC II system or binary
system is selected as data transmission type. Waveform data of
each memory is S bits. That is to say, it is between a and 255
for decimal number a nd bet ween (00) 16 and ( FF) 16 for
hexadecimal number. The scope of these data corresponds to ten
vertical div, on the C RT.
The dat a correspo nding to central crosshair is 12S. «SO) 16 in
haxadecimal nu mb er) . Data 0 « 00) 16) means th e location one
step lower than graticule line. Data 255( ~FF) 16) means th e
locati on o ne step higher than grati cul e line .
255
(FF) "
228
1 DIV
~.,..--,---.--....----,--..,.-,,--r--,----
1-+-+--1--+--+-+- -11-+--11-
12 8
(80 ) "
28
o
_
.1 DIV
(00) "
®
Measuremen t condition data tran smission (C haracter
tra nsmission)
It is poss ible to tran smit th e waveform measurem ent co ndition
to SAVE memo ry A o r B usin g person al co mputer comma nd. All the
da ta are transmitted except for specia l data . The data format
for the measure ment condition is subject to ASCII system.
@ Waveform da ta recepti on
The details in SAVE memory A an d B ca n be cha nged usin g
waveform da ta coming from personal com puter. Set RECALL S/W to
ON so that the rewritten data are dis played on the CRT.
@) Measurement condition data recept ion (charac ter recepti on)
The meas urement co ndition da ta co mi ng from person al co mpu ter
ca n be registered as the data for SAVE me mory A or B waveform .
Wh en RECALL S/W is set to ON , the data of VOLTS /DIY an d
TIME/DIY are dis played on the CRT.
95
4-6. T ransmi ssion data format
Th e transmi ssion data format is as follows:
( j) Waveform data transmi ssion format
After receiving Ri com ma n d (i = 1-4) the instrument transmi ts the
wave form data in the following format. Refer to tab le 4-4 for eac h
item.
• ASC II System
• Bin a ry System
( 2) Waveform da ta recepti on format
• ASCII System
• ASCII System
Co m ma ( , J is th e sepa ri ng character code. DEL type is C/ R. In
binary system, D I th ru DN a re binary da ta. and rern ain ings are AS CII
code dat a. In binary syste m the sepa ra ting charac ter code are not
used for D I thru DN data.
O J M easurem en t co ndition data transmi ssion and reception format.
After ins trumen t receives Ro command, the mem ory wav eform
measurement co nditio n data arc tra nsmitted in the foll owing format.
Refer to table 4-5 for mo re detail s. When th e in strument receives
Wo comma nd. it receives th e dat a sen t in th e following format, and
registe r the m as measurement co n dition da ta for th e designated SAVE
memory.
96
Table 4
No.
Func tion
I Transmissionl
reception signal
check
Command
SI
command
J. Function command
Transmissio n fonnat
Description
• Check the transmission/
reception signal to enable
communication with
~
personal computer.
2 Waveform data
transmission
Ri
command
• The transmission o f •
waveform data stored in
IR i(mmmm.nn nn. X) DELI
memory i is designa ted by
the data number ( nnnn)
denotes the memorynumber.
I
Whose head has address
data (mmmm) .
• ASCII or binary system may
i
be designa ted as transmission
method by X on the right
column.
Memory
I CHI Display memory
2 CH2 Display memory
3 Save memory A
• After transmitting this
command. personal computer
4 Save memory B
receives the designated data.
.mmmm" : Front address o(memory
Four digit integer :
oo»-rm!
•nnnn· : Number of transmitted
data
Four digit integer :
lXXll - lOOO (save memory.
CHI and CH2 display
memory)
I
=A : ASCII system
B : Binary system
'17
No.
J
Fun ction
Measurement con Ro
d ition data
command
tra nsmission
Chareter
ransmission)
Transmission format
Description
C ommand
• designates the transmission
measurement comdition data
~
stored in the memory
"i"(- 1- 4) denotes the
or waveform
I •
memory number.
• After trans mittion this
command. personal computer
receives the designated
da ta •
4
Waveform data
Wi
reception
command
• Personal computer transm its
mits waveform data to the
instrument to designate
SAVE memory A and B in
order to write a series of
data from the front memory
address (mmmm),
• ASCII or binary system may
be designated as transmission
method by X on the
right column.
• After transmitting this
command. personal computer
transmits waveform.
E
if mmmm. nnnn.X) DELI
t denotes the memory number.
i"should be J or 4
i
Memory
3 Save memory A
4 Save memory B
•mmmm" : Front address of memory
. Four digit integer:
lXXXl-0999
" nnnn" : Number oftransmined
data
Four digit integer:
0001 - 1000 (save memory.
CHI and CH2 display
memory)
x= A : AScn system
B : Binary system
No.
5
Function
Com mand
Mcsurcmcnt co -
Wo
nd ition data
command
Descript io n
T ran smi ssion forma t
• Personal comp uter transm its
the measurement condit ion
reception
(Character
to the instrument. and
designates memory to save
reception)
the waveform measurement
condition data stored in
the SAVE memory A and B.
• After transmitting this
~
"i" denotes the memory number.
be 3 or 4
"j" should
i
Memory
command. personal computer
transmits measurement
3 Save memory A
condition data.
4 Save memory B
Table 4 -4. W aveform dat a transmissi on format
No.
Item
1
i@
2
Name
Memory number "i"is ! thru 4
(Not, 2)
mmmm Fron r address
3
nnnn
4
Di
ASCII System
Data code
Byte
ASCII
3
Type
Data number
Data
Decimal number.
Four digits 0001- 1000
Decimal number.
Four digits 0001 - 1000
• ASCII system, Decimal
Binary System
Da ta code
Byte
ASCII
3
ASCII
4
ASCII
4
ASCII
4
ASCII
4
ASCII
3
Binary
!
number
number
Three digits/I data
000 - 255
• Binary system
S
DEL
Separating
8 bits binary data
C/ R
ASCII
charac te r
No te L: Sepa rating charac ter data format is C/ R.
Note 2 : 3 or 4 is design ated in reception mode.
100
1
ASCII
1
Tab le 4 - 5 . Mes ure ment cond ition da ta tra nsmiss ion/ recept ion format
No.
Item
Name
Type
I
@j
Memory number
"i" is 3 or 4
2
V.M
vertical mode
CIII. CH2, CHOP ([)ual trace mode
i.') contained)
Ooc of ADDs
Al including ALT mode) or B
J
II.M
Hori zontal
mode:
4
A.T
A TIMElDlV
5
B. T
B TIME/ DlV
A TIME range value: Alignment at
(note I)
the left end
Unit : S. MS. MICS
(Alignment at the left end)
B TIM E range value : Alignment at
(note I)
the left end
Unit: S. MS, MICS
(Alignment at the left end)
CAL or UNCAL(Alignment at the
left end)
6
V.C
VOLT CAL
7
P.F
PROBE Factor
PIX of PIOX (Alignment at the
left end)
8
V.D
VOLTS/DlV
VOLT range value.: Alignment at the
(Note 2)
the left end)
Unit : V. MY
(Alignment at tne left end)
9
10
II
12
RSV
N. S
Spare
Number of
sweeps
RSV Spare
DEL Separat ing
cha racthe
Number of bytes (Note J)
T rans .
Ree.
3
J
4
4
1
I
9
9
9
9
5
5
4
4
7
7
9
J
9
3
2
2
I
I
No te : 1. For example. 50ms and O.2ms arc indicated as 50ms (alignment at the left
end)
and O.2ms respectively (alignment at the left en d) .
2. For exa mple. 50mv and 5mv are indicated as 50mv ( alignment at the left
end)
and 5mv respectively (alignment at the left end).
3. They arc "recep tion" and "trans missio n'Tro rn the viewpoint of ins tru ment.
101
4-7. Separating cha rac ter
Co ntrolle r transmits the separating character to info rm the instrument
of the end of da ta in order to tra nsmit waveform data or func tion
command message. The separating character is C/ R.
4-8. Abnormal operatio n handling
Instrument sends the return code to response to the mess age command, or
inform perso nal co m puter of the state. The following shows the type of
these state bytes.
No.
State byte
Description
I
41
Command is normally treated.
2
61
Command error
3
62
Data error
4
63
Data detail error
The command error return code is transmitted when format error occurs
in the mess age command.
4-9. RS-232C int erface cable connection a nd instru men t operation
(l) 3Connect in strument with personal computer using RS-232C cable.
(2) Set th e communication mode between instrument and personal
co mputer in accordance with paragraph 3.4. (2) .
(3) Though it is possible to communicate with personal computer in
storage mode or NON storage mode, set storage mode in order to
en sure accurate data transmission.
4-10. Selection of program for data transmission
Run the sim ple test program to ensure satisfactory execution of program
by sending the function command the instrument and by checking the data
received from instrument ("Sl" command) . This simple test program
checks whether it is possible to communicate with system. The program
shall be subject to the personal computer which runs the program
itself. Read the computer operation manual carefully prior to
transmi ssion in order to ensure data buffer area and to set the
separating character.
102
4-11. Majo r reason s of abno rma l data transmi ssion
In case data are not tran smitted satisfactorily, chec k the followin gs
(J) Cable is not wired in acco rdance with fig. 4-2.
(2) "51" comman d is not executed in the first plac e.
0) Th ere may occur erro r in da ta receptio n function at 9600 baud.
(4) The re ma y occur error in EQUIVALE NT o r MA G mo de at the rate higher
than 4800 ba ud.
(5) Th e instrument mode doe s not concide with perso na l computer
commun ication mode.
(6) The personal co mputer port setting (COM I or COM 2) is not
co rrect.
(7) If co mm unication mode is changed, tum the instrument power off
and on.
4-12. P rogramming exa mple
Following is th e example of program s executed when the instrument is
connected with person al computer. Before co nnecting person al computer,
set the instrument in reference to the communication mode as described
in paragraph 3.4 (2). In th is section, the programs for the person al
comp uter compatible with IBM personal co mputer is used as an example of
eac h functi on command.
Input signa l
RS-232C interface cable (Fig. 4-2)
0 5-3020D
oscilloscope
e---'
'---
103
personal
computer
Following communication mode is used as an example of program.
( a) Baud rate : 4800 BAUD
( b) Data form : START BIT + 8 BIT + 1 STOP BIT
( c) Separa ting cha racter : CIR
( DIP S/W o n oscilloscope side )
I
NO' 1
state
0=
1 2 ~
( Com puter program side )
OPEN "COMl (or COM2) : 4800. N, 8, I, CS , OS, CD" FOR RANDOM AS # 1
104
( l) P rogram example I
"Sl" co mma nd
"S I" co mma nd is alway executed in the first place. This is a progra m
to check that co mmunication func tion is ena bled.
Pro gram example
Th e following program is the program for IBM compatible person al
compu ter.
10
• • •• 51 COMMAND • •• ••
20
30
40
50
60
70
80
90
H10
110
120
• • •• EXECUTE THIS PROGRAM UNTIL RTNS IS A(HEX41 )
OPEN "COM2: 4800. N. 8.1. CS. OS. CO" FOR RANDOM AS #1
PRINT #1. "SI "
LINE INPlIT #1. RTNS
RTN : ASC(RTNS)
IF RTN <> &H41 THEN 100
PRINT " RI RllTURN- "; RTNS
GOTO 110
PRINT "ERROR STATUS- " ; RTN
CLOSE #1
END
( Explanatio n) By running " SI" co mma nd in the first place . it is
possible to check wheth er it is possible to co mm unicate
with computer ( tra nsmissio n/ receptio n). This sho uld be
repeated until in strument sends response "A" ( Hex 4 1) .
105
( 2) P rogra m exam ple 2 " Ri " co m m an d
T hi s program recei ves 50 wo rds o f CHI wa veform from ze ro add ress using
" Ri" co m m a nd .
P rog ra m exam ple 2-1 : A SC II code conversion; IBM co mpatib le personal
co m puter
10
20
30
40
50
60
70
80
90
100
11 0
120
130
140
** •• Ri (mmmm, nnnn.X) COMMAND •••••
i --- - > 1 : d ls p lay .me mory c hi
2: di sp l a y memo ry c h2
3: SAVE memo r y A
4 : SAVE me mo r y B
mmmm ->
sta rt a ddress
nnnn - >
data numbe r
OPEN "COM2: 48 00, N,8, I , CS, DS. CD" FOR RANDOM AS # 1
PRINT #1. "Rl (001l0. 00 50. A) "
LINE INPUT #1. RTNS
PRI NT " RI RUTIJRN=" ; RTNS
CLOSE #1
END
P rogram ex am ple 2-2
10
20
3~
40
50
60
70
B0
90
100
110
120
130
Binary code co n versio n. IBM com p atib le
personal co m pute r
**.* Ri( mmmm,nnnn,X) COMMAND • • *• •
DRAW BINARY DATA FORM
•• •••••••• ••• •••••••••• ••• •••• • • • •
OPEN "COM2 : 4800. N. B. I. CS, DS. CD" FOR RANDOM AS # 1
PRI NT #1, "Rl (0000,0050. B)"
RTNS = INPUTS04 . I )
FOR I = 1 TO 49
WRKS
INPUTS 0 , 1)
RTNS = RTNS + MI DS (STRS (ASC (WRKS) ) , 2) +
NEXT I
PRINT " Rl RUTURN="; RTNS
CLOSE #1
END
I O!>
(3) P rogram example 3 "Ro· comma nd
This program receive s and displays the sweep trace mem ory A
measu rement co nd ition data using "Ro" co mma nd.
P rogram example 3 : IBM co mpatible personal co mputer
10
20
30
40
50
60
70
• ••• Ro(i) COMMAND •••••
OPEN "COM1: 4800. N. 8. 1. CS, OS, CD" FOR RANDOMAS #1
PRINT #1. "Ro (3) "
LINE INPUT #1, RTNS
PRINT "Ro RUTURN- "; RTNS
CLOSE #1
END
!07
(4) Program example 4 "W i" comma nd
Thi s program writes data in sweep trace memory A using "wi" command.
Th e 0 thru 999 add ress waveform da ta a re written in sweep trace me mory
as sho wn in fig. 4-3.
Program ex ample 4-1
10
20
30
40
50
60
70
80
90
100
110
120
130
140
150
160
170
180
190
200
210
220
230
240
250
260
270
280
290
300
310
320
330
340
350
360
370
380
ASC II code conversion
••• WI (mmmm.nnnn.x) COMMAND (GW-BASIC) ••••
DI M AS( 1000)
CNT ~ 0
FOR 1 = 1 TO 2
FOR B = 1 TO 250
IF B > = 100 THEN BS = MI OS ( STRS (B) . 2. 3 )
IF B < 100 THEN BS = " 0" + MlDS (STRS CBl. 2.
IF B < 10 THEN BS • " 00 " i MI DS ( STRS (B) . 2.
AS CB + CNT • 250 ) = B$ + " v "
NEXT B
CNT = CNT ' 1
fOR B = 1 TO 250
C = 251 - B
IF C >= 100 'mE N BS = MI OS (STR$ (C) . 2. 3 )
IF C < 100 TIlEN BS = "0" + MlDS (STRS (C) . 2.
IF C < 10 THEN BS • "00" + MlDS (STRS (C) . 2.
AS (B + CNT • 250) = BS + '', "
NEXT B
CNT = CNT + 1
NEXT I
OPEN "COM2 : 4800. N. 8. 1. CS. OS. CD" FOR RANDOM AS #1
PRINT # 1, " W3 (0000. 1000. A)"
LINE INPUT # 1. RTN$
RTN ' ASC(RTNS)
IF RTN <> &H41 THEN 360
PRINT " Wi COMMAND PASS"
PRINT # 1. " #3@. 0000. 1000. ":
FOR I = 1 TO 999
PRl/iT # 1, AS (I) :
NEXT I
PR I NT #1. AS(l)
LI NE I NPUT #1 . RTNS
RTN = ASC(RTNS)
I F RTN <> &H4 1 THEN 360
GOTO 370
PRI NT " ERROR STATIJS·": HEXS( RTN)
CLOSE #1
END
lOX
2)
1)
2)
1)
Program exa mple 4-2
10
20
30
40
50
60
70
80
90
100
110
120
130
140
150
160
170
180
190
200
210
220
230
240
250
260
270
280
290
300
310
320
330
340
350
ASCII code conversion
•• • WI (mmmm,nnnn, x) COMMAND (GW-BASIC) ••••
binary data t rans
DI MAS (1000)
CNT - 0
FOR I - 1 TO 2
FORB -1T0250
BS - CHRS (B)
AS(B + CNT • 250) - BS
NEXT B
CNT - CNT + 1
FOR B -1 TO 250
C - 251 - B
BS - CHRS (C)
AS (B + CNT • 250) - BS
NEXT B
CNT - CNT + 1
NEXT 1
OPEN "COM2 : 4800, N, 8, 1, CS, DS, CD" FOR Ro\NDOMAS #1
PRINT #1, "W3(0000, 1000, B)"
LINE INPlIT #1, RTNS
RTN - ASC(RTNS)
IF RTN <> &H41 THEN 330
PRINT "Wi COMMAND PASS"
PRINT #1, "#3@,0000,1000, " ;
FOR I - 1 TO 999
PRINT #1, AS ( 1) ;
NEXT I
PRINT #1. AS (1)
LINE INPlIT #1. RTNS
RTN - ASC(RTNS)
IF RTN <> &H41 THEN 330
GOTO 340
PRINT "ERROR STATUS-"; HEXS (RTN)
CLOSE #1
END
109
(5) Program example 5 ·Wo" command
This program registers the measurement condition data stored
trace memory A using "Wo" command.
10
20
30
40
50
60
70
80
90
100
110
120
130
140
150
160
170
180
190
200
210
220
230
••• Wo (i ) COMMAND (GW-BASIC) ••• .
' memor y number
DATS · DATS + "#3@, "
'vertical mode
DATS · DATs + "CHI , "
DATS - DATs + "A,"
' hor i zont a l mode
DATS · DATS + "50ms
'A TimelDiv
DATS · DATS + "20ms
' B TimelDiv
DATS · DATS + "CAL ,
' vol t CAL
DATS · DATS + "PI0X,"
' probe factor
DATS · DATS + "0. 5V
' vol t slDi v
'delay amount
DATS · DATs + "10DI V
' No of sweep
DATS · DATS + " I ,
OPEN "COM2: 4800, N,8, 1. CS, DS, CD" FOR RANDOM AS #1
PRINT #1. "Wo(3) "
LINE INPUT #1, RTNS
RTN · ASC(RTNS)
IF RTN <> &1141 THEN 230
PRINT "Wo COMMAND PASS"
PRINT #1, DATS
LINE INPUT #1. RTNS
RTN · ASC(RTNS)
IF RTN <> &114 1 THEN 230
GOTO 240
PRINT "ERROR STA11JS·" : HEXS (RTN)
240 CLOSE #1
250 END
I III
III
sweep
5. USE R M AI NTE NAN C E GUIDE
In order for you to usebetterthis instrument, OS<mOODSRS. please refer to
the following. And if any failure occurs during U ~. please contact the
EZ D igital service center for professional repair service .
5-1. Cleaning
If the outside of th e case is stai ned , remove the stain by wipi ng it
lightly with cloth moistened with neutral dete rgent, an d then wipe out
the cleaned surface again with a dry cloth. In case where the surface
got rusty, wipe the surface with cloth satu rated with alco hol. Do not
use stro ng volatile solvents such as benzine or th inner.
When you clean the surface of the C RT, wipe out the surfaces of the
filter and the CRT carefully with soft clot h mo istened with mild
detergent afte r having the fron t case and the filter disassembl ed
first. U nde r no circumstances sha ll the ab ras ive o r stro ng solvents be
used. And then, reassemble the filter and front case after hav ing them
thorou ghl y dried so as to prevent dew from being form ed on their
surfaces. Take care not to leave any h and mark o r the like on the
surface of th e CRT or filter.
5-2. Ca libration
To maintain the accuracy of the measurement, calibration of OS-3000DSRS
sho uld be performed at least every 1000 service hours when the
instrument is used continuou sly, and every 6 months when used
intermittently. So far as the calibration of thi s instrument is
co ncerned, plea se co ntact the EZ Digital , ca libration and
inspection agency authori zed by the government.
Fit TER
FR ON T CASE
.
I
Fig. 5-1. FILTER DISASSEMBLYING
III
h. OS-31NNIDSRS DIAl ;IL\i\IS
6-1.
External Views
OS- 30200 / 0 S- 30400 / 0 S- 30600
:~
f I
ILJ
•
" "•
<
•
.
>
11 2
6-2.
Block Di agra m
,,
,
,,
,
,
,
,,
,,
,' ,,
- -.,
-, ,
~
,
,
,
,
,
,
,,
,
,,
s ::
I. ,' ,,
i
I
__ _ _ _ _ .J
I
I
,
,
,,
,
,
,
,
,
,,
,
,
,,
,
,,
,, - - -- .
,.
,
, ~
,,,
,,
,
,,
,
,,,
,
,,,
,,
,,
,,
,,
,,
,,
,
,
II :,
~.
·: :~:r·
.- - - -- -'
,
"
'
~ a: :: :--:: :;:
_
-- -
,
~
__ _ ,
U::'
I
i
113
; ~ ,""
I
i~
I
3 I
-- I -- '
II
_ _
:
I
I
~·w:
:'TIJ. ','
,--- -- '
_.....
,:
"
i
~,
'
j
:
'
I
The specifications are subjected to change without notice.