1
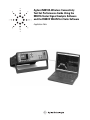
Agilent N4010A Wireless Connectivity
Test Set Performance Guide Using the
89601A Vector Signal Analysis Software
and the 89607A WLAN Test Suite Software
Application Note
Table of Contents
Introduction
Product Overview
Introduction… . . . . . . . . . . . . . . . . . . . . . . 2
Product Overview . . . . . . . . . . . . . . . . . . . 2
N4010A/89601A Features . . . . . . . . . . . . 4
Performance Summary . . . . . . . . . . . . . . . 5
Time and Waveform . . . . . . . . . . . . . . . . . 6
Measurement, Display, and Control. . . . . 7
Software Interface. . . . . . . . . . . . . . . . . . . 9
Vector Modulation Analysis
(Option 89601A-AYA) . . . . . . . . . . . . . . 10
Wireless LAN Modulation Analysis
(Option 89601A-B7R) . . . . . . . . . . . . . . 14
Wireless LAN Test Suite Software
(89607A) . . . . . . . . . . . . . . . . . . . . . . . . 18
Appendix:
Required hardware and software . . . . 19
Related Literature . . . . . . . . . . . . . . . . . . 20
This guide characterizes the
performance of the N4010A wireless
connectivity test set and the
89601A vector signal analysis (VSA)
software combination. The N4010A/
89601A combination adds the
flexible digital demodulation and
analysis capabilities of the 89601A
software to the frequency coverage
and capabilities of the N4010A.
This guide also characterizes the
performance of the N4010A and the
89607A wireless LAN (WLAN) test
suite software combination. The
N4010A/ 89607A combination allows
for quick and accurate standardsbased transmitter testing for
IEEE 802.11b/g formats.
N4010A wireless connectivity
test set
The N4010A is a test set designed to
quickly and accurately measure
emerging wireless connectivity
formats in the 2.4 GHz band. The
N4010A offers two bandwidth
selections of 5 and 22 MHz, making
the N4010A an ideal test platform
for Bluetooth™ and WLAN RF
measurements. The N4010A with
Bluetooth Option 101 is an effective
measurement tool for development,
integration, pre-qualification, and
volume manufacturing. Use Option
N4010A-101, with eight different
Bluetooth RF cases, for making
transmitter and receiver measurements as defined in the Bluetooth 1.1
RF test specification. The Bluetooth
test set also includes an internal test
sequencer to shorten test and development time. The N4010A with
WLAN Option 102 includes integrated source and receiver hardware to
verify that 802.11b/g modules and
devices meet their RF design
requirements.
89601A VSA software
The 89601A VSA software provides
flexible tools for making RF and
modulation quality measurements
on digital communication signals.
Analyze a wide variety of standard
and non-standard signal formats
with the 89601A software. Standard
signal presets cover GSM, EDGE,
cdmaOne, cdma2000, W-CDMA,
Bluetooth, 802.11a/b/g, and more.
For emerging standards, the 89601A
software series offers 24 digital
demodulators with variable center
frequency, symbol rate, filter type,
and filter alpha/BT. A user-adjustable
adaptive equalizer is also provided.
2
Quickly evaluate and troubleshoot
digitally modulated signals with the
modulation analysis tools in the
89601A software. Examine symbol
behavior with trellis/eye diagrams.
Use the constellation and vector
diagrams for an overall indication of
signal behavior and to obtain clues
to the cause of the problem. Take
advantage of the EVM, EVM
spectrum, and EVM time capabilities
for more sensitive examination of
signal errors.
Perform time domain analysis using
the 89601A software RF scope
capability. Evaluate pulse shape
with the main time display, select
specific portions of a burst for
analysis with the time gating
feature, and use statistical tools
such as CCDF and CDF to characterize the noise-like behavior of your
modern communication signal.
Simplify the characterization of your
signal with the zero-span spectrum
analysis tools in the 89601A analysis
software. With the wide selection
of spans available in the 89601A
software, match your measurement
span to your signal bandwidth, to
maximize signal-to-noise ratio (SNR)
analysis. FFT-based resolution
bandwidths down to less than 1 Hz
provide all the resolution needed for
frequency domain investigations.
A power spectral density (PSD)
function is useful for estimating
the level of the noise floor when
calculating SNR. Additionally, a
spectrogram display is provided for
monitoring the wideband behavior
of hopping signals over time.
89607A WLAN test suite software
The 89607A standards-based test
suite provides the convenience of
automatic, one-button test set-up
and execution. It also provides you
with the confidence of knowing your
design is being tested based on
the techniques, parameters, and
specifications set down in the IEEE
802.11a/b/g standards.
The 89607A WLAN test suite
software is ideal for characterizing
overall physical (PHY) layer performance of your WLAN transmitter.
Evaluate your transmitter design
against the IEEE standards. Take
advantage of its standardized tests
to qualify parts or do acceptance
testing. Use the software for
manufacturing test; you can even
modify the pass/fail limits to add
some margin between what IEEE
requires and what test you do.
N4010A/89601A/89607A
combination
In the N4010A/89601A combination,
the N4010A can be used as a wireless connectivity test set to link with
other Bluetooth devices and check
for correct operation by making
parametric measurements on the
device under test. Use the 89601A to
extend the testing capabilities of
the N4010A by measuring and
graphically displaying modulation
quality of your Bluetooth signal.
With the N4010A and Option
89601A-B7R or 89607A software,
the N4010A/89601A/89607A
combination can be used to test and
troubleshoot WLAN modules and
devices. The N4010A with Option
89601A-B7R can be used for flexible
modulation analysis to quickly
locate design problems. The N4010A
with the 89607A software can be
used test WLAN modules to the
specifications set down in the IEEE
802.11b/g standards with onebutton pass/fail testing.
This combination can measure
active signals or signals captured in
the N4010A’s memory. The N4010A
or the N4010A/89601A combination
can examine active signals. Switching
between the two products is
facilitated by an easy disconnect/
restart menu selection in the
89601A user interface.
The 89601A/89607A software runs
on a PC connected to the N4010A
via LAN, USB, or GPIB and provides
hardware control, modulation analysis, evaluation, and troubleshooting
along with complete results displays.
The controls and display of the
N4010A are disabled while operating the 89601A/89607A software.
3
N4010A/89601A Features
The N4010A/89601A combination
requires a PC for the software’s
operation. Detailed configuration
requirements for the N4010A, the
software, and the PC are provided in
the appendix.
N4010A feature availability
89601A feature availability
When the N4010A is controlled by
the 89601A software, users have
control of the following features via
the 89601A software
When the 89601A software is used
with the N4010A, almost all of the
features of the 89601A and its
options are available. (See the
appendix for details.)
Frequency: the center frequency of
the N4010A is controlled and the
89601A software displays its
current setting
Span: zero-span only. Maximum
setting is 22 MHz. Zero-span
control and the display of its
current setting are provided by the
89601A software
Triggering: IF magnitude, external
TTL, level, delay, and slope
External reference: 10 MHz
Disconnect/restart: pause the
89600 software to gain immediate,
direct access to all of the N4010A’s
features by using the disconnect
capability on the VSA software’s
control menu
These features include
• recording of time waveforms,
allowing you to re-analyze signals
and store them for future
comparisons
• 24 flexible digital demodulators
settable in center frequency,
symbol rate, filter type, and filter
α/BT
• a complete set of vector signal
analysis and modulation analysis
displays including: constellation,
eye diagram, EVM spectrum, EVM
spectrum, EVM time, error screens,
multiple trace displays, and a
spectrogram display
• flexible marker capabilities
including time gating, integrated
band power, and offset (delta)
markers
• a link to Agilent signal sources for
download and playback of signals
in the signal capture memory
• complete save and recall of your
signals, trace data, and measurement screens
• easy cut and paste to other PC
applications
The 89601A software’s swept
spectrum analysis capability is not
supported.
4
Performance Summary
Frequency range
Option N4010A-101 or 102
The following is a summary of the
features and capabilities provided
by the N4010A in combination with
the 89601A software. These are
nominal values and are not
warranted.
2.381 to 2.519 GHz (for 22 MHz span)
Center-frequency tuning resolution
1 MHz
Frequency span range
< 10 kHz to 22 MHz
Frequency points per span
Calibrated points
Displayable points
51 to 102,401
51 to 131,072
Resolution bandwidth (RBW)
The range of available RBW choices is a function of the selected
frequency span and the number of calculated frequency points.
Users may step through the available range in 1-3-10 sequence
or directly enter an arbitrarily chosen bandwidth.
RBW range
< 100 Hz to > 1.68 MHz
RBW shape factor
The window choices below allow you to optimize the RBW shape as
needed for best amplitude accuracy, dynamic range, or response to
transient signal characteristics.
Window
Flat top
Gaussian top
Hanning
Uniform
Input range
Amplitude accuracy
S/N ratio
0 dBm input
2.37 to 2.53 GHz
Selectivity
(3:60 dB)
0.41
0.25
0.11
0.0014
Passband
flatness
0.01 dB
0.68 dB
1.5 dB
4.0 dB
Rejection
> 95 dBc
> 125 dBc
> 31 dBc
> 13 dBc
–70 to +23 dBm
±0.5 dB
> 44 dB (22 MHz bandwidth)
> 50 dB (5 MHz bandwidth)
5
Time and Waveform
Time record characteristics
In the 89601A software, measurements are based on
time records (for example, blocks of waveform samples
from which time, frequency and modulation domain data
is derived.) Time records have these characteristics:
Time record length
= (number of frequency points – 1)/span,
with RBW mode set to arbitrary, auto-coupled
Time sample resolutions
= 1/(k x span)
Where k = 1.28 for time data = zoom
Time capture characteristics
In time capture mode, the 89601A software captures
the incoming waveform in real time (i.e. gap free)
into high speed time capture memory. This data may
then be replayed through the software at full or
reduced speed, saved to mass storage, or transferred
to another software application.
When post-analyzing the captured waveform, users
may adjust measurement span and center frequency
in order to zoom in on specific signals of interest, as
long as the new measurement span lies entirely
within the originally captured span.
6
Time capture memory size
500 ksamples (complex samples for spans
≤ 5 MHz; real samples for spans > 5 MHz)
Time capture length versus span
5 ms, 5 MHz < span ≤ 22 MHz
50 ms, spans ≤ 5 MHz
Measurement,
Display, and Control
Triggering
Trigger types
Vector signal analyzer
Free run, IF magnitude, external TTL
Internal trigger range
–65 to +23 dBm for 5 MHz bandwidth
–60 to +23 dBm for 22 MHz bandwidth
Pre-trigger delay range
4.5 ms or time capture length, whichever is shorter
Post-trigger delay range
5.2 ms
Trigger hold-off
20 ns to 0.65 ms
Averaging
Number of averages, maximum
> 108
Overlap averaging
0 to 99.99%
Average types
Vector signal analyzer application
rms (video), rms (video) exponential, peak hold,
time, time exponential
Time gating
Provides time-selective frequency-domain analysis on
any input or analog demodulated time-domain data.
When gating is enabled, markers appear on the time
data; gate position and length can be set directly.
Independent gate delays can be set for each input
channel. See time specifications for main time length
and time resolution details.
Gate length, maximum
Main time length
Gate length, minimum
= window shape/(0.3 x freq. span)
where window shape is equal to:
Flat-top window
3.8
Gaussian-top window
2.2
Hanning window
1.5
Uniform window
1.0
7
Marker functions
Peak signal track, frequency counter, band power
Band power markers
Markers can be placed on any time, frequency, or
demodulated trace for direct computation of band
power, rms square root (of power), C/N, or C/No,
computed within the selected portion of the data.
Trace math
Trace math can be used to manipulate data on each
measurement. Applications include user-defined
measurement units, data correction, and normalization.
Operands
Measurement data, data register, constants, jω
Operations
+, –, x, /, conjugate, magnitude, phase, real,
imaginary, square, square root, FFT, inverse FFT,
windowing, logarithm, exponential, peak value,
reciprocal, phase unwrap, zero
Trace formats
Log mag (dB or linear), linear mag, real (I), imag (Q),
wrap phase, unwrap phase, I-Q, constellation,
Q-eye, I-eye, trellis-eye, group delay
Trace layouts
1 to 4 traces on one, two, or four grids
Number of colors
User-definable palette
Spectrogram display
8
Types
Color – normal and reversed
Monochrome – normal and reversed
User colormap – 1 total
Adjustable parameters
Number of colors
Enhancement (color-amplitude weighting)
Threshold
Trace select
When a measurement is paused any trace in the
trace buffer can be selected by trace number. The
marker values and marker functions apply to the
selected trace.
Z-axis value
The z-axis value is the time the trace data was
acquired relative to the start of the measurement.
The z-axis value of the selected trace is displayed
as part of the marker readout.
Memory
Displays occupy memory at a rate of 128 traces/MB
(for traces of 401 frequency points)
Software Interface
The 89601A software appears to
other Windows® software as an
ActiveX® object. Implemented
according to the industry-standard
Component Object Model (COM), the
software exposes a rich object model
of properties, events, and methods,
as fully described in the 89601A
documentation.
Software development environments
that are capable of interacting with
COM objects include Agilent VEE,
Microsoft® Visual Basic®, Microsoft
Visual C++®, MATLAB®, National
Instruments® LabVIEW, and others.
In addition, many end-user applications are able to interact directly
with COM objects using built-in
macro languages such as Visual
Basic for Applications (VBA). For
example, in Microsoft Excel®, a VBA
macro could be used to set up the
instrument, collect the measurement
data, and automatically graph the
results.
Macro language
The 89601A’s built-in Visual Basic script interpreter allows many
types of measurement and analysis tasks to be easily automated.
Scripts may be developed using any text editor, or may be recorded
automatically from a sequence of menu selections. Completed
scripts may be named and integrated onto the analyzer’s toolbar,
allowing them to be launched with a single button press.
Remote displays
To operate the 89601A/N4010A combination or view its displays
from a remote location, the use of commercially-available remote
PC software such as Microsoft NetMeeting® or Symantec
pcAnywhere® is recommended.
Remote programming
Beginning with Microsoft Windows NT® 4.0, COM objects on
one PC are accessible from software running on another PC.
This capability, known as Distributed COM (DCOM), makes
the 89600 object model fully programmable from any other
PC having network connectivity to the N4010A’s host PC.
File formats
For storage and recall of measured or captured waveforms,
spectra, and other measurement results:
ASCII
Tab-delimited (.txt), comma-delimited (.csv)
Binary
Agilent standard data format (.sdf, .cap, .dat)
Binary
Agilent E3238 time snapshot (.cap) and time
recording (.cap) files under 2 Gsa in size.
No additional calibration.
MATLAB 5
MAT-file (.mat)
Source
In source mode the 89601A software can control a signal
generator via GPIB or LAN. Control is provided via the
VSA GUI. Frequency and level control of CW signals is
provided. Arbitrary signals may be downloaded from the
time capture memory to the signal generator for replay.
The same time record may be played over and over
contiguously. A window function can be applied to
smooth start-up and finish of replay.
Compatible sources
ESG-D or ESG-DP (firmware version B.03.50 or
later), with the Option E44xxA-UND internal dual
arbitrary waveform generator (firmware version
1.2.92 or later). E4438C with internal baseband
generator Option E4438C-001 or E4438C-002.
E8267C vector signal generator with Option
E8267C-002 internal baseband generator.
Signal types
CW (fixed frequency sinewave)
Arbitrary
Frequency range
Determined by signal generator
Level range
–136 to 20 dBm in 0.02 dBm steps
For all other specifications see the technical
data sheet for the signal generator used.
9
Vector Modulation Analysis
(Option 89601A-AYA)
Note that analysis and presets are
only valid over the frequency range
of the N4010A-101/102.
Signal acquisition
Note: Signal acquisition does not require
an external carrier or symbol clock
Data block length
Adjustable to 4096 symbols
Samples per symbol
1 – 20
Symbol clock
Internally generated
Carrier lock
Internally locked
Triggering
Single/continuous, external, pulse search
(searches data block for beginning of TDMA burst
and performs analysis over selected burst length)
Data synchronization
User-selected synchronization words
Supported modulation formats
Carrier types
Continuous and pulsed/burst (such as TDMA)
Modulation formats
2, 4, 8, and 16 level FSK (including GFSK)
MSK (including GMSK)
QAM implementation of BPSK, QPSK, OQPSK,
DQPSK, D8PSK, π/4DQPSK, 8PSK, 3π 8PSK (EDGE)
8
16QAM, 32QAM, 64QAM, 128QAM, 256QAM
(absolute encoding)
16QAM, 32QAM, 64QAM
(differential encoding per DVB standard)
8VSB, 16VSB
Single-button presses for
Cellular
CDMA (base), CDMA (mobile), CDPD, EDGE, GSM,
NADC, PDC, PHP (PHS), W-CDMA
Wireless networking
Bluetooth, HIPERLAN/1 (HBR), HIPERLAN/1 (LBR),
802.11b
Digital video
DTV8, DTV16, DVB16, DVB32, DVB64
Other
APCO 25, DECT, TETRA, VDL mode 3
Filtering
Filter types
Raised cosine, square-root raised cosine, IS-95
compatible, Gaussian, EDGE, low pass, rectangular,
none
Filter length
40 symbols: VSB, QAM, and DVB-QAM where
α < 0.2
User selectable alpha/BT
Continuously adjustable from 0.05 to 10
User-defined filters
User-defined impulse response,
fixed 20 points/symbol
Maximum 20 symbols in length or 401 points
10
Maximum symbol rate
Symbol rate is limited only by the measurement
span; that is, the entire signal must fit within the
analyzer’s currently selected frequency span.
Example: with raised-cosine filtering
Max symbol rate*=
frequency span
1+α
*Maximum symbol rate doubled for VSB
modulation format
Measurement results (formats other than FSK)
I-Q measured
Time, spectrum (filtered, carrier locked,
symbol locked)
I-Q reference
Time, spectrum (ideal, computed from
detected symbols)
I-Q error versus time results
Magnitude, phase (I-Q measured versus reference)
Error vector
Time, spectrum
(vector difference between measured and reference)
Symbol table and error summary
Error vector magnitude is computed at symbol
times only
Instantaneous
Time, spectrum, search time
Measurement results (FSK)
FSK measured
Time, spectrum
FSK reference
Time, spectrum
Carrier error
Magnitude
FSK error
Time, spectrum
Display formats
The following trace formats are available for
measured data and computed ideal reference data,
with complete marker and scaling capabilities, and
automatic grid line adjustment to ideal symbol or
constellation states.
Polar diagrams
Constellation
Samples displayed only at symbol times
Vector
Display of trajectory between symbol times with
1 – 20 points/symbol
I or Q versus time
Eye diagrams
Adjustable from 0.1 to 40 symbols
Trellis diagrams
Adjustable from 0.1 to 40 symbols
Continuous error vector magnitude versus time
Continuous I or Q versus time
11
Error summary (formats other than FSK)
Measured rms and peak
values of the following:
Error vector magnitude, magnitude error, phase
error, frequency error (carrier offset frequency),
I-Q offset amplitude droop (PSK and MSK formats),
SNR (8/16VSB and QAM formats), quadrature
error, gain imbalance
For VSB formats, VSB pilot levels is shown
in dB relative to nominal. SNR is calculated
from the real part of the error vector only.
For DVB formats, EVM is calculated without
removing IQ offset.
Error summary (FSK)
Measured rms and peak values of the following:
Detected bits (symbol table)
Binary bits are displayed and grouped by
symbols. Multiple pages can be scrolled for
viewing large data blocks. Symbol marker
(current symbol shown as inverse video) is
coupled to measurement trace displays to
identify states with corresponding bits. For
formats other than DVBQAM and MSK, bits
are user-definable for absolute states or
differential transitions.
Note: Synchronization words are required to
resolve carrier phase ambiguity in non-differential
modulation formats.
12
FSK error, magnitude error, carrier offset frequency,
deviation
Accuracy (nominal)
Formats other than FSK, 8/16VSB and OQPSK
Conditions: Specifications apply for a full scale
signal at 2.4 GHz, 0 to –55 dBm signal level
Residual EVM
span = 5 MHz
span = 22 MHz
Frequency error
(added to frequency accuracy if applicable)
< 2.0% rms
< 2.0% rms
symbol rate/500,000
Adaptive equalizer
Removes the effects of linear distortion (e.g.
non-flat frequency response, multipath, etc.)
from modulation quality measurements.
Equalizer performance is a function of the setup
parameters (equalization filter length,
convergence, taps/symbol) and the quality of
the signal being equalized.
Equalizer type
Decision-directed, LMS, feed-forward equalization
with adjustable convergence rate
Filter length
3 to 99 symbols, adjustable
Filter taps
1, 2, 4, 5, 10, or 20 taps/symbol
Measurement results provided
Equalizer impulse response
Channel frequency response
Supported modulation formats
MSK, BPSK, QPSK, OQPSK, DPQPSK, π/4DQPSK,
8PSK, 16QAM, 32QAM, 64QAM, 128QAM,
256QAM, 8VSB, 16VSB, 3π/8 8PSK (EDGE), D8PSK
13
WLAN Modulation Analysis
OFDM modulation analysis
(Option 89601A-B7R)
Signal acquisition
Note that analysis is only valid
over the frequency range of the
N4010A-101/102.
Supported standards
802.11a, HiperLAN2, and 802.11g (OFDM)
Modulation formats
BPSK, QPSK, 16QAM, 64QAM
(auto detect or manual override)
Search length
Minimum
Result length + 6 symbol times (28 µs)
Maximum
5.18 ms
Result length
Auto detect or adjustable from 1 to 1289 symbols
Triggering
Single/continuous, free-run/channel/external
Measurement region
Length and offset adjustable within result length
Signal playback
Capture length
~5 ms (5MHz < span ≤ 22 MHz)
Adjustable parameters
Data format
IEEE 802.11a/g OFDM, IEEE 802.11g DSSS-OFDM
HiperLAN2
Single button presets
IEEE 802.11a/g OFDM, IEEE 802.11g DSSS-OFDM
HiperLAN2
I-Q normalize
On/Off
Sub-carrier spacing
Continuously adjustable
Symbol timing adjust
Adjustable between 0 and guard interval
Guard interval
1/4, 1/8 (HiperLAN2 only), adjustable between
0 and 1 in 1/64 increments
Pilot tracking
Phase, amplitude, timing
Carriers to analyze
All or single
Demodulation measurement results
14
I-Q measured
All carriers over all symbol times
I-Q reference
All carriers over all symbol times (reference
computed from detected symbols)
Error vector
Time, spectrum (for each carrier and symbol in the
frame)
RMS error vector
Time, spectrum
Common pilot error
Phase, magnitude
Symbol table and error summary
EVM, pilot EVM, CPE (common pilot error), IQ
(origin) offset, frequency error, symbol clock, sync
correlation, number of symbols, modulation format,
code rate, bit rate
Equalizer measurement results
Equalizer impulse response
Computed from preamble
Channel frequency response
Computed from preamble
Pre-demodulation measurement results
Time
Instantaneous
Spectrum
Instantaneous, average
Search time
Instantaneous
Display formats
Error vector spectrum
Error values for each symbol time plotted for each
carrier
Error vector time
Error values for each carrier plotted for each
symbol time
Accuracy (nominal)
Residual EVM
< 2% rms
Residual constellation error
–34 dB
Frequency error (relative to frequency standard)
Lock range
±624 kHz (±2 x sub-carrier spacing)
Accuracy
1 kHz
15
DSSS modulation analysis
Signal acquisition
Modulation format
Auto detect or manual override: Barker1, Barker2,
CCK5.5, CCK11, PBCC11, PBCC22, PBCC33
Preamble
Auto detect (short, long)
Search length
Adjustable between result length and 5.19 ms
Result length
Auto detect or adjustable from 1 to 5718 chips
Triggering
Single/continuous, free-run, channel, external
Measurement region
Interval and offset adjustable within result length
Signal playback
Capture length
~5 ms (5MHz < span ≤ 22 MHz)
Supported formats
Formats
IEEE 802.11b including optional short preamble and
optional PBCC modes
IEEE 802.11g/D3.0 including PBCC22 and PBCC33
modes
Single-button presets
DSSS/CCK/PBCC
Adjustable parameters
16
IQ normalize
On/Off
Mirror frequency spectrum
On/Off
Chip rate
Continuously adjustable
Clock adjust
Continuously adjustable between ±0.5 chips
Equalizer
On/Off
Equalizer filter length
3 to 99 chips
Descrambler mode
On/Off, preamble only, preamble, header only
Demodulation measurement results
IQ measured
IQ measured time, IQ measured spectrum,
instantaneous IQ measured spectrum
IQ reference
IQ reference time, IQ reference spectrum,
instantaneous IQ reference spectrum
Other IQ error traces
IQ magnitude error, IQ phase error
Error vector
Error vector time, error vector spectrum,
instantaneous error vector spectrum
Despread symbols
Preamble, header, data
Symbol and error table summary
802.11b 1,000-chip peak EVM, EVM, magnitude
error, phase error, IQ offset, frequency error, sync
correlation, burst type, bit rate, number of data
octets, data length
Equalizer measurement results
Equalizer impulse response
Computed from preamble
Channel frequency response
Computed from preamble
Pre-demodulation measurement results
Time
Main raw, search
Spectrum
Instantaneous
Other
CCDF, CDF, PDF
Display formats
Error vector spectrum
Error values for each symbol time plotted for each
carrier
Error vector time
Error values for each carrier plotted for each
symbol time
Accuracy (nominal)
Residual EVM
≤ 2 % rms
Frequency error (relative to frequency standard)
Lock range
±2.5 MHz
Accuracy
1 kHz
17
WLAN Test Suite Software
Specifications (nominal)
(89607A)
Standard
IEEE 802.11g
IEEE 802.11b
Total power accuracy
±0.5 dB1,2
±0.5 dB1,2
Center frequency tolerance
±1 kHz2
±1 kHz2
Clock frequency tolerance
±0.5 ppm2
±0.5 ppm2
Residual constellation error
–34 dB
—
Speed standards-based testing of
your 802.11b/g WLAN transmitter
with the 89607A WLAN test suite
software and the N4010A. This
standards-based test suite provides
the convenience of automatic
one-button test set-up and execution
with the confidence of knowing your
design is being tested based on the
techniques, parameters, and
specifications set down in the
IEEE 802.11b/g standards.
Residual RMS EVM
—
< 2%
Residual center frequency leakage
–70 dBm
–70 dBm
Spectral flatness
±0.5 dB
±0.5 dB
Maximum burst length
1288 symbols
5.19 ms
Estimated test time
(with/without spectral mask test)3
22 s /6 s4
19 s/8 s5
802.11a/b/g WLAN tests
▲
The WLAN test suite software provides all of the
IEEE 802.11a/b/g WLAN transmitter tests. Test
set-up is easy. Click on the WLAN standard
you want, select the tests you want to use, then
click “ ”. The software does the rest. Whether you
want to use all of the tests to assure complete
assessment, or use a few tests to reduce overall test
time and speed device evaluation, the 89607A WLAN
test suite makes the process of test selection easy.
IEEE 802.11a/g tests
• transmit power
• transmit center frequency tolerance
• transmit clock frequency tolerance
• transmit modulation accuracy
• transmit spectral mask
IEEE 802.11b tests
• transmit power
• transmit center frequency tolerance
• chip clock frequency tolerance
• transmit RF carrier suppression
• transmit modulation accuracy
• transmit power up ramp
• transmit power down ramp
• transmit spectral mask
1. For a power range between +23 and –70 dBm,
frequency range 2.381 to 2.519 GHz.
2. For a temperature range of 20 to 30 °C.
3. Using USB 2.0 interface. Assumes 3 GHz Pentium®
4 computer running Windows XP. Increased CPU
performance improves test time.
4. Measured 20 frames with 16 data symbols, and
spectral mask test with 2 ms of capture and 80 MHz
total span.
5. Measured one packet with 282 µs packet length,
and spectral mask test with 2 ms of capture and
80 MHz total span.
18
Appendix
Required hardware and
software
Ordering an N4010A wireless
connectivity test set
89601A vector signal analysis
software
The following options must be
installed in the N4010A.
The N4010A/89601A combination
works with 89601A vector signal
analysis software version 5.20 or
greater.
Table 1. Options required in the N4010A
Option Description
89601A software
revision
101
or
Bluetooth
5.20 or greater
102
Wireless LAN
and
110
I/O connectivity
The following options must be
installed with 89601A software
Table 2. 89601A required options
5.20 or greater
Option
Description
200
and
300
Basic vector analysis software
Hardware connectivity
89607A WLAN test suite software
The N4010A/89607A combination
works with 89607A WLAN test suite
software version 5.20 or greater.
89601A VSA software is not required
with the purchase of 89607A.
PC for 89601A/89607A software
The 89601A/89607A requires a PC
connected via LAN or USB to the
N4010A in order to run. USB 2.0
interface is recommended for fastest
measurement speed. Either a laptop
or desktop PC may be used as long
as it meets or exceeds the following
minimum requirements1:
• > 300 MHz Pentium or AMD-K6
The following options are recommended for use with the 89601A
software
Table 3. Recommended options for
89601A software
Option
Description
AYA
Vector modulation analysis
B7R
WLAN Modulation Analysis
(OFDM and DSSS/CCK/PBCC)
• 128 MB RAM
(256 MB recommended)
• 4 MB video RAM
(8 MB recommended)
• Hard disk with 100 MB of available
space
• Microsoft Windows 2000, NT 4.0
(service pack 6a, or greater
required), or XP Professional®
• CD ROM drive (can be provided
via network access), 3.5 inch
floppy disk drive (can be provided
via network access)
• LAN or USB interface
1. For best immunity from electronic discharge (ESD),
use a desktop PC.
19
Related Literature
N4010A Bluetooth Test Set,
data sheet, literature number
5989-0251EN
N4010A Wireless LAN Tx/Rx Custom
Option, technical overview,
literature number 5988-0145EN
89600 Series Wide-Bandwidth
Vector Signal Analyzer, brochure,
literature number 5980-0723E
89607A WLAN Test Suite Software,
technical overview, literature
number 5988-9547EN
Agilent Technologies’ Test and Measurement Support,
Services, and Assistance
Agilent Technologies aims to maximize the value you
receive, while minimizing your risk and problems. We
strive to ensure that you get the test and measurement
capabilities you paid for and obtain the support you need.
Our extensive support resources and services can help
you choose the right Agilent products for your applications
and apply them successfully. Every instrument and system
we sell has a global warranty. Support is available for at
least five years beyond the production life of the product.
Two concepts underlie Agilent’s overall support policy:
“Our Promise” and “Your Advantage.”
Our Promise
Our Promise means your Agilent test and measurement
equipment will meet its advertised performance and
functionality. When you are choosing new equipment, we
will help you with product information, including realistic
performance specifications and practical recommendations
from experienced test engineers. When you use Agilent
equipment, we can verify that it works properly, help with
product operation, and provide basic measurement assistance for the use of specified capabilities, at no extra cost
upon request. Many self-help tools are available.
Your Advantage
Your Advantage means that Agilent offers a wide range of
additional expert test and measurement services, which
you can purchase according to your unique technical and
business needs. Solve problems efficiently and gain a
competitive edge by contracting with us for calibration,
extra-cost upgrades, out-of-warranty repairs, and onsite
education and training, as well as design, system integration, project management, and other professional engineering services. Experienced Agilent engineers and
technicians worldwide can help you maximize your productivity, optimize the return on investment of your Agilent
instruments and systems, and obtain dependable measurement accuracy for the life of those products.
Agilent Email Updates
www.agilent.com/find/emailupdates
Get the latest information on the products and
applications you select.
Agilent T&M Software and Connectivity
Agilent’s Test and Measurement software and connectivity
products, solutions and developer network allows you to
take time out of connecting your instruments to your computer with tools based on PC standards, so you can focus
on your tasks, not on your connections. Visit
www.agilent.com/find/connectivity
for more information.
By internet, phone, or fax, get assistance with all your
test & measurement needs
Phone or Fax
Pentium is a U.S. registered trademark of Intel Corporation.
Microsoft, Windows, Visual Basic, Visual C++, Excel,
NetMeeting, Windows NT, ActiveX, and XP Professional
are U.S. registered trademarks of Microsoft Corporation.
MATLAB is a U.S. registered trademark of The Math
Works, Incorporated.
Bluetooth is a trademark owned by the Bluetooth SIG, Inc.
Symantec pcAnywhere is a U.S. registered trademark of
Symantec.
United States:
(tel) 800 829 4444
(fax) 800 829 4433
Canada:
(tel) 877 894 4414
(fax) 905 282 6495
China:
(tel) 800 810 0189
(fax) 800 820 2816
Japan:
(tel) (81) 426 56 7832
(fax) (81) 426 56 7840
National Instruments is a U.S. registered trademark of
National Instruments.
Korea:
(tel) (080) 769 0800
(fax) (080)769 0900
Latin America:
(tel) (305) 269 7500
Taiwan:
(tel) 0800 047 866
(fax) 0800 286 331
Other Asia Pacific
Countries:
(tel) (65) 6375 8100
(fax) (65) 6755 0042
Email: [email protected]
Online Assistance:
www.agilent.com/find/assist
Product specifications and descriptions in this document
subject to change without notice.
© Agilent Technologies, Inc. 2003, 2004
Printed in USA, June 29, 2004
5989-0637EN