1
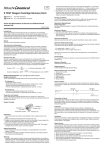
Handling Critical Values
If the result of a sample exceeds the measurement range, dilute the sample with
physiological saline solution, and repeat the measurement. Samples beyond the
measurement range will trigger the result of “>150 mg/L” or “*Limt*”. Samples below
the measurement range will trigger the result “<1mg/L”.
Performance Characteristics
Detection limit (per CLSI EP17-A)
The analytical detection limit was determined to be 0.7 mg/L. The quantitation limit
was determined to be 1 mg/L.
Reportable range
1 mg/L to 150 mg/L
Interference (per CLSI EP7-A2)
The data demonstrated that the CRP test system was not affected by high levels of
the following substances at the levels noted.
Routine Maintenance and Troubleshooting
For complete information on operation, see the User Manual for the HITACHI Clinical
Analyzer E40.
Hemoglobin: no interference up to 1000 mg/dL
Unconjugated bilirubin: no interference up to 50 mg/dL
Lipemia: no interference up to 2000 mg/dL
Ascorbic acid: no interference up to 50 mg/dL
Technical Support/ Instrument Service
1. First contact your local distributor
2. Hitachi Chemical Co., Ltd. (Japan)
Lack of interference was defined as recoveries between 90% and 110% of the neat
value, and assay performance claims were established on the HITACHI Clinical
Analyzer E40 by testing two serum pools containing approximately 12 mg/L and
80 mg/L CRP. The information presented is based on results from Hitachi studies
and is current at the date of publication. Hitachi makes no representation about the
completeness or accuracy of results generated by future studies.
Precision (per CLSI EP5-A2)
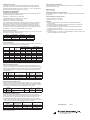
Three levels of serum samples were assayed 2 times per run, 2 runs per day, for total
of 20 days. The precision was found to be:
Level
1
2
3
n= 80 per level
Mean (mg/L)
6
16
122
SD (mg/L)
0.4
1.2
3.4
Reference
1.Tietz, Tietz Fundamentals of Clinical Chemistry, 4th Edition, WB Saunders
Company (1996)
2.CLSI Document EP5-A2, Evaluation of Precision Performance of Quantitative
Measurement Methods, Approved Guideline
3.CLSI Document EP6-A, Evaluation of Linearity of Quantitative Measurement
Procedures, Approved Guideline
4.CLSI Document EP7-A2, Interference Testing in Clinical Chemistry, Approved
Guideline
5.CLSI Document EP17-A, Protocols for the Determination of Limits of Detection and
Limits of Quantitation, Approved Guideline
%CV
7.3
7.7
2.8
Precision (POL sites)
Three levels of samples (A, B and C) were tested by three POL sites, six times a day
for five days. The precision estimates are described below.
Site #
Sample
Mean
(mg/L)
1
A
4
2
A
4
3
A
4
1
B
50
2
B
52
3
B
54
1
C
96
2
C
92
3
C
94
n = 30 replicates per sample per site
Within-run Precision
SD (mg/L)
%CV
0.2
5.9
0.4
12.4
0.4
11.6
1.9
3.8
1.5
2.8
1.2
2.3
5.1
5.3
4.0
4.3
3.5
3.7
Total Precision
SD (mg/L)
%CV
0.3
6.6
0.5
14.1
0.4
11.2
1.7
3.5
1.5
2.9
2.1
3.9
5.3
5.6
6.5
7.1
4.0
4.2
Patient Correlation (POL sites)
A series of approximately 55 serum specimens with CRP values ranging from 1 to
130 mg/L were assayed on the HITACHI Clinical Analyzer E40 at three sites using the
S TEST Reagent Cartridge C-Reactive Protein (CRP) (y) and a comparative method
as the reference method (x). Linear regression analysis (least squares) yielded the
following results:
Site
Range
n
Regression Equation
#
(mg/L)
1
56 1 to 122
y = 1.02x + 0.1
2
56 1 to 130
y = 1.06x - 0.2
3
55 1 to 125
y = 1.03x + 0.2
*95% Confidence Interval
CI*
Slope
0.99 1.00 to 1.04
0.99 1.05 to 1.08
0.99 1.01 to 1.05
“r”
CI*
Intercept
-0.5 to 0.6
-0.6 to 0.2
-0.4 to 0.8
Patient Correlation (laboratory site)
A series of 88 serum specimens with CRP values ranging from 1 to 125 mg/L were
assayed on the HITACHI Clinical Analyze E40 using the S TEST Reagent Cartridge
C-Reactive Protein (CRP) (y) and a comparative method as the reference method (x).
Linear regression analysis (least squares) yielded the following results:
Range
Regression Equation
(mg/L)
88
1 to 125
y = 0.99x + 0.1
*95% Confidence Interval
n
“r”
0.99
CI*
Slope
0.96 to 1.01
CI*
Intercept
-0.6 to 0.9
Serum/Plasma Comparison Study
A study was performed to validate the use of lithium heparin plasma, K3 EDTA
plasma and sodium citrate plasma as alternatives to serum for the HITACHI Clinical
Analyzer E40 with the S TEST Reagent Cartridge C-Reactive Protein (CRP). 45
matched serum/plasma samples that spanned the dynamic range were assayed in
singleton and the results were compared using least squares linear regression (plasma
= y-axis, each type). The performance characteristics were as follows.
Lithium
Heparin Plasma
Slope (CI*)
1.00 (0.98 to 1.01)
y-intercept (CI*)
-0.1 (-0.8 to 0.5)
r
0.99
n = 45 / Range (serum) = 1 to 123 mg/L
*95% Confidence Interval
K3 EDTA Plasma
Na Citrate Plasma
0.99 (0.97 to 1.00)
0.1 (-0.6 to 0.7)
0.99
1.00 (0.99 to 1.01)
-0.3 (-0.82 to 0.30)
0.99
80-7969-00-00
04/13
9-2, Marunouchi 1-chome, Chiyoda-ku,
Tokyo 100-6606, Japan