1
Scand J Clin Lab Invest 2000; 60: 367 ± 380
Examination of four different instruments for
measuring blood lactate concentration
J. I . ME D Bé, * A . MA MEN , { O . H OL T O L S E N{ & F . EVER TSE N { §
*National Institute of Occupational Health, Oslo, Norway; {Sogn og Fjordane College, Teacher
Training Faculty, Sogndal, Norway; {Norwegian Olympic Training Centre, Oslo, Norway;
§Norwegian University for Sports and Physical Education, Oslo, Norway
Medbù JI, Mamen A, Holt Olsen O, Evertsen F. Examination of four different
instruments for measuring blood lactate concentration. Scand J Clin Lab Invest
2000; 60: 367±380.
Information on the performance of different instruments used to measure blood
lactate concentration is incomplete. We therefore examined instruments from
Yellow Springs Instruments (YSI 23L and YSI 1500) and three cheaper and
simpler instruments: Dr. Lange's LP8z, Lactate Pro from Arkray in the KDK
corporation and Accusport from Boehringer Mannheim. First, a number of
blood samples were analysed by standard enzymatic photo¯uorometry (our
reference method) and, in addition, by one or more of the instruments
mentioned above. Second, measurements using two or more identical
instruments were compared. Third, since Lactate Pro and Accusport are small
(<100 g, pocket-size), battery-driven, instruments that could be used for
outdoor testing, the performance of these instruments was examined at
simulated altitudes (O2 pressure of v10 kPa) and at temperatures below
220³C, while screening the instruments as much as possible from the cold. Most
of the different instruments showed systematically too high or too low values
(10 ± 25% deviation). The observed differences between instruments may affect
the ``blood lactate threshold'' by 2 ± 5%. We found different readings between
``equal'' YSI 1500 instruments, while we could see no difference when comparing
the other instruments of the same type. Lactate Pro gave reliable results at both
221¡1³C and at simulated altitude. Accusport gave reliable results in the cold,
but 1.85¡0.08 mmol L21 (mean¡SD) too high readings at the simulated
altitude. Of the three simpler instruments examined, the Lactate Pro was at least
as good as the YSI instruments and superior to the other two.
Key words: Bicycling; blood; exercise; lactate; lactate threshold; plasma; testing;
training
Jon Ingulf Medbù, National Institute of Occupational Health, PO Box 8149 dep.,
N-0033-8149, Oslo, Norway. Tel. z47 23 19 51 00, fax. z47 23 19 52 01,
e-mail. [email protected]
367
368
J. I. Medbù et al.
IN T R O DUCT I O N
Blood lactate concentration is often measured
in connection with the training and testing of
athletes [1, 2] and also of patients [3]. Traditional methods in the laboratory are timeconsuming, but now faster and simpler methods
have been developed as a consequence of
technological development. Today there are
several different instruments that can be used
to measure the lactate concentration in a small
blood sample within a few minutes or less. We
have examined the properties and qualities of
different instruments.
All measurements are subject to some
random error, even if minimized as much as
possible. Systematic errors can also occur. One
aim of our study has been to compare the
imprecision of different instruments and to look
for possible systematic errors. In addition, we
have looked for possible differences between
instruments of the same type by measuring the
same blood sample on two or more similar
instruments. Two of the instruments examined,
the Lactate Pro2 from Arkray in the KDK
Corporation and the Accusport1 from Boehringer Mannheim, are battery-driven pocketsized instruments that might be suitable for
outdoor testing too. Thus, the performance of
these instruments was examined at simulated
altitude and in the cold. We also examined
instruments from Yellow Springs Instruments
(YSI 23L and YSI 1500) and the LP8z from
Dr. Lange. As our reference we used a standard
enzymatic photo¯uorimetric method.
taken during treadmill running, rollerskiing,
bicycling outdoors and as canoeing or rowing
on ergometers. In some experiments, described
in more detail elsewhere [2], blood was drawn
from catheters in the femoral artery and vein.
Otherwise capillary blood was taken from a
®nger after the hand had been warmed for at
least 30 s in tempered water. This procedure
increases the perfusion of the hand and makes it
easier to get enough blood for several samples
in sequence. Sweat contains lactate, and washing in water will also dissolve and thus remove
lactate on the skin that otherwise could
contaminate the blood. The skin was punctured
using a lancet and the ®rst drop of blood was
wiped off. Thereafter, blood was taken as
described in detail below.
In some experiments, blood samples were
taken in conjunction with intensive exercise to
exhaustion; in others as part of testing subjects
and ®nding their ``blood lactate threshold'' and
maximal O2 uptake. Finally, blood samples
were taken in some experiments with strenuous
exercise with a signi®cant anaerobic energy
release, but where the exercise was stopped
before exhaustion. We took around 800 blood
or plasma samples and measured them using at
least two different methods or instruments.
Altogether nearly 3000 single measurements of
the lactate concentration in blood or plasma
samples were carried out.
MET H ODS
Enzymatic photo¯uorometry
S U B J E C T S , EX P E RI M E N T S A N D
ME THODS
Subjects
Healthy young to middle-aged trained men
and women served as subjects in these experiments. All were told that they were serving as
volunteers in our experiments. They were also
told that they were free to leave at any stage
and that they could do so without giving any
reason.
Experiments
Most of the exercises were carried out as
bicycling on ergometers. Blood samples were
A volume of 25 or 50 ml of whole blood or
plasma was taken by Acupette capillary tubes
(P4518-50, Dade Diagnostics Inc., Puerto Rico,
USA; according to the manufacturer the
accuracy of the tubes' volume is better than
0.5% and the coef®cient of variation better than
1%). The ¯uid was transferred to a tube
containing 500 ml of 0.4 mol L21 perchloric
acid (PCA) that lyzes the red blood cells and
thus frees lactate inside the cells. These tubes
were stored frozen at 220³C until later analyses
of the lactate concentration by a method
according to Passoneau and Lowry [4], which
uses the increase of NADH concentration in the
LDH reaction (lactate dehydrogenase, EC
1.1.1.27; from beef hearts, L2625 type III
Blood lactate measured by different instruments
from Sigma, St. Louis, MO, USA). Pyruvate produced was further processed by the
glutamate-pyruvate
transaminase
reaction
(l-alanine:2-oxoglutarate aminotransferase, EC
2.6.1.2; from swine heart, Boehringer Mannheim GmbH, Mannheim, Germany), thus
allowing almost complete processing of all
lactate in the sample. The ¯uorescence was
read off in an RF-5000 spectro¯uorophotometer (Shimadzu, Kyoto, Japan) at 460 nm
(652 THz) after 45 min incubation at 23.5³C.
For each analysis, a new second-order
standard curve covering the whole range of
¯uorescence values was made. The error of
regression (scatter around the regression line,
the statistical error in reading off from the
standard curve) was 0.1 ± 0.2 mmol lactate L21
blood (or plasma). A standard solution of
1.00 mol lactate L21 (L-lactat(e) standard
125 440, batch 66762401 from Boehringer Mannheim) was used for making the samples for the
standard curve. The total imprecision of the
method is 0.1 ± 0.3 mmol L21, depending on
the lactate concentration in the measured
sample. The volume fraction of water in
whole blood was taken as 84% and that of
plasma as 94% [5].
Since we found systematic differences
between the results given by the tested methods
and our reference method, the standard solution
from Boehringer Mannheim was calibrated
independently by an enzymatic reaction similar
to that described above [4]. The increase in the
NADH concentration was read off in a
Shimadzu MPS-2000 spectrophotometer at
340 nm (882 THz) in quartz cuvettes (type 18B, Starna, Essex, UK), where the light traversed
10.00 mm. The lactate concentration was taken
from the measured increase in the NADH
concentration using a coef®cient of extinction of
NADH of 6270 m21 mol21. These measurements showed that the lactate concentration of
the standard solution did not differ from the
reported value, and the imprecision (SE) in this
calibration was 1%. That imprecision was
included when we examined whether there
was a systematic difference between a tested
instrument and the reference method. Otherwise
the possible error in the reference method is
considerably less than the systematic deviations
given later and is thus regarded in this study as
without signi®cance.
369
YSI instruments
The lactate concentration in samples of 25 ml
was measured on an YSI 23L (Yellow Springs
Instruments, Yellow Springs, OH, USA) on
non-hemolyzed blood and on plasma samples.
Further blood analyses were done on ®ve YSI
1500 instruments on either hemolyzed or
unhemolyzed 25 ml blood samples. All YSI
instruments were calibrated by 5 mmol lactate
L21 solutions (YSI 2327). As an additional
control, a standard solution of 15 mmol lactate
L21 was used (YSI 2328); on some occasions we
also used a 30 mmol L21 solution (YSI 1530).
In accordance with the instruments' manuals,
we required that readings with these solutions
gave 5.0¡0.1 mmol L21, 15.0¡0.7 mmol L21
and 30.0¡1.5 mmol L21, respectively, before
any analyses could be carried out.
YSI instruments assume that a known and
constant amount of blood is used for each
measurement, and the instruments are equipped
with two types of pipettes; one with a needle
(YSI 1501 syringepet) and one using capillary
tubes (YSI 1502 pipette). In agreement with the
manufacturer's instructions we used the same
pipette for both the calibrations and the
subsequent measurements. When analyses
were done on more than one YSI instrument
per day, the same syringes and calibration
solutions were used for all instruments, and all
instruments were in addition handled by the
same operator.
In blood, the lactate is found in both plasma
and the red blood cells; and in most cases <75%
of the lactate in blood is found in the plasma
compartment [1, 2]. According to the manuals
of the YSI instruments, only lactate in plasma
is measured unless the blood samples are
hemolyzed.
Dr. Lange miniphotometer LP8z
Blood was taken using 10 ml end-to-end
capillaries and placed in a reagent solution
hemolyzing the blood; lactate was processed in
a reaction producing quinonimin in proportion
to the amount of lactate in the sample, and the
concentration of quinonimin was read off in an
LP8z apparatus (Dr. Bruno Lange GmbH,
Berlin, Germany) at 540 nm (576 THz) after a
3 min reaction time.
370
J. I. Medbù et al.
Lactate Pro
The lactate concentration has been measured
in blood and plasma samples on altogether
seven different LT-1710 Lactate Pro2 analyzers
(Arkray Factory Inc., KDK Corporation,
Shiga, Japan). This instrument measures lactate
on a tiny drop of 5 ml of ¯uid. The lactate
concentration is read off after 60 s. For our
measurements we used strips with production
numbers L8D04A (F-4) and L8L07B (F-7).
Accusport
The blood lactate concentration was measured on two different Accusport1 portable
lactate analyzers (type 1488767, Boehringer
Mannheim). A drop of no less than 15 ml of
blood is applied to the strip [6], and 60 s later
the lactate concentration is read off. In
accordance with the manufacturer's instructions
we checked the ``window'' on the underside of
each strip after each analysis and examined the
coloring; if uneven, the analysis was rejected.
We also checked that enough blood was added
to each strip: When blood is added, some of it
penetrates the surface and thus reaches chemicals that start the reactions processing the
lactate. We required that there should be
liquid blood on the top of the strip's pad
after each analysis. Otherwise the result was
rejected. We thus used 25 ± 50 ml of blood for
each analysis. Blood was added to the strip by
letting it drip from a ®nger, and, in accordance
with the instrument's instructions, we never let
the ®nger touch the strip's pad.
This instrument only measures the lactate in
plasma; according to the manufacturer, built-in
equations calculate the concentration in whole
blood from the measured value in plasma [7].
For our measurements we used strips from
Boehringer Mannheim with the code number
512.
In concurrence with the instructions for each
instrument, all measurements for all instruments were carried out by experienced test
leaders who had each done at least a thousand
analyses of the blood lactate concentration.
Measurements at simulated altitude
Control solutions from Boehringer Mannheim (article no. 1447335) with a reported
lactate concentration of 3.6 mmol L21 (low;
BM-control-Lactate 1) and 9 mmol L21 (high;
BM-control-Lactate 2) were measured in a
chamber where the O2 pressure was less than
10 kPa, corresponding to an altitude of more
than 6 km above sea level. In practice, N2 gas
was led into a bag serving as the chamber. The
O2 pressure in the bag was measured using a
Metamax 1 O2 analyzer (Cortex Biophysic
GmbH, Leipzig, Germany), and no analysis
was done unless the O2 pressure was less than
10 kPa. Each standard solution was measured
at least 10 times with each of the Lactate Pro
and Accusport instruments. As a control, the
same control solutions were measured at least
10 times in normal laboratory conditions, that
is, at a temperature of 22¡1³C and an air
pressure of <100 kPa, corresponding to an O2
pressure of <21 kPa.
Measurements in the cold
Each of the control solutions from Boehringer Mannheim (3.6 and 9 mmol L21 nominal
lactate concentration) was measured at least 10
times on the Lactate Pro and Accusport
instruments in a freezing storage room, that
is, at a temperature of 221¡1³C. The test
leader wore a thick sweater and coat. To shield
the instruments as much as possible from the
cold, the test leader wore a bag under the
sweater and thus close to the body. While
the strip was inserted into the instrument and
the control solution was applied to the strip,
actions that took 20 ± 30 s, the instrument and
the strip were exposed to the cold. As soon as
the analysis started, the instrument was placed
in the bag and was thus no longer exposed to
the cold. The instrument and the strips lay in
the bag between each analysis too. The
temperature in the bag was measured with a
digital thermometer. It appeared that repeated
opening and closing of the bag lowered the
temperature, and if it dropped to z5³C or
lower the experiments were stopped.
Statistics
The values are given as means¡SD unless
otherwise stated explicitly. Different instruments or methods were compared by linear
regression using the approach geometric mean
that gives equal weight to errors in both series
Blood lactate measured by different instruments
of measurements [8, 9]; standard linear regression assumes that all error or imprecision is
caused by measurements of the ordinate (Y).
For the regression analyses carried out here the
approach geometric mean gives the same results
as a more demanding, robust, and distributionfree approach [10]; the method of Bland and
Altman [11] also gives corresponding results for
our data. If two instruments or methods differ
systematically, the slope will differ from 1.00,
and the data points will not be randomly
distributed around the line of identity. Thus,
possible differences were tested by examining
the residual and by standard t-tests on the
slope. As stated above, we also kept in mind the
fact that our reference method may have had a
systematic error of <1% (SEM). The error of
regression (scatter around the regression line) is
used as a measure of the random errors.
Different errors of regression were tested by
Fisher tests [12].
Errors can occur in all measurements. When
measurements with two methods or instruments
turn out as expected, the values will fall close to
a line. If there is something wrong with one of
the measurements, the corresponding point will
deviate from the linear relationship. A simple
scatterplot alone cannot be used to decide
whether the deviation seen is due to an error
in the abscissa (X) or in the ordinate (Y). For a
number of the samples analyzed here each
sample was measured using at least three
different instruments or methods, here called
X, Y and Z. If a point appears as an outlier in
the XY plot and the YZ plot but not in the XZ
plot, it is likely that the deviation is caused by
an error in the Y measurement. We used this
principle to unravel possible errors of measurements and outliers.
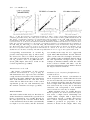
RES UL TS
Blood samples were taken during different
experiments, and the blood lactate concentration
was measured using at least one of the
instruments to be tested (Y) and in addition
by enzymatic photo¯uorometry (X) serving as
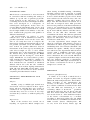
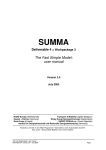
our reference method (Fig. 1).
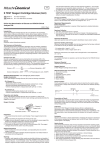
Non-hemolyzed blood samples measured on
the YSI 23L showed on average a 22% lower
value than the reference method (pv0.001; Fig.
1A). Since the YSI 23L does not hemolyze the
371
blood, it does not record lactate in the red
blood cells, and this may have caused the
systematic deviation. Hemolyzed blood samples
were measured on two different YSI 1500, here
referred to as the YSI 15001 and the YSI 15002.
The values from the YSI 15001 were on average
20% higher than those of the reference method
(pv0.001). For the YSI 15002 the values were
on average 5% higher than those of the
reference method; these latter values did not
deviate signi®cantly from the line of identity
(Fig. 1B, C).
Blood samples were also measured on three
different simpler instruments. The values from
the LP8z were on average 26% higher than
those of the reference method (pv0.001; Fig.
1D). These measurements also showed a larger
error of regression than the others (pv0.05).
The relationship to the reference method was
convex, and a second-order curve ®t was better
than a linear one (pv0.001). Values from
measurements on the Lactate Pro were on
average 12% higher than those from the
reference method (pv0.001; Fig. 1E). For all
of the instruments mentioned so far, all the
regression lines found lie close to the origo. This
means that possible systematic errors in the
measurements were small for low blood lactate
concentrations and rose roughly proportional
to the lactate concentration. The Accusport
showed two kinds of deviations. First the Yintercept was close to 1.0 mmol L21 (pv0.001
versus an intercept of 0.0). In line with this, the
instrument reported blood lactate concentration
around 2 mmol L21 even for blood samples
taken at rest, that is, in samples with a true
concentration less than 1 mmol L21. The slope
found for this instrument was 0.81, which is
considerably less than 1.00 (pv0.001). Thus,
this instrument showed correct values for blood
samples with a lactate concentration of
<5 mmol L21. For samples with less lactate
the reported values were systematically too
high, while for samples with higher concentration the reported values were too low.
When the so-called ``blood lactate threshold''
is sought in sports testing, particularly interesting is the performance of the instruments at low
to moderate blood lactate concentrations. The
same is true for most clinical testing. Therefore
blood samples with a lactate concentration
above 6 mmol L21, as measured by enzymatic
photo¯uorometry, were left out and the remain-
372
J. I. Medbù et al.
FIG. 1. The blood lactate concentration measured by enzymatic photo¯uorometry (X) and by six different
instruments (Y). The samples measured by the YSI 23L (panel A) were on non-hemolyzed blood, and these
measurements do not record lactate inside the red blood cells. YSI 15001 and YSI 15002 (panels B and C)
refer to measurements on two different YSI 1500 instruments. LP 8z (panel D) is a lactate analyzer from
Dr. Lange, Lactate Pro (panel E) is from Arkray in the KDK Corporation, while Accusport (panel F) is
from Boehringer Mannheim. Data on the regressions are given for each set of data, and the regression lines
are shown as solid lines. SY|x is the error of regression and is expressed in mmol L21. Sb is the error of the
slope. The thin dashed lines show the lines of identity for each set of data. . refers to accepted measurements, while # refers to outliers that were formally rejected because of an error of measurement with the
instrument examined; these values were therefore not used to calculate the regression lines.
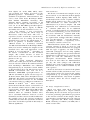
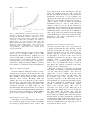
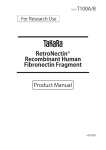
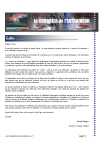
ing data from Fig. 1 were reanalyzed (Fig. 2).
For the YSI 23L the relationship for this
reduced data set is largely the same as for the
full set (Fig. 2A). Thus, also within this range of
values the YSI 23L showed values that were too
low. The error of regression was roughly half
that found for the full data set. Hemolyzed
blood samples measured on the YSI 15001
showed average values 13% too high (pv0.001),
while for YSI 15002 there was no sign of a
systematic deviation (Fig. 2B, C).
The values from LP8z were on average 25%
too high (pv0.001; Fig. 2D). The error of
regression found for this instrument was about
twice that found for the other instruments
(pv0.001). The Lactate Pro showed no systematic deviations from the reference method
for samples with a blood lactate concentration
less than 6 mmol L21 (Fig. 2E). For the
instruments mentioned so far, the systematic
errors were less in both absolute and relative
terms for samples with less than 6 mmol lactate
L21 blood than for samples covering a larger
span. The values from measurements by the
Accusport were systematically higher than those
from the reference method (pv0.001; Fig. 2F).
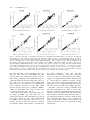
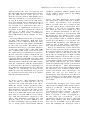
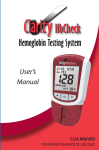
The LP8z showed a larger variability than
the other instruments (see Figs 1 and 2). We
therefore took three parallel measurements on a
number of blood samples with this instrument.
The median of each measurement was related to
measurements with the reference method (Fig.
3A). This approach did not give considerable
better values than single measurements as
judged from the errors of regression in Figs
1D and 3A.
Blood lactate measured by different instruments
373
FIG. 2. The blood lactate concentration measured by enzymatic photo¯uorometry (X) and by six different
instruments (Y). The data are the same as in Fig. 1, but only samples with a blood lactate concentration less
than 6 mmol L21 as measured by enzymatic photo¯uorometry are included. The samples measured by the
YSI 23L (panel A) were on non-hemolyzed blood, and these measurements do not record lactate inside the
red blood cells. YSI 15001 and YSI 15002 (panels B and C) refer to measurements on two different YSI 1500
instruments. LP 8z (panel D) is a lactate analyzer from Dr. Lange, Lactate Pro (panel E) is from Arkray in
the KDK Corporation, while Accusport (panel F) is from Boehringer Mannheim. Data on the regressions are
given for each set of data, and the regression lines are shown as solid lines. SY|x is the error of regression
and is expressed in mmol L21. Sb is the error of the slope. The thin dashed lines show the lines of identity
for each set of data. . refers to accepted measurements, while # refers to outliers that were formally rejected
because of an error of measurement with the instrument examined; these values were therefore not used to
calculate the regression lines.
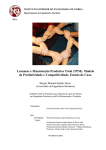
We did further comparisons of measurements
on unhemolyzed blood samples measured using
the YSI 15002 and the Lactate Pro. The values
found with the YSI 15002 were on average 67%
of those found with the Lactate Pro (Fig. 3B).
Correcting for a 12% bias in the values from the
Lactate Pro (see Fig. 1E) suggests that on nonhemolyzed blood the YSI 15002 gives values
25% less than the true value of whole blood.
For a further evaluation of the YSI 1500,
blood samples were measured using three
other instruments, here called YSI 15003, YSI
15004, and YSI 15005, and by the Lactate Pro
(Fig. 3C). The values given with these three YSI
1500s did not differ systematically, but for a
given value as measured by the Lactate Pro they
gave a 13% higher value than the instrument we
called YSI 15002.
The instruction manual gives no information
on how the Lactate Pro re¯ects lactate in the
red blood cells and how it responds to plasma.
Therefore plasma from blood samples taken
after intense bicycling was measured by enzymatic photo¯uorometry and by the Lactate Pro.
For samples with a lactate concentration less
than 10 mmol L21 the Lactate Pro responded
as for blood samples, that is, the values found
by the Lactate Pro were up to 10% higher than
those of the reference method. For samples with
a higher plasma lactate concentration the curve
leveled off, which means that the Lactate Pro
showed too low values (not shown).
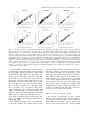
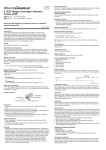
Measurements at simulated altitude
The lactate concentration in two control
solutions was measured in a chamber with an
O2 pressure less than 10 kPa, corresponding to
that found at an altitude of more than 6 km
above sea level. The values were compared with
374
J. I. Medbù et al.
FIG. 3. A. The blood lactate concentration measured on LP8z versus corresponding measurements using
enzymatic photo¯uorometry. The value given for the LP8z is the median of three parallel measurements. B.
The lactate concentration measured on non-hemolyzed blood samples on the YSI 15002 apparatus versus
measurements with the Lactate Pro. . shows accepted measurements. # shows measurements that were
rejected because of an incorrect measurement with the instrument examined and therefore not used in calculating the regression parameters. C, the lactate concentration measured on non-hemolyzed blood samples on
the YSI 15003 (.), YSI 15004 (e) and YSI 15005 (¨) instruments versus measurements using the Lactate
Pro. Regression data are given for each set of data, and the regression lines are shown as solid lines. SY|x is
the error of regression and is expressed in mmol lactate L21 blood. Sb is the error of the slope. The thin
dashed lines are the lines of identity. The thin long-dashed line in C is a copy of the regression line in B.
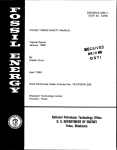
corresponding measurements at normal O2
pressure and temperature (Fig. 4). The Lactate
Pro showed no effect of reduced O2 pressure.
The values found with the Accusport at reduced O2 pressure were 1.85¡0.08 mmol L21
(mean¡SD) higher than those found in the
control experiments (pv0.001).
Measurements in the cold
The lactate concentration of the control
solutions was measured at 221¡1³C (Fig. 4).
The instruments were exposed to the cold while
a strip was inserted and the control solution was
applied to the strips. Otherwise the instruments
were well shielded from the cold. The mean
values did not differ from those of the control
experiments (pw0.5 for each instrument), but
the random variations were larger (pv0.01).
DISCUSSION
The main results in this study are ®rst that for
all the instruments examined the reported blood
lactate concentration rose roughly linearly by
the value given by the reference method. Most
of the instruments showed either systematically
too high or too low values, and the deviations
were mainly in the range 10 ± 25%. Apparently
equal YSI 1500 instruments showed different
values on the same blood samples. Lactate Pro
gave reliable results at simulated altitude and in
the cold experiments. Accusport gave too high
readings at simulated altitude, while the values
in the cold were reliable. The LP8z was the
most biased instrument and in addition showed
the largest random variations.
Evaluation of the enzymatic photo¯uorometry
method used here
We measured the lactate concentration in
blood and plasma by a method that has been in
use for more than 30 years in numerous studies.
It is common knowledge that the ¯uorescence
from a sample with a known lactate concentration varies from day to day due to interassay
variations, and consequently a new standard
curve is made for each day of analysis.
While standard curves are usually ®tted by
linear regression, we used second-order regression. First, a slight curved relationship was
readily visible; samples with a high lactate
concentration showed a smaller ¯uorescence
than a linear extrapolation dictates. Second,
NADH is produced in proportion to the
amount of lactate in the sample. There may
Blood lactate measured by different instruments
375
FIG. 4. The lactate concentration of two control solutions from Boehringer Mannheim with a nominal lactate concentration of 3.6 and 9 mmol L21 as measured by the Lactate Pro and the Accusport in control
experiments at room temperature and normal air and O2 pressures at room temperature but with an O2 pressure below 10 kPa and at normal air and O2 pressures but at 221¡1³C.
be a <5% quenching of the signal in a cuvette
with a NADH concentration of 10 mmol L21
[4], and since the effect is proportional to the
concentration a parabolic relationship is
expected. Finally, in samples with a high lactate
concentration, 1 ± 2% of the lactate in the
sample may not be processed [4]. This latter
effect, although quantitatively less important,
will add further curvature to the standard
curve. There is no reason to assume that our
use of second-order curve ®ts has caused the
possible non-linear trends in Fig. 1, since the
second-order component of our standard curves
was small and in addition tended to reduce
rather than increase non-linearities.
We used a commercial 1.00 mol lactate L21
stock solution to establish the standard curve,
and separate laboratory controls showed that
the concentration of this stock solution was
accurate within 2% (95% con®dence interval) of
the control analyses. A possible bias of less than
2% or random variation less than 0.3 mmol L21
of our reference method has no in¯uence on the
conclusions drawn in this study.
Do differences between instruments matter?
When the same sample was measured on two
different instruments or by two different
methods, we found differences of between
10% and 25%. To examine how this may have
affected the so-called blood lactate threshold,
that entity, here taken as the exercise intensity
giving a blood lactate concentration of
3.00 mmol L21, was established for one subject
during bicycling at 1.5 Hz and found to be
3.42 W kg21 (Fig. 5). To each measured lactate
concentration we added (and subtracted) 10%
and 25%, which caused the 3.00 mmol L21
``threshold'' to appear at 2% and 5% lower
(higher) powers, respectively. Systematic differences of that magnitude may be important
when judging possible changes for an athlete.
Thus, for precise testing of possible changes by
time, instruments known to have similar
properties should be used.
There are other de®nitions of the lactate
threshold. For blood lactate concentrations
higher than 3 mmol L21 the curve is steeper,
and if for example the ``4 mmol L21 threshold''
is used, systematic differences between instruments have less effect. For lower lactate
concentration the curve is less steep, and
small variations in the measured value will
have a larger effect on the reported threshold.
For long-distance running, bicycling and skiing
the intensity corresponding to a blood lactate
concentration of 2 mmol L21 may be of inter-
376
J. I. Medbù et al.
FIG. 5. Measurements of the blood lactate concentration by stepwise increments of the power during
bicycling (. and thick solid line). Each step of constant power lasted 5 min, and a 1 min rest separated
each step to allow blood sampling and setting a
higher power. To each measured value, ®rst 10%
(thin dashed-dotted lines) and 25% was added and
subtracted (thin dashed lines). The dotted line
shows the level of 3.00 mmol L21, and the power
corresponding to that value is here taken as the
``lactate threshold''.
est. We found that the Accusport showed this
value even on samples taken at rest. This
instrument should therefore perhaps not be
used for that kind of testing. It has also been
proposed that an intensity giving a lactate
concentration of rest value plus 1.5 mmol L21
should be sought [13]. That de®nition could be
less sensitive to variations between instruments.
Effect of simulated altitude
Control solutions with given lactate concentrations were measured on the Lactate Pro and
the Accusport when the O2 pressure was less
than 10 kPa, corresponding to that found at
altitudes above 6 km. Readings with the
Lactate Pro were not affected by the reduced
O2 pressure, suggesting that this instrument
may be well suited for testing at altitude. The
Accusport reported too high values in our
measurements. Our measurements do not allow
us to conclude how this instrument will behave
at the O2 pressures of altitudes of 1500 ± 3000 m
that are more typical of athletes in training.
Measurements in the cold
According to the manufacturers, the Lactate
Pro and the Accusport may both be unreliable
for testing at temperatures below z10³C. Our
data suggest that if the instruments and the
strips are shielded from the cold, except for
the 20 ± 30 s when the strips are inserted in the
instrument and blood or test solutions are
applied to the strips, the reported values are not
affected by surrounding temperatures down to
220³C. Thus, both of these pocket-sized
instruments may be just as well suited to
outdoor testing as for use in the laboratory.
Admittedly, the variations in the measurements
being larger in the cold was probably caused by
technical problems, since it was more dif®cult to
add a drop of the test solutions from the nipple
of the ¯asks than to add a drop of blood from a
®ngertip to the strips, particularly for the
Lactate Pro in the cold.
Evaluation of the different instruments
Common comments. The error of regression is
a simple and usually the best measure of how
well the model ®ts the data. In Fig. 1 the
random variations rise by the lactate concentration, and the reported error of regression
in that ®gure is a mean of the error at low
and high concentrations. In Fig. 2, where only
samples with a concentration less than
6 mmol L21 are included, the error of regression is less, and within the range of data in
that ®gure the random variations seem independent of the concentration.
With the exception of the data on the YSI
23L (Figs 1A and 2A), parallel measurements
``on the same blood sample'' were done by
taking two or more samples from the same
®nger in sequence, that is, 10 ± 30 s apart, and
in random order. The reported error of
regression depends on the imprecision in the
measurements by enzymatic photo¯uorometry
(X), in the instrument examined (Y), and in
possible variations between blood samples
taken some seconds apart. The error of
regression was least for the YSI 23L. It is
likely that the slightly larger errors found for
the YSI 1500s, the Lactate Pro and the
Accusport are a consequence of small variations
between blood samples rather than less precise
measurements by these instruments. Statistical
considerations suggest that the random error of
measurements with each of these three instruments is roughly half of the reported errors of
regression in Figs 1 and 2.
Blood lactate measured by different instruments
YSI instruments. We used one YSI 23L and
®ve YSI 1500s. On non-hemolyzed blood samples the YSIs showed values 20 ± 25% less
than the reference method. This ®nding agrees
with data of Foxdal et al. [14] and Lormes et
al. [15]. It is clearly stated in the YSI instrument user manual that if unhemolyzed blood
is measured lactate in the red blood cells is
not recorded. It is well known that, after a
few minutes of equilibration, around 25% of
the lactate in blood is found in the red blood
cells [e.g. 1, 2]. Thus, one must expect too
low apparent blood lactate concentrations
when unhemolyzed blood samples are measured.
We did parallel measurements on two different YSI 1500 instruments. Both had fresh
membranes, were calibrated using the same
solutions and by the same pipette and handled
by the same test leader. Nevertheless, these
instruments showed a 12% systematic difference
on the same samples. Three other YSI 1500s
were examined and tested versus the Lactate
Pro, which showed a systematic but reproducible bias versus the reference method and was
therefore regarded suitable as a control when
comparing different YSI 1500s. These three YSI
1500s showed a larger lactate concentration in
unhemolyzed blood than the YSI 15002, judging
from the comparisons with the measurements
by the Lactate Pro. We have no explanation for
why different YSI instruments gave different
results in our experiments. As stated in the
Methods section, the instruments were operated
by experienced test leaders and in accordance
with the instruction manual.
Dr. Lange's LP8z. This instrument showed
values 25 ± 30% too high, and the error of
regression was nearly twice that of the others.
Using the median of three parallel measurements did not reduce the random error much.
This instrument costs about the same as the
Lactate Pro and Accusport and only 10 ± 15%
of that of an YSI 1500. Apart from the lower
price than for an YSI 1500 we see no advantage with this instrument compared to the
others. This instrument performed less well
than the others. It was more dif®cult to use
in terms of handgrips (caps repeatedly off and
on), to obtain precise measurements (®ll the
377
capillaries completely without spilling blood
on the outside), and in terms of not mixing
samples in larger series.
Lactate Pro. This instrument showed little
bias when blood samples with low to moderate lactate concentrations were measured,
while it recorded values 12% too high on samples with a blood lactate concentration above
10 mmol L21. We saw no systematic difference when the same blood sample was analyzed on different instruments of this type.
The random variations in measurements with
the Lactate Pro were similar to those of the
YSI instruments and the Accusport. Lactate
Pro gave reliable results at simulated altitude
and in the cold. Shimojo et al. [16] have also
examined this instrument, and although they
found no bias at high lactate concentration,
their random variation was larger than ours.
There is no information on how this instrument accounts for lactate in the red blood cells.
If it measures lactate in plasma only and adds
an assumed value for the lactate in the red
blood cells, one would expect too high a reading
when ¯uids without red blood cells are measured. Measurements of the lactate concentration in plasma samples and in control solutions
(not shown) with Lactate Pro gave reliable
results for solutions with a lactate concentration
less than 10 mmol L21. Thus, this instrument
must lyze the red blood cells and thus measures
the cell lactate. For non-blood ¯uids with a
lactate concentration above 10 mmol L21 the
Lactate Pro gave too low values in our
measurements. This instrument may therefore
not be suitable for use when ¯uids other than
blood are analyzed and the lactate concentration is high.
Accusport. The Accusport gave correct values
only for blood samples with a lactate concentration of <5 mmol L21. Even for blood samples taken at rest and with a known
concentration less than 1 mmol L21 the Accusport reported values around 2 mmol L21.
When it reported a value of 3.0 mmol L21,
the true value was <2.5 mmol L21 in our
experiments, and that error may be important
when testing athletes. Our data suggest that
there may be an inbuilt error in this instrument. On examining the Accusport versus a
378
J. I. Medbù et al.
reference method, Roûkopf et al. [17] did not
®nd the bias that we registered, but their
random errors were considerably larger than
ours.
Two different Accusport instruments gave
similar results when the same blood samples
were measured. The instrument did not work
adequately at simulated altitudes above 6 km,
but it did work well in our cold experiments.
The Accusport was more dif®cult to use than
the Lactate Pro, and we got a number of
incorrect measurements with it. Some errors
could be excluded on grounds of uneven
coloring seen through the ``window'' on the
underside of the strip or too little blood applied,
but we also experienced errors that could not be
detected without comparisons with other analyses. Several measurements were lost because
we accidentally hit the on/off-button when the
analysis was started by closing the cover. We
had technical problems with both instruments.
One reported ``low battery'' and stopped working even when new batteries with the proper
voltage were used. The other one could not read
the code on the strips used, even when the
instrument's window was properly cleaned.
Switching batteries and strips between the two
instruments showed that the problems lay in the
instruments and not in the strips or batteries.
S U M M A R Y A N D C O N C L U S IO N S
Different instruments gave different values
when the lactate concentration of a blood
sample was measured. The differences were
usually in the range 10 ± 25%, and a bias of this
amount may have some effect when athletes are
tested. Of the four instruments examined the
Lactate Pro was best. The Lactate Pro cost only
<15% of an YSI 1500 and is much easier to use.
Different YSI instruments gave different values.
The LP8z was inferior to the others. Both
Lactate Pro and Accusport can be used for
outdoor testing in the cold. Lactate Pro can also
be used for testing at altitude.
ACKNOWLEDGMENT
We are grateful to Jorid Thrane Stuenñs for her
skilled technical assistance.
REFERENCES
1 Smith EW, Skelton MS, Kremer DE, Pascoe DD,
Gladden LB. Lactate distribution in the blood
during progressive exercise. Med Sci Sports Exerc
1997; 29: 654 ± 60.
2 Medbù JI, Hanem S, Noddeland H, Jebens E.
Arterio-venous differences of blood acid-base
status and plasma sodium caused by intense
bicycling. Acta Physiol Scand 2000; 168: 311 ± 26.
3 Westgren M, Divon M, Horal M, Ingemarsson I,
Kublickas M, Shimojo N, NordstroÈm L. Routine
measurements of umbilical artery lactate levels in
the prediction of perinatal outcome. Am J Obstet
Gynecol 1995; 173: 1416 ± 22.
4 Passoneau JV, Lowry OH. Enzymatic analysis.
Humana Press, Totowa, New Jersey; 1993.
p. 188 ± 93.
5 Siggaard-Andersen O. The acid-base status of the
blood. Munksgaard, Copenhagen. 4th ed. 1976. p. 79.
6 Gambke B, Berg A, Fabian K, Francaux M,
Haber P, Hartman U, Kamber M, Lormes W,
Rosskopf P, Schwarz L. Multicenter evaluation of
a new portable system for determining blood
lactate. In: Ramstetter E, Zieres-Nauth C, Mack
M, editors. Workshop Report Accusport1. ZuÈrich
1994. Boehringer Mannheim; 1995. p. 29 ± 32.
7 Emmert J. Analytical requirements for the measurement of lactate. In: Ramstetter E, ZieresNauth C, Mack M, editors. Workshop Report
Accusport1. ZuÈrich 1994. Boehringer Mannheim;
1995. p. 26 ± 8.
8 Riggs DS, Guarnieri JA, Addleman S. Fitting
straight lines when both variables are subject to
error. Life Sci 1976; 22: 1305 ± 60.
9 Brace RA. Fitting straight lines to experimental
data. Am J Physiol Integrative Comp Physiol 1977;
233: R94 ± R99.
10 Passing H, Bablok W. A new biometrical procedure for testing the equality of measurements from
two different analytical methods. J Clin Chem Clin
Biochem 1983; 21: 709 ± 20.
11 Bland JM, Altman DG. Statistical methods for
assessing agreement between two methods of
clinical measurements. Lancet 1986; i (8476):
307 ± 10.
12 Owen DB. Handbook of statistical tables. Reading, MA: Addison-Wesley; 1962. p. 63 ± 87.
13 Helgerud J, Ingjer F, Strùmme S. Sex differences
in performance-matched marathon runners. Eur J
Appl Physiol 1990; 61: 433 ± 9.
14 Foxdal P, Bergqvist Y, Eckerblom S, Sandhagen
B. Improving lactate analysis with the YSI 2300
GL: hemolyzing blood samples makes results
comparable with those of deproteinizing whole
blood. Clin Chem 1992; 38: 2110 ± 4.
15 Lormes W, Steinacker JM, Stauch M. Lactate
determination with the Accusport1 system and a
fully enzymatic photometric method in an incremental stage test and in prolonged exercise. In:
Ramstetter E, Zieres-Nauth C, Mack M, editors.
Workshop Report Accusport1. ZuÈrich 1994.
Boehringer Mannheim; 1995. p. 37 ± 41.
Blood lactate measured by different instruments
16 Shimojo N, Naka K, Uenoyama H, Hamamoto
K, Yoshioka K, Okuda K. Electrohemical assay
system with single-use electrode strip for measuring lactate in whole blood. Clin Chem 1993; 39:
2312 ± 4.
17 Roûkopf P, Lamprecht W, Liesen H. The Accusport1 analyzer and its operation. In: Ramstetter
379
E, Zieres-Nauth C, Mack M, editors. Workshop
Report Accusport1. ZuÈrich 1994. Boehringer
Mannheim; 1995. p. 33 ± 6.
Received: 29 February 2000
Accepted: 10 May 2000